
Abstract
Quantum dots (QDs) are attractive systems for potential applications in future solar energy technologies, due to their optical properties which are tunable as a function of size and composition. In this study, we synthesized PbS QDs with first excitonic peak in the range 1060 to 1300 nm using a PbCl2/sulfur molar ratio of 10:1. The first excitonic absorption peak from 1300 to 950 nm of the PbS/CdS core/shell QDs can be further synthesized via the cation exchange approach. Our method resulted in high quantum yield, good stability, monodisperse QD solutions with a full surface coverage by excess Cd cations. In addition, we used our core/shell QDs in a photoelectrochemical cell for hydrogen generation. This heterostructure exhibited a saturated photocurrent as high as 3.3 mA cm−2, leading to ∼29 ml cm−2 d−1 hydrogen generation, indicating the strong potential of our core/shell QDs for applications in water splitting.
Export citation and abstract BibTeX RIS
1. Introduction
Photoelectrochemical (PEC) solar-driven water splitting is considered as a promising approach which simultaneously combines renewable energy conversion and storage [1–3]. Currently, the solar to H2 conversion efficiency is limited by the absorption spectrum of various semiconducting photosensitizers including ultraviolet (UV)-light-active metal oxide (for example, TiO2 and ZnO) [4–7]. Recently, quantum dots (QDs) have been studied extensively as very attractive systems [8] for several technologically relevant applications [9–18] such as photocatalytic hydrogen production [14] and solar cells [15–18] (among others) due to their exceptional size-dependent optical properties [19–26]. In the above mentioned application in water splitting, it is desirable to use high quality QDs presenting narrow size distribution, high quantum yield (QY) and good photostability, obtained by well-controlled, environmentally friendly, large-scale colloidal synthesis approaches with low cost and non-toxic precursors [19]. Typically, high quality PbS QDs can be synthesized via a hot injection approach [27, 28]. To date, most published work on PbS or PbS/CdS core/shell QDs for optoelectronic applications (such as e.g. water splitting) relied on synthetic routes involving bis (trimethylsilyl) sulfide (TMS) [25, 26, 29–32]. Such types of syntheses present several drawbacks: they are very costly, unstable and have to be handled in inert atmosphere, inside a glove box [33]. For these reasons, alternative strategies to produce low cost and environmentally friendly PbS QDs represent a promising path for significant advances in the synthesis of PbS QDs. In this respect, the use of S can enable an innovative synthesis process to obtain high quality PbS QDs. One possibility is to use the solvent-less PbCl2-S-oleylamine (OLA) [33]. However, generally, S is not very active in this kind of process, leading to limitations in the QD size that can be obtained through this method (first excitonic peak >1200 nm) [28]. This drawback largely affects their further application as the efficiency of charge separation and collection is mainly dependent on QD size [16, 22, 34]. The first excitonic absorption peak can be obtained as low as 900 nm by addition of trioctylphosphine, but which is highly unstable, toxic and expensive [35]. Highly monodisperse PbS nanocrystals using only S over a wide range of sizes (first excitonic peak between 1000 and 1800 nm) were recently synthesized without using size-selective precipitations [36]. However, a very high Pb/S ratio (as high as 24:1) was used to synthesize smaller sized QDs [36]. Such feature increases the synthesis cost and severely limits its potential towards inexpensive and large-scale applications. Most importantly, the PbS QDs synthesized via S without post-treatment are highly unstable, due to aggregation during purification and further storage, which limits the use of these QDs in practical applications. As a result, to date, only Yuan et al fabricated PbS solar cells by using exclusively elemental sulfur synthesis, obtaining large sized QDs (first-excitonic peak at 1240 nm, ∼4.1 nm) through a quite complex process, after post-size selection, organic ligands exchange and inorganic cadmium chloride treatment [33].
To produce stable PbS QDs by using only S with first-excitonic peak in the range of 950–1300 nm (which extends sunlight absorption in the NIR and maintains efficient charge transfer to wide bandgap oxides such as TiO2 and ZnO) [11, 37, 38] is very challenging. A promising solution consists in using core/shell structured QDs, which exhibit significantly enhanced QY (up to 60%) [39, 40]. In addition, the presence of the shell can isolate the core from the surrounding chemical environment, which makes QDs less sensitive to the environmental conditions, such as light, moisture and chemicals, thus largely improving the chemical, thermal and photochemical stability with respect to pure QDs [39, 40]. However, all the core/shell QDs used for solar energy harvesting/conversion so far were synthesized by using TMS-QDs as starting materials for core/shell synthesis [29–31], and there is no report for using this type of QDs for solar water splitting.
In this study, following the procedure reported by Cademartiri et al [28] by diluting both the concentration of lead and S precursor, we were able to synthesize PbS QDs with first excitonic peak in the range 1060–1300 nm with much lower Pb/S molar ratio (10:1). By further using the cation exchange approach, the first-excitonic absorption peak of the PbS/CdS core/shell QDs can be tuned from 1300 to 950 nm, which falls into the favorable energy range for H2 production [41]. Our method resulted in high-QY, good stability, monodisperse core/shell QD solutions. In addition, we applied our core/shell QDs in a PEC for hydrogen generation, whose anode was composed of a mesoporous TiO2 thick film sensitized by QDs through electrophoretic deposition (EPD). This PEC cell exhibited a saturated photocurrent as high as 3.3 mA cm−2, leading to 29 ml cm−2 d−1 hydrogen generation, thereby demonstrating the potential of our core/shell QDs for solar energy applications [4, 14].
2. Experimental section
2.1. Materials
Lead chloride (100%), sulfur (100%) and hexane were purchased from Fisher Scientific. OLA (technical grade, 70%), oleic acid (OA), ODE, hydrochloric acid cadmium nitrate (98%), zinc nitrate hexahydrate (98%), sodium sulfide, sodium sulfite, methanol, toluene, and ethanol were obtained from Sigma-Aldrich Inc. Titania paste was supplied by Dyesol (18 NR-T, Queanbeyan, Australia). All chemicals were used as purchased.
2.2. Synthesis of QDs
PbS QDs were synthesized by using OLA as ligands based on the modified procedure reported in [28]. Typically, 5 g of PbCl2 and 25 ml of OLA were loaded into a 50 ml three-neck flask at room temperature. The mixture was first purged by N2 for 45 min to remove oxygen and then heated to 160 °C to form the homogeneous PbCl2-OLA suspension. After 60 min, the PbCl2 solution was cooled down to 80 °C. 5 ml of solution of sulfur (55 mg) in OLA at room temperature were quickly injected into the PbCl2-OLA suspension under vigorous stirring and the reaction was allowed to continue at 70 °C for 1–30 min. Excess PbCl2 precursors were precipitated by centrifugation after adding acetone. Further purification of PbS QDs can be done with ethanol to completely remove the un-reacted precursors by repeated centrifugation and decantation.
PbS/CdS QDs with a thin shell were synthesized via a cation exchange method [34]. In a typical synthesis process, CdO (2.3 mmol), OA (2 ml) and ODE (10 ml) were heated to 255 °C under N2 flow for 20 min. The clear solution was cooled to 155 °C under vacuum for 15 min. The flask was then reopened and the N2 flux was restored. PbS QDs suspension in toluene (1 ml, absorbance = 3 at the first exciton peak) was diluted in 10 ml toluene, bubbled for 30 min and then immediately heated to 100 °C. The Cd/OA mixture was injected into the PbS QDs suspension. The reaction cell was quenched with cold water after the growth reaction was conducted at 100 °C for 1–120 min. The desired CdS shell thickness can be well controlled by varying the reaction temperature, and reaction time.
2.3. Preparation of QDs/TiO2 photoanode
The QDs/TiO2 photoanode was made by EPD [20]. Typically, QDs with core size of 3.3 nm and shell thickness of ∼0.2 nm were dispersed in toluene, with a pair of TiO2 FTO slides vertically immersed in the QDs solution and facing each other. A voltage of 200 V was applied for 120 min. To wash off unbound QDs after the EPD process, the samples were rinsed several times with toluene and dried with N2 at room temperature. The anode was further coated by only 2 cycles of ZnS or 4-cycle SILAR deposition of CdS and following 2 cycles of ZnS to improve stability [4].
2.4. Theoretical calculation of wave functions
To calculate the electron and hole wave functions, we solved the stationary Schrödinger equation in spherical geometry, in which we used the bulk values for the effective masses of electrons (me*) and holes (mh*), namely me* = 0.085 me and mh* = 0.085 me for PbS, and me* = 0.2 me and mh* = 0.7 me for CdS, where me is the electron mass at rest in vacuum [42]. The potentials for electrons and holes as a function of position were approximated as the lowest unoccupied molecular orbital and highest occupied molecular orbital levels, respectively, for the bulk materials [43]. For PbS, these levels are −4.5 and −4.91 eV, respectively, while for CdS they are −3.3 and −5.8 eV, respectively [42]. The interaction between electrons and holes was neglected in the calculations.
2.5. Characterization
Absorption spectra were acquired with a Cary 5000 ultraviolet (UV)–visible (Vis)-NIR spectrophotometer (Varian) with a scan speed of 600 nm min−1. The PL spectra were taken with a Fluorolog®-3 system (Horiba Jobin Yvon) using an excitation wavelength of 674 nm. QY was measured by using dye IR-125 as a reference. PL lifetime of QDs in toluene was measured using a pulsed laser diode of 636 nm and fast multichannel scaler mode in the Fluorolog®-3 system.
PbS QDs were also characterized by transmission electron microscopy (TEM) coupled with selected area electron diffraction (SAED). Low- and high-resolution TEM images were obtained using a JEOL 2100 F microscope. The powder x-ray diffraction (XRD) study of QDs at different temperatures in N2 atmosphere was carried out with a Philips X'pert diffractometer using a Cu Kα radiation source (λ = 0.154 18 nm). X-ray photoelectron spectroscopy (XPS) was performed using a VG Escalab 220i-XL equipped with an Al Kα source. The Pb/Cd ratio was measured by using inductively coupled plasma optical emission spectrometry (ICP-OES). The XPS data were analyzed by using Casa software. Fourier transform infrared spectroscopy (FT-IR) was used to verify the surface ligands of QDs.
The PEC performance of the photoelectrodes was evaluated in a three-electrode configuration, consisting of a QD-TiO2 thin film working electrode, a Pt counter electrode, and a saturated Ag/AgCl reference electrode [4]. TiO2 was printed on FTO and a Cu wire was used to connect FTO with counter electrode. Insulating epoxy resin was used to cover the sample's surface except the active area, to avoid any direct contact between the electrolyte and the conducting back-contact and/or the connecting wire. Subsequently the sample was fully immersed in the electrolyte with pH of 13, containing 0.25 M Na2S and 0.35 M Na2SO3 as the hole scavenger to prevent photocorrosion of the QDs. All potentials were measured with respect to Ag/AgCl during the electrochemical measurements were converted to the reversible hydrogen electrode (RHE) scale with the following expression VRHE = VAg/AgCl + 0.197 + pH × (0.059). The photoresponse was measured using a sun simulator (Oriel LCS-100) with an AM 1.5 G filter with a light intensity of ∼100 mW cm−2. The working area of the electrode is around ∼0.02–0.23 cm2. All the current versus potential measurements were carried out at a 20 mV s−1 sweep rate. Cyclic voltammetry (CV) curves for QDs sensitized TiO2 and bare TiO2 electrodes were scanned from −1.4 to 0.1 V versus Ag/AgCl on a CHI760D electrochemical workstation at a scan rate of 100 mV s−1. H2 evolution was measured during the PEC experiment. The produced H2 gas was detected using a Shimadzu GC-8A gas chromatograph (GC) equipped with a thermal conductivity detector. Argon was used as the carrier gas for GC analysis. An airtight syringe was used for sampling from the vacuum sealed chamber. Detailed information for calculating the hydrogen generation rate are included in the online supplementary information. The incident photon to current efficiency (IPCE) was derived from current−voltage measurements using different band-pass optical filters [4].
3. Results and discussions
3.1. Synthesis of PbS and PbS/CdS QDs
The synthesis of PbS QDs first followed the hot-injection method described in [28]. While, the first excitonic peak only ranges from 1300 to 1600 nm (online supplementary figure S1). Here, we decreased the concentration of both PbCl2 and S in OLA, largely decreasing the viscosity. The PbCl2 can be effectively dispersed in OLA without any gelation even at injection temperatures as low as 80 °C. We were able to reproducibly obtain PbS QDs with first-excitonic absorption peaks from ∼1300 to 1060 nm with low reaction temperature (figure 1(a)).

Figure 1. Absorption (a) and PL (b) of QDs prepared using different conditions. TEM images of PbS with first excitonic peak of 1060 nm before cation exchange (c) and PbS/CdS QDs with first excitonic peak of 950 nm after cation exchange (d). Inset: a HRTEM image of core/shell PbS/CdS QDs in (d).
Download figure:
Standard image High-resolution imageThe as-synthesized QDs exhibit a very narrow size distribution, as shown in figures 1(c) and online supplementary S2(a). However, the QDs dispersed in toluene precipitated after several weeks, even when keeping the solution at low temperature (−10 °C to 4 °C). To improve QD stability and enhance their QY, we applied the cation exchange approach to cap the QDs with a CdS external shell [34, 40]. A significant red-shift of PL was found after cation exchange (figure 1(b)) due to shrinkage of the PbS core [34, 40]. We recorded no significant changes in the optical properties of the QDs (QY, first excitonic absorption peak position, PL peak position), even storing them at −10 °C in dark for more than a year. The typical first-excitonic absorption peak of core/shell QDs can be tuned from 1300 to 950 nm, which falls into the reported window for solar energy applications [22, 26]. The mean domain size for a representative sample was found to be 3.7 ± 0.3 nm measured via TEM imaging (figures 1(c) and (d) and online supplementary figure S2). There is no significant size change before and after cation exchange. The HRTEM image of a core/shell QD shows a well-resolved lattice plane corresponding to inter-planar distances of 0.34 nm consistent with the (111) d-spacing of the PbS bulk rock salt structure (Inset figure 2(d)). The SAED patterns of the PbS rods (online supplementary figure S3) exhibit the rock salt cubic structure with predominant 111, 200 and 220 diffraction rings, corresponding to the inter-planar distances of 0.34, 0.29 and 0.21 nm of PbS bulk rock salt structure (JCPDS 05-0592). XRD analysis further confirmed the crystalline structure of the PbS QDs (online supplementary figure S4). The position of the diffraction peaks matched the standard diffraction pattern for cubic PbS (JCPDS 05-0592), which confirmed that the QDs synthesized using the elemental sulfur precursor were single-phase PbS. Further cation exchange led to a shift of the diffraction peaks, compatible with the formation of zinc blende CdS (JCPDS 01 089 0440) indicating the presence of zinc blende CdS shell, consistent with our previous results on PbS/CdS QDs [34]. The precursor of lead chloride (PbCl2) is insoluble in apolar solvents, and trace amounts, still present after synthesis and purification, precipitate slowly from the suspension [28]. XRD analysis indicates that the PbCl2 is removed by efficient purification using acetone instead of methanol or ethanol.

Figure 2. High resolution XPS spectra of Cl 2p (a) and Pb 4 f (b) of PbS (4.2 nm) and PbS/CdS QDs (4.2 nm) with shell thickness of 0.45 nm. The XPS spectra of Cl 2p was also shown in figure 2(a) for comparison.
Download figure:
Standard image High-resolution image3.2. Surface chemistry of PbS and PbS/CdS QDs
The as-synthesized PbS QDs were capped with OLA ligands as observed previously [28]. After cation exchange, the surface of QDs was mostly capped with OA ligands, as confirmed by FT-IR measurements (online supplementary figure S5). The presence of residual OLA, however, cannot be excluded. To further understand the surface chemistry of QDs before and after cation exchange, we used XPS to characterize the chemical bond status of the QDs. The XPS spectra confirmed the presence of Pb, Cd, S and Cl (online supplementary figure S6). The high resolution spectrum of Cl 2p in PbS, PbS/CdS QDs and PbCl2 revealed Cl 2p 3/2 and Cl 2p 1/2, respectively (figure 2(a)), confirming that chloride is retained in the QDs. The Cl 2p 3/2 peak shifts from 197.4 eV in pure PbCl2 to 198 eV in PbS QDs, and further to 198.3 eV in core/shell QDs. This can be attributed to the change of surrounding chemical environment of Cl. It is likely that the Cl was adsorbed at the surface of PbS QDs or PbS/CdS QDs, other than the formation of PbCl2 on the surface of QDs [28, 35]. The high resolution spectra of Pb 4 f in PbS/CdS QDs collected from toluene (figure 2(b)) show the peaks from the Pb–S bond (Pb 4 f 7/2 (137.9 eV) and Pb 4 f 5/2 (142.7 eV)), and also the peaks from the lead carboxylate at 139.3 eV for Pb 4 f 7/2 and 144.4 eV for Pb 4 f 5/2. These bonds are formed during the cation exchange reaction process, due to the direct Pb-OA bond, indicating that some of PbS/CdS QDs may have an incomplete CdS shell covering the PbS core, even if the percentage of Pb-OA is quite small (less than 3%) [40].
We determined the atomic ratios of QD components, as summarized in table 1 from the area of the high resolution XPS peaks. Within an experimental error of 5%, a Cl/Pb ratio of ∼2.03:1 was found in the PbCl2, as expected. The Cd/Pb ratio is around 1.5. A Cl/Pb ratio of ∼0.68 was found in PbS QDs and ∼0.45 in core/shell QDs. Based on the XPS measurements, the Pb/S ratio is in the range 1.4–1.2 for QD with diameters ranging from 3.6 to 6 nm, consistent with the value of 1.5–1.2 obtained from the ICP-OES measurement. Using this ratio and the overall diameter from TEM images, the diameter of the remaining PbS core and the thickness of the shell were calculated assuming all QDs are spherical and contain a uniform shell (table 1). The calculated shell thickness is consistent with the value obtained by using the optical methods considering the shift of the first absorption peak [21].
Table 1. Initial PbS size based on TEM observations, absorption maxima (λabs) before and after cation exchange; PbS size and shell thickness estimated from absorption peak positions, TEM and XPS; Cl/metal atom (Cl/M, M: Pb and/or Cd) molar ratio and Cl/metal excess (Cl/Mexc, Mexc: excess) molar ratio. The uncertainty on the atomic ratio is less than 5% based on the average of three sets of measurement.
| Abs (nm) | |||||||
|---|---|---|---|---|---|---|---|
| Sample | Overall size (nm) | Initial | After | Core size (nm) | Shell thickness (nm) | Cl/M | Cl/Mexc |
| PbCI2 | — | — | — | — | — | 2.03 | — |
| PbS | 4.2 | 1200 | — | 4.2 | 0 | 0.68 | 2.21 |
| PbS/CdS | 4.2 | 1200 | 1100 | 3.8 | 0.2 | 0.46 | 1.61 |
| PbS/CdS | 4.2 | 1200 | 970 | 3.3 | 0.45 | 0.45 | 1.58 |
From these analyses, PbS QDs are determined to be nonstoichiometric [28], showing an excess Pb (most probably at the surface), which can adsorb the Cl. Under the hypothesis of the nominal stoichiometry M1S1 (being M a metal atom of Pb, Cd or their sum in the composite system) expected in case of PbS and CdS, based on the molar ratios of M, S and Cl, we can calculate the molar ratio between the Cl and the excess Mexc (the metal cation not bound to S) as follows:

where  This represents the molar ratio between the Cl and the excess Pb or Cd, or both, in the QD. In bare QDs, the atomic ratio between Cl and the excess Pb, not bound to S, resulted to be ∼2.2:1, compatible with the formation of PbCl2. On this basis, we expect that the excess Pb atoms reside at the QD surface, with the Cl atoms bound to them with a ratio close to PbCl2. In the core/shell QDs, during the cation exchange, the Pb excess cations were replaced by Cd, therefore, the Cl adsorbed on Cd. The Cl/Cd excess ratio decreases to around ∼1.6 (table 1). From these analyses, PbS QDs are determined to be nonstoichiometric [28], showing an excess Pb (most probably at the surface), which can adsorb the Cl.
A schematic description of the process is reported in scheme
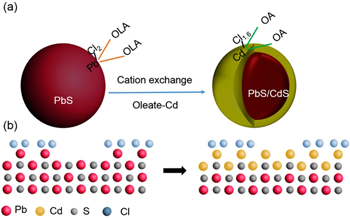
Scheme 1. (a) Scheme of surface chemical compositions in PbS QDs and core/shell QDs after cation exchange. (b) Cartoon representation of possible surface of QDs before and after cation exchange (red: Pb; gray: S; yellow: Cd and blue: Cl).
Download figure:
Standard image High-resolution image3.3. Band gap structure in core/shell QDs
In general, the presence of the CdS shell will serve as energy barrier to slow down electron transport as the entire bulk band structure of the core–shell QDs is type I (both electrons and holes are confined in the core region). However, theoretical calculations indicate that electron wave functions spread into the CdS layer and also outside the QDs, and their amplitudes decay throughout the shell thickness when the core size is quite small (∼3 nm), suggesting that the band structure of core/shell QDs is quasi Type Π (figure 3(a)) at least for small sized cores (core size <3 nm) [22, 43]. This band alignment structure favors charge separation in the presence of electron scavengers, suggesting the possible application of these systems for solar technologies, in which charge separation and transport are required [11]. The leakage of electron will lead to the longer of lifetime compared to un-shelled QDs which was further confirmed by the PL decay. The representative decay curves of the PL peak centered at ∼1150 nm of PbS QDs (core size 3.6 nm) and ∼1150 nm of PbS/CdS QDs (core size 3.7 nm, shell thickness of 0.2 nm) were fitted well with a two-component decay model. The average lifetime τav is estimated to be ∼2.7 μs for PbS QDs and ∼3.1 μs for core/shell QDs (figure 3(b)). As the measured lifetime depends on both the radiative and the non-radiative rate, we further calculated the radiative lifetime τrad by using the following equation [41]:

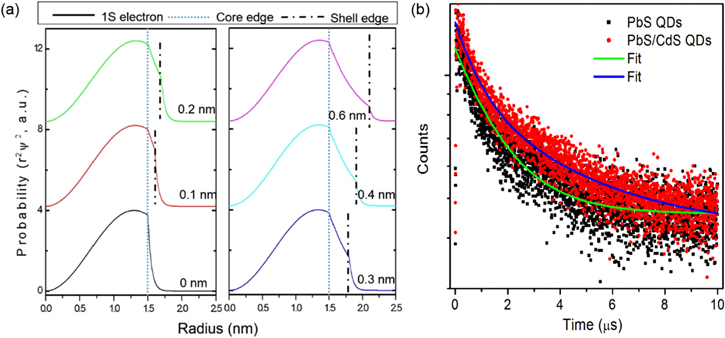
Figure 3. (a) Normalized radial distribution functions for 1 S electron level of a PbS/CdS core/shell QD with tunable shell thickness ranging from 0 to 0.6 nm. The core size is 3 nm in diameter. (b) Fluorescence decays of PbS or PbS@CdS QDs dispersed in toluene. The overall size for PbS is 3.7 nm in diameter and 4.1 nm of PbS/CdS QDs with shell thickness of 0.2 nm. The excitation wavelength is λex = 444 nm.
Download figure:
Standard image High-resolution imageThe ratio of the radiative lifetime in the core/shell QDs, τrad,CS and the radiative lifetime in PbS QDs, τrad,PbS, is around ∼1.5. As the core size is similar, this difference may be due to the partial leaking of electrons from the core into the shell, as already found in the literature for PbSe/CdSe QDs [43]. However, once the core size is larger than 4 nm, no significant differences were found between the core/shell QDs and pure QDs, suggesting that electrons can still transfer through the shell when the core size is less than 4.0 nm.
3.4. QDs photocatalytic water splitting
We fabricated PEC cells with PbS/CdS QDs as the sensitizer. The CdS shell makes the core QDs very stable during purification and anode preparation by depositing the QDs into TiO2 film by EPD and further cell testing. The photocatalytic behavior of the TiO2/core/shell QDs in the dark and under illumination using a conventional three-electrode configuration with an Ag/AgCl (saturated KCl) reference electrode and Pt counter electrode under AM1.5 G illumination (100 mW cm−2) is illustrated in figure 4(a). The current-response both in dark and in light in the range of −0.4 to −0.2 V is due to the oxidation of TiO2 film according to CV results reported in online supplementary figure S7.

Figure 4. (a) Photocurrent density versus the applied voltage referenced to RHE and (b) photocurrent responses at 0.2 V versus RHE of TiO2/colloidal QDs/4CdS/2ZnS photoanode as a function of illumination time under AM1.5 G of 100 mW cm2.
Download figure:
Standard image High-resolution image
The observed positive photocurrents correspond to hole injection from the heterostructured TiO2/QDs photoanode into the solution. In the QDs/2ZnS sample, saturation of the photocurrent takes place at approximately 0.2 V versus the RHE, with only 0.5 mA cm−2 for 100 mW cm−2 light intensity. While in the identical measurement condition, the QDs/4CdS/2ZnS sample, presents a saturated photocurrent of 3.3 mA cm−2 for 100 mW cm−2 light intensity. When the long pass filter (only light with wavelength longer than 650 nm can pass through the filter) is applied, a saturated photocurrent of 1.4 mA cm−2 (figure 4(a)), confirming the contribution of the NIR PbS/CdS QDs as the absorption spectra of TiO2 or CdS are typical shorter than 550 nm. In addition, the IPCE was derived by current–voltage measurements (online supplementary figure S8). The results are consistent with the broad NIR absorption of the QDs (figure 1(a)), with significant contribution to IPCE originating from the NIR region, up to 1000 nm.
As shown in figure 4(b), after 4200 s (70 min) illumination under 100 mW cm−2 light irradiation, the electrodes are still stable, even if the produced photocurrent density suffered a decrease of about 17%, which is comparable with the stability of QDs based PEC system for H2 production [4, 14]. This result confirm the potential application of QDs for efficient H2 production. The good stability of the anode was further confirmed by XPS measurements (online supplementary figure S9). There is no significant chemical status changes of Zn and Cd/Pb. Furthermore, we calculated the H2 generation rate (details in online supplementary figure S10) using CdSe/CdS QDs as a reference [44]. The H2 generation rate is ∼29 ml cm−2 d−1 which is higher than values reported from PEC systems using in situ deposited PbS QDs [43]. On the other hand, it is still lower than the PEC system using the PbS/CdS QDs made via SILAR (60 ml cm−2 d−1) [14] or colloidal core/shell PbS/CdS QDs covered further by CdS layers via SILAR (112 ml cm−2 d−1) [4]. Further improvement of PEC efficiency could be obtained by optimizing the core size, shell thickness of core/shell QDs or the improvement of the surface passivation by inorganic capping agents.
4. Conclusions and perspectives
In conclusion, PbS QDs with high QY were synthesized via a PbCl2-OLA-S reaction system by using much lower PbCl2/S molar ratio (10:1) than previous studies (24:1). The as-synthesized core/shell QDs via cation exchange approach have a high QY, good stability, and narrow size distribution with the first-excitonic absorption peak from 1300 to 950 nm. Excess Cd cations fully cover the external QD surface, as confirmed by XPS measurements, guaranteeing surface passivation, and resulting in improved QD stability. PEC cells based on TiO2 mesoporous photoanode sensitized by core/shell PbS/CdS QDs exhibited a saturated photocurrent as high as 3.3 mA cm−2, leading to 29 ml cm−2 d−1 hydrogen generation. Our results indicate the potential of using NIR core/shell QDs synthesized via a greener approach for solar energy applications. Future developments for water splitting should focus on the optimization of charge transfer by suitable engineering of the PbS core size and CdS thickness of the external shell. Other strategies to increase the efficiency of PEC systems rely on efficient surface passivation to remove the trap states and suppress the hole accumulation induced surface oxidation to increase the long-term stability of these systems.
Acknowledgments
AV acknowledges the European Commission for partial funding under the contract F-Light Marie Curie n° 299490. The authors acknowledge the European Commission for partial funding under the contract WIROX n° 295216. HZ acknowledges NSERC for a PDF scholarship. FR acknowledges NSERC for funding through the Discovery Grants program and for an EWR Steacie Memorial Fellowship for funding and partial salary support. FR is grateful to the Alexander von Humboldt Foundation for a F W Bessel Award.
Notes
The authors declare no competing financial interests.