


Abstract
In the last decade, the availability of innovative algorithms derived from complexity theory has inspired the development of highly detailed models in various fields, including physics, biology, ecology, economy, and medicine. Due to the availability of novel and ever more sophisticated diagnostic procedures, all biomedical disciplines face the problem of using the increasing amount of information concerning each patient to improve diagnosis and prevention. In particular, in the discipline of orthodontics the current diagnostic approach based on clinical and radiographic data is problematic due to the complexity of craniofacial features and to the numerous interacting co-dependent skeletal and dentoalveolar components. In this study, we demonstrate the capability of computational methods such as network analysis and module detection to extract organizing principles in 70 patients with excessive mandibular skeletal protrusion with underbite, a condition known in orthodontics as Class III malocclusion. Our results could possibly constitute a template framework for organising the increasing amount of medical data available for patients' diagnosis.
Export citation and abstract BibTeX RIS

Content from this work may be used under the terms of the Creative Commons Attribution 3.0 licence. Any further distribution of this work must maintain attribution to the author(s) and the title of the work, journal citation and DOI.
1. Introduction
In the daily life of the practising orthodontist, establishing a diagnosis of malocclusion can encounter a series of troublesome procedural difficulties. Nothing in the craniofacial system is either intrinsically stable or insensitive to details (another word, perhaps); the systemʼs output magnitude (i.e., treatment effects) is not necessarily proportionate to the input magnitude (i.e., treatment stimuli it receives). None of the dentoskeletal variables are crucial or negligible a priori, always affecting diagnosis or never affecting diagnosis [1–3].
During the treatment process, the system is put 'out of balance' repeatedly; changing the matrix of the growing topology of the craniofacial region is no simple task. Treatment forces the systemʼs stationary state to confront the problematic coexistence of anatomical parts, selective forces, cumulative trauma, adaptability, robustness, opposition dynamics, competition between tooth elements for space, local optimization, and mutual attraction of forms. None of these factors can be explained fully by the laws of biomechanics [4–8].
As in nonlinear complex systems (and in all biomedical disciplines), the whole is much more complex than the mere sum of its parts; even the simplest orthodontic treatments can have surprising counterintuitive side effects. Some patients who respond poorly to treatment tend to improve spontaneously years later [9]. Even the most favorable short-term therapeutic results may be followed by inexorable worsening, resulting in a frustrating relapse in the long term. Therefore, the quality of treatment does not always, or necessarily, determines the quality of the outcome [10].
Unwanted dentoalveolar changes occur with tooth-borne appliances. For example, an expander used to correct crossbite in a patient with skeletal hyperdivergence may worsen the divergence and lead to an anterior open bite, aggravate profile convexity, and trigger an unfavorable counter-clockwise rotation of the mandible [11]. Growth processes can transform a Class III patient into an apparent Class I (i.e. normal) through clockwise rotation of the mandible (see figure 1). If the space–time linearity of orthodontic events or linearity of therapeutic responses cannot be relied upon, how do orthodontists establish a reasonable basis on which to assess the efficiency/efficacy of their interventions?
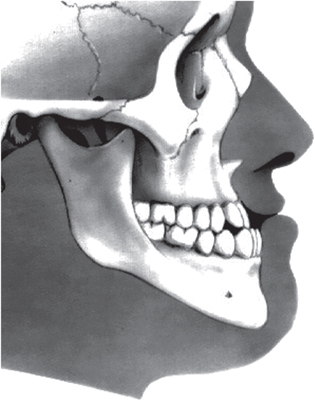
Figure 1. Class III malocclusion: protrusion of the lower dental arch. A malocclusion is a misalignment or incorrect relation between the teeth of the two dental arches when they approach each other as the jaws close.
Download figure:
Standard image High-resolution imageOne frequent methodological suggestion is to prioritize problems, but this approach seems difficult when the inner nature of malocclusions and side effects of each problem are not known [12]. Problems that diverge in three spatial planes, but are not separate, and that evolve and reassemble with time, produce conflicts between local adaptive solutions and global equilibrium strategies [13, 14]. All biomedical disciplines share a problem related to the increase in the amount of information concerning each patient, due to the availability of novel and ever more sophisticated diagnostic procedures [15].
A considerable difference exists between the number of variables (recognized as being no more than seven) that the human brain can handle simultaneously for making decisions, and the amount of clinical, functional, anamnestic, and radiographic data available for each orthodontic patient [16]. To understand each clinical case better, the practising orthodontist must follow a rather meandering diagnostic path. Averages are not suitable for describing phenomena in which reciprocal interactions are at work. Finally, the amount and quality of clinical and/or anamnestic information, as well as the problematic conceptual assumption of 'harmony' and 'balance' related to floating and overlapping phenotypic contours of the Class III dentoskeletal imbalance (figure 1) are important [17–19].
If one wants to understand the dynamical/evolutionary processes that take place in human organs, it is necessary to understand how the components in biological system interact with each other as well as the biological significance of those interactions. Malocclusions are isoforms of complexity that incur cost in terms of the weakness of occlusal forces, mechanotransduction, and cumulative trauma, among others. These factors rarely are a consequence of an abnormality in a single craniofacial characteristic.
A corollary of this statement is that the interdependencies among different craniofacial components lead to an overlapping of morphological, functional, and causal relationships between apparently distinct phenotypes [20]. As a basic morphogenetic classification of malocclusions, orthodontists have referred to concepts such as equilibrium, in turn exemplified as facial balance, harmony of skeletal variants, growth invariants, and so on. However, the range of variability of dentofacial features is so wide that neither individual cephalometric features, nor the interrelations between these features, are sufficiently binding to be designated as standard.
Some recent observations suggest that the orthodontist can receive help addressing the ubiquitous, pervasive, and sometimes astonishing laws that govern different complex systems in a variety of fields, from physics to biology, economy to geology, and ecology to meteorology [21–23]. Yet, underlying the high-dimensionality, some subtle form of order that renders these systems capable of self-adaptation, optimization, and predictability is expected [24, 25]. Since the behavior of a complex adaptive system depends strongly on interactions, in these systems the key components are the relationships between variables—i.e. the interconnections—rather than the variables themselves [26]. Interacting with each other, the parts develop unexpected collective properties, arising naturally from the organizing relationships of the parts [27–30].
Recently, different algorithmic approaches derived from complexity theory showed that malocclusions can be viewed as polytypic structures consisting of a systematic mixture of multiple, competing dentofacial types whose growth trajectories depend on the membership grade of a specific growth strategy [31, 32]. How these large-scale, high-dimensional data sets can be integrated to better understand the orthodontic network underlying physiological states associated with malocclusions needs to be understood. By integrating multiple orthodontic components and regulatory interactions into a comprehensive topological model that goes beyond clinical intuition, emerging mathematical tools such as complex networks and modules' detection could address a variety of biological problems in orthodontics and allow improved interpretation of quantitative patient-specific information [31]. In this study, we applied these promising approaches to the orthodontics with the aim to extract information, infer the craniofacial evolutionary morphogenesis on a topological basis, and obtain a more comprehensive understanding of processes associated with treatment of Class III malocclusion.
2. Subjects and methods
2.1. Subjects
A group of 70 Class III patients (Caucasian ancestry, 7–13 years of age; mean 9.5 years; 40 females and 30 males) from the Graduate Orthodontic Program at the University of Michigan, Ann Arbor, Michigan, and from the Department of Orthodontics, University of Florence, Italy, were analyzed before orthopedic treatment (T1) with rapid maxillary expansion combined with a facial mask (RME/FM). The same patients were re-evaluated (T2, 11–18 years of age, mean 14.7 years) with a lateral cephalogram (see figure 2) following a second phase of treatments with fixed appliances (braces). The patients were matched with a cohort of 70 untreated Class III controls (U2 11–18 years of age, mean 14.5 years) on the basis of race, sex, age, and type of malocclusion. The control patients were selected randomly from a cohort of 1070 Caucasian Class III subjects from the same data sources. All subjects were enrolled previously in large descriptive estimates of craniofacial growth in Class III malocclusion [33, 34] and in two clinical studies [35, 36].
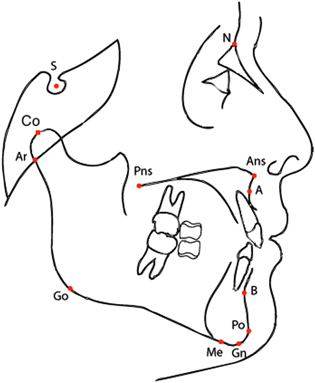
Figure 2. Cephalometric points allow to classify patients according to their cephalogram, i.e. an x-ray of the craniofacial area. Shown in this picture the cephalometric points of the lateral cephalogram used to define the linear distances and angles used in the paper (see table 1).
Download figure:
Standard image High-resolution imageTo be included in this study, the subjects had to satisfy all of the following criteria:
- Caucasian ancestry;
- No orthopedic/orthodontic treatment prior to the initial cephalogram;
- Diagnosis of Class III malocclusion based on anterior crossbite, accentuated mesial step relationships of the primary second molars, permanent first molar relationship of at least one half cusp Class III, a negative Wits appraisal (
 −2 mm), and ANB angle less than 0;
 - No congenitally missing or extracted teeth; and,—No craniofacial syndromes.

2.2. Treatment protocol
The three components of the RME/FM therapy used in this study were a maxillary expansion appliance, a facemask, and heavy elastics [35, 36]. Treatment was initiated with the placement of a bonded or banded maxillary expander to which were attached vestibular hooks extending in a superior and anterior direction.
Patients were instructed to activate the expander 1–2 times per day until the desired transverse width was achieved. Patients were given facemasks with pads fitted to the chin and forehead for support either during or immediately after expansion. Elastics were attached from the soldered hooks on the expander to the support bar of the facemask in a downward and forward vector, producing orthopedic force levels up to 350–600 grams per side. Patients were instructed to wear the facemask for a minimum of 14 h per day. All patients were treated at least to a positive dental overjet before discontinuing treatment; most patients were overcorrected toward a Class II occlusal relationship. The average duration of RME/FM treatment was 1.1 years.
The majority of the patients (about 90% of the cases) underwent a second phase of treatment with fixed orthodontic appliances. On average, fixed appliance therapy lasted 18 months.
2.3. Cephalometric analysis
A cephalometric analysis comprising N = 21 variables (10 linear and 11 angular: see table 1 and figure 2) was performed. Data from landmarks contained in each cephalogram were entered into cephalometric software (Dentofacial Planner PlusTM, Version 2.5, Toronto, Ontario, Canada). A standardized enlargement factor (8%) was applied to all linear cephalometric measurements. The error of the method for the cephalometric measurements was evaluated by repeating the measures in 30 randomly selected cephalograms. Error was on average 0.8° for angular measures and 0.9 mm for linear measures.
Table 1. Description of the cephalometric variables used in this paper. Notice that the acronym is often composed by the juxtaposition of the labels of two or three cephalometric points as defined in figure 2; in such a case, it corresponds either to the linear distance among two points, or to the angle defined by the three points.
| Variable | Description |
|---|---|
| ANB | anteroposterior relationship of the maxilla and the mandible |
| Ar-Go | mandibular ramus height |
| ArGoMe | gonial angle |
| Co-A | midfacial length as distance from Co to A |
| Co-Gn | mandibular length as distance from Co to Gn |
| Co-Go | distance between Condylion and Gonion points |
| FMIA | Frankfort-mandibular incisor angle |
| Go-Pg | distance between Gonion and Pogonion points |
| IMPA | angle between the lower incisor and the mandibular plane |
| Interincisal | angle between the axis of the upper and the lower incisors |
| NMe | anterior facial height |
| NS-Ar | saddle angle |
| NS-GoGn | divergence of the mandibular plane relative to the anterior cranial base |
| Overbite | vertical overlap of the upper and lower incisors |
| Overjet | horizontal overlap of the upper and lower incisors |
| PP-PM | inclination of the palatal plane to the mandibular plane |
| PP-SN | inclination of the palatal plane to the anterior cranial base |
| SN | anteroposterior length of the cranial base |
| SNA | anteroposterior maxillary position to the anterior cranial plane |
| SNB | anteroposterior mandibular position to the anterior cranial plane |
| Wits | Wits appraisal |
2.4. Networks
The growing craniofacial system can be modeled as an aggregate structure of a variety of agents in which the clinical (e.g., radiographic, functional) characteristics can be represented as nodes of a network where the relationships between these characteristics are represented as link among such nodes. Each component of the network can be regarded as a processing unit of information. Network analysis can deepen the entanglement of the elementary components or interactions [37]. The specific entities interacting with each other depend on a type of underlying reticular structure that may have a large effect on the behavior of the system. A link can represent any sort of interaction between the various parts of a system; since we resort on angular and linear data (table 1), we can only study relations among the parts and not causality. Hence, we will take as a measure of interaction among the N = 21 cephalometric variables  the Pearson correlations between two variables:
where  indicate the ensemble average. Since we have a series of Np (where Np is the number of patients) measurements for each of the xi variables, we will estimate the population Pearson correlation
  by the sample correlation coefficient rij:
where xip is the value of the ith variable observed in the pth patient and  is the arithmetic mean of the ith variable. The elements
 ![${{r}_{ij}}\in \left[ -1,1 \right]$](https://content.cld.iop.org/journals/1367-2630/16/11/115017/revision1/njp504680ieqn6.gif) define the correlation matrix
define the correlation matrix ![$R=[{{r}_{ij}}]$](https://content.cld.iop.org/journals/1367-2630/16/11/115017/revision1/njp504680ieqn7.gif) ; since we have different groups of patients, we will indicate with RT1 the correlation matrix corresponding to the T1 group (patients before the treatment), with RT2 the one corresponding to T2 (treated patients) and with RU2 the one corresponding to U2 (the control group of untreated patients).
; since we have different groups of patients, we will indicate with RT1 the correlation matrix corresponding to the T1 group (patients before the treatment), with RT2 the one corresponding to T2 (treated patients) and with RU2 the one corresponding to U2 (the control group of untreated patients).
The possible relations among the variables correspond to a highly-dimensional systems of  relations; to reduce the dimensionality of the system, we filter the correlation matrix R by associating a weighted network
  where the nodes V correspond to the N cephalometric variables, the edge set is
  and the weight w associate to each link
  is the correlation Rij among the nodes i and j. In such a way the graph
  represents a relation among nodes only with correlation higher than t; for simplicity, we will indicate as
  ,
,  and
and  the networks corresponding to RT1, RT2 and RU2.
2.5. Module detection
Many networks of scientific interest, including metabolic, regulatory, and computer networks, are found to divide naturally into 'modules' or 'communities', i.e. groups of densely associated components connected to each other with loose links [38]; weʼll see that this is the case also for orthodontic networks. In an orthodontic network, modules are sets of traits that are integrated internally by interactions among traits, but are relatively independent from other modules. More formally, given a graph  , a community finding algorithm finds a partition
  ,
,  ,
,  of its vertices that can be considered a good community structure when the proportion of edges inside the Ciʼs (internal edges) is high compared to the proportion of edges between them.
Breaking complex networks into modules helps to simplify their structure and gives valuable insights into network organization and function. These highly interconnected sub-graphs represent local regions of optimization, auto-reinforcing structures that act as 'attractors' during the growth process of several biological organisms [39]. These sub-networks often operate as critical components of the whole network; conveying useful information, they provide evidence for a modular view of the networkʼs dynamics [40, 41]. The network decomposition into modules often is helpful for understanding the functional organization of the system; many biological complex networks are built up from several interlinked sub-graphs.
To detect the modules, we apply the walktrap algorithm [42] that highlights the dense subgraphs of sparse graphs using a measure of similarities between vertices based on random walks: loosely speaking, the walktrap splits the graph in regions where random walks tend to be trapped. Walktrap allows to find modules without having to fix the number of modules in advance; moreover, being based on random walks, it is expected to give results related to the spectral partitioning of a graph [43]. While many alternative module-finding algorithms are possible, walktrap is often faster and simpler to implement [42].
Notice that other metrics could be used in analysing the network structure of orthodontics data, like centralities and degree distribution [32] leading eventually to highlight the nodes that can be the driver variables for the growth of the orofacial system [31]; however, the strong correlation found among the modules' nodes hints that a hollistic approach is more indicated in tackling the understanding of orofacial growth.
3. Results
3.1. Networks
By varying the threshold t, the networks  ,
,  and
and  will range from almost complete graphs for t = 0 (since any non-zero correlation is considered, all the links are present), to fully disconnected graphs for t = 1 (no links are present since on a finite sample the probability of getting a 100% correlation is highly unprobable). In this first phase of network analysis, we have resorted on visual inspection by expert orthodontists to discriminate the bordering situation where networks are simple enough to be examined by eye yet complex enough to convey meaningful clinical information. We find that in a region of
  around the threshold t = 0.5 the resulting networks satisfy such criteria on the other hand, weʼll see in section 3.2 that the modules detected by automatic community-finding algorithms confirm our empirical analysis. In all this section, weʼll show figure obtained using a threshold t = 0.5; for the sake of clarity, disconnected nodes (i.e. variables whose correlations are all
  ) will not be represented.
Figure 3 illustrates the correlation network of the cephalometric characteristics of the Class III patients (age 7–13 years) before orthopedic treatment with RME/FM (T1). We see that the network splits into two components: the dentoalveolar adaptive variables (figure 3, top) and the skeletal variables (figure 3, bottom). Moreover, the skeletal horizontal variables (figure 3, bottom right) and skeletal vertical variables (figure 3, bottom left) are loosely connected by a link among the gonial angle (ArGoMe) and the distance between Gonion and Pogonion points (Go-Pg).

Figure 3. Network analysis of cephalometric features of the Class III patients (T1, 7–13 years of age) before RME/facemask treatment. The dashed lines indicate negative correlations. In the upper part of the drawing are shown the dentoalveolar adaptive nodes that have been released from the rest of the network. The triangle formed by SN-GoGn, ArGoMe, and PP-PM variables comprises the parameters of maxillomandibular divergence. In the lower right part of the drawing is the sub-network of craniofacial skeletal features. The graphs shown here and in subsequent figures were produced using yEd Graph Editor by www.yworks.com.
Download figure:
Standard image High-resolution imageThe same patients were re-assessed at the end of the RME/FM therapy, followed by a second phase of treatment with fixed appliances (T2; figure 4). Network analysis show a more interlinked structure between skeletal and dentoalveolar adaptive nodes and the appearance of a strong correlation among the overbite and overjet variables.

Figure 4. Network analysis of the same Class III patients re-evaluated after RME/FM therapy followed later by fixed appliances (T2, 11–18 years of age).
Download figure:
Standard image High-resolution imageFinally, figure 5 illustrates the correlation network of the cephalometric characteristics of the cohort of the untreated Class III controls of 11–18 years of age (U2).
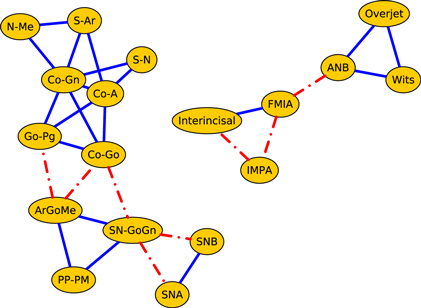
Figure 5. Network analysis of the Class III untreated control subjects (U2, 11–18 years of age).
Download figure:
Standard image High-resolution imageWhile the network of treated patients at the end of RME/FM therapy showed a highly interconnected structure between dentoalveolar adaptive and skeletal variables (figure 4), the network of control patients exhibited two separate sub-networks pertaining to skeletal (left) and dentoalveolar (right) adaptive nodes (figure 5). The core of the network of treated patients consisted of a triangle composed by three maxillomandibular divergence variables: SN-GoGN, ArGoMe, and PP-MP. These variables seem to act as a bridge between skeletal features of Class III malocclusion and the dentoalveolar adaptive components of the craniofacial system.
3.2. Modules
We detect modules by applying the walktrap algorithm [42] on the complete graphs corresponding to consider all the possible edges weighted with their correlation rij; in particular, we use the igraph [44] implementation of the function walktrap.community of R [45]. To compare the results with the empirical outcomes of section 3.1, we show in all the pictures only links with a correlation correlation  and only nodes connected by such links. The analysis of the modules shows interesting differences among the three groups of patients: in fact, the modules characterising the networks of the patients before control (T1) and the untreated control patients (U2) share a similar structure (see figures 6 and 8) with three modules composed by analogous nodes. In fact, like in figure 3, the modules of T1 shown in figure 6 correspond to dentoalveolar adaptive nodes (top right of the picture), to skeletal horizontal nodes (bottom right of the picture) and skeletal vertical nodes (left of the picture); a similar correspondence exists among figures 5 and 8. Notice that for both T1 and U2 the modules are either separated or linked by negative links, indicating that such groups of nodes work as separate, non interacting, oro-facial modules. On the other hand, the network of treated patients (T2, figure 7) shows more modules ; apart to the new (respect to T1 and U2) isolated community formed by overjet and overbite (whose correlation is due to the successful action of the braces), the remaining communities are much more interlinked, possibly hinting a harmonization of the orofacial modules that start working together thanks to the orthodontic correction.
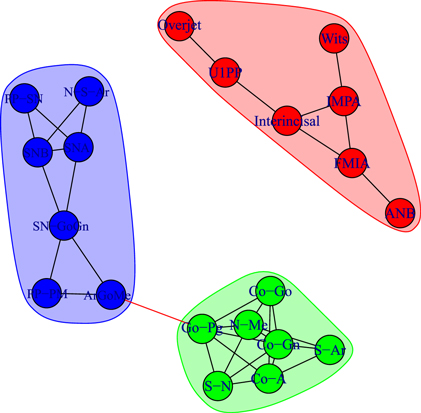
Figure 6. Module repartition of the Class III patients before treatment (T1). The detected modules correspond to dentoalveolar adaptive nodes (top right—red), to skeletal horizontal nodes (bottom right—green) and skeletal vertical nodes (left—blue).
Download figure:
Standard image High-resolution image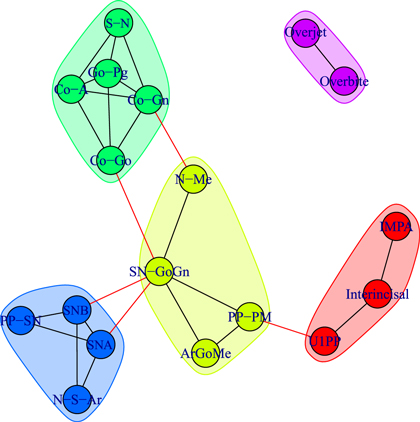
Figure 7. Module repartition of the Class III patients after comprehensive treatment (T2). Apart from the isolated community corresponding to the treatment-induced overjet–overbite correlation, the four modules are inter-connected.
Download figure:
Standard image High-resolution image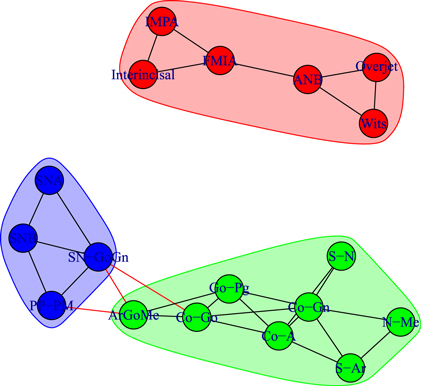
Figure 8. Module repartition of the Class III control subjects (U2). As in figure 6, the detected modules correspond to dentoalveolar adaptive nodes (top right—red), to skeletal horizontal nodes (bottom right—green) and skeletal vertical nodes (bottom left—blue).
Download figure:
Standard image High-resolution image
Hence, the arrangement of modules of at the start (T1, figure 6) and at the end of treatment (T2, figure 7) of the same Class III patients confirms the strict interlinked module topology after RME/FM treatment, as compared with untreated controls (U2, figure 8).
4. Discussion
Malocclusions rarely are a consequence of an abnormality in a single characteristic, but reflect perturbations in the complex structural and functional network that links soft tissues, bones, ligaments, articulations, and other biological tissues [1, 2]. The macrostate of the craniofacial system (i.e., the orthodontic phenotype) reflects the microstate (i.e., the interactions between local microdynamics). Unfortunately, different microstates can produce indistinguishable macrostates during the growth process, and different combinations of disparate local characteristics can converge into the same malocclusion [1, 15]. Therefore, the pathogenesis identified by clinical and anamnestic information may be completely fortuitous and lead to incorrect conclusions about the clinical condition. Some characteristics of the dentofacial complex tend to have a greater effect than other characteristics. Some aspects tend to grow and acquire importance, while others diminish and play a negligible role in the development of the system.
Network analysis allow us to answer to the following questions: what are the most important nodes in a growing dentofacial complex? Which features interact more effectively? What path allows relationships to be more significant and/or exchange mechanotransduction or auxological information faster? The answers to these questions are found in the topological structure of the network in the way the components are connected to each other. Network analysis can provide suggestions about some underlying rules of interaction and can lead to the identification of craniofacial modules, pathways, and unexpected interdependencies among apparently distinct orthodontic phenotypes [24, 25, 31]. Networks offer a formalized model for displaying a process by the convergence of multiple factors rather than according to causal processes.
Understanding how orthodontic complexes and groups of functionally related orthodontic features ('modules') are organized within interaction networks can lead to a better understanding of how craniofacial developmental and/or dysmorphic processes are coordinated. These highly interconnected sub-graphs represent local regions of optimization, auto-reinforcing structures that could act as 'attractors' during the growth process of several biological organisms [20]. These sub-networks often function as essential components of the network [38–40]. Morphological traits are produced by developmental processes whose modularity structures are defined by coordinated interactions among the precursors that ultimately will form the parts of the finished structure [41].
Developmental modules maintain internal coherence through direct developmental interactions. Variables within modules are highly correlated mutually and less correlated with variables in other modules. These interactions between parts generate covariation among morphological traits (i.e., they transmit variation jointly) [38]. Positive phenotypic correlations between quantitative traits suggest that they will increase (or decrease) in size and shape simultaneously; during the growth process, characteristics that share functional and developmental influences would evolve as integrated units [39]. This 'morphological integration' represents the cohesion among traits that results from interactions of the biological processes producing the phenotypic structures under study [39]. Strong covariance between traits indicates a high degree of integration [40]. Applied to the craniofacial system, the quantitative study of the association between complex traits helps to understand how the dysmorphic trait affects the overall facial complex.
In that all cephalometric variables are defined relative to each other, the correlation between measurements may be due at least in part to geometric factors. It generally is assumed that the presence of a significant non-geometric correlation indicates a biological coordination [7, 13]. The comparison of correlations from treated and untreated Class III individuals underlines topological non-geometric differences between variables (i.e., a biological coordination).
The orthodontic anamnesis is not merely the series of events in which the patient had been involved. It is a series of transformations by which the craniofacial system progressively was formed that must take into account the tension between growth hindrances and the capacity of the system to adapt. Sound orthodontic anamnesis should lead to reconstruction of the states that overlapped with the data during craniofacial development, when a change of one part influences all other parts of the system, and when the behavior of each variable is determined, at least in part, from the global state of the system. The study of craniofacial morphogenesis deals with the succession of morphologic changes that seem discontinuous, though occurring through small, continuous modifications.
The ability to detect at the individual level some craniofacial characteristics to use as predictors of successful or unsuccessful orthopedic correction of Class III disharmony could represent a critical improvement in clinical decision-making for the practising orthodontist. Previous studies have identified specific predictor cephalometric variables; however, among more than thirty different predictors proposed so far, there were no studies that shared an identical set of parameters of subsequent treatment outcome [46].
Several authors [47–49] have emphasized the important role of vertical skeletal relationships in determining the destiny of early treatment in Class III malocclusion. The pretreatment increased size of PP-MP angle (the inclination of the palatal plane in relation to the mandibular plane) [47], the SN-GoGn angle (the angle between the anterior cranial base and the mandibular corpus) [48], and the ArGoMe angle (the angle between the ramus and corpus of the mandible) [49] have been identified repeatedly as specific predictive variables of long-term failure of Class III treatments. Due to the large variety of predictors of outcome in subjects with a Class III malocclusion so far identified, the existence of a single (or few) universal predictor seems questionable.
The prognostic framework of Class III treatment proposed by networks highlights the critical role of the co-occurrence of all skeletal divergence parameters during the growth process. Untreated growing Class III patients exhibit a pattern of co-morphology of horizontal and vertical craniofacial characteristics that are free from the regulatory effect of the adaptive dentoalveolar parameters. In contrast, Class III patients undergoing orthodontic treatment show a more compact network structure with a strong co-occurrence of horizontal, vertical, and dentoalveolar adaptive parameters. The integration between the enhancement of the natural self-corrective processes and the biomechanics of RME/FM therapy could explain, at least in part, the therapeutic effects observed on Class III dentoskeletal disharmony.
4.1. Conclusions
Orthodontic practitioners evaluate dentofacial phenotypes from clinical, functional, and cephalometric data. It is likely that in the near future these large-scale, high–dimensional datasets can be integrated by a remarkable diverse framework. Ultimately, this 'organized complexity' is worth addressing when orthodontists are forced to make therapeutic choices under conditions of uncertainty, when they realize that corrective appliances will stimulate the algorithms of the living orthodontic world, discovering causality beyond therapeutic objective, unexpected consequences that seem to contradict any reasonable clinical scenario. This study showed that treatment of Class III dentoskeletal disharmony is able to induce a more interlinked network structure of cephalometric features. A more interlinked connection between adaptive and skeletal nodes could enhance the self-correction property of dentoalveolar nodes thus improving the effects of Class III treatment.
In general, our approach could be easily applied to other fields of medicine, allowing modern medical practitioners to take full advantage of the constantly increasing amount of patients' information due to the availability of novel and ever more sophisticated diagnostic procedures. In fact, network approaches to medicine not only allow to mine information both from patients' records [31, 32] and from medical literature [50], but also to understand of how organ systems dynamically interact and collectively behave as a network to produce health or disease and different physiologic states, as recently shown in [51–53].
Acknowledgments
AS and GC acknowledge the support from CNR-PNR National Project 'Crisis-Lab' EU FET and EU FET project MULTIPLEX nr.317532. Any opinion, findings and conclusions or reccomendations expressed in this material are those of the author(s) and do not necessary reflect the views of the funding parties.