

Abstract
This study diagnoses temporal and spatial variations in the performance of different social-ecological systems (SES) in coastal floodplain management in the Ganges-Brahmaputra delta. We go beyond common pool resource management problems and address the management of local public goods. In the assessment, we consider recent developments in the framework initially developed by Elinor Ostrom. The main variables of the framework that we use are resource systems, the environment, the governance system and actors. The focal SES is defined based on guiding questions relating to the definition of the key problem, system boundaries, and action situations. According to our results, the performance of resource systems and the environment deteriorated in 1960–79 compared to the performance prior to 1960. The condition reached a low point during 1980–1999 but improved slightly after 1999. The horizontal network structure of local governance was active until 1960. Due to the introduction of the 'tidal river management' approach in the 90 s, the performance of the resource system and the environment has slightly improved, as has the involvement of government and non-government organizations. Our results also show that overall SES performance is comparatively better <in the case of locally managed floodplains than it is for those managed by government agencies. Our new approaches, such as the recent development of the diagnostic framework, the guiding questions for defining focal SES, and application of the framework to local public goods can potentially be used in the fields of sustainability science and SES science. The qualitative performance of each of the selected indicators is useful for identifying intervention options to achieve a sustainable outcome for the coastal floodplain SES.
Export citation and abstract BibTeX RIS

Original content from this work may be used under the terms of the Creative Commons Attribution 3.0 licence. Any further distribution of this work must maintain attribution to the author(s) and the title of the work, journal citation and DOI.
1. Introduction
Understanding the dynamics of complex human-nature interactions is essential for supporting both human well-being and the sustainable management of resources (Liu et al 2015, Bisaro and Hinkel 2016, Liu et al 2018). A SES approach explicitly recognizes the connections and feedback loops linking human and natural systems (Holling 2001, Folke 2006). According to Gunderson and Holling (2002), an SES can be defined as a coherent system of biophysical and social factors that regularly interact in a resilient and sustained manner.
Within SES research, a number of theoretical frameworks have been developed. Examples of these frameworks include the social-ecological system framework (SESF) (Ostrom 2007, 2009, McGinnis and Ostrom 2014), the vulnerability framework (Turner et al 2003) and the driver-pressure-state-impact-response (DPSIR) framework (EC 1999, Gari et al 2015, Lewison et al 2016). Among these, the SESF is one of the most widely used frameworks within the scientific community in the field of SES. In a comparative study of ten potential frameworks for analysing SES, Binder et al (2013) found that the SESF proposed by Ostrom (2009) provides the option to treat the social and ecological systems at almost equal depth. The subsystems, resource systems and resource units of SESF represent the ecological system, while the governance system and actors represent social systems.
The SESF is useful for developing a diagnostic approach to the study of natural resource management for complex SES. Depending on 'subtractability' (the degree to which one user's consumption of a resource subtracts from what is available to others) and 'excludability' (degree to which non-users can be prevented from consuming the resources), there are four types of goods: private goods, common pool resources, toll or club goods and public goods (Ostrom 1990). Ostrom developed the SESF with the intention of applying it widely to a variety of resource management problems. However, the application of SESF is mainly limited to common pool resource (CPR) management problems (Leslie et al 2015, Thiel et al 2015). Examples include the management and maintenance of irrigation systems, water management, forest resources, coastal marine systems and fisheries (Basurto et al 2013, Schlüter et al 2014, Leslie et al 2015). As Ostrom intended for broader application of SESF, there is an urgent need to go beyond CPR management problems to address other types of resource (e.g., toll goods, local public goods).
Additionally, the framework is too generic for the assessment of outcomes (e.g., sustainability, resilience, robustness) relating to other variables (Hinkel et al 2014, Schlüter et al 2014). Therefore, the operationalization of the framework is difficult. Recently, Leslie et al (2015) provided an indicator-based quantitative assessment for coupled SES of small-scale fisheries based on SESF. However, Leslie et al (2015) applied the framework to a CPR management problem. Recently, Hinkel et al (2015) developed diagnostic guiding questions to identify complex social-ecological interactions. Addressing complex SES is a wicked problem (DeFries and Nagendra 2017) that has no clear-cut solution. Collaborative processes engaging diverse stakeholders are highly useful for addressing such wicked problems. Further work is needed to represent social-ecological interaction incorporating recent developments in the literature while going beyond traditional CPR management problems.
Floodplain management (Auerbach et al 2015, Hossain et al 2015, Mutahara et al 2018, van Staveren et al 2017, Gain et al 2017a, Masud et al 2018) in the Ganges-Brahmaputra delta is an excellent example of complex SES. The coastal embankments and polders (a low-lying tract of land enclosed by embankments) in the Ganges-Brahmaputra delta are considered to be local public goods. Coastal floodplains are ecologically diverse and vital sources of livelihood for rural people in the Ganges-Brahmaputra delta (Roy et al 2017). Both natural and anthropogenic forces, such as climate change induced sea level rise, upstream water withdrawal, shrimp aquaculture; and the social conflicts between different land use groups and institutions are playing essential roles in the changes in social and ecological systems in the southwest part of the Ganges-Brahmaputra coastal area. Such dynamic physical and anthropogenic processes are also linked to the historical evolution of water management practices from temporary earthen embankments to depoliticized community-based water management (Dewan et al 2015, Roy et al 2017, Gain et al 2017b). Although floodplain management considers social-ecological interactions, until recently, either ecological or institutional dimensions were studied separately (Auerbach et al 2015, Hossain et al 2015, Mutahara et al 2018, van Staveren et al 2017, Gain et al 2017a, Masud et al 2018). Ostrom's diagnostic approach has high potential for exploring the dynamics of social-ecological interaction in tidal river management in the Ganges-Brahmaputra delta.
The objective of this study is to diagnose the performance of the coastal floodplain SES in the Ganges-Brahmaputra delta by developing and assessing indicators based on Ostrom's multi-tiered SESF (Ostrom 2007, 2009, McGinnis and Ostrom 2014) attributes and variables. Compared to previous studies, this study goes beyond CPR management and addresses the management of local public goods. The coastal embankments and polders (or floodplains) in the Ganges-Brahmaputra delta are local public goods characterized mainly by 'non-excludability' (meaning it is difficult or costly to exclude third parties from benefiting) and 'non-rivalness'(meaning consumption by one consumer does not prevent simultaneous consumption by others). The updated version of Ostrom's diagnostic framework, based on recent developments by Hinkel et al (2014), McGinnis and Ostrom (2014), Schlüter et al (2014) is used here as an analytical framework.
2. Study area
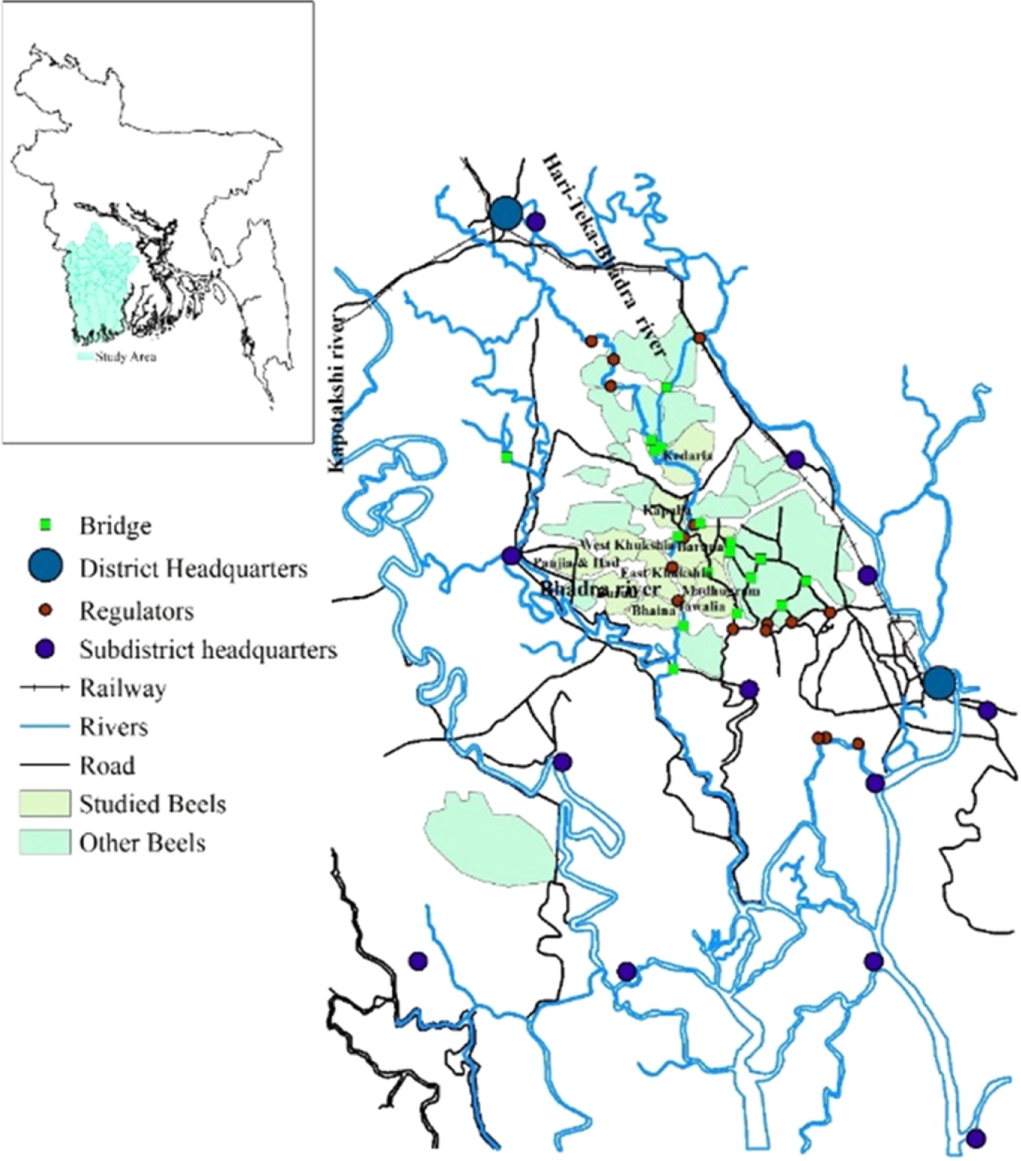
To assess social-ecological interdependencies, we consider coastal floodplains or low depression areas (also locally known as beels - we use this term hereafter) of the Hari-Teka-Bhadra and Kobadak river catchment in the southwest part (Khulna and Jessore districts) of the Ganges-Brahmaputra-Meghna (GBM) delta in Bangladesh as the study area (See figure 1). We have previously conducted extensive research in the study area (Roy et al 2017, Gain et al 2017a), and peer-reviewed documentation is available (Auerbach et al 2015, Hossain et al 2015, Mutahara et al 2018, van Staveren et al 2017, Masud et al 2018) for the area.

Figure 1. Location of study area in the coastal floodplains or beels of the Ganges-Brahmaputra delta.
Download figure:
Standard image High-resolution imageThe catchment includes 17 unions (the lowest administrative boundaries in Bangladesh) of 5 sub-districts within Khulna and Jessore districts. There are 35 beels in the Khulna and Jessore districts of the GBM delta. Social-ecological interactions have been evolved due to changes in floodplain management in these beels.
Until 1950, the floodplain was natural, meaning that beels were connected with rivers for sedimentation. Local people guided by the landlords (locally known as zamindars) were responsible for managing the floodplain, and in particular for the construction of temporary low earthen embankments around tidal flats during the eight dry months of the year.
After a series of massive flood events in the 1950s, the government constructed 4000 km of embankments to protect agricultural land from flooding with the aim of increasing agricultural production in the floodplains (Roy et al 2017). The natural floodplain is thus compartmentalized into several polders by embankments. The floodplains and polders are managed mainly by the Bangladesh Water Development Board, a central authority of Bangladesh, without involving local people (Ishtiaque et al 2017). The coastal polders were initially highly beneficial for increasing agricultural production and reducing flood risk. However, the hydrological connectivity of floodplains was lost due to embankment/dikes, the natural sedimentation process in the floodplain was hindered and the navigability of the river was reduced. In addition, the upstream development (e.g., construction of the Farakka dam in India during 1976) reduced freshwater supply in the rivers. As a consequence, the beels experienced severe water logging in the floodplain and low navigability in the rivers during the 1980s.
Reflecting on the experience of traditional water management practices by zamindars, local people inundated floodplains temporarily in the 1990s by breaching or cutting away embankments (or dikes) to allow tidal flows in the floodplain. This approach is termed 'tidal river management' (TRM) (Auerbach et al 2015, Hossain et al 2015). TRM has high potential for achieving sustainability of the coastal floodplains in the Ganges-Brahmaputra delta. The central authority implemented TRM in few beels during the first decades of the twenty-first century (2000–2010) with limited success.
3. Methods
For assessing the SES of the coastal floodplain in the Ganges-Brahmaputra delta, we used a revised version of Ostrom's (Ostrom 2007, 2009, Hinkel et al 2014, McGinnis and Ostrom 2014, Schlüter et al 2014) diagnostic framework. The focal SES is defined and the indicators are selected based on Ostrom's framework, the guiding questions of Hinkel et al (2015) and a field survey through the engagement of stakeholders.
3.1. Theoretical framework–Ostrom's diagnostic approach
Moving beyond panaceas, the SESF was initially designed for diagnosing (or identifying) the critical interactions of SES that drive sustainability challenges (Ostrom 2007, 2009). The SESF includes four main variables (resource systems (RS), resource units (RU), governance systems (GS), actors (A)), two exogenous variables (related ecosystems (ECO) and social, economic, and political settings (S)) and the focal action situation (which includes interactions (I) & outcomes (O)) (McGinnis and Ostrom 2014). According to Hinkel et al (2014) and Schlüter et al (2014), the RU is an attribute of RS and not a main variable. They also suggested that the two remaining exogenous variables, social economic and political settings (S) and related ecosystems (ECO), are attributed to the concept 'environment' because these are, by definition, external to the focal SES analysed. Additionally, interactions (I) and outcomes (O) are not included in the main variable because these are better treated as metrics and process relationships. In this study, we implement these suggestions and consider four main variables of SES: resources systems, environment, GS, and actors (See figure 2).

Figure 2. Social-ecological system framework.
Download figure:
Standard image High-resolution image3.2. Defining focal social-ecological systems
To define focal SES, we considered the guiding questions originally designed by Hinkel et al (2015). The coastal floodplain and embankment management problems in the Ganges-Brahmaputra delta are represented based on guiding questions and are summarized in table 1.
Table 1. Diagnosing coastal floodplain management problem based on guiding questions.
| Diagnostic variables | Complex coastal floodplains |
|---|---|
| Key problem | Can floodplain management using temporary and partial removal of embankments (or polders) enhance the performance of coastal floodplains SES? |
| System boundaries | The coastal floodplain SES of Ganges-Brahmaputra delta includes embankments, floodplains and rivers |
| Actors | Main actors are local farmers, fishermen, members of the pannee committee, Bangladesh Water Development Board, Local Government Engineering Department, local governments, Institute of Water Modelling, researchers. |
| Benefits | To solve waterlogging problems from the beel and to restore navigability in the nearby river |
| Resources systems | Vast stretches of floodplains that are enclosed by embankments; |
| Resources Units | Available sediment in the floodplain |
| Collective goods | Embankment/polders, |
| Subtractability | Low subtractability; |
| Provisioning action situation | BWDB and local stakeholders maintain coastal polder systems by temporarily inundating floodplains |
| The institutional response to provisioning action situation | involving members of Pannee committee and local stakeholders along with relevant agencies for planning and designing of TRM operation |
| Appropriation action situation | Extracting water and sediment from rivers |
In the guiding questions, the first question is to set the key problem. The key problem(s) is selected based on the literature review, a site visit and interaction with key stakeholders. The coastal floodplain system has three critical resources: embankments or dikes, floodplains (or beels), and rivers. The embankments and rivers are considered to be local public goods, while floodplains (or polders or beels) are owned by local people. The economic and social benefits of floodplains (privately owned) depend on the maintenance of the embankments and rivers. This maintenance is carried out by a central authority (i.e., Bangladesh Water Development Board) without the involvement of members of the local community. For coastal floodplains and embankment management, the following problem has been considered: Can floodplain management using the temporary and partial removal of embankments enhance the performance of coastal floodplain SES?
After defining the key problem(s), the boundaries of the system are identified and appropriate actors of diverse groups who well-represent the problem are selected. Based on the research question, we define the boundary of our focal SES to include the tidal floodplain systems of south-west coastal Bangladesh in the Ganges-Brahmaputra delta consisting of embankments, floodplains, and rivers. Earthen embankments enclose the floodplains, which include agriculture and shrimp aquaculture practices, for protection from river flooding. The following external factors outside the focal systems affect coastal floodplains: upstream water, freshwater withdrawal, climate change induced sea level rise and flooding. These external factors are required to consider cross-scale dynamics (Cash et al 2006) of the system.
After setting the physical boundaries of the systems, we define the key actors of the focal system along with power relations and participation in the management of the system. The main actors are local farmers and fishermen, members of the pannee committee, state agencies such as the Bangladesh Water Development Board (BWDB) and Local Government Engineering Department (LGED), local governments, several vital institutions such as the Center for Environmental and Geographic Information Services, Institute of Water and Flood Management, Institute of Water Modelling, Khulna University, and individual researchers. The actors are identified based on our prior experience to the study area.
It is next essential to identify the benefits that the actors are receiving from the focal systems and to select the collective goods (or stock or RU) that generate these benefits. The benefits of TRM are two-fold: (i) sediment deposition to resolve waterlogging in the floodplain (or beels) and (ii) erosion in the riverbeds to restore navigability. The next step is to define RS by identifying biophysical and/or technological processes involved in the generation of the RU. The RS are the vast stretches of floodplains that are enclosed by embankments that protect them from the flooding of nearby rivers. The RU are the sediment deposited in the floodplain through TRM.
It is next important to identify the appropriation-related governance challenges (in which the actors face a collective challenge to avoid the overuse of a collective good) by characterizing the variables of RS and RU and, eventually, institutional arrangements (by operationalizing actors and GS) for the appropriation action situation. The main collective good is the embankment, which is characterized by low subtractability and low excludability. The focal appropriation action situation is the heterogeneous distribution of sediments in the floodplain and the low navigability of rivers. For an institutional response to the appropriate action situation, the BWDB was mainly responsible for (i) cutting the embankment and (ii) selecting floodplains (or beels) for TRM operations without involving local stakeholders. Similarly, we need to define the provisioning action situation (in which users face a collective challenge to create, maintain or improve a collective good) and institutional arrangements for the provisioning action situation. For CPR management, the appropriation action situation is dominant, while the provisioning action situation is vital for the management of public goods. In this case, the provisioning action situation prevails. The provisional action situation is the homogeneous distribution of sediments throughout the beels to solve waterlogging problems in the floodplains and low navigability in the rivers through the proper selection of beels, appropriate cutting points, and suitable duration of TRM operations. The institutional response to the provisioning action situation includes involving members of the pannee committee and local stakeholders along with relevant agencies to plan and design the TRM operations.
3.3. Selection of indicators
To select indicators, we began by updating the second-tier factors proposed by Ostrom (2009) according to recent modifications suggested by McGinnis and Ostrom (2014), Hinkel et al (2014) and Schlüter et al (2014). We then selected appropriate indicators for the RS, the environment, GS and actors based on the above guiding questions, which we followed by conducting field visits and stakeholder engagement workshops. The definition of the indicators and their notion is shown in table S1 is available online at stacks.iop.org/ERC/1/051003/mmedia of the online supplementary material.
3.4. Assessment of spatial and temporal variation
To incorporate the temporal evolution of floodplain management, we consider four different time periods: until 1960 (floodplain managed by local people and landlords); 1960–1979 (construction of embankment, managed by BWDB); 1980–1999 (severe water logging & introduction of TRM); current period (2000- today, characterized by implementation of TRM).
To incorporate spatial variation, we considered four different beels: Beel Bhaina (where TRM was successfully implemented by local people); East Beel Khuksia (BWDB implemented TRM); Beel Kapalia (A non-TRM beel); and Beel Pakhimara (an ongoing TRM). The selected beels are shown in figure 1.
3.5. Data collection
For indicator selection and data collection, we adopted a mixed method approach primarily involving a qualitative case study design based on four workshops, stakeholder interviews, and site visits along with quantitative data from secondary sources and published articles (Auerbach et al 2015, Hossain et al 2015, Mutahara et al 2018, van Staveren et al 2017, Gain et al, 2017a, Masud et al 2018). Field surveys (workshops, interviews and site visits) were conducted during May-November, 2018. Stakeholder engagement workshops were held in four selected beels: Bhaina, East Beel Khuksia, Beel Kapalia, and Beel Pakhimara, with approximately 15 participants from each beel. In addition, 20 stakeholder interviews (5 interviews per beel) were carried out to collect individual perceptions of selected indicators. The participants in the workshops and interviews were from diverse occupational group (e.g., farmers, fishers, teachers, members of local government, water managers, and housewives). They were selected based on our prior experiences on coastal floodplain management and through the 'snowball' sampling approach, where interviewed participants suggest other relevant participants. The minimum age for the participants was set to 55 (born in 1963 or before), and they were permanent residents of the beel. They had witnessed the changes in the indicators (see Tables S1) during three different time periods (1960–79, 1980–99, 2000-today), while the information prior to 1960 was based on their perception which came from their predecessors.
4. Results and discussion
4.1. Temporal dynamics of social-ecological systems
We evaluate the temporal evolution of each of the selected indicators of coastal floodplain SES in the Ganges-Brahmaputra delta, Bangladesh, for four different period. The qualitative performance of coastal floodplain SES is summarized in table 2.
Table 2. Temporal variation for the performance of coastal floodplain SES in the Ganges-Brahmaputra delta.
| Main components | Indicators | Current period (2000–18) | 1980–1999 | 1960–79 | Before 1960 |
|---|---|---|---|---|---|
| Resources Systems | Biophysical factors | Less favorable | Not favorable | Moderate | High |
| Predictabilityy | High | Moderate | Low | Low | |
| Discharge | Low flow | Very low | Moderate | Adequate | |
| Flow velocity | Low | Very low | Moderate | Adequate | |
| Salinity | High | Very high | Moderate | Very low | |
| River width | Low | Very low | Moderate | Adequate | |
| River depth | Low | Very low | Moderate | Adequate | |
| Sediment deposition | Low | Very low | Moderate | Adequate | |
| Spatial distribution of sediment | Low & evenly distributed | Very low and unevenly distributed | Medium and unevenly distributed | High and evenly distributed | |
| Environment | SLR | High | High | Moderate | Very low |
| Flood | Frequent flooding | Permanent waterlogging | Less frequent but intense flood | Frequent but less damaging flood | |
| Changes in the river flow | Changes due to upstream withdrawal & increased high water demand | Changes due to upstream withdrawal & water demand | Changes due to upstream withdrawal | Natural flow; Not major changes | |
| Agricultural production | Moderate | Moderate | High | Very low | |
| Shrimp market demand | Moderate demand | Very high | Low demand | Very low demand | |
| Governance system | Social Monitoring | Low monitoring | High monitoring | No monitoring | No monitoring |
| Biophysical monitoring | Low monitoring | High monitoring | No monitoring | No monitoring | |
| Operational rule | Low operational rules | Low operational rules | High operational rules | No operation rules | |
| Horizontal network | Low structure | Moderate structure | Very good horizontal network | Strong horizontal network | |
| Vertical network | Moderate structure | Low structure | Low structure | No vertical institutional linkages | |
| Government organization | Mainly BWDB, but also few other organizations involved | Mainly BWDB, but also few other organizations involved | Only BWDB involved | No government formal institutions involved | |
| NGO | Many | Many | Only few NGO involved | NO NGO involved | |
| Cooperative societies | Many | Many | Only few NGO involved | No cooperative society | |
| Actors | Social capital | Low | Moderate | Moderate | High |
| Trust | Low | Moderate | High | Very high | |
| Knowledge base | High knowledge base | Moderate knowledge base | Moderate knowledge base | Low knowledge base | |
| Leadership | Low leadership | Moderate leadership | High leadership | United and guided and leadership |
The results for the RS indicate that the 'biophysical factors' (BioPhyFac) such as geomorphology and climatic conditions were 'highly favourable' during the period until 1960. The performance started deteriorating afterward and became 'moderate' in 1960–1979. However, performance was the worst ('not favourable') in 1980–1999. After introducing the TRM approach, the BioPhyFac slightly improved and became 'less favourable' in the current period (2000–2018). Due to the absence of modern technologies, the predictability (Pred) of system dynamics was 'very low' during the period prior to 1980, while it increased in 1980–99 and became 'very good' during the current period (2000–2018). The discharge (Disc), flow velocity, width (WidthR) and the depth (DepthR) of the river and sediment deposition (Sed, SpatSed) in the floodplain was 'adequate' during the period prior to 1960. Because there was no artificial barrier between the floodplains (beels) and the rivers, the river flow was natural. However, due to a sudden structural intervention including the construction of coastal embankments, the performance of these indicators decreased ('moderate') during 1960–79, and became 'very low' in 1980–99 due to siltation in the riverbed by retardation of the upstream river flow and the deprivation of silt deposition in floodplains. Due to the introduction of TRM (Seijger et al 2018), the performance of these indicators has slightly improved compared to the early 1980s, but the value is still 'low'. According to local residents, the level of salinity (Salin) in the surrounding river was 'very low' during the past period (before 1960). However, the value slowly increased over time and recently became 'very high'. The increased salinity in the coastal floodplains is also found by Mirza (1998), Brammer (2014), Gain and Giupponi (2014).
According to local perceptions, the impact of sea level rise (SLR) was 'very low' until 1960, became 'moderate' in 1960–1979 and 'high' during 1980–1999 and the current period (2000–2018). The perception of local people is also consistent with the recent study carried out by Brammer (2014). Until 1960, high frequency, but low damaging flood (Flood) events were regular which were helpful for floodplain ecosystem, especially for sediment deposition. After construction of embankment, the flood events were less frequent but highly damaging during 1960–79. Permanent flooding (i.e., waterlogging) started during the 1980s. This permanent water logging in 1980–99 is associated with the levee effect (Di Baldassarre et al 2015, Mård et al 2018). After introducing the TRM approach, permanent waterlogging problems are slightly improved in the current period (2000–2018). Until 1960, no major upstream intervention took place and hence the river flow was natural without major changes (ChanFlow). During 1980–99, changes in the river flow occurred due to the construction of the Farakka dam (Gain and Giupponi 2014) and increased agricultural demand. Due to upstream water withdrawal and increased water demand, the changes in river flow (ChanFlow) are higher during the current period (2000–2018) than before. Agricultural production (AgrPro) was 'very low' until 1960 because only single-crop and low-productive indigenous rice varieties were planted. AgrPro was 'very high' during 1960–79 and 'moderate' during both 1980–99 and the current period (2000–18). During 1960–79, the single-crop areas were converted to two or even three crops per year, and agricultural production increased by 2–3-fold (Gain et al 2017a). Outside market demand for shrimp (ShrimpMarkDem) was very low until 1980 but increased dramatically in 1980–99 before slightly reducing in the current period (2000–2018).
For the governance system, there was no social or biophysical monitoring (SocMon and BioPhyMon) mechanism prior to 1960 or during 1960–79. After the introduction of the TRM approach, the social and biophysical monitoring (SocMon and BioPhyMon) mechanism was 'high' during 1980–99 but became 'low' again in the current period (2000–2018). During 1980–99, social and biophysical monitoring was conducted by local people, especially through a local committee called the Paani Committee (PC). The PC monitored the free flowing of river water inside the beel. However, the active role of the PC has been significantly reduced in the current period. There was no operational rule (OperRul) until 1960, but after the construction of embankments, OperRul was 'high' during 1960–79. The operational rules include the operation and maintenance of embankments by employing sluice gate managers in the floodplain. However, the government funds for employing sluice gate managers were not available after the 1980s (Dewan et al 2014). Hence, the operation and maintenance (OperRul) of embankments and sluice gates became low both in 1980–99 and 2000–18 (current period). As the interaction among local people and their leader was very high , the horizontal network (HoriNet) structure was 'strong' until 1960. The performance of HoriNet slowly reduced over time ('moderate' in 1980–99 and 'low' in the current period). Before 1960, there was no central authority to manage the coastal floodplain. Thus, the vertical network structure (VertNet) was absent. Additionally, there was no role (or a negligent role) of government organizations (GO), non-government organizations (NGO) and cooperative societies (CopSoc). During 1960–79, a vertical network (VertNet) was available, but there was no collaboration between the locals and government authority. The floodplain was mainly governed solely by the GO, BWDB. During this period, Bangladesh Rural Advancement Committee was the only active NGO. The PC and Krishak Songram Shamity were initially formed and started to act as cooperatives (CopSoc). In 1980–99, the VertNet moved from no collaboration to supervision. In addition to BWDB, other GOs such as the Department of Agricultural Extension (DAE) and LGED started working. During this period, the waterlogging problem was severe, and hence the project activities, as well as NGO activities, were high. Water management groups and water management associations such as CopSoc were formed during this period. In the current period (2000–2018), VertNet moved from supervision to consultation. Along with DAE and LGED, other GOs such as the Department of Fisheries, the Department of Social Services, the Bangladesh Rural Development Board, and the Department of Youth Development are active in these areas. In addition, many NGOs and CopSoc are involved in development activities.
For the actors, social capital (SocCap) was 'good' until 1960 due to high interaction among community members. During this period, local people had 'high' level of trust (Trust) in the management system. They were more united under the leadership (Lead) of local landlords or zaminders. However, during this period, they had a low knowledge base (KnowMen) about the system due to a low literacy rate. During 1960–79, trust and reciprocity decreased ('moderate' levels) compared to earlier. The role of SocCap and Lead has also reduced, but that of KnowMen has increased. In 1980–99, SocCap was weak compared to earlier due to the nuclear family, education and self-sufficiency. The role of Trust and Lead significantly reduced ('low'). In the current period, the performance of SocCap, Trust and Lead have become very weak, but KnowMen among the local people has increased significantly.
To summarize and compare the changes in performance for all the selected indicators, we convert the qualitative values (see table 2) into a same comparable scale [0,1] using the value function approach. Value functions are mathematical representations of human judgements that make it possible to treat people's values and judgements explicitly, logically and systematically (Beinat 1997). In the value function, the value 1 represents the best performance of the indicator, while 0 indicates worst performance. The intermediate values 0.25, 0.50 and 0.75 refer to very low, moderate and high performance, respectively. Using this normalization approach, the comparative performance of the indicators for different periods is shown in figure 3. The results indicate that the performance of the RS was very good during the period prior to 1960. During 1960–79, the performance significantly reduced compared to the prior period (until 1960), and it was worst during 1980–99. Since the introduction of the TRM approach in several beels, the situation has slightly improved in the current period. The performance of the environmental indicators was also very good prior to 1960. The performance was worse in 1960–79 and it further deteriorated in 1980–99 and in the current period. The performance of the governance system was very low during the past period, and it increased gradually. The performance of actors was very good during the period prior to 1960 due to a strong horizontal network, but performance gradually decreased over time.

Figure 3. Comparative performance of selected SES indicators for different time period: (a) current period (2000–2018); (b) waterlogging era (1980–1999); (c) structural intervention period (1960–1979); (d) past period until 1960 (here 0 refers worst performance, while 1 refers best performance). See the list of indicators in table 2.
Download figure:
Standard image High-resolution image4.2. Spatial variation in social-ecological systems
After the introduction of the TRM approach, the performance of SES has improved in the coastal floodplain. However, the TRM approach was implemented in only few beels, with mixed experiences. Therefore, we compare the performance of the coastal floodplain SES in four different beels: Bhaina, East Beel Khuksia, Kapalia, Pakhimara (see figure 1). In Beel Bhaina, TRM was successfully implemented by local people in 1997. In East Beel Khuksia, TRM was implemented by BWDB and was partially successful. Beel Kapalia is a non-TRM Beel, where TRM has not yet been implemented. Pakhimara is an ongoing TRM beel. The qualitative performance for different coastal floodplain SES is summarized in table 3.
Table 3. Spatial variation for the performance of coastal floodplain SES in the Ganges-Brahmaputra delta.
| Main components | Indicators | Beel bhaina | East beel khuksia | Beel kapalia | Beel pakhimara |
|---|---|---|---|---|---|
| Resources Systems | BioPhyFac | Less favorable | Less favorable | Less favorable | Less favorable |
| Pred | Highly predictable | Highly predictable | Highly predictable | Highly predictable | |
| Disc | Low flow | Low flow | Low flow | Moderate | |
| size | Small | High | Medium | Medium | |
| prod | Highly productive | Highly productive | Low productive | Low productive | |
| WidthR | Low width | Low width | Low width | Good width | |
| DepthR | Low depth | Low depth | Low depth | Good depth | |
| Sed | High | Moderate | Very low | Low | |
| SpatSed | High and unevenly distributed | Low & evenly distributed | Very low and unevenly distributed | Low & evenly distributed | |
| Environment | SLR | High | High | High | High |
| Flood | Frequent but not permanent flooding | Frequent but not permanent flooding | Frequent but not permanent flooding | Frequent but not permanent flooding | |
| ChanFlow | Upstream withdrawal plus increased high water demand | Upstream withdrawal plus increased high water demand | Upstream withdrawal plus increased high water demand | Upstream withdrawal plus increased high water demand | |
| AgrPro | Moderate development | Moderate development | Moderate development | Moderate development | |
| ShrimpMarkDem | Moderate demand | Moderate demand | Moderate demand | Moderate demand | |
| Governance system | SocMon | Low monitoring | No monitoring | No monitoring | No monitoring |
| BioPhyMon | Low monitoring | No monitoring | No monitoring | No monitoring | |
| OperRul | No operational rules | Low operational | Low operational | Low operational | |
| HoriNet | Moderate Horizontal structure | Low horizontal structure | Low horizontal structure | Low horizontal structure | |
| VertNet | Low | Low structure | Low structure | Low structure | |
| GovOrg | Many | Many | Many | Many | |
| NGO | Many | Many | Many | Many | |
| CopSoc | Many | Many | Many | Many | |
| Actors | SocCap | Moderate | Low | Low | Low |
| Trust | Moderate | Low | Low | Low | |
| KnowMen | High knowledge base | High knowledge base | High knowledge base | High knowledge base | |
| Lead | Moderate leadership | Low leadership | Low leadership | Low leadership |
Biophysical factors (BioPhyFac) are less favourable for all four beels. The predictability (Pred) of system dynamics is very high for all the beels. Beel Bhaina is adjacent to the Hari River. The sizes of the beels is 592 ha (small), 1090 ha (high), 887 ha (medium) and 693 ha (medium) for Bhaina, East Beel Khuksia, Kapalia and Pakhimara, respectively. The cut-offs (i.e., small, medium, high) are determined based on consultation with stakeholders: less than 650 ha is 'small', 650–900 ha is medium and above 900 ha is high. It is easier to manage smaller size SES. The discharge (Disc), width (WidthR) and depth (DepthR) of the surrounding river is very low for Bhaina, East Beel Khuksia, and Kapalia, but 'moderate' in Pakhimara. Agricultural production is 'high' for Bhaina and East Beel Khuksia but 'low' in Kapalia and Pakhimara. The sediment deposition is 'high' in Bhaina, 'moderate' in East Beel Khuksia, but 'low' in Kapalia and Pakhimara. In Beel Bhaina, sediments carried by the Hari River were deposited inside the basin, causing massive scouring of the riverbed downstream of Beel Bhaina.
All four beels are located in the same river system. Therefore, the environmental indicators are applicable to all four beels: sea level (SLR) is high; flooding (Flood) events became frequent, but permanent waterlogging is solved; river flow (ChanFlow) has significantly changed due to upstream withdrawal and high water demand; agricultural development (AgrDev) and shrimp market demand (ShrimpMarkDem) are moderate.
Regarding their governance system, the people in Beel Bhaina had formal or informal property rights. They developed social (SocMon) and biophysical monitoring (BioPhyMon) mechanisms and graduated sanctioning systems to maintain their operational rules (OperRul) to some extent (i.e., maintaining gates opening and closing). However, there is no social monitoring mechanism or graduated sanctioning system in the other three beels. For example, although free flowing water carrying sediments need to be passed throughout the beel during TRM operation, some people in East Beel Khukshia and Beel Kapalia practised shrimp culture by constructing illegal nets, which hindered the natural process of sedimentation. The horizontal network structure (HoriNet) was moderate in Beel Bhaina but low in other three beels. There are different GOs and NGOs in all four beels. Cooperative societies such as the Water Management Federation, the Water Management Association and the Water Management Groups were formed during the Khulna Jessore Drainage Rehabilitation Project project, and later on, these cooperatives were responsible for managing the beel. However, currently, they do not play an active role.
The people in Beel Bhaina have developed norms of trust (Trust) and reciprocity. Compensation was not paid to the landowners in Beel Bhaina (who gave their land for the project), even though the implementation of the TRM project was successful without the intervention of government. Only high levels of trust and reciprocity can contribute to such a successful project, which was further taken as a role model for TRM in other beels. The lack of trust and reciprocity in the other three beels was evident. The locals also found political influence as a driver of less social bonding among the local people. Heterogeneous preferences among different stakeholders acted as the main barrier to collective action. Local leaders in Beel Bhaina played an important role in this case with their leadership power.
The performance for all the indicators is summarized in table 3. Normalizing qualitative performances into a 0, 1 scale ('0' being worst performance, while '1' refers to the best performance), we compared the performance of all four beels, which is shown in figure 4. The results indicate that the performance is relatively better for Bhaina than for other three beels.

Figure 4. Comparative performance of selected SES indicators for different time periods: (a) current period (2000–2018); (b) waterlogging era (1980–1999); (c) structural intervention period (1960–1979); (d) period prior to 1960 (here, 0 refers to worst performance, while 1 refers to best performance). See the list of indicators in table 3.
Download figure:
Standard image High-resolution image
5. Conclusion
In this study, we assess the temporal and spatial dynamics of coastal floodplain SES in the Ganges-Brahmaputra delta by using the novel approach of Ostrom's diagnostic framework. Our assessment has several novelties. First, we go beyond CPR management and consider a local public good while using Ostrom's diagnostic approach. Until recently, the use of an SESF was mainly limited to CPR management (Thiel et al 2015), which is dominated by an appropriation action situation in which the actors face a collective challenge to avoid the overuse of a collective good (Hinkel et al 2015). In this case, the coastal floodplain SES of the Ganges-Brahmaputra delta consisting of floodplains (or beels), embankments and rivers are considered to be a local public good where the provisioning action situation is dominant and actors face a collective challenge to create, maintain, or improve a collective good. Prior to 1960, the provisioning services for coastal floodplain were provided by local people led by zamindars, while the GO, BWDB was responsible for this service until 1999. After the introduction of TRM, mainly local people and BWDB provide the services. The performance of the SES indicators changed over time mainly due to the different interactions between providing agents (e.g., BWDB) and beneficiaries (e.g., local people), along with changes in the resource condition, community attributes and institutions (Bisaro and Hinkel 2016)
Second, we considered the recent development of the initial framework of Elinor Ostrom (Ostrom 2007, 2009). The latest development includes following four main components of SES: resources systems, environment, GS and actors. This modification is based on significant revision carried out by McGinnis and Ostrom (2014), Hinkel et al (2014) and Schlüter et al (2014). Third, we considered guiding questions originally developed by Hinkel et al (2015). The guiding questions are highly useful for defining complex SES, for identifying appropriate indicators and for selecting a provisioning action situation by engaging stakeholders. The innovative approaches in this study (updated version of diagnostic procedure, guiding questions to define the focal SES and application to local public goods) can potentially be used in the fields of sustainability science and SES science. Our results provide a comparative performance for coastal floodplain SES in the Ganges-Brahmaputra delta.
The results for the qualitative performance of each of the selected representative indicators are useful for identifying intervention options to achieve the sustainability outcomes of the coastal floodplain SES. Applying the TRM approach through engaging stakeholders can be highly valuable for improving the performance of RS and the environment, as the TRM approach has significant potential for increasing navigability in the river and sediment deposition in the floodplain, while increasing communication among local people and increasing vertical and horizontal collaboration among institutions can enhance the performance of GS and actors. To improve the performance of RS, the environment, governance and actors in the Ganges-Brahmaputra delta, the provisioning services (e.g., management of coastal embankments, rivers and floodplains) need to be improved through collaboration between government agencies, local actors and other relevant organizations. Bangladesh has formulated a longer term strategy (up to 2100) of Delta Development (GoB 2014). For a positive outcome, the results of this study, especially for improving the performance of coastal floodplain SES, can potentially be useful for the Delta Plan.
Our assessments of coastal floodplain SES may also be helpful in other developing and developed countries. In the Netherlands, river widening and depoldering have taken place at various locations, and this could help the restore flood dynamics in widened floodplains (van Staveren and van Tatenhove 2016). Temporarily restoring flood dynamics and capturing sediments in polders to increase land height were also practised in Westerschelde delta located in Belgium (Cox et al 2006, Maris et al 2007) and the Sacramento-San Joaquin in the United States (Bates and Lund 2013).
In this study, we evaluate the performance of SES indicators based on the perceptions of local people. Hence, the findings do not represent actual quantitative measurements. The results might not avoid subjectivity and biasness among the stakeholders. Further, we do not provide a dynamic assessment of the interaction and outcomes of SES by linking higher- and lower-tier variables. Further research is needed to assess the interaction and outcomes of coastal floodplain SES using advanced methods such as network analysis, system dynamics and agent-based modelling. This research provides guidance on coastal floodplain SES in terms of how provisioning services can potentially improve the performance of RS, the environment, GS, and actors and achieve greater long-term sustainability.
Acknowledgments
This research is funded by the cluster of excellence, 'The Future Ocean' (Project Number CP1778). We would like to acknowledge Mohibullah and Md. Mahedi Al Masud for the field survey.