


Abstract
Detailed epidemiology of Chronic Respiratory Diseases (CRDs) and of their risk and protective factors is needed to plan preventive interventions to reduce the burden of CRDs on population health. This study determines the prevalence of doctor-diagnosed CRDs and its associated factors in the adult Italian population.
Data was collected from adults participating in the ongoing cross-sectional Italian Behavioural Risk Factor Surveillance System (PASSI) between 2013 and 2015.
Among 108 705 respondents, 7.0% reported a CRD (3.4% asthma, 2.6% COPD, 1.0% Asthma-COPD Overlap Syndrome). Current smoking was more frequent in the group with CRD compared to those without (30.8% vs. 25.2%, P < 0.001), as was physical inactivity (41.9% vs. 36.4%, P 0.009) and overweight/obesity (52.4% vs. 41.4%, P 0.009). Adults with CRDs also reported appropriate perception of insufficient physical activity and excessive body weight, adopted protective behaviours and received preventive interventions more often than those without CRDs.
Italian adults with CRDs are more likely to be exposed to aggravating factors but are also knowledgeable of their condition and amenable to behaviour change. Since effective interventions for modifying these factors are available, there is an opportunity to reduce the significant disease burden of CRDs through specifically targeted health promotion interventions.
Introduction
Chronic respiratory diseases (CRDs) comprise multiple diseases of the airways and lungs, such as asthma, chronic obstructive pulmonary disease (COPD), sleep apnea syndrome and other lung diseases arising from occupational exposure. While these conditions differ in their aetiology, anatomical and functional alterations, clinical course and treatment, they share several common factors, acting both as aggravating and risk factors, in people with and without CRDs, respectively. Collectively CRDs are associated with a significant burden on healthcare systems, as well as on society.1–4 Overall, the impact of CRDs on population health could be improved through the reduction of risk/aggravating factors, in particular, tobacco smoking, second-hand smoke, indoor and outdoor air pollutants, occupational agents, overweight/obesity and physical inactivity, along with the implementation of preventive measures, such as flu vaccination, and appropriate treatments. Indeed, effective management plans have been shown to reduce morbidity and mortality from these diseases.1
The main objective of these analyses is to provide an updated estimate of CRDs in the adult Italian population (18–69 years) utilizing data from the Italian behavioural risk factor surveillance system (BRFSS), PASSI (Progressi delle Aziende Sanitarie per la Salute in Italia). The specific objectives are (i) to estimate the prevalence of CRDs, overall and in different population groups, and (ii) to assess the occurrence of modifiable risk/aggravating factors for CRDs, protective individual behaviours and preventive interventions in people with and without CRDs to better target new policies.
Methods
PASSI is an ongoing cross-sectional Italian BRFSS. The sample for the survey is extracted from the Italian adult population 18–69 years old, which comprised 41 057 512 individuals on 1 January 2014.
The unit of data collection for PASSI is the local health unit (LHU). Each of the 20 Italian Regions comprises 1–22 LHUs in charge of providing universal health care, including prevention and treatment services for populations ranging from 40 000 to over one million.
The survey population includes residents in the LHU area (18–69 years) who have a telephone number available (landline or cell phone) and are capable of being interviewed; a sample of potential interviewees is randomly drawn from the enrolment list of residents in each LHU on a monthly basis. People who have moved away or deceased when a contact is attempted, are not considered in the eligible population; other criteria of exclusion are inability to understand Italian, inability to participate in the interview, hospitalisation or institutionalisation and being out of the age range (18–69). The sample is stratified by gender and age (18–34, 35–49 and 50–69 years) proportionally to the size of the respective strata in the general population. Specially trained LHU public health practitioners administer telephone interviews (minimum 25 per month in each LHU) through a standardized questionnaire, gathering information on a wide variety of health-related behavioural and preventive topics along with socio-demographic data. Informed verbal consent is obtained from all the participants. The data are anonymized and electronically recorded in a national database. Interviews collected during a calendar year are aggregated in an annual dataset. The LHUs’ data are merged and analyzed to obtain regional and national estimates. The protocol of PASSI surveillance was approved by the ethics committee of the National Institute of Public Health.5
Annual datasets for the years 2013, 2014 and 2015 were combined to ensure sufficient sample size for exploring population subgroups. During the study period 112 114 people were interviewed in 128 out of 139 (92%) Italian LHUs. The survey participants represented 90% of the Italian population.
In the first weeks of 2013, some LHUs conducted the interviews through a previous version of the questionnaire, which did not allow to distinguish among the different categories of CRDs. We excluded those interviews (3409) and the final analysis was performed on 108 705 records.
The outcome rates were calculated following the guidelines of the American Association for Public Opinion Research (AAPOR).6 The response rate (RR) adjusted for ineligible cases (AAPOR RR4) was 83% in the cumulative 2013–2015 sample (84% in 2013, 83% in 2014 and 82% in 2015). Small variations in the RRs of subgroups were observed in the cumulative 2013–2015 sample: 84% in women, 82% in men; 82%, 82% and 84% in the 18–34, 35–49 and 50–69 years age groups, respectively. Item non-response for the questions on CRDs was negligible (0.1%), as well as for the other variables used in the analysis (never higher than 0.4%). Details about these methodological issues have been described elsewhere.5Figure 1 describes the participants in a flow diagram.
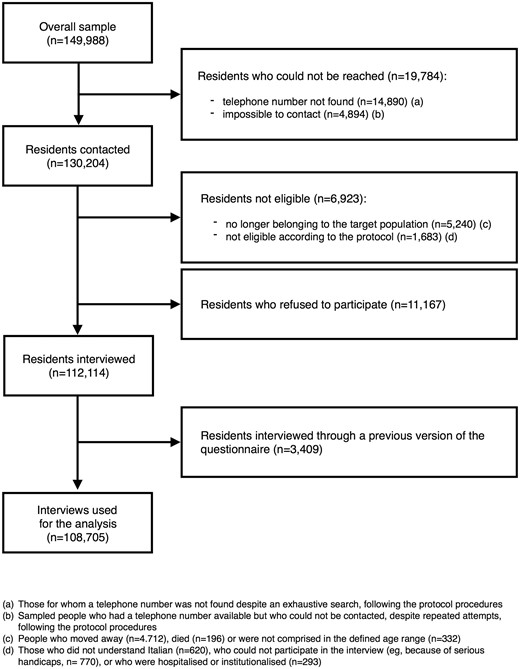
Participants flow diagram
Indicator definitions
Information on CRDs is collected by asking whether the participant has been diagnosed by a physician for (i) asthma and (ii) chronic bronchitis, emphysema or respiratory failure (COPD). According to these questions, four different indicators were created: (a) asthma only, if participants responded ‘yes’ only to question (i); (b) COPD only, if participants responded ‘yes’ only to question (ii); (c) asthma—COPD overlap syndrome (ACOS)7 if participants responded ‘yes’ both to question (i) and to question (ii); (d) any CRD, if participants responded ‘yes’ to question (i) or/and to question (ii).
Information on socio-demographic characteristics, sex, age (18–34, 35–49 or 50–69 years), completed education (none or primary school, middle school, high school, university), economic difficulties (many, some or no difficulties in getting to the end of the month with the available household income) and geographic area of residence (North, Centre or South and major islands, according to the criteria of the Italian National Institute of Statistics) were collected, too. Sex, age and residence were objectively confirmed with the LHUs’ lists. Other indicators are described in Appendix.
Statistical analysis
Percentage estimates were weighted, assigning each record a probability weight equal to the inverse of the sampling fraction in each LHU stratum. Complex survey design analyses were conducted, using the Taylor series method for variance estimation.
The characteristics of the population under study were described through a frequency distribution of the main socio-demographic variables and behavioural risk/aggravating factors. Prevalence of any CRD, and of each component condition, was calculated overall and by socio-demographic characteristics, reporting 95% confidence intervals. A Poisson regression model was used to estimate adjusted prevalence ratios for evaluating the association between CRDs and socio-demographic characteristics.
To allow comparisons with other surveys which used different age strata, we calculated the estimates for the specific age groups presented by those studies, reported in table 2. For the same purpose, since many surveys do not consider ACOS, we reported also the prevalence of total asthma and total COPD, aggregating ACOS subjects, respectively, with people with asthma only and COPD only. Frequency of aggravating factors, protective behaviours and preventive interventions was estimated in those with and without CRDs.
The association between CRDs and modifiable aggravating and protective factors was estimated using Poisson regression to obtain prevalence ratios, crude and adjusted for socio-demographic characteristics. Statistical analyses were performed using the statistical package Stata 13 (StataCorp LP, TX).
Results
The age and sex distributions of the sample (table 1) closely reflect those of the resident population2 for the years and geographical areas considered.
Distribution of socio-demographic characteristics of the Italian adult population; prevalence of any Chronic Respiratory Disease (CRD), Asthma only, Chronic Obstructive Pulmonary Disease (COPD) only, Asthma-COPD Overlap Syndrome (ACOS), by socio-demographic characteristics; association between CRDs and socio-demographic characteristics
| Characteristics | Italian adult population | Any CRD | Asthma only | COPD only | ACOS | |||||
|---|---|---|---|---|---|---|---|---|---|---|
| Proportion of any CRD (%) | – | 100 | 48 | 38 | 14 | |||||
| Mean age (years) | 44.3 | 49.2 | 43.2 | 55.2 | 53.7 | |||||
| (95%CI) | (44.2–44.3) | (48.9–49.4) | (42.9–43.5) | (54.7–55.6) | (53.1–54.4) | |||||
| Distribution | Prevalence | Prevalence | Prevalence | Prevalence | ||||||
| % | % | Adj. PR a | % | Adj. PR a | % | Adj. PR a | % | Adj. PR a | ||
| (95% CI) | (P value) | (95% CI) | (P value) | (95% CI) | (P value) | (95% CI) | (P value) | |||
| Overall | – | 7.0 | 3.4 | 2.6 | 1.0 | |||||
| (6.8–7.3) | (3.3–3.6) | (2.5–2.8) | (0.9–1.0) | |||||||
| Age group | 18–34 | 27.6 | 4.8 | 1 | 3.7 | 1 | 0.8 | 1 | 0.3 | 1 |
| (4.5–5.2) | (3.5–4.1) | (0.6–0.9) | (0.3–0.4) | |||||||
| 35–49 | 34.5 | 5.7 | 1.13 | 3.4 | 0.90 | 1.6 | 2.0 | 0.7 | 1.88 | |
| (5.4–6.0) | (0.006) | (3.2–3.7) | (0.062) | (1.4–1.8) | (≤0.001) | (0.6–0.8) | (≤0.001) | |||
| 50–69 | 37.9 | 9.9 | 1.85 | 3.2 | 0.85 | 5.0 | 5.7 | 1.7 | 3.99 | |
| (9.5–10.3) | (≤0.001) | (2.9–3.4) | (0.005) | (4.7–5.4) | (≤0.001) | (1.5–1.8) | (≤0.001) | |||
| Total | 100.0 | |||||||||
| Gender | Male | 49.4 | 6.8 | 1 | 3.3 | 1 | 2.6 | 1 | 0.9 | 1 |
| (6.5–7.1) | (3.1–3.5) | (2.4–2.8) | (0.8–1.0) | |||||||
| Female | 50.6 | 7.3 | 1.03 | 3.5 | 1.05 | 2.8 | 0.99 | 1.0 | 1.05 | |
| (7.0–7.6) | (0.347) | (3.3–3.7) | (0.290) | (2.5–3.0) | (0.091) | (0.9–1.1) | (0.588) | |||
| Total | 100.0 | |||||||||
| Educational attainment | University | 16.2 | 5.6 | 1 | 3.8 | 1 | 1.4 | 1 | 0.4 | 1 |
| (5.2–6.1) | (3.5–4.2) | (1.2–1.6) | (0.3–0.5) | |||||||
| High school | 46.7 | 6.0 | 0.97 | 3.4 | 0.86 | 1.9 | 1.16 | 0.7 | 1.55 | |
| (5.7–6.3) | (0.541) | (3.2–3.6) | (0.010) | (1.7–2.1) | (0.133) | (0.6–0.8) | (0.007) | |||
| Middle school | 29.5 | 8.0 | 1.08 | 3.4 | 0.83 | 3.4 | 1.43 | 1.2 | 2.01 | |
| (7.6–8.5) | (0.117) | (3.1–3.6) | (0.006) | (3.2–3.7) | (≤0.001) | (1.1–1.4) | (≤0.001) | |||
| Primary school or less | 7.6 | 12.9 | 1.38 | 3.1 | 0.80 | 7.1 | 1.90 | 2.7 | 3.00 | |
| (11.9–14.1) | (≤0.001) | (2.6–3.7) | (0.033) | (6.3–8.1) | (≤0.001) | (2.3–3.2) | (≤0.001) | |||
| Total | 100.0 | |||||||||
| Perceived economic difficultiesb | None | 41.6 | 5.4 | 1 | 3.2 | 1 | 1.6 | 1 | 0.6 | 1 |
| (5.2–5.7) | (3.0–3.4) | (1.5–1.8) | (0.5–0.6) | |||||||
| Some | 41.8 | 7.2 | 1.31 | 3.3 | 1.14 | 2.9 | 1.52 | 1.0 | 1.51 | |
| (6.9–7.6) | (≤0.001) | (3.1–3.6) | (0.005) | (2.7–3.2) | (≤0.001) | (0.8–1.1) | (≤0.001) | |||
| Many | 16.6 | 10.7 | 1.88 | 4.1 | 1.49 | 4.6 | 2.17 | 2.0 | 2.89 | |
| (10.1–11.4) | (≤0.001) | (3.7–4.5) | (≤0.001) | (4.1–5.1) | (≤0.001) | (1.7–2.3) | (≤0.001) | |||
| Total | 100.0 | |||||||||
| Geographic area of residencec | North | 39.5 | 7.0 | 1 | 3.9 | 1 | 2.2 | 1 | 0.9 | 1 |
| (6.7–7.2) | (3.7–4.1) | (2.1–2.4) | (0.8–1.0) | |||||||
| Centre | 22.1 | 7.0 | 0.97 | 3.4 | 0.87 | 2.5 | 1.06 | 1.1 | 1.15 | |
| (6.7–7.4) | (0.288) | (3.2–3.7) | (0.002) | (2.3–2.7) | (0.304) | (0.9–1.2) | (0.131) | |||
| South/major islands | 38.4 | 7.1 | 0.89 | 2.9 | 0.69 | 3.2 | 1.22 | 1.0 | 0.89 | |
| (6.7–7.6) | (0.002) | (2.6–3.2) | (≤0.001) | (2.9–3.6) | (0.002) | (0.9–1.1) | (0.234) | |||
| Total | 100.0 | |||||||||
Source: PASSI 2013–2015 (n = 108 705)
Adj. PR (adjusted prevalence ratio): adjusted for age, gender, educational attainment, perceived economic difficulties and geographic area of residence.
Reporting no difficulty, some difficulty or much difficulty in getting to the end of the month with the available income.
Defined according to the census criteria of the Italian National Institute of Statistics; Southern Italy comprises the two Italian major islands (Sardinia and Sicily).
The prevalence of CRDs in the Italian adult population was 7.0% (3.4% asthma only, 2.6% COPD only and 1.0% ACOS). The prevalence was significantly higher among older people (adj.PR 1.85; P < 0.001), those with lower educational level (primary school or less) (adj.PR 1.38; P < 0.001) and those with many economic difficulties (adj.PR 1.88; P < 0.001). Conversely the prevalence was significantly lower among people living in Southern Italy (adj.PR 0.89; P 0.002). The pattern of COPD and ACOS was similar to that of any CRD with the exception that COPD was more frequent in Southern Italy (adj.PR 1.22; P 0.002). Asthma, unlike COPD, ACOS and any CRD was less common among those with lower educational level and was more frequent in Northern Italy. No significant gender differences were observed for CRDs considered together and for each component condition (table 1). Table 2 shows specific PASSI age group estimates of CRDs for comparison with other studies.
Prevalence of people with Chronic Respiratory Diseases (CRDs) in the Italian general population, by specific age groups
| Study | Study design | Respiratory condition | Case definition | Years | Geographic area | Age group | Prevalence (%) | Passi estimate (%) |
|---|---|---|---|---|---|---|---|---|
| ISTAT—Indagine multiscopo ‘Aspetti della vita quotidiana’36 | Cross-sectional health interview survey (HIS) | Any CRDa | Self-reported condition | 2014 | Whole Italian population | 18–19 | 2.7 | 4.3 |
| 20–24 | 2.8 | 4.6 | ||||||
| 25–34 | 2.9 | 4.7 | ||||||
| 35–44 | 3.3 | 5.3 | ||||||
| 45–54 | 4.1 | 6.4 | ||||||
| 55–59 | 4.9 | 7.9 | ||||||
| 60–64 | 7.3 | 12.3 | ||||||
| de Marco 2013 (GEIRD)11 | Cross-sectional HIS | Any CRD | Self-reported physician diagnosis | 2007–2010 | Four Italian sub-regional areas | 20–64 | 13 | 6.5 |
| Guerriero 201512 | Cross-sectional health examination survey (HES) | Total COPDb | Spirometry (GOLD case definition) | 2012 | One sub-regional area of Northern Italy | 45–59 | 7d | 3.9 |
| Belleudi 201213 | Record linkage of administrative health databases | Total COPD | Validated predictive model | 2008 | One Italian Region (Lazio) | 45–54 M | 3d | 3.4 |
| 45–54 F | 3d | 3.1 | ||||||
| 55–64 M | 7d | 6.6 | ||||||
| 55–64 F | 6d | 6.5 | ||||||
| To 20123 | Cross-sectional HIS | Total asthmac | Self-reported doctor-diagnosed condition | 2002–2003 | Whole Italian population | 18–45 | 6.0 | 4.1 |
Table 3 compares the prevalence of modifiable factors in the groups with and without CRDs. The proportion of current smokers was higher in those with CRDs, as was the percentage of those who engaged in no-leisure time physical activity and those that were overweight or obese. The proportion of individuals reporting that smoking was allowed in their house was higher in the CRDs group, as was the proportion of those reporting that the smoking ban was not respected in the workplace. People with CRDs had a better perception of their insufficient level of physical activity and of their excess weight. Moreover, they attempted more often to quit smoking in the 12 months prior to the interview. Among those in excess weight, people with CRDs followed a diet to lose weight more frequently than people without CRDs. Adherence to flu vaccination was three times higher in people with CRDs and this group also received more frequent counselling from General Practitioners (GPs) regarding quitting smoking, doing regular physical activity, if insufficient, and losing weight, if excessive.
Occurrence of modifiable aggravating and protective factors for CRDs, in people with and without CRDs: prevalence and prevalence ratios
| People with CRDs | People without CRDs | Crude PRa | P value | Adj. PRb | P value | ||
|---|---|---|---|---|---|---|---|
| % (95% CI) | % (95% CI) | ||||||
| Risk/aggravating factors | Current smoking | 30.8 (29.3–32.3) | 25.2 (24.9–25.6) | 1.22 | <0.001 | 1.23 | <0.001 |
| Smoking ban not respected in the workplace | 9.9 (8.7–11.3) | 7.5 (7.2–7.8) | 1.32 | <0.001 | 1.31 | <0.001 | |
| Smoking allowed in the house | 25.8 (24.3–27.3) | 19.6 (19.3–20.0) | 1.31 | <0.001 | 1.25 | <0.001 | |
| Overweight/obesity | 52.4 (50.8–54.1) | 41.4 (41.0–41.8) | 1.26 | <0.001 | 1.11 | <0.001 | |
| Health-related perception | No leisure-time physical activity | 41.9 (40.3–43.6) | 36.4 (36.1–36.8) | 1.15 | <0.001 | 1.05 | 0.009 |
| Correct perception of insufficient physical activity level (among inactive people) | 82.1 (79.8–84.2) | 76.0 (75.3–76.5) | 1.08 | <0.001 | 1.08 | <0.001 | |
| Correct perception of excessive body weight (among overweight and obese) | 64.8 (62.3–67.1) | 56.6 (56.0–57.2) | 1.14 | <0.001 | 1.11 | <0.001 | |
| Protective behaviours | Adherence to the most recent flu vaccination campaign | 26.0 (24.0–28.2) | 8.4 (8.1–8.7) | 3.11 | <0.001 | 2.52 | <0.001 |
| Attempt to quit smoking in the last year (among cigarette smokers) | 40.5 (37.7–43.5) | 31.4 (30.7–32.2) | 1.29 | <0.001 | 1.32 | <0.001 | |
| Diet to lose weight (among overweight and obese) | 27.0 (25.1–29.1) | 23.0 (22.4–23.5) | 1.18 | <0.001 | 1.14 | 0.001 | |
| Preventive interventions | Advice from a GP to quit smoking (among cigarette smokers) | 69.7 (66.8–72.4) | 49.6 (48.7–50.4) | 1.41 | <0.001 | 1.32 | <0.001 |
| Advice from a GP to do regular physical activity (among inactive people) | 33.3 (30.8–36.1) | 25.6 (25.0–26.3) | 1.30 | <0.001 | 1.25 | <0.001 | |
| Advice from a GP to lose weight(among overweight and obese) | 59.1 (56.7–61.6) | 48.6 (47.9–49.2) | 1.22 | <0.001 | 1.17 | <0.001 |
Source: PASSI 2013–2015 (n = 108 705).
Crude PR (crude prevalence ratio).
Adj. PR (adjusted prevalence ratio): adjusted for age, gender, educational attainment, perceived economic difficulties and geographic area of residence.
Discussion
The large representative sample of the Italian population in the PASSI surveillance allows for detailed investigation of the prevalence and distribution of respiratory conditions in the general population. The observed association of CRDs with modifiable aggravating and protective factors provides new evidence that will help to form policies to improve respiratory health.
Prevalence of CRDs: comparisons with other studies
The prevalence estimates of CRDs reported here for the Italian population are within the wide range of estimates reported by international surveys such as the BOLD study for COPD8 and the World Health Survey (WHS) for asthma.3 Large geographic variations in the prevalence of CRDs are also apparent within nations; data of the American BRFSS (2006–2007; adults ≥ 18 years) show marked differences among communities in the prevalence of asthma (6.5–18.9%).9 Similarly in a separate 2011 study, the overall prevalence of COPD in the United States was 6.3% but wide variations among States were observed (3.1–9.3%).10
As shown in table 2, PASSI (2013–2015) estimates of any CRD are higher than those reported by the annual health interview survey of the Italian National Institute of Statistics (ISTAT). Conversely, the prevalence of CRDs (physician-diagnosed asthma and/or COPD) reported by the GEIRD study for subjects aged 20–64 years11 was substantially higher than the corresponding PASSI value (13% vs. 6.5%). ISTAT and GEIRD are health interview surveys based on self-reported data as PASSI, adopting the same cumulative indicator for CRDs (asthma and/or COPD).
The prevalence of COPD diagnosed by spirometry (GOLD case definition) in a sample of the general population of an area of Northern Italy was much higher than that of PASSI: 7% vs. 3.9% for the 45–59 age group.12 It is not surprising that estimates based on objective measures of airways obstruction (comprising a sizable proportion of subclinical cases) are higher than those based on self-reported, doctor-diagnosed cases. Moreover, the different geographic representativeness of the samples (sub-regional vs. national) and the different survey periods must be taken into account when comparing these results. Analyses of administrative health databases of Lazio Region, through a validated predictive model, provide estimates of diagnosed cases of COPD that are quite similar to PASSI’s: about 3% for the 45–54 age class and 6–7% for 55–64-year-old people.13
It is also possible to compare PASSI Italian national estimates of respiratory conditions with those of a multinational study (WHS): in 2002–2003, a 6% prevalence of doctor-diagnosed asthma was reported for the 18–45 years Italian population, slightly higher than that found by PASSI (4.1%).3 In general, to correctly interpret observed differences in prevalence among various studies, one should bear in mind that CRDs are influenced by multiple risk factors such as health-related behaviours, occupational and environmental exposures, socio-economic condition, access to health care, etc., which are unevenly distributed in different geographic areas. Additional research is needed to investigate which specific causes are responsible for the observed differences in each geographic and temporal context.10
Sociodemographic factors
Our findings show a higher prevalence of COPD among older and less educated people; asthma presented an opposite, but less evident trend for age and educational level, while ACOS had a distribution pattern similar to that of COPD. Small, non-significant gender differences were observed in the prevalence of CRDs between women and men. Our results are comparable with those of other Italian studies,11,14 while in other nations gender differences are more marked.15 Moreover, COPD, with or without asthma, was more frequently observed in people with economic difficulties. It is widely acknowledged that the risk of developing COPD is inversely related to socio economic status (SES), both in high and in low-and-middle income countries;4,16 low SES is associated with worse health outcomes,17 even if access to medications is equitable.18 In people with more economic difficulties we found the prevalence of asthma, alone, was slightly higher than in those with none or some economic difficulties, which is consistent with the results of various studies.19–21
Modifiable aggravating and protective factors
Overall, people with CRDs had a significantly higher prevalence of risk/aggravating factors compared to those without CRDs, while also reporting protective health-related perceptions and behaviours more often than those without CRDs. For example, while smoking was more prevalent in those with CRDs, the same group reported more frequent attempts to quit smoking. In addition, people with CRDs reported environmental tobacco smoke exposure in the home and workplace more often than those without CRDs; both exposures are amenable to public health strategies and interventions.
Smokers with CRDs were more likely to have received advice from a GP to quit; similarly, overweight/obese people with CRDs received more frequently advice to lose weight. In people with asthma, weight loss is associated with improvements in symptoms and lung function, decrease in asthma severity and medication use22 and presents an additional opportunity to improve outcomes for people with this condition.
Obese COPD patients experience greater respiratory symptoms, more severe restriction of daily activities, poorer health-related quality of life and greater health care use.23 On the other hand, other studies have shown that overweight/obese patients with COPD do not have higher mortality rates than normal-weight subjects. This ‘obesity paradox’ is explained by the fact that in COPD patients a strong predictor of overall mortality is muscle wasting which can be found in a proportion of COPD patients with a normal BMI.24 More precisely, COPD patients in the lower range of a normal BMI (<23) appear to have a mortality higher than patients in excess weight.25 This fact must be considered in planning and implementing interventions aimed at obtaining a weight loss in these patients.
According to the PASSI survey results, people with CRDs were also more likely to be physically inactive, but had correct perceptions of the insufficient Physical Activity (PA) levels, and received advice from GPs about exercise more frequently than people without CRDs. Physical inactivity is associated with a low-grade systemic inflammation, that might influence the induction and clinical expression of asthma and COPD.26,27 In people with asthma, moderate to high PA improves lung function.28 Patients with COPD can significantly improve their exercise tolerance and quality of life, and reduce symptoms of dyspnea and fatigue with only a minor increment in their leisure-time PA.24,29 Moreover, moderate PA is associated with a lower risk of hospital admissions for COPD, and of all-cause and respiratory mortality.30 Even vaccination against influenza, which can reduce the risk of serious illness, hospitalization and death in patients with COPD,24 while being higher in the CRD group (26%) was far lower than the targets specified by the Italian Ministry of Health (minimum and optimal coverage: 75% and 95%, respectively). Together the evidence from this survey suggests that the Italian population is amenable to interventions that may reduce the risk of CRDs as well as mitigate the burden of these diseases.
It is worth noting that the risk/aggravating factors identified for CRDs are closely related to other Non-communicable Chronic Diseases (NCDs). This fact is relevant for the management of patients with CRDs since the majority of them have other co-existing NCDs and multimorbidity is associated with poorer outcomes and higher health service use.31 Thus, public health interventions aimed at tackling these factors can have an additional positive effect on the population overall health.1
Limitations of the study
The chronic respiratory conditions investigated by PASSI do not represent the whole range of the CRDs. However, asthma and chronic obstructive pulmonary diseases are the most widespread.1
In general, self-reported data are subject to various biases such as recall (past events may be inaccurately recalled because of several factors, such as time elapsed to interview or differential retrieving of memories), telescoping (recalling events as having occurred closer to the time of interview than is true) and social desirability (socially undesirable behaviours are prone to under-reporting). For instance, self-reported BMI tend to underestimate real values.32
In particular, identifying individuals with CRDs is susceptible to misclassification bias. The prevalence of respiratory diseases in the general population is ideally assessed by objective measurements, but may be underestimated by self-reported data.33 However, the extent of inaccurate classification depends on the case definition, which may differ widely based on the objectives of the study.12,34 The prevalence of self-reported doctor-diagnosed disease is nonetheless important and can be used to allocate resources for clinical care. For this purpose, questions regarding ‘physician-reported’ asthma offer the highest specificity and are also the most reliable.35 Moreover, the subjective questions in the PASSI survey cannot be validated with objective measures.
Since the population under study is between the ages of 18 and 69, a limitation of this analysis is its lack of assessment of the CRDs burden for children, young people and the elderly. Identifying the behaviours associated with CRDs in the adult population (18–69 years) will guide preventive policies, which in turn may have an impact on CRDs burden on the entire population.
No data were available on environmental air pollution and occupational hazards, which represent two important risk/aggravating factors for CRDs. Ecological information about environmental variables could be derived by linking the micro-area of residence to maps of air pollution, which we do intend to explore in the future.
Conclusions
To our knowledge, this is the first nation-wide population-based study that contributes to the knowledge on the epidemiology of CRDs in Italy. In this study, we assess the prevalence of ACOS, a condition not extensively investigated so far. The large representative sample allowed investigation of the distribution of respiratory conditions in the adult population as well as the associations between CRDs and multiple modifiable aggravating and protective factors, including those not explored by other studies, such as second hand smoke, individual behaviours and perceptions, preventive interventions, doctors’ advice. People with CRDs are more aware of their condition and amenable to modify their behaviours, which presents an opportunity to develop appropriate strategies for health promotion and prevention in order to address the growing burden of CRDs. Lastly, in the choice of preventive interventions best suited to the various subpopulations, it should be kept in mind that CRDs in Italy, as in many other countries, disproportionally affect disadvantaged population groups.
Key points
This is the first nation-wide population-based study contributing to the epidemiology of CRDs and of their risk and protective factors in Italy.
Italian adults with CRDs are more likely to be current smokers, physically inactive and overweight, but at the same time are more aware of their condition and amenable to modify behaviours.
CRDs in Italy disproportionally affect disadvantaged population groups.
Funding
The funding received by the Italian Ministry of Health/National Centre for Disease Prevention and Control are destined for carrying out the surveillance system and not for carrying out this specific study. So we did not receive any funding for this specific piece of research. That is the reason why in the grant paragraph we stated “This work was supported by the Italian Ministry of Health/National Centre for Disease Prevention and Control (grant no. 6M32/2014-CCM)”.
Acknowledgements
The authors thank the many regional referents and the regional and local coordinators who contributed to the data collection. A special thanks to the health care workers in the public health departments in the LHUs who conducted the interviews. We thank Sanja Stanojevic (Respiratory Medicine, Hospital for Sick Children Toronto, Canada), Nerina Agabiti (Department of Epidemiology, Lazio Regional Health Service, Rome, Italy) and Giovanna Laurendi (Ministry of Health, Rome, Italy) for their valuable advice and editorial assistance.
Members of the PASSI Coordinating Group: Maria Masocco, Valentina Minardi, Valentina Possenti, Benedetta Contoli, Alberto Perra, Paolo D’Argenio, Italian National Institute of Health, Rome, Italy; Pirous Fateh Mogadam, Health Education Service, Provincial Agency for Health Services, Trento, Italy; Mauro Ramigni, Department of prevention Ulss 9, Treviso, Italy; Nicoletta Bertozzi, Regional Social Health Agency Emilia-Romagna Region, Bologna, Italy; Giuliano Carrozzi, Department of Public Health, Ausl Modena, Modena Italy; Angelo D’Argenzio, Department of Prevention, Ausl Caserta 2, Caserta, Italy; Massimo Oddone Trinito, Department of Prevention, Ausl Roma C, Rome, Italy; Marco Cristofori, USL Umbria 2, Terni, Italy; Amalia De Luca, Asp Cosenza, Cosenza, Italy; Stefania Vasselli, Ministry of Health, Rome, Italy.
Conflicts of interest: None declared.
References
Author notes
on behalf of the PASSI Coordinating Group*
The members of the PASSI Coordinating Group are listed in the Acknowledgements.

Comments