Addressing COVID-19 Communication and Management by a Systems Thinking Approach
 Francesco Gonella
 Marco Casazza
 Silvio Cristiano
 Alessandra Romano
- 1Department of Molecular Sciences and Nanosystems, Ca' Foscari Venice University, Venice, Italy
- 2Research Institute for Complexity, Ca' Foscari Venice University, Venice, Italy
- 3Division of Hematology, AOU “Policlinico—Vittorio Emanuele”, Catania, Italy
- 4Department of Science and Technology, Università degli Studi di Napoli Parthenope, Naples, Italy
- 5Scuola Superiore di Catania, Università degli Studi di Catania, Catania, Italy
A systemic stock-flow diagram is proposed for the communication and management of health services and strategies concerning the COVID-19 epidemic. The possible role of government interventions in activating systemic leverage points is also addressed. The presented approach, based on Systems Thinking, can create the basis for creating an analytical simulator of the disease spread, and at the same time the diagram can constitute a powerful tool for improving the quality of information for both policy-makers and the general public in situations of epidemics.
Introduction
The organization and efficiency of health services has recently drawn considerable attention due to the COVID-19 pandemic (Gates, 2020). A lack of resources has been evidenced worldwide in the reaction toward the coronavirus spread (Jones, 2020). Diverting medical personnel and equipment from the cure of other pathologies created further malfunctioning in hospital services and in domestic assistance (Horton, 2020). A sense of precariousness and a lack of foresight have emerged, especially for prompt reaction measures taken by governance bodies (ILOSTAT, 2019), and are independent of the overall efficiency of healthcare systems in non-emergency situations. The Global Risk Report 2020 (World Economic Forum, 2020), published annually by the World Economic Forum, warned of this situation a few months ago, reporting (Nuclear Threat Initiative, 2019) that: “A recent first-of-its-kind comprehensive assessment of health security and related capabilities across 195 countries found fundamental weaknesses around the world: no country is fully prepared to handle an epidemic or pandemic.” To identify the most effective interventions to halt the virus spread in its earliest stage is therefore a priority, but a systemic assessment of the emergency is still lacking. The main purpose of this paper is to address how the novel application of a methodological approach might be of immediate use for communication purposes of epidemics. The presented general diagram may be used by managers or decision-makers to address the problem of communication and emergency management at different levels, representing a powerful tool in the process of daily reporting of the situation to both the general public and operative stakeholders, as well as potentially contributing to the general improvement of scientific literacy.
Systemic Approaches to Healthcare
In the last two decades, new approaches have started catching on in the field of healthcare management. They aim at describing healthcare systems from an integrated, holistic point of view [for a general review on this field, see Carey et al. (2015)], calling for a stronger integration of systemic thinking into public health procedures and management (Fahey et al., 2004; Williams et al., 2005; Midgley, 2006; Trochim et al., 2006; Leischow et al., 2008; Mabry et al., 2008; Barabási et al., 2011; Hood et al., 2012; Wolkenhauer et al., 2013; Bishai et al., 2014; Peters, 2014). The World Health Organization itself produced a report entitled “Systems Thinking for health systems strengthening” (de Savigny and Taghreed, 2009). The various methods are usually based on computational tools, derived from social network analysis (SNA) procedures and the concurrent availability of very large sets of data, whereas systems thinking quantitative approaches based on stock-flow diagrams remain unexplored so far [see discussions in Dammann et al. (2014) and Cassidy et al. (2019)]. Systemic approaches were also used in the study of specific epidemics, or, more generally, in the development of epidemiology discipline (Ritchie-Dunham and Méndez Galván, 1999; Xia et al., 2017). Verelst et al. (2016) and Walters et al. (2018) reported recent reviews on this field. Computational models of epidemics often follow data-driven metapopulation procedures (Balcan et al., 2010; Mari et al., 2017), yet without encompassing the spatial and temporal dynamics of infections at the global scale, due to the difficulty in having reliable and significant extended data (Walters et al., 2018). Only a few works report the use of a systemic perspective in the assessment of strategies to limit contagion spreading (Gumel et al., 2004; Ferguson et al., 2005; Araz, 2013), indicating the urgent need for putting together medical and epidemiological issues with management tools. This is a crucial point, since scientific information during the emergency must be reliable but at the same time feasible for both politicians and the general public (Rybniker and Fätkenheuer, 2020). Based on this background, models of the coronavirus spreading dynamics were reported in recent weeks, mostly based on the determination of parameters from existing reliable big data (Chinazzi et al., 2020; Gatto et al., 2020; Hellewell et al., 2020; Kucharski et al., 2020; Li et al., 2020; Read et al., 2020; Wang et al., 2020; Wu et al., 2020). A key point differentiates the stock-flow quantitative systemic approach from those addressed in the cited works: our diagram is not a “photograph” of a collection of the existing elements, but rather a representation of those elements that determines the system dynamics, mutually interacting by means of properly defined processes. It is important to clarify that in the conceptual framework of stock-flow ST the words “system” and “systemic” do not have the same meaning they assume in the Network Analysis contexts, which the cited approaches are mostly based on. While both NA and ST aim at describing a system as a whole, the former still relies on the knowledge of a proper collection of empirical parameters and on the availability of sophisticated mathematical and statistical tools. On the contrary, the ST approach starts from the identification of the minimum set of state extensive variables (stocks) necessary to model the flows and the feedback network that describes the configurations of the system dynamics. The worldwide reference model by Johns Hopkins University (https://systems.jhu.edu/research/public-health/ncov-model-2/) is a good example of this difference. It presents a stochastic metapopulation epidemic simulation, based on a global network of city-level populations connected by edges representing passenger air travel between cities. From an epistemological point of view, it represents exactly the kind of computational-based approach that is complementary to the ST-based one. It starts from local connections (edges) between many physically existing elements, while in our approach we have a limited number of elements (the stocks) necessary to represent the system state, connected by physically existing flows of the same elements of the stocks. Owing to the processes, they form a network of mutual relationships that ultimately determine the evolution dynamics. Nevertheless, ST and NA approaches are two faces of the same complexity, whose complementarity has enormous potential, as pointed out by Bielekova et al. (2014): “The integration of systems thinking with dynamic computational modeling can lead to the development of a ‘virtual sandbox’ in which researchers can utilize their creativity and intuition to try out and explore multiple different hypotheses and lines of investigation.” In this paper, we propose a comprehensive descriptive framework, based on stock-flow symbolic language used in energy systems diagramming, suitable to be adapted and used at different scales and for different epidemics and site-specific situations. The presented general diagram, developed on the basis of the COVID-19 emergency, is suitable to be integrated in the current data-driven models. This may be used by managers or decision-makers to address the problem of communication at different levels and of emergency management, representing a powerful tool in the process of daily reporting of the situation to both the general public and operative stakeholders, also potentially contributing to the general improvement of scientific literacy.
Systems Thinking and Stock-Flow Diagrams
The Systems Thinking (ST) approach was developed from the pioneering work of Ludwig von Bertalanffy on General Systems Theory (von Bertalanffy, 1968). It has found applications in quite a wide range of fields, from hard sciences to sociology and economics. From an operational point of view, the first (and fundamental) step of an ST-based analysis is the creation of a systemic diagram containing all the relevant elements that define the system operation at the decided level of study (Bossel, 1994, 2007; Luna-Reyes and Andersen, 2003). The systemic diagram presented for COVID-19 was set up following four basic steps:
1. Identification of the set of variables suitable to describe the emergency evolution as a system.
The variables must be countable extensive state variables that constitute an n-tuple of numbers that at any time represents a state of the system. In the system's language, these variables are called the stocks. The number of stocks must be the minimum necessary to describe the state of the system for the prescribed purposes. It must be possible to describe the relevant processes occurring in the system in terms of stocks interactions. In the current case, we first chose stocks made of people at different stages of the disease, from healthy ones who become infected to either recovered or dead. These stocks are also needed to describe the epidemic from the point of view of the news reported every day by media, on which public perception is based. The second type of stocks represent those necessary to study the epidemic (local) management, so they include medical personnel, equipment, and devices, and the government, whose role is that of providing means and implementing suitable intervention measures to contain the disease spread.
2. Identification of the flows connecting the stocks and the external environment.
A stock may change its value only upon its inflows and/or its outflows, represented by arrows entering or exiting the stock. If Q is the quantity of something contained in a stock, then inflows and outflows are expressed as dQ/dt.
3. Identification of the processes occurring within the system.
Processes are mechanisms able to change the value of a flow. Since the system state is a collection of stocks, and the only way to change the value of a stock is by acting on its in/outflows, processes are located along the flows. Flows between stocks may have different natures, but are usually matter flows. A flow between a stock and a process may also represent a control, exerted by the stock on the process. It this case, the flow is made of either information or labor or services.
4. Identification of feedbacks.
The value of a flow may alter the value of a stock, but if this change also alters the value of the flow in a cause-effect loop, we say we are in the presence of feedback. This may be direct or indirect, the latter of which is when the mutual change in the flow and stock values follows a path that includes other stocks. The pattern of feedback is the feature that defines the ultimate dynamics of a system (Meadows, 2008).
It is worth underlining that a stock-flow diagram is not a “photograph” of the system, but rather an abstract representation that has a mainly epistemological role, based on a description of the pattern of reciprocal influences between the stocks. The epistemology of modeling in systems thinking is very rigorous [see for example Odum and Odum (2000)], passing from a structural model (the diagram) to an analytical one (the set of differential equations), to a computational one (the simulator), the latter connecting the state of the system (the n-tuple of stock variables that defines a point in a state's space) to a point in the space-time diagram of the system evolution. This conceptual structuring is rarely addressed explicitly in the application of ST diagrams, but it constitutes the core of the use of this approach in several disciplines, such as ecology, hard sciences, economy, and anthropology, while its application in both communication and health management issues is, to our knowledge, almost completely unaddressed.
Systems Thinking and Covid-19
Figure 1 shows the ST diagram of the COVID-19 spread. Symbols are borrowed from the energy language (Odum and Odum, 2000), where shields indicate the stocks, arrowed solid lines the flows, dashed solid lines the controls on processes, and solid big arrows the processes. Sick (K) elements are defined as people who have been positively diagnosed, and who will be either hospitalized or quarantined, while Symptomatic (Y) have not been diagnosed yet. This division in two different stocks is purely systemic, and is concerned only with our knowledge. It is made to specify the “Diagnosis” process in the diagram. In fact, this process requires resources in terms of medical equipment (e.g., swabs) and thus is a possible critical point for epidemic management. “Diagnosis” has therefore a systemic meaning; it is the process that makes a person who belongs to the stock Infected (IN) become an element of the stock Sick (K), independent of the type of diagnosis. The processes labeled with M (measure) represent the systemic locations of possible leverage points. In fact, these processes are the elements on which government measures and interventions may act, for instance, by imposing restrictions to contacts or by providing more resources in terms of equipment and labor-force of medical personnel. They are based on the elaboration of the information flow exiting the system. As already remarked, the stock-flow diagram was prepared first of all by creating the stocks of people at different stages of the disease or differently treated. Other stocks were then included, necessary to point out the processes involved in the epidemic management. Among these, sanitary personal devices (SPD) played a role in weakening the reinforcing feedback in the Infected (IN) stock, while the medical equipment stock (ME) was necessary for both the “Diagnosis” and the “Cure” processes. The medical personnel are more likely to be infected by symptomatics (through the “Contagion” process), since doctors and nurses work in contact with them, whereas healthy people are more likely to be infected by people from the Infected (IN) stock, since they are generally expected to avoid contact with persons presenting symptoms. In the diagram, the controls exerted on some of the processes by governance management are indicated by dashed arrows, which are actually flows of information or services. The stocks and the flows chosen for this diagram can offer a synthetic and clear way to report to the public the relevant data that day by day are necessary to follow the epidemic evolution. Figure 2 shows a simplified version of the diagram, keeping only the people stocks (except for the personnel) and the corresponding flows. This synopsis corresponds to the actual information typically given, day by day, by the government, various agencies, and the mass media, as reported in the corresponding legend within the figure. The figure also reports the mathematical expressions of the corresponding system elements.
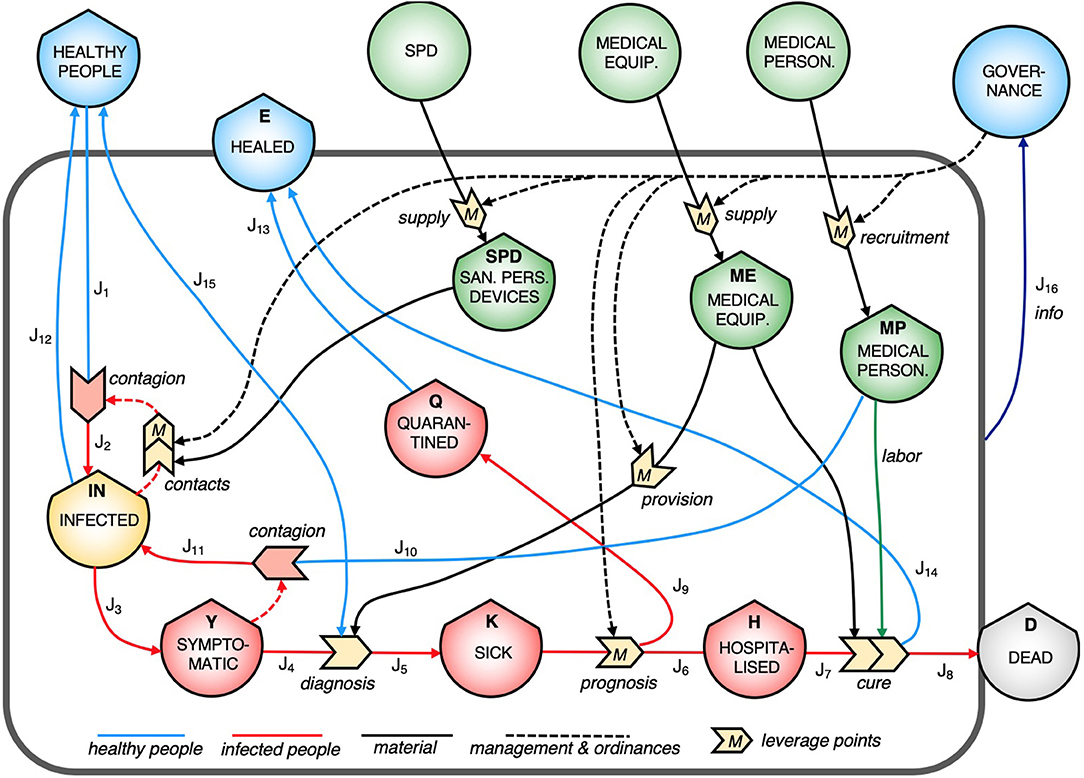
Figure 1. Systems Thinking stock-flow diagram for the COVID-19 epidemic description. Stocks (shield symbols) are: IN, infected people whitout symptoms; Y, infected with symptoms; K, diagnosed sick people; Q, people in quarantine; H, hospitalized people; D, dead people; E, healed people (returned to normal); SPD, sanitary personal devices (face masks, gloves, disinfectant); ME, medical equipment (including swabs, test kits, personal protective equipment, and intensive care equipment, especially mechanical ventilators and oxygen). Blue and red arrowed lines (labeled with J for subsequent mathematical representation) are the flows of people in the system, that in turn define day by day the value of the people stocks and the systemic state of the system. Solid black lines are the flow of resources needed to take on the epidemic, with the green line representing the medical personnel labor. Dashed black lines indicate the governance measures implemented to face the crisis. From a systemic point of view, they are flows of information or services. Big arrowed symbols are the processes, labeled with “M” wherever they could represent an effective leverage point for intervention. Colors are: blue for healthy people and governance, red or yellow for infected people, and green for generic systemic resources.
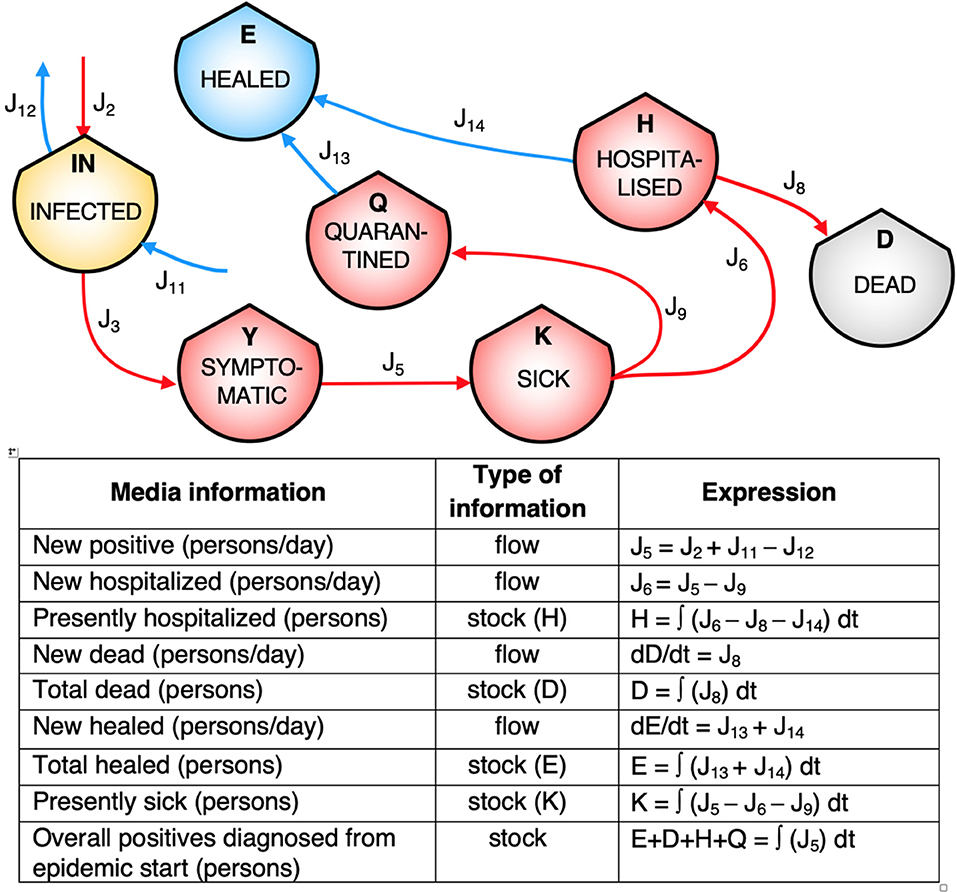
Figure 2. Simplified version of the diagram, keeping only people stocks and the corresponding flows. The figure visualizes the actual information typically given day by day by the media in terms of stocks and flows, as reported in the legend within the figure (J9 may be assumed to be equal to J13). The mathematical espressions of the elements are also given.
Discussion and Conclusion
This version of the diagram allows for the following of the flows of people exiting the diagnosis process to populate the stocks of Sick (K) and Healed (E) by the flows J5 and J15, respectively. The Infected (IN) stock is characterized by a reinforcing feedback, that through the process named “Contacts” may activate the exponential increase of infected people. The value of the stock Infected (IN) is virtually unknown, thus the strength of the feedback remains unknown as well, at least during the emergency state. Moreover, some infected people remain asymptomatic, eventually going back to the stock E without being counted (flow J12 in Figure 1). People from the stock K populate both the Quarantine (Q) and the Hospitalized (H) stocks, the latter undergoing the cure processes, in turn activated by the availability of medical equipment and by the labor of medical personnel, represented by the two flows entering the process. A special role is played by the infection of physicians and nurses coming from their interactions with infected people (transformation of the flow J10 into the flow J11), since the depletion in their qualified labor provision is potentially crucial in determining the worsening of assistance, that will be systemically evidenced by an increase of the flow J8.
Six possible leverage points are present, represented by the dashed lines and the corresponding processes labeled with M (measure). Some of them (i.e., those entering in the “Recruitment,” “Provision,” and “Supply” processes) depend on the overall balancing feedback provided by the flow of information J16, collected daily from the system state. The control on the process “Prognosis” is particularly delicate since, on one hand, hospitalization should guarantee a higher level of medical care, while, on the other hand, overcrowded structures make the risk of contagion increase. This is one of the crucial points to be determined; in fact, the domestic assistance quality should be increased in order to limit the proximity to infected people, but without compromising the overall quality of the assistance. The control on the “Contacts” process is also crucial, as demonstrated by the different evolutions of the pandemic in countries that have followed different lockdown strategies. Specific attention has to be paid to the related reinforcing feedback, since any of the possible levels of intervention in the process can be highly site-dependent (population density, cultural aspects, socio-economic factors, etc.) and should take into account the overall effect on the social structure. Generally speaking, this diagram further addresses the necessity of treating a complex situation using complex integrated tools, like those provided by the ST framwork. At this level, the presented systemic description is a general structure, and does not provide specific details on the biomedical mechanisms of contagion, nor on the epidemiological aspects. As a matter of fact, different social communities and infrastructures may exhibit relevant differences in their systemic arrangement, and the disease spread depends on social, geographical, climatic, and political aspects, as well as on the local availability of appropriate resources. The ST diagram may be adapted and used at different scales and situations, with parameters and elements adjusted depending on the type of infection, the strength of the contagion, and the involved community. For example, the choice of the stocks to include in the diagram might require us to specify a stock of people who cannot undergo lockdown conditions, for example dwellers of overpopulated urban slums. In this case, the level of governance intervention should take into account the existence of sub-stocks of infected people that operate differently in the system, in order to tailor the measures for a better overall efficacy. A specific study including a finer description of these aspects goes beyond the scope of this paper, but the characteristics of our diagram still indicates the flexibility of our stock-flow approach in the description of different situations. By the definition of proper equations for the accumulation-discharge of each stock [see Odum and Odum (2000)], a simulator can be used to study the evolution of the system configurations, particularly under different emergency management interventions. Of course, once the quantitative simulator of the diagram is created, a validation process will be necessary. Both processes (simulator creation and validation) follow standard procedures described in Systems Thinking and System Dynamics textbooks, like, for example, the classical book by Bossel (1994). The development of an actual quantitative example of computer simulation is well-beyond the scope of the paper, that is not aimed at predicting any outcome, at least before the pandemic is exhausted and proper data are collected. This is due to the intrinsic complexity of the system, whose behavior quantifìcation requires the knowledge of phenomenological parameters that can be estimated only when the epidemic will be virtually disappeared within the reference community at issue. In particular, some coefficients must be defined for measuring the effectiveness of controls by the government, represented by the dashed lines in our diagram. In fact, in all the described processes, they act as a multiplying factor able to either increase or decrease a physically real flow. These coefficients, together with medical parameters representing mortality, morbidity, incubation time, etc., cannot be presently estimated with a sufficiently low uncertainty, so that the exercise of running a simulator in the context of dynamical systems analysis (Sterman, 2000) would not yet provide a reliable prediction. The proposed general diagram, developed on the basis of the COVID-19 emergency, can be integrated on the current data-driven models, providing a tool to simulate the dynamics of different epidemics and to indicate the leverage points at the level and type of socio-sanitary interventions. It can be implemented and enriched depending on the level of complexity of the study at hand, as well as on the specific target of the study.
An important consideration must finally be made regarding the communicative potential of this ST-based diagram. In fact, the confusion between the concepts of stock and flow is a common example of the general lack of scientific literacy. In particular, the concept of “accumulation” (that is, the stock value) is often misunderstood even by well-educated people (Cronin et al., 2009). In the case of the epidemic, the daily evolution of a stock is often perceived as that of its inflow, thereby creating wrong perceptions about what is going on. For example, some stock values will never decrease [e.g., Healed (E) and Dead (D)] over time, while their derivatives (i.e., their inflows) may increase or decrease depending on the epidemic evolution. This also applies for the Sick (K) stock, whose value at a time may be much less important than the behavior of its inflow and outflow. The diagram we propose, along with the corresponding table (except for the mathematical expressions), may be a powerful communication tool, as far as it offers a standardized pictorial representation able to explain the tables of data and the graphics reported in the media communications. The graphical synopsis provided by the ST diagram may significantly help the dissemination of correct information about the epidemic's development to the general public, since it connects the reported figures and trends with the overall dynamics of the disease spread. The diagram helps to explain to an audience with a low level of scientific literacy the differences between cumulative numbers and daily trends, linked to stocks and flows, and how they are related to each other. More scientifically educated people should more easily be able to focus on the relationships between quantities and their derivatives, and appreciate what this means in terms of overall balances of the stocks. It is our opinion that all the communication sources should refer to a picture similar to that of Figure 2, helping to create a better understanding even of the epidemiological aspects involved in the epidemic. Once the structure of the system and the relevant processes are identified, their control will be crucial to guarantee a good systemic functioning, that may be in turn determined by proper data collection and scenario simulations. The diagram will be then used both as an analytical and a communication tool, able to evidence the causes of malfunctioning and the possible effective protocols to be activated for the system management.
Data Availability Statement
The original contributions presented in the study are included in the article/supplementary material, further inquiries can be directed to the corresponding author/s.
Author Contributions
FG and AR had the idea, developed, and wrote the overall perspective contribution. MC and SC contributed to the bibliographic search and to the diagram set-up. All authors contributed to the article and approved the submitted version.
Conflict of Interest
The authors declare that the research was conducted in the absence of any commercial or financial relationships that could be construed as a potential conflict of interest.
References
Araz, O. M. (2013). Integrating complex system dynamics of pandemic influenza with a multi-criteria decision making model for evaluating public health strategies. J. Systems Sci. Systems Eng. 22, 319–339. doi: 10.1007/s11518-013-5220-y
Balcan, D., Gonçalves, B., Hu, H., Ramasco, J. J., Colizza, V., and Vespignani, A. (2010). Modeling the spatial spread of infectious diseases: the global epidemic and mobility computational model. J. Comput. Sci. 1, 132–145. doi: 10.1016/j.jocs.2010.07.002
Barabási, A.-L., Gulbahce, N., and Loscalzo, J. (2011). Network medicine: a network-based approach to human disease. Nat. Rev. Genet. 12, 56–68. doi: 10.1038/nrg2918
Bielekova, B., Vodovotz, Y., An, G., and Hallenbeck, J. (2014). How implementation of systems biology into clinical trials accelerates understanding of diseases. Front. Neurol. 5:102. doi: 10.3389/fneur.2014.00102
Bishai, D., Paina, L., Li, Q., Peters, D. H., and Hyder, A. A. (2014). Advancing the application of systems thinking in health: why cure crowds out prevention. Health Res. Policy Syst. 12:28. doi: 10.1186/1478-4505-12-28
Bossel, H. (2007). Systems and Models: Complexity, Dynamics, Evolution, Sustainability. Norderstedt: Books on Demand.
Carey, G., Malbon, E., Carey, N., Joyce, A., Crammond, B., and Carey, A. (2015). Systems science and systems thinking for public health: a systematic review of the field. BMJ Open 5:e009002. doi: 10.1136/bmjopen-2015-009002
Cassidy, R., Singh, N. S., Schiratti, P.-R., Semwanga, A., Binyaruka, P., Sachingongu, N., et al. (2019). Mathematical modelling for health systems research: a systematic review of system dynamics and agent-based models. BMC Health Services Res. 19:845. doi: 10.1186/s12913-019-4627-7
Chinazzi, M., Davis, J. T., Ajelli, M., Gioannini, C., Litvinova, M., Merler, S., et al. (2020). The effect of travel restrictions on the spread of the 2019 novel coronavirus (COVID-19) outbreak. Science 6:eaba9757. doi: 10.1126/science.aba9757
Cronin, M. A., Gonzalez, C., and Sterman, J. D. (2009). Why don't well-educated adults understand accumulation? A challenge to researchers, educators, and citizens. Org. Behav. Human Decision Processes 108, 116–130. doi: 10.1016/j.obhdp.2008.03.003
Dammann, O., Gray, P., Gressens, P., Wolkenhauer, O., and Leviton, A. (2014). Systems epidemiology: what's in a name? Online J. Public Health Inform. 6:e198. doi: 10.5210/ojphi.v6i3.5571
de Savigny, D., and Taghreed, A. (2009). Systems Thinking for Health Systems Strengthening. Geneva: Alliance for Health Policy and Systems Research, World Health Organisation.
Fahey, D. K., Carson, E. R., Cramp, D. G., and Muir Gray, J. A. (2004). Applying systems modelling to public health. Systems Res. Behav. Sci. 21, 635–649. doi: 10.1002/sres.602
Ferguson, N. M., Cummings, D. A., Cauchemez, S., Fraser, C., Riley, S., Meeyai, A., et al. (2005). Strategies for containing an emerging influenza pandemic in Southeast Asia. Nature 437, 209–214. doi: 10.1038/nature04017
Gates, B. (2020). Responding to covid-19—a once-in-a-century pandemic? N. Engl. J. Med. 382, 1677–1679. doi: 10.1056/NEJMp2003762
Gatto, M., Bertuzzo, E., Mari, L., Miccoli, S., Carraro, L., Casagrandi, R., et al. (2020). Spread Dynamics of the Covid-19 Epidemic in Italy: Effects of Emergency Containment Measures. PNAS [pre-print]. Available online at: http://covid-19-italy.s3-website-eu-west-1.amazonaws.com/SPREAD_DYNAMICS_OF_THE_COVID-19_EPIDEMIC_IN_ITALY_preprint.pdf (accessed April 12, 2020).
Gumel, A. B., Ruan, S., Day, T., Watmough, J., Brauer, F., van den Driessche, P., et al. (2004). Modelling strategies for controlling SARS outbreaks. Proc. Royal Soc. B 271, 2223–2232. doi: 10.1098/rspb.2004.2800
Hellewell, J., Abbott, S., Gimma, A., Bosse, N. I., Jarvis, C. I., Russell, T. W., et al. (2020). Feasibility of controlling COVID-19 outbreaks by isolation of cases and contacts. Lancet Global Health 8, e488–e496. doi: 10.1016/S2214-109X(20)30074-7
Hood, L., Balling, L., and Auffray, C. (2012). Revolutionizing medicine in the 21st century through systems approaches. Biotechnol. J. 7, 992–1001. doi: 10.1002/biot.201100306
Horton, R. (2020). Offline: don't let COVID-19 divert us completely. Lancet 395:1534. doi: 10.1016/S.0140-6736(20)31130-2
ILOSTAT, International Labour Organization (2019). COVID-19: Are There Enough Health Workers? Available online at: https://ilostat.ilo.org/covid-19-are-there-enough-health-workers/ (accessed May 18, 2020).
Jones, D. S. (2020). History in a crisis—lessons for covid-19. N. Engl. J. Med. 382, 1681–1683. doi: 10.1056/NEJMp2004361
Kucharski, A. J., Russell, T. W., Diamond, C., Liu, Y., Edmunds, J., Funk, S., et al. (2020). Early dynamics of transmission and control of COVID-19: a mathematical modelling study. Lancet Inf. Dis. 20, 553–558. doi: 10.1016/S1473-3099(20)30144-4
Leischow, S. J., Best, A., Trochim, W. M., Clark, P. I., Gallagher, R. S., Marcus, S. E., et al. (2008). Systems thinking to improve the public's health. Am. J. Prev. Med. 35, S196–S203. doi: 10.1016/j.amepre.2008.05.014
Li, Q., Guan, X., Wu, P., Wang, X., Zhou, L., Tong, Y., et al. (2020). Early transmission dynamics in Wuhan, China, of Novel Coronavirus-infected pneumonia. N. Engl. J. Med. 382, 1199–1207. doi: 10.1056/NEJMoa2001316
Luna-Reyes, L. F., and Andersen, D. L. (2003). Collecting and analyzing qualitative data for system dynamics: methods and models. Syst. Dyn. Rev. 19, 271–296. doi: 10.1002/sdr.280
Mabry, P. L., Olster, D. H., Morgan, G. D., and Abrams, D. B. (2008). Interdisciplinarity and systems science to improve population health. Am. J. Prev. Med. 35, S211–S224. doi: 10.1016/j.amepre.2008.05.018
Mari, L., Gatto, M., Ciddio, M., Dia, E. D., Sokolow, S. H., De Leo, G., et al. (2017). Big-data-driven modeling unveils country-wide drivers of endemic schistosomiasis. Sci. Rep. 7:489. doi: 10.1038/s41598-017-00493-1
Meadows, D. H. (2008). Thinking in Systems: A Primer. White River Junction, VT: Chelsea Green Publishing.
Midgley, G. (2006). Systemic intervention for public health. Am. J. Public Health 96, 466–472. doi: 10.2105/AJPH.2005.067660
Nuclear Threat Initiative (2019). Global Health Security Index: Inaugural Global Health Security Index Finds No Country Is Prepared for Epidemics or Pandemics. NTI Press Release. Available online at: https://www.nti.org/newsroom/news/inaugural-global-health-security-index-finds-no-country-prepared-epidemics-or-pandemics/ (accessed March 15, 2020).
Odum, H. T., and Odum, E. C. (2000). Modeling for All Scales: An Introduction to System Simulation. San Diego: Academic Press.
Peters, D. H. (2014). The application of systems thinking in health: why use systems thinking? Health Res. Policy Sys. 12:51. doi: 10.1186/1478-4505-12-51
Read, J. M., Bridgen, J. R., Cummings, D. A., Ho, A., and Jewell, C. P., (2020). Novel coronavirus 2019-nCoV: early estimation of epidemiological parameters and epidemic predictions. medRxiv. doi: 10.1101/2020:01:23:20018549
Ritchie-Dunham, J. L., and Méndez Galván, J. F. (1999). Evaluating epidemic intervention policies with systems thinking: a case study of dengue fever in Mexico. System Dyn. Rev. 15, 119–138. doi: 10.1002/(SICI)1099-1727(199922)15:2<119::AID-SDR163>3.0.CO;2-G
Rybniker, J., and Fätkenheuer, G. (2020). Importance of precise data on SARS-CoV-2 transmission dynamics control. Lancet. doi: 10.1016/S1473-3099(20)30359-5. [Epub ahead of print].
Sterman, J. D. (2000). Business Dynamics: Systems Thinking and Modeling for a Complex World. New York, NY: McGraw-Hill.
Trochim, W. M., Cabrera, D. A., Milstein, B., Gallagher, R. S., and Leischow, S. J. (2006). Practical challenges of systems thinking and modeling in public health. Am. J. Public Health 96:538. doi: 10.2105/AJPH.2005.066001
Verelst, F., Willem, L., and Beutels, P. (2016). Behavioural change models for infectious disease transmission: a systematic review (2010–2015). J. R. Soc. Interface 13:20160820. doi: 10.1098/rsif.2016.0820
von Bertalanffy, L. (1968). General System Theory: Foundations, Development, Applications. New York, NY: George Braziller.
Walters, C. E., Meslé, M. M. I., and Halla, I. M. (2018). Modelling the global spread of diseases: a review of current practice and capability. Epidemics 25, 1–8. doi: 10.1016/j.epidem.2018.05.007
Wang, W., Tang, J., and Wei, F. (2020). Updated understanding of the outbreak of 2019 novel coronavirus (2019-nCoV) in Wuhan, China. J. Med. Virol. 92, 441–447. doi: 10.1002/jmv.25689
Williams, W., Lyalin, D., and Wingo, P. A. (2005). Systems thinking: what business modeling can do for public health. J. Public Health Manag. Pract. 11, 550–553. doi: 10.1097/00124784-200511000-00012
Wolkenhauer, O., Auffray, C., Jaster, R., Steinhoff, G., and Dammann, O. (2013). The road from systems biology to systems medicine. Pediatric Res. 73, 502–507. doi: 10.1038/pr.2013.4
World Economic Forum (2020). Global Risk Report. Available online at: https://www.weforum.org/reports/the-global-risks-report-2020 (accessed March 15, 2020).
Wu, J. T., Leung, K., and Leung, G. M. (2020). Nowcasting and forecasting the potential domestic and international spread of the 2019-nCoV outbreak originating in Wuhan, China: a modelling study. Lancet 395, 689–697. doi: 10.1016/S0140-6736(20)30260-9
Keywords: systems thinking, COVID-19, epidemics, communication, publich health
Citation: Gonella F, Casazza M, Cristiano S and Romano A (2020) Addressing COVID-19 Communication and Management by a Systems Thinking Approach. Front. Commun. 5:63. doi: 10.3389/fcomm.2020.00063
Received: 16 April 2020; Accepted: 15 July 2020;
Published: 31 July 2020.
Edited by:
Mohan Jyoti Dutta, Massey University, New ZealandReviewed by:
Margaret Usha D'Silva, University of Louisville, United StatesQian Hu, University of Central Florida, United States
Copyright © 2020 Gonella, Casazza, Cristiano and Romano. This is an open-access article distributed under the terms of the Creative Commons Attribution License (CC BY). The use, distribution or reproduction in other forums is permitted, provided the original author(s) and the copyright owner(s) are credited and that the original publication in this journal is cited, in accordance with accepted academic practice. No use, distribution or reproduction is permitted which does not comply with these terms.
*Correspondence: Francesco Gonella, gonella@unive.it