
95% of researchers rate our articles as excellent or good
Learn more about the work of our research integrity team to safeguard the quality of each article we publish.
Find out more
ORIGINAL RESEARCH article
Front. Ecol. Evol. , 04 July 2023
Sec. Paleontology
Volume 11 - 2023 | https://doi.org/10.3389/fevo.2023.1205277
This article is part of the Research Topic Human Upright Walking From Past to Present View all 11 articles
 Carla Figus1*Rita Sorrentino2Kristian J. Carlson3,4Antony Colombo5,6Eugenio Bortolini1Federico Bernardini7,8Igor Erjavec9Tamás Hajdu10Tamás Szeniczey10Orsolya Mateovics-László11Ildiko Pap12Claudio Tuniz8Mario Novak13Maria Giovanna Belcastro2Timothy M. Ryan14Stefano Benazzi1
Introduction: The talus plays an important role in receiving and dissipating the forces and linking the leg and the foot. As such, it is of paramount importance to analyze how its morphology, internal and external, changes during late ontogeny and through adolescence.
Method: To explore both the external shape and the internal architecture of the talus, Geometric Morphometrics and trabecular analysis have been applied to a sample of 35 tali from modern human juveniles aged between 5 and 15 years old (Middle Neolithic (4800–4500 BCE) to mid-20th century).
Results: Results show that, as the overall size of the talus increases, the shape and orientation of talar facets also change. The youngest individuals exhibit a functional talus that is still characterized by a relatively immature shape (e.g., subtly expressed margins of articular surfaces) with articular facets only minimally rotated towards an adult configuration. In adolescents, talar shape has achieved adult form after the age of 11, with all the articular facets and posterior processes well-developed. Considering internal morphology, trabecular bone varies between age classes. While Bone Volume Fraction shifts during the age 5–15 range, Degree of Anisotropy is relatively more stable over the developmental period examined in the study since it exhibits smaller variations between age classes.
Discussion: This study examined the late ontogeny of the human talus by considering both internal and external morphology. Results suggest that, although the locomotion has already assumed an adult-like pattern, the exploration of late talar growth may help understand how the talus adapts to changes in locomotor activity and how it responds to the increase in weight. Present results can be used to a better understanding of talar plasticity, improving interpretations of adult human talar form.
During growth, the human body undergoes relevant changes that include both morphological modifications and an increase in size and weight. Children steadily gain mass during childhood, but it is with the pubertal growth spurt that body weight increases more rapidly. In this relatively short period, about 50% of adult body weight is gained (Barnes, 1975). Articular surfaces are thought to remain potentially plastically responsive to load during growth, as they can change their shape and orientation (Hellier and Jeffery, 2006; Russo and Kirk, 2013). In contrast, after the completion of skeletal development, bone shafts respond to a rise in stress by increasing their diaphyseal cross-section (Ruff et al., 1991). As such, the foot, which is the sole structure that sustains the entire body weight while contacting terrain during walking and standing, must cope with these enormous changes over the course of development. In particular, the talus plays a pivotal role in this mechanism.
Anatomically, the talus articulates with the tibia and fibula, forming the talocrural joint, through the trochlea, medial, and lateral malleolar facets (Figure 1). Through its articulation with the tibia and other tarsals, the talus facilitates a wide range of movements, e.g., dorsiflexion and plantarflexion, pronation and supination. For example, the talus articulates with the calcaneus inferiorly, through the anterior, middle, and posterior calcaneal facets, and anteriorly with the navicular through the navicular facets, forming the subtalar and talonavicular joints, respectively (White and Folkens, 2005). At the ankle joint, the talus, i.e., the bone that connects the leg and the foot, needs to maintain congruence with adjacent bones to effectively transmit forces and prevent injury from excessive localized force in the joint. During development, talar morphology undergoes substantial adjustments, both internally and externally. Changes in articular surface shape and orientation instead of changes in surface area may offer a better adaptive solution to increase load bearing in a bone, while still providing a solution to constraints of spatial constriction (Hellier and Jeffery, 2006). While this is true for all the tarsal bones, for the talus is especially important since it must cope with transmitting great forces through a relatively smaller articular surface with respect to, for example, the more spacious bony articulation in the knee joint, i.e., the femoral condylar surface (Lieberman et al., 2001).
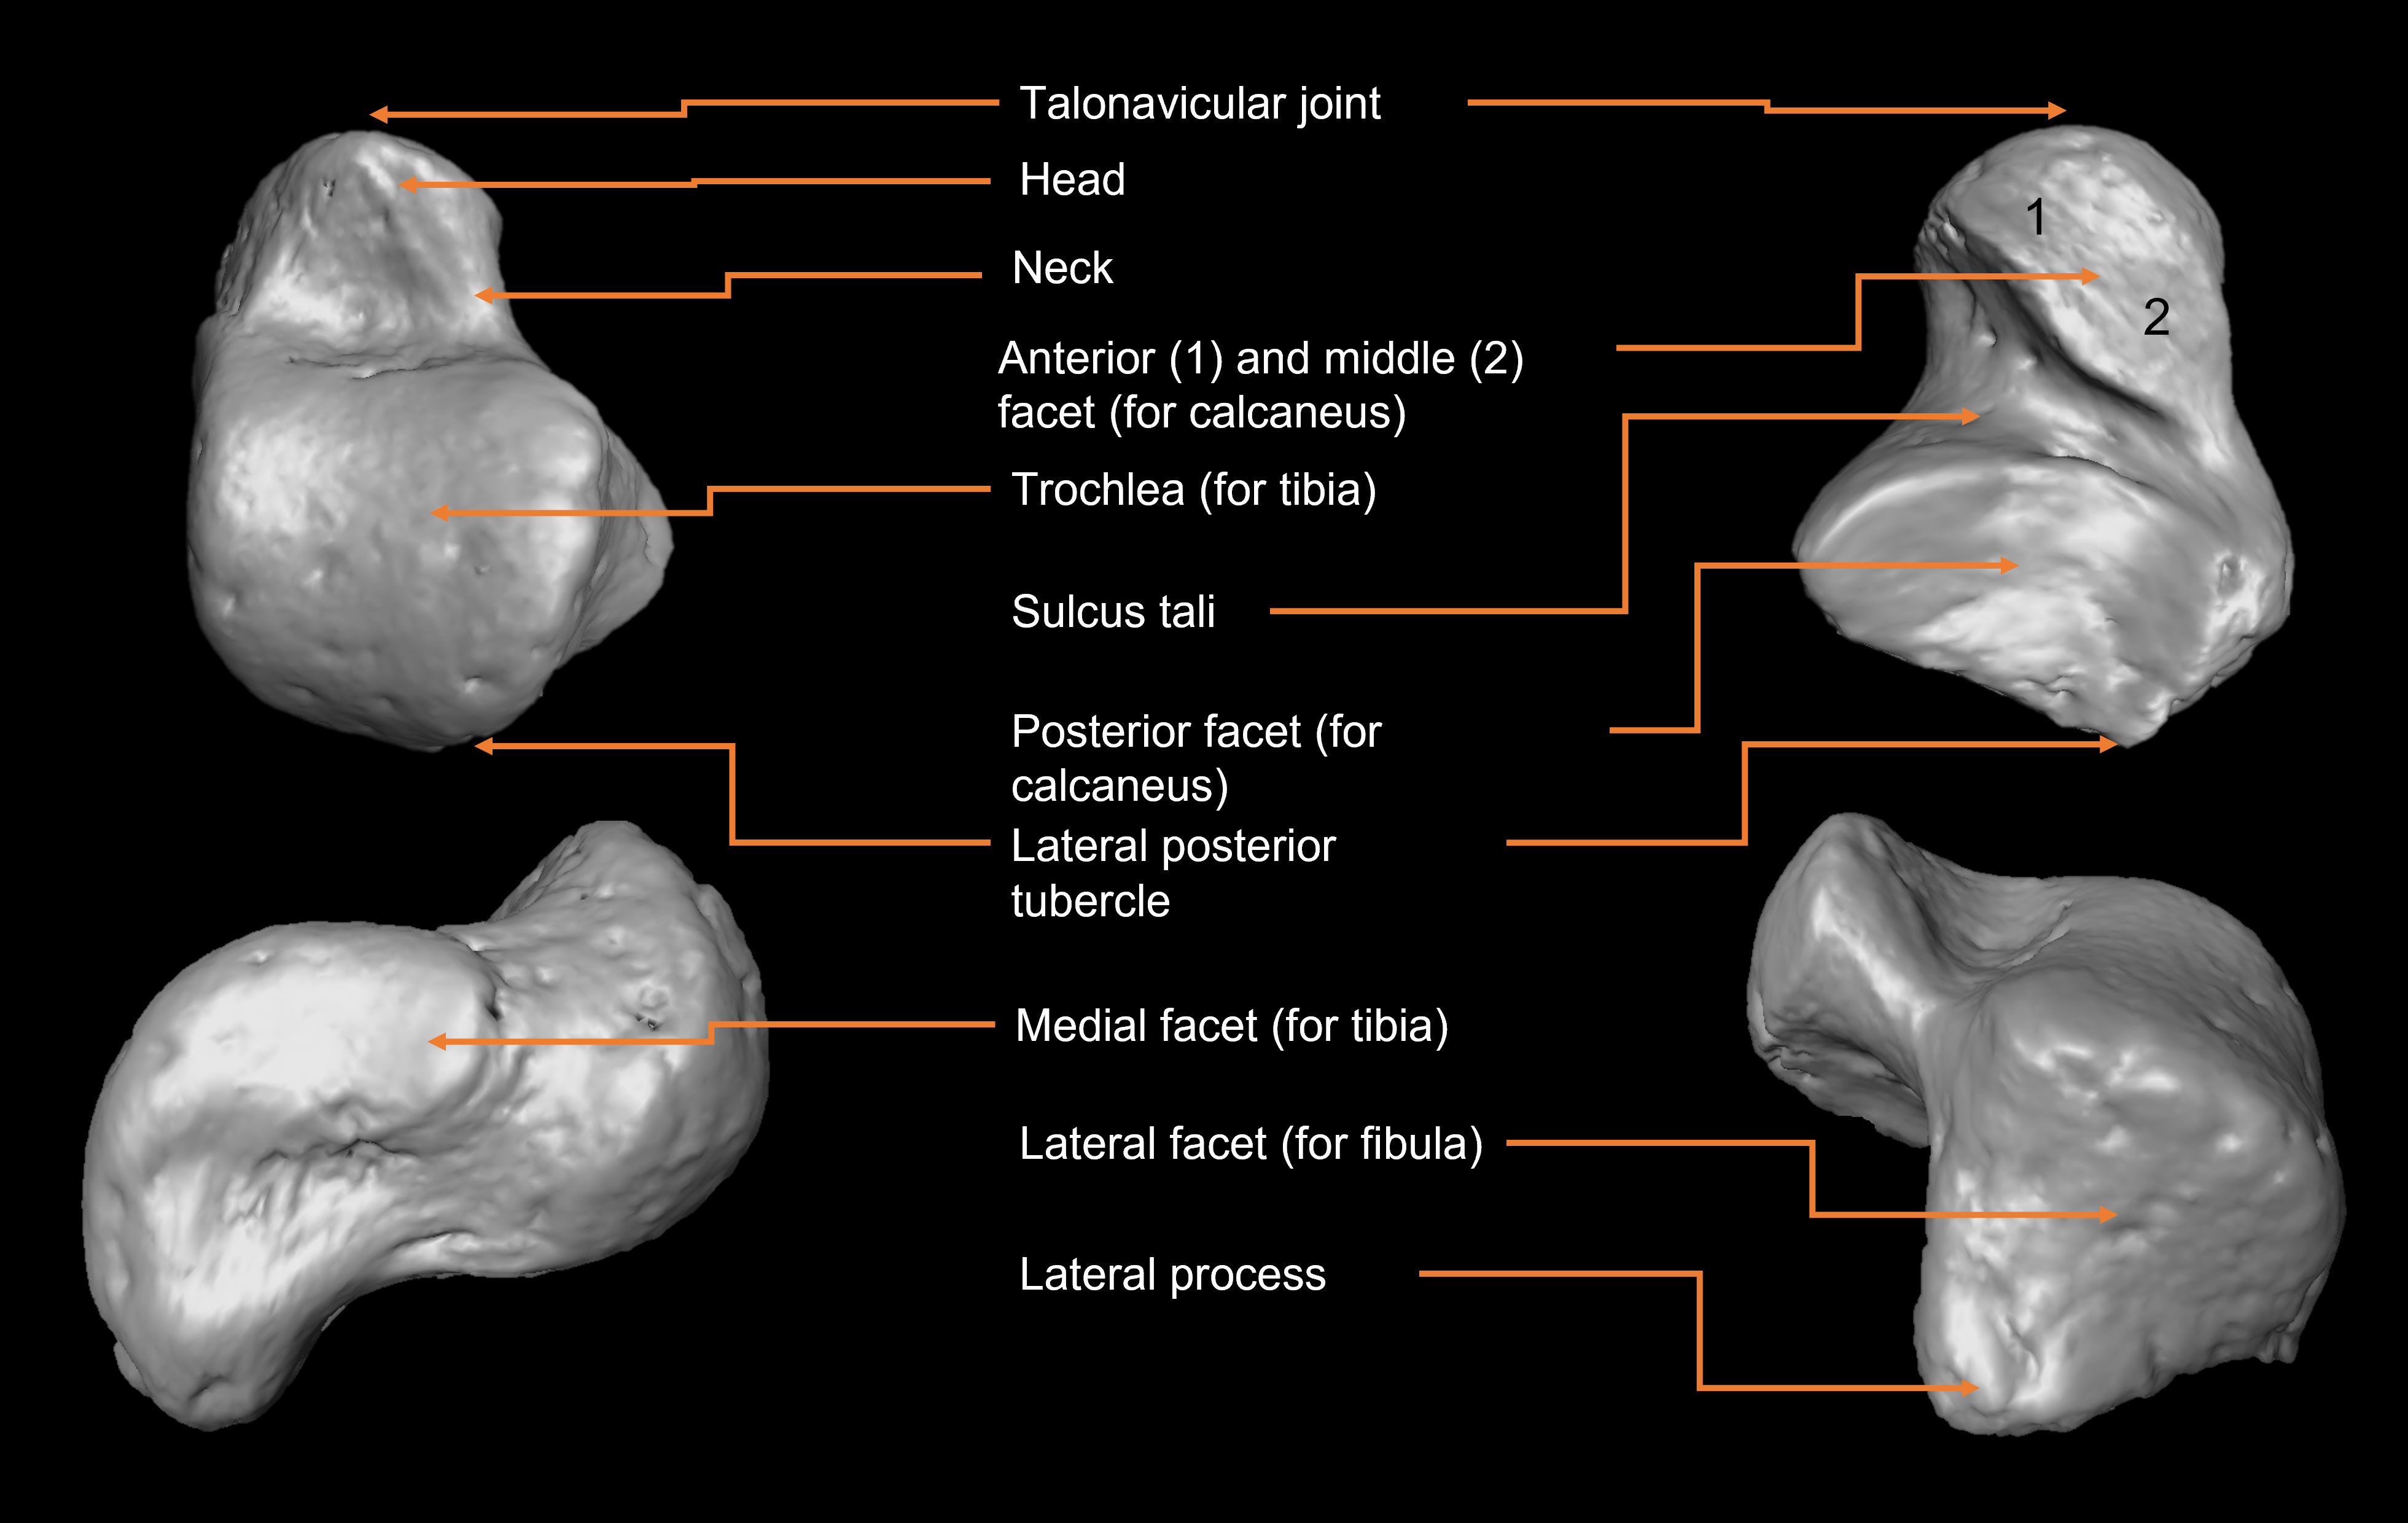
Figure 1 Anatomy of the talus. From upper left, clockwise: dorsal, plantar, lateral, medial views.
The talus in its role as a weight-bearing element and the tibiotalar joint as enabling a wide range of mobility are determinants of its bony development and morphology (Hellier and Jeffery, 2006). However, due to structure-spatial constraints in the conformation of tibiotalar (i.e., the ankle mortise) and subtalar articulations, talar articular surfaces are prevented from over-expanding in external dimensions in response to load increases. This implies a different mechanism for coping with increasing forces, i.e., compressive, tensile, and shearing loads. As noted by Hellier and Jeffery (2006), talar facets respond to load changes by adjusting surface orientation to optimally transmit stress.
Both external morphology and internal structure, i.e., trabecular bone, result from an interaction between genetic and non-genetic influences (Judex et al., 2004; Havill et al., 2010; Barak et al., 2011; Raichlen et al., 2015) e.g., hormones, vascular patterning (Kivell, 2016). Trabecular bone has a faster (re)modeling rate than cortical bone (Barak et al., 2011). The trabeculae formed during growth undergo complex metabolic and mechanical changes that ultimately result in adult architecture (Keller et al., 2001; Ryan and Krovitz, 2006; Gosman and Ketcham, 2009). Bone functional adaptations throughout ontogeny are of paramount importance in the talus because of increased loading during this period. The superior trochlear surface has a relatively large weight-bearing surface area that receives most of the body weight transmitted through the talar facet, while proportionately smaller forces are transmitted to the medial and lateral talar malleolar facets. Previous analyses of the internal morphology of tarsal bones, such as the talus, revealed a relatively isotropic structure around birth, together with high values of bone volume fraction (BV/TV), combined with numerous, thin, and closely packed trabeculae (Saers et al., 2020; Figus et al., 2022; Figus et al., 2023). During the first six months post-birth, BV/TV values steadily decrease as trabecular number (Tb.N) decreases due to resorption of trabeculae (Acquaah et al., 2015; Saers et al., 2020). Then, around 12 months post-birth, the degree of anisotropy (DA) increases, while BV/TV also increases, coupled with thicker, more largely spaced struts.
Talar morphological plasticity has been previously assessed in adults (Turley and Frost, 2013; Turley and Frost, 2014a; Turley et al., 2015; Sorrentino et al., 2020a; Sorrentino et al., 2020b) and on ontogenetic samples (Hellier and Jeffery, 2006; Turley and Frost, 2014b). However, no previous study of both internal and external morphology has focused on late ontogenetic changes, i.e., from late infancy to adolescence. This leaves a gap in the literature around a critical life history phase when an individual is entering the adult world, preventing a comprehensive and holistic understanding of talar morphological changes. During this last phase of talar growth, mature bipedal locomotion has already been acquired and the human body is undergoing a growth spurt concurrent with performing more intense load-bearing activities.
Here, we address this gap by exploring the plasticity of the human talus on a sample aged between 5 and 15 years and documenting the last phases of growth with a focus on how external and internal morphology copes with increases in body weight.
The main goals of this study are:
1) to analyze the development of talar articular facets by defining the age of onset of changes in their orientation in response to an increase in body weight, as first observed by Hellier and Jeffery (2006)
2) to document internal morphological changes accompanying increases in body weight and the presumably stronger loading demands resulting from a more intense lifestyle, i.e., adolescents stepping into adulthood.
Based on previous investigations (Hellier and Jeffery, 2006; Turley and Frost, 2014b), we hypothesize that we will find a slight increase in talar facet size during late childhood followed by a more pronounced re-orientation (e.g., rotation) of the articular facets in response in increased locomotor loading. We postulate that the 1) superior trochlear surface and posterior calcaneal facets and the 2) navicular and anterior calcaneal facets will covary as pairs, modifying their orientation to better cope with the directionality of the forces that pass through them.
Based on numerous studies on the ontogeny of the trabecular architecture (Ryan and Krovitz, 2006; Raichlen et al., 2015; Colombo et al., 2018; Saers et al., 2020) we also hypothesize that BV/TV will increase during growth, attaining maximum values, in this study, around adolescence. This increase will be likely accompanied by an increase in trabecular thickness (Tb.Th), while strut number and spacing will remain similar throughout the growth period. BV/TV values are expected to increase and become higher laterally in the middle region and medially in the anterior region, as the talus receives loads from the tibia, head, and posterior calcaneal articular facet.
Degree of anisotropy (DA) is expected to slightly increase before the age of 7–8, together with the achievement of an adult-like gait; then, it will stabilize, as gait reaches a more mature and adult-like pattern, i.e., more consistent and predictable kinematics. After DA reaches a plateau, we postulate that the areas with the highest DA values will be visualized beneath the articular surfaces of the talar head and posterior calcaneal facet, due to substantial compressive forces passing through them, while lower DA values are expected beneath articular surfaces of the superior trochlear surface and anterior and medial calcaneal facets, as has been suggested to receive the weight from the tibia and to reflect a presumed medial weight shift during late stance (Su and Carlson, 2017).
The sample consists of 35 tali from modern human juveniles aged between 5 and 15 years old, ranging from the Middle Neolithic (4800–4500 BCE) to the mid-20th century. Eleven individuals (F=6; M=5), aged between 5 and 11 years, came from the modern human skeletal collections housed at the University of Bologna, Italy, for which sex, age-at-death, and cause-of-death are known (Belcastro et al., 2017; Table 1). The collection includes skeletal remains from the Emilia-Romagna region of Italy that were collected mostly from 1908 to 1953 (Belcastro et al., 2017). The largest part of the Emilia-Romagna cohort was buried in Bologna La Certosa cemetery, the biggest cemetery in the city. The importance of this collection is demonstrated by the presence of ante-mortem data, a generally good state of preservation, and the relatively high number of non-adult individuals represented. In the collection, a substantial number of infants who died during the first year of life highlights the high infant mortality that existed during the mid-19th century (Belcastro et al., 2017). The number of children represented in the collection decreases from the age of three onwards.
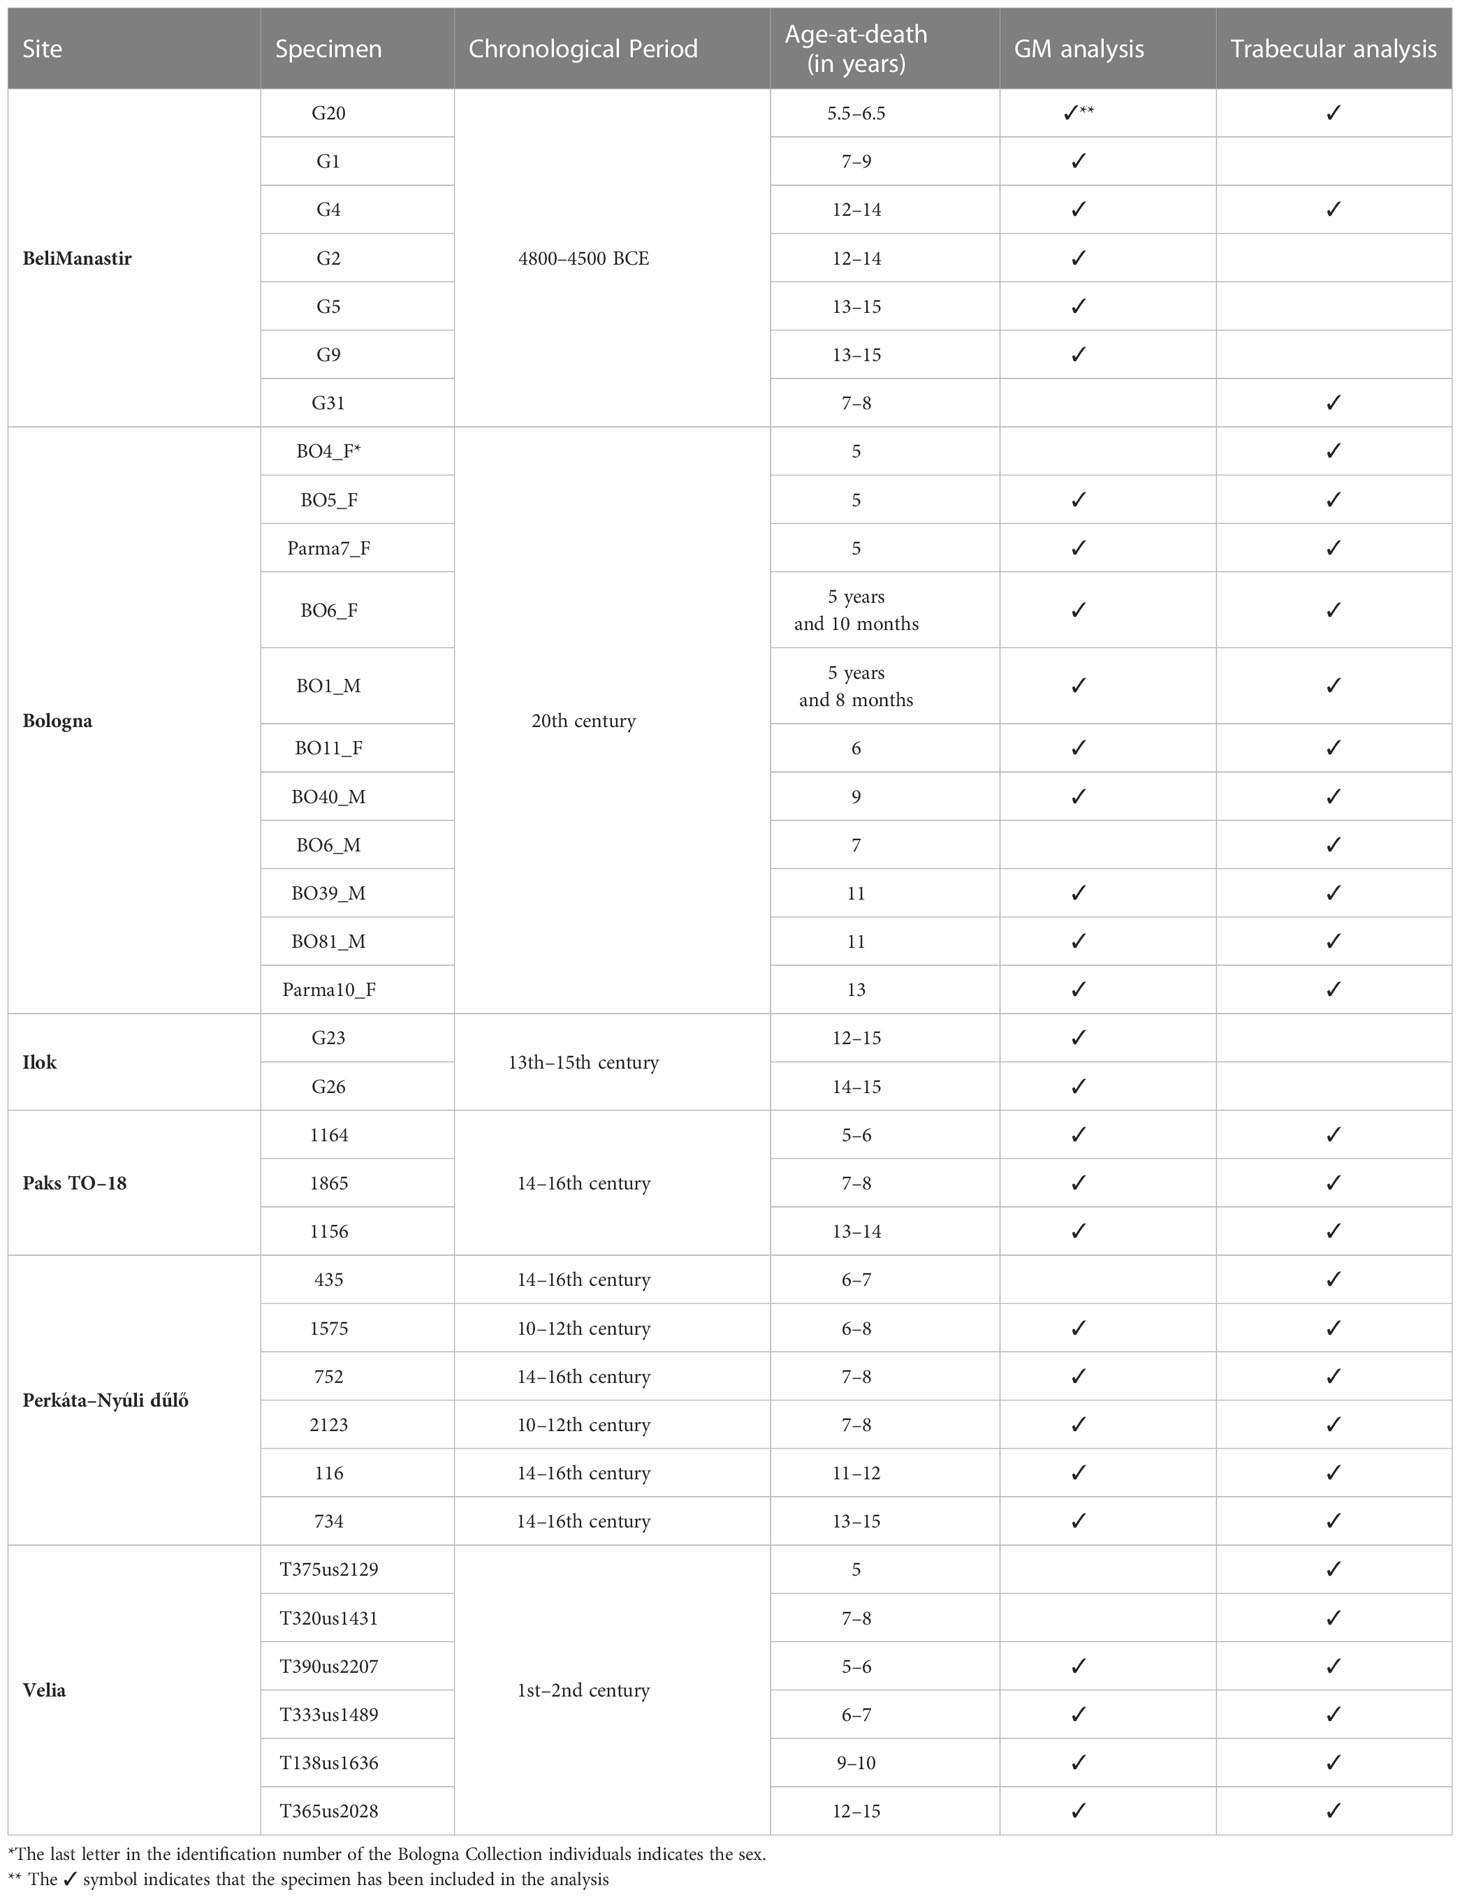
Table 1 Study sample. Individuals are listed by population.
The rest of the study sample was selected from different archaeological samples, with a time that spans from the Neolithic to the 16th century:
- Seven individuals came from the prehistoric site of Beli Manastir (Croatia). Most Neolithic burials from this site can be dated to the Middle Neolithic, i.e., between 4800 and 4500 BCE (Los, 2020);
- Two individuals came from the site of Ilok – Krstbajer (Croatia). Based on radiocarbon dates, the cemetery was used between the end of the 12th century and the transition from the 15th–16th century. These burials most probably belong to the parish cemetery around the church of St. Helen the Queen (Krznar and Rimpf, 2018)
- Six individuals came from the Imperial Roman site of Velia. The site, originally founded by the Greeks in 540 BCE, is located on the Italian west coast, near Salerno (Campania, Italy). The necropolis, which dates to the 1st–2nd centuries CE, has yielded both cremation and inhumations, with numerous juvenile burials (Morel, 2006).
- Three individuals came from the sites of Paks and six from Perkáta-Nyúli dűlő, Hungary. The human remains are stored at the Hungarian National Museum, National Institute of Archaeology, New Archaeological Collection in Budapest. Individuals buried in the cemetery of Perkáta-Nyúli dűlő (Kovács, 2011) date to the 14th–16th centuries CE, except for one (burial number: 3421), which dates to the 10th–12th centuries CE. The cemetery of Paks- Cseresznyés dates to the 14th and 16th centuries (Mesterházy-Ács, 2015; László, 2018).
The age-at-death of individuals from archaeological contexts was estimated based on common anthropological methods, by considering skeletal and dental maturation (Moorrees et al., 1963; Stoukal, 1978; Ferembach, 1980; Smith, 1991). The estimates may not be as accurate as the age-at-death information available from the Emilia-Romagna cohort; though, age estimation techniques available for the non-adults are usually more accurate than the methods applied to adult individuals. Consequently, the use of age ranges was employed to account for some potential errors that may exist with the age estimation technique. Specifically, mean age-at-death estimates were binned into age classes for the archaeological sample. The three age classes also reflect different status of gait kinematics (Raichlen et al., 2015) as follows (Swan et al., 2020; Figus et al., 2022):
- Late infancy (5.1–6 years, 10 individuals). In this stage, infants engage in an intermediate phase between immature and mature gait.
- Childhood (6.1–10 years, 12 individuals). This stage reflects children who have achieved mature locomotion.
- Adolescence (10.1–15 years, 13 individuals). This stage reflects a late ontogenetic growth phase in the human foot.
All specimens were selected for the study based on their good state of preservation, with minimal or no damage, and no external signs of pathologies. The left side was chosen a priori; if missing or damaged, the right talus was used instead and mirrored. All specimens were scanned by micro-CT at different facilities (Table 2); scans were reconstructed as 16-bit TIFF stacks, and quality was assessed with ImageJ. Specimens were excluded from the analyses when the trabecular bone showed signs of damage due to pathological or diagenetic causes. Avizo 9.3 (Visualization Sciences Group, SAS) was used to pre-process reconstructed scan data (e.g., crop or resample data volumes). Where heavy sediment or mummified soft tissues were present, they were removed in Avizo 9.3 using a graphics pen display monitor (Wacom) and the Avizo paint-brush tool in the labels-field module. A White Hat filter was applied to the Beli Manastir and Velia samples to improve material contrast between bone and heavy sediment that infiltrated internal spaces in the bone (e.g., filled trabecular spaces). When contrast was insufficient to separate bone from non-bone materials, the specimen was excluded from analyses. Segmentation of image data was performed using the MIA clustering method (Dunmore et al., 2018). The 3D models for geometric morphometric analysis were obtained through the isosurface reconstruction in Avizo 9.3.
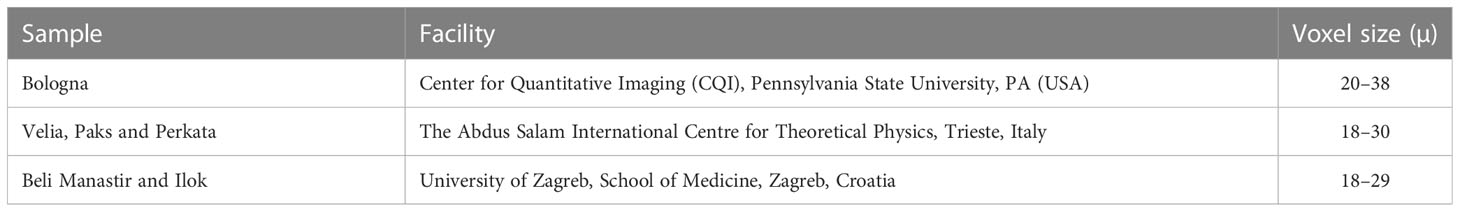
Table 2 Micro-CT information.
To quantify morphological changes in gross morphology and the development of the articular facet, a template of 254 (semi) landmarks (11 anatomical landmarks, 89 curve semilandmarks, and 154 surface semilandmarks) was created in Viewbox 4 (dHAL Software) on a 5-year-old female specimen (Parma7-F) (Figure 2; Tables 3, 4). The (semi)landmark configuration was applied to all targets with well-defined and easily recognizable articular surfaces; specimens with poorly visible boundaries of articular facets were excluded from analyses. To be considered geometrically homologous (Gunz and Mitteroecker, 2013), semilandmarks were allowed to slide on the curves and the surface, minimizing thin-plate-spline bending energy (Slice, 2006) between the template and targets. Semilandmarks were allowed to slide against recursive updates of the Procrustes consensus (Rohlf and Slice, 1990). After sliding was completed, coordinates were registered with a Generalized Procrustes Analysis (GPA) and size was removed when specimens were scaled and translated. The GPA was performed in R, using geomorph (Adams et al., 2013).
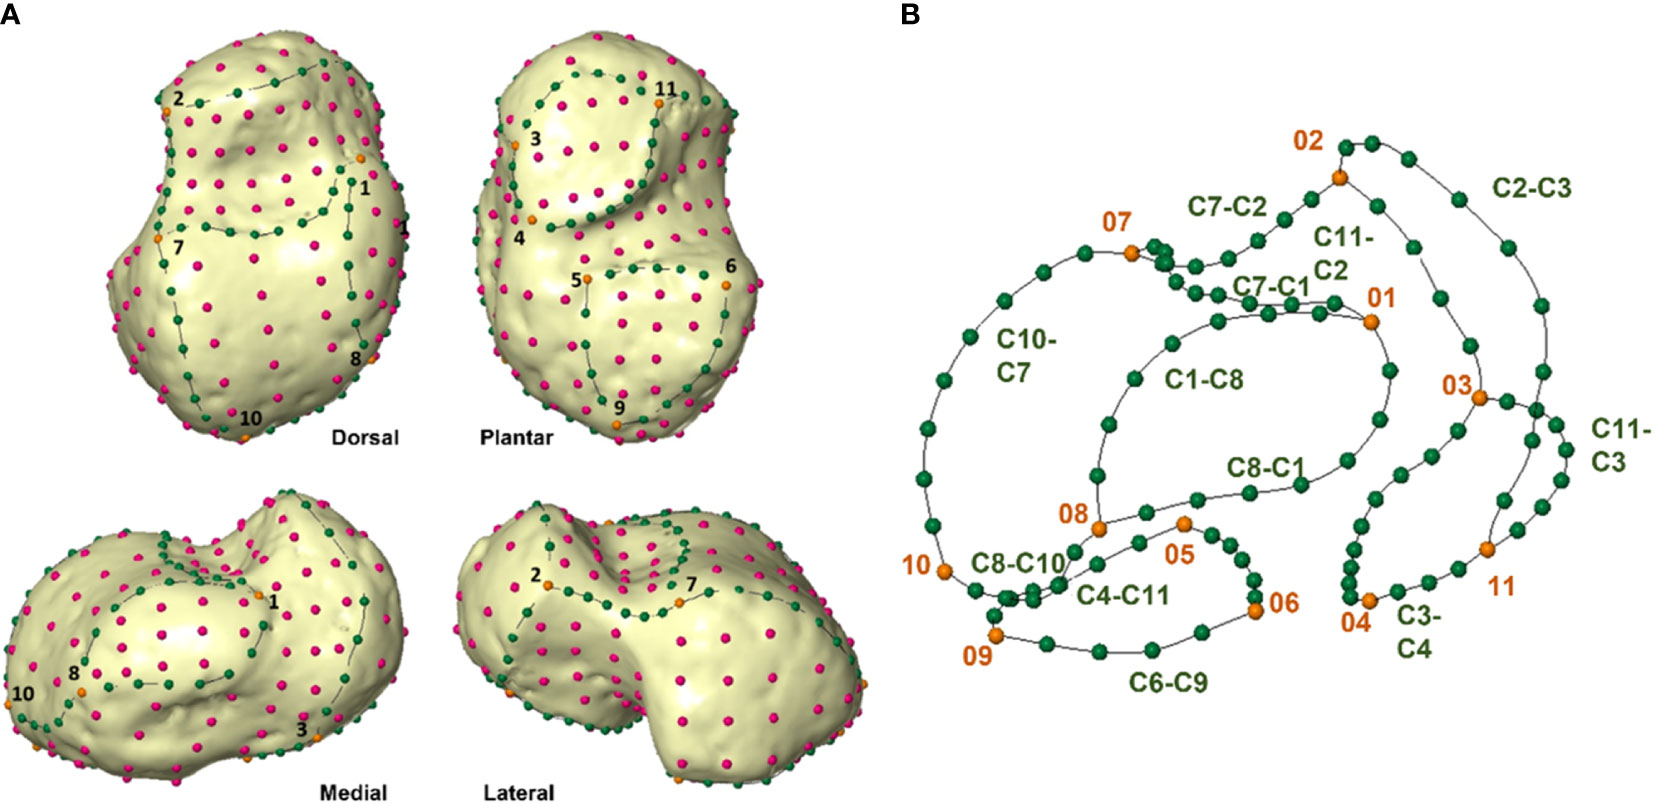
Figure 2 (A) (semi)landmark configuration for talus in dorsal view (upper left), plantar view (upper right), medial view (lower left) and lateral view (lower right). Landmarks are numbered 1–11 (see Table 4) and represented in orange. Curve semilandmarks are represented in green, while surface semilandmarks are represented in magenta. (B) Configuration of (semi)landmarks. Landmarks are colored in orange, curve semilandmarks are colored in green, while surface semilandmarks are colored in pink. (Semi)landmarks are listed in Tables 4, 5.
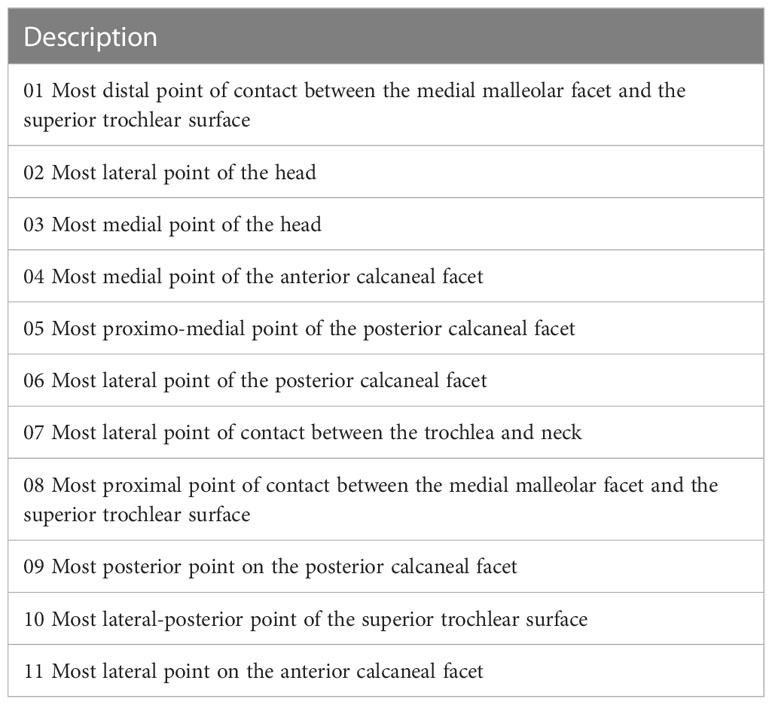
Table 3 Configuration of Type III landmarks according to Bookstein (1997).
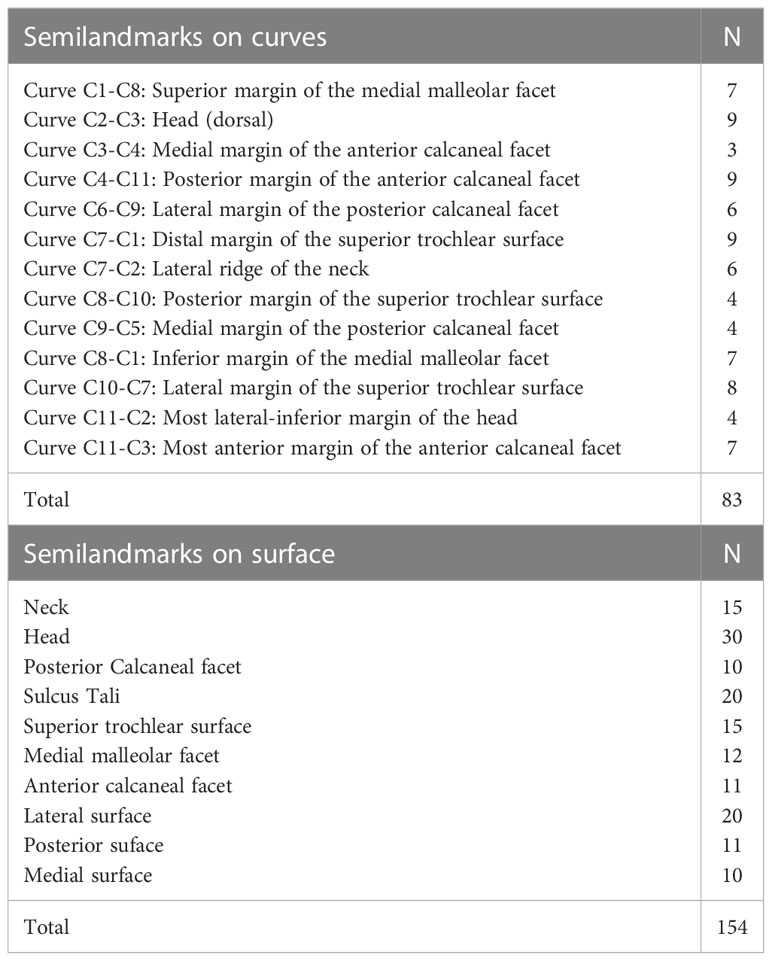
Table 4 Semilandmarks.
Shape and form space analyses were carried out using the R 4.2.2 (R Core Team) packages “Morpho” package v2.11 (Schlager, 2017) and “geomorph” package v4.05 (Adams et al., 2018; Baken et al., 2021). Principal Component Analysis (PCA) was carried out on the Procrustes coordinates to explore talar shape variation during growth. Shapiro-Wilk normality test and Levene test were run to evaluate the distribution of coordinate data and its homoscedasticity. Based on fulfillment of these assumptions, parametric or non-parametric tests were run (i.e., Analysis of Variance (ANOVA), Kruskal-Wallis rank-sum test, Tukey’s post hoc test, and Dunn’s test) were conducted to determine the significance of variance between group means along the first three PCs. Pearson’s product-moment correlation was performed to assess if shape variations were correlated to size, where size was represented by the natural logarithm of talar centroid size (CS). A form-space PCA (i.e., shape + size) was carried out by multiplying Procrustes shape coordinates by the natural logarithm of CS. Visualization of shape changes along principal axes was obtained by Thin Plate Spline (TPS) deformation of the Procrustes grand mean shape surface in Avizo 9.3 (Bookstein, 1997). These analyses were performed for both whole talar shape and separately for each articular facet, except for the lateral malleolar facet. The lateral malleolar facet was excluded from analyses of individual facets because it develops after age 6 and it was not possible to include all specimens in the study sample, to study the development of the facet from its earliest beginning. Therefore, (semi)landmarks of each articular facet were used to run separate GPAs for each of the remaining articular facets. P-values were adjusted with a Bonferroni correction. Subsequent analyses were performed for these facets to thoroughly analyze shape changes across the different articular surfaces. A two-block partial least square (PLS) was run to assess the presence of any covariation between any of these articular facets.
After the above-mentioned segmentation processes, trabecular and cortical envelopes of tali were separated using Medtool 4.31 following the protocol outlined by Gross et al. (2014). Opening and closing filters (kernel size varies from 3 to 5) were applied using a customized python-based script within Medtool. Cortical porosity is removed, and a uniform shell was created and filled to generate three different masks, i.e., outer and inner, and a cortical thickness mask Gross et al., 2014; Stephens et al., 2016; Stephens et al., 2018). Finally, a tetrahedral mesh of trabecular bone was generated using the computational geometry algorithms library CGAL (www.cgal.org), a mesher that creates a 3D finite element model using Delauney triangulation (Delaunay, 1934; Gross et al., 2014). Quantifications of BV/TV and DA were carried out on trabecular mesh by moving a 5 mm sampling sphere along a background grid with 2.5 mm spacing for each scan (Gross et al., 2014). DA is calculated following the Mean Intercept Length (MIL), to derive the quantity defined as (1-[eigenvalue3/eigenvalue1]), and is scaled between 1 and 0, i.e., highly anisotropic or isotropic, respectively. Colormaps were visualized in Paraview 3.14.1 (Sandia Corporation, Kitware Inc). Mean trabecular thickness (Tb.Th, mm), trabecular number (Tb.N), and mean trabecular spacing (Tb.Sp, mm) were calculated (Hildebrand and Rüegsegger, 1997) and mapped.
3D statistical comparisons of DA and BV/TV between adjacent groups were performed following the Phenotypic PointCloud Analysis protocol (Stephens, 2020; DeMars et al., 2021). To achieve these comparisons, trabecular meshes were aligned using a modified version of the MATLAB auto3dgm package (Gao et al., 2020). 1200 pseudolandmarks (i.e., landmark-like points) were automatically placed on digital models and entered into standard geometric morphometrics software (Boyer et al., 2015). Subsequently, a GPA was performed using the “geomorph” package v.4.0.4 (Adams et al., 2018). Mean GPA coordinates were warped on the closest-to-the-mean specimen (Stephens et al., 2018) to create an average trabecular mesh. Subsequently, an average trabecular mesh was tetrahedralized using evenly spaced (1.75mm) points via TetWild (Hu et al., 2020) and vertices were converted to a point cloud. Individual point clouds were then obtained by interpolating BV/TV and DA scalar values to the vertices of the tetrahedral mesh, which were then aligned by applying the auto3dgm transformation matrices followed by a rigid, affine, and deformable alignment using a python implementation of the Coherent Point Drift algorithm (Myronenko and Song, 2010). BV/TV and DA scalar values were linearly interpolated from each individual point cloud to the corresponding points in the canonical point cloud using SciPy (Virtanen et al., 2020a; Virtanen et al., 2020b), and the mean, standard deviation, and coefficient of variation for each group were mapped to the average point cloud to statistically compare across the sample. Homologous points were compared using a two-tailed t-test, with P-values corrected (Friston, 1995; Worsley et al., 1996) and interactively visualized in Paraview. Figures illustrating these analyses were automatically generated using PyVista (Sullivan and Kaszynski, 2019). Only adjacent age classes have been tested, to avoid the comparison with different shapes.
In shape space, the first three PCs explain 57.8% of total variance (Figure 3). Shapiro-Wilk normality tests show that only PC1 was not normally distributed (PC1: W = 0.89, p-value = 0.008; PC2: W = 0.95, p = 0.3; PC3: W = 0.94, p = 0.1). Levene tests confirmed equal variance across groups (PC1: p = 0.4; PC2: p= 0.1; PC3: p= 0.7). More than any other PCs, morphometric variation in the sample is explained by PC1 (36.5%), which is significantly related to size (r=0.89, p= 0.001), and thus accounts for ontogenetic allometry. Correlations between size and PC2 or 3 are not significant (r= 0.13, p=0.4; r=0.1, p=0.5 respectively).
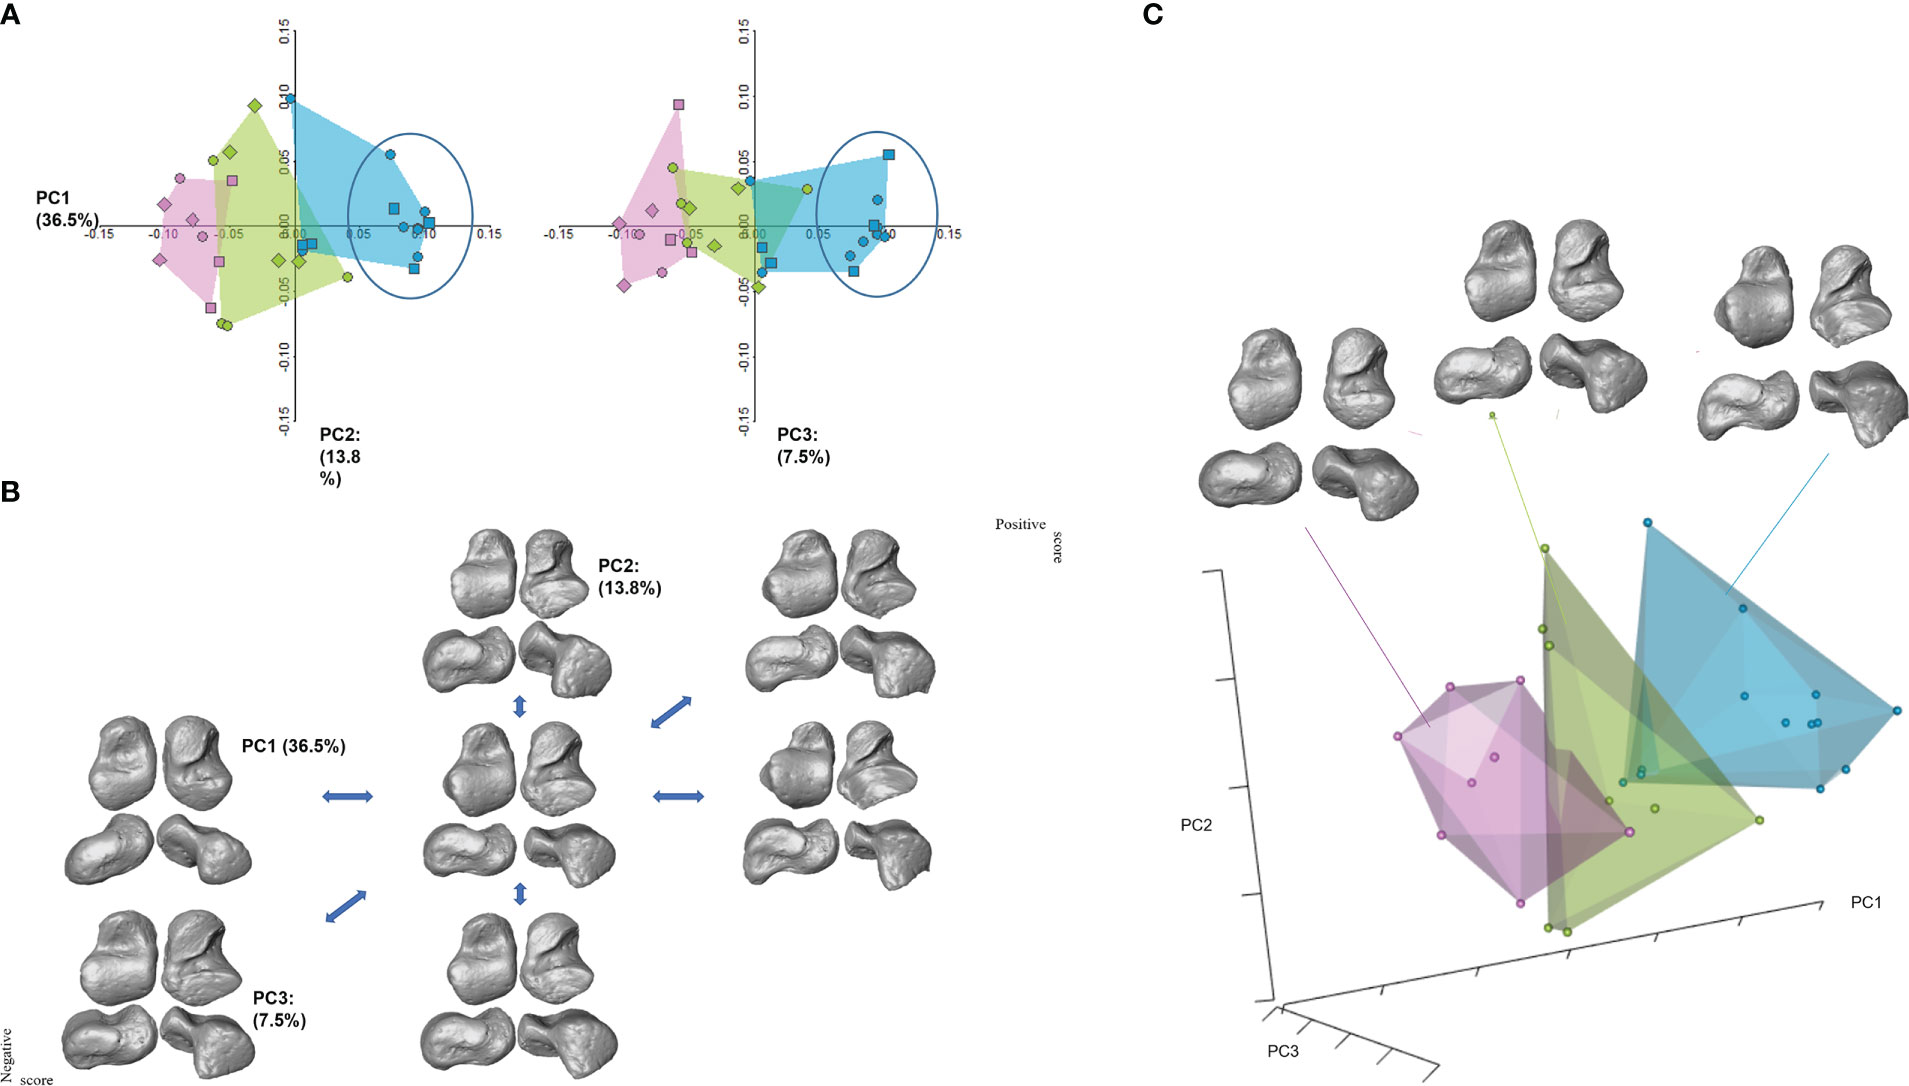
Figure 3 PCA plots. (A) On the upper left, PC1 and PC2, and to its right, PC1 and PC3. There is little overlap between age classes in morphospace. Individuals from Bologna, for which sex is known, are represented by circles (males) and squared symbols (female). Diamonds represent individuals in archaeological samples. The ellipse in A highlights a division within the Adolescence group whereby individuals older than 11 years old (inside the ellipse) are separated from individuals younger than 11. (B) Shape deformations along PC1–3 axes; (C) 3D shape plot, with renderings depicting the mean configuration for each age class. Pink represents the Late infancy class; green represents Childhood, while blue represents Adolescence. Renderings are shown in, from upper left to lower right, dorsal, plantar, medial, and lateral views.
PC1 negative scores account for a more immature morphology. The calcaneal facets are still developing, but their morphology is still immature, with the posterior facet still possessing a triangular-like shape. In this phase, i.e., the first two age classes, the sulcus tali is large and distinctly separates the two facets. Positive PC1 scores describe adult-like morphology, with well-developed articular facets. In these tali, the superior superior trochlear surface is well-defined and more elongated in a medial-distal direction. Adolescents exhibit a well-defined superior trochlear concavity, with clearly delineated lateral and medial rims. Lateral and medial malleolar facets are adult-like in shape, as are the subtalar facets. The posterior calcaneal facet is medially and plantarly rotated and exhibits a deep concavity. Space between the sub-talar articular facets is reduced, and the head is more medially orientated compared to the younger age classes (Figure 3). Interestingly, individuals within the adolescent group showed a clear separation in morphospace between individuals younger than 11 years and those older than 11 years.
PC1 scores highlight significant differences between each age group (Kruskal-Wallis χ²= 21.8, p = 0.001; Table 5; Figure 3). From 5.1–6 years to 6.1–10 years, the talar head shows a substantial increase in medial rotation relative to the long axis of the body, while the superior trochlear surface greatly expands in surface area and changes in shape, becoming more squared in dorsal view. In general, articular margins of the talar articular surfaces are more delineated. The posterior calcaneal facet remains triangular and without a concavity. Comparatively more striking changes are visible in the 10.1–15 years age group, which exhibits adult-like morphology. Morphological changes along PC2 (13.8%; ANOVA: df = 2, F-test = 0.1, p = 0.8) show a clear development of the superior trochlear surface along positive values, i.e., a size increase, shape change towards a more adult configuration, and more demarcated facet margins especially of the anterior subtalar articulation. PC3 scores (7.5%; ANOVA: df = 2, F-test = 0.3, p = 0.7) capture an increased medial orientation of the head.
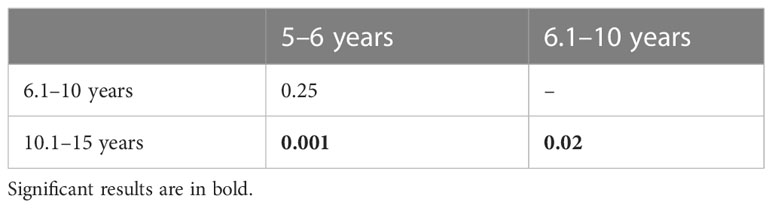
Table 5 Results of Dunn’s-test post-hoc for PC1 scores (p-values).
In form space, the first three PCs explain 85.6% of the total variance (Figure S1). Most of the morphometric variation in form space is explained by PC1 (78.4%), which is highly correlated with CS (r = 0.99, p = 0.001). Neither PC2 (4.5%) nor PC3 (2.7%) are correlated with CS (r = 0.02; p = 0.9; r = 0.02, p = 0.8 respectively), and both account for only minor morphological changes. The oldest age class is clearly separated from the youngest. Shape scores among the three groups for PC1 are significantly different (ANOVA: df = 2, F–test = 62.7, p = 0.001), while differences along PC2 (ANOVA: df = 2, F-test = 0.02, p = 0.9) and PC3 (ANOVA df = 2, F-test = 0.09, p = 0.9) are not significant. Tukey post-hoc test results for the form space PCA are reported in Table S2, which reveal significant differences between each class, due to the size differences.
The first three PCs explain 80.5% of the total variance (Figure S2). In shape space, an ANOVA does not show significant differences along the first three PCs (PC1: df = 2, F = 2.8, p = 0.09; PC2: df = 2, F-test = 0.3, p = 1; PC3: df = 2, F = 1.5, p = 1). PC1 (42.4%), is highly correlated with size (r = 0.63; p = 0.0002) and accounts for a more immature shape (i.e., negative values), that is characterized by a less rhomboidal outlined and a smooth, subtly defined anterior margin. Positive values on PC1 (i.e., the oldest individuals) show a more clearly defined facet, with clearly marked anterior margins and antero-posterior elongation. PC2 (27.9%), on the other hand, describes an enlargement of the facet along positive values, while PC3 (10.15%) captures a decreasingly flattened anterior surface of the facet.
The first three PCs explain 75.4% of the total variance (Figure S3). PC1 (57.2%) accounts for a more globular head morphology, which shows an increase in medial-lateral elongation along positive scores, with a more prominent superior margin and a flatter profile. PC2 (10%) and PC3 (8.1%) both describe increases in head medial elongation, with PC3 accounting for ontogenetic allometry (r = 0.5; p = 0.001). A Kruskal-Wallis test does not show a significant difference along PC2 (χ² = 1.5284, df = 2, p = 1), and an ANOVA resulted in non-significant differences only for PC3 values (PC1: df = 2, F-test = 0.5, p = 1; PC3: df = 2, F-test = 4.7, p = 0.1).
The first three PCs describe 78.5% of the total variance (Figure S4). Along positive values, PC1 (45.8%) shows an increase in heights of the superior profile while the superior trochlear surface develops, producing a more arched profile. The facet becomes more concave, with a more pointed proximal margin. PC2 (18.6%) account for an increase in size, while PC3 (10%) accounts for slight changes in the anterior margin, which becomes more defined along positive values. A Kruskal-Wallis test does not detect any significant difference between groups along PC1 and PC2 scores (PC1: χ² = 0.034218, df = 2, p = 1; PC2: χ² = 2.9541, df = 2, p = 1). An ANOVA highlights significant differences along PC3 scores (df = 2, F-test = 7.3, p = 0.02). Tukey’s post hoc results are shown in Table S3. PC3 is highly correlated with size (Pearson r = 0.67, p = 0.001).
The first three PCs account for 79.5% of the total variance (Figure S6). Capturing the medial increase of the facet during growth. An ANOVA highlights significant differences only among PC1 values (df = 2, F-test = 25, p = 0.01), which is strongly correlated with size (r = 0.89; p = 0.001). PC1 (39.6%) accounts for a more trapezoidal shape in the youngest cohort, which increases in size along positive scores, ultimately changing into a more rectangular shape. Tukey’s post hoc results are shown in Table S4.
The first three PCs account for 69.6% of the total variance (Figure S7). Significant differences between groups are present along PC1 scores (ANOVA: Df = 2, F = 17, p = 0.01), while PC2 (Kruskal-Wallis’ χ² = 0.2, df = 2, p = 1) and PC3 (ANOVA: df = 2, F-test = 0.2, p = 1) do not contribute to separating age groups. PC1 (46.9%) accounts for a small and not elongated trochlea along negative values, with an almost flat profile, due to subtle medial and lateral rims, and a smooth posterior margin. Changes along positive values of PC1 capture a great increase in antero-posterior elongation of the surface, higher lateral and medial rims, increased concavity of the dorsal surface and a great increase in superior trochlear curvature. The anterior and posterior margins are more defined. PC2 (14%) and PC3 (8.5%) both capture slight changes in superior trochlear curvature. Tukey’s post-hoc test results are described in Table S5. Pearson correlation test highlights that PC1 is highly correlated with size, describing ontogenetic allometry morphological variations (r = 0.89; p = 0.001).
Partially least square results are summarized in Table 6 and Figure S7. Shape of the navicular facet and its associations with shape of the anterior calcaneal facet are significant. Superior trochlear shape is also strictly associated with the shapes of the posterior calcaneal facet and the medial malleolar facet. Finally, shape of the posterior calcaneal facet is significantly associated with shape of the medial malleolar facet.
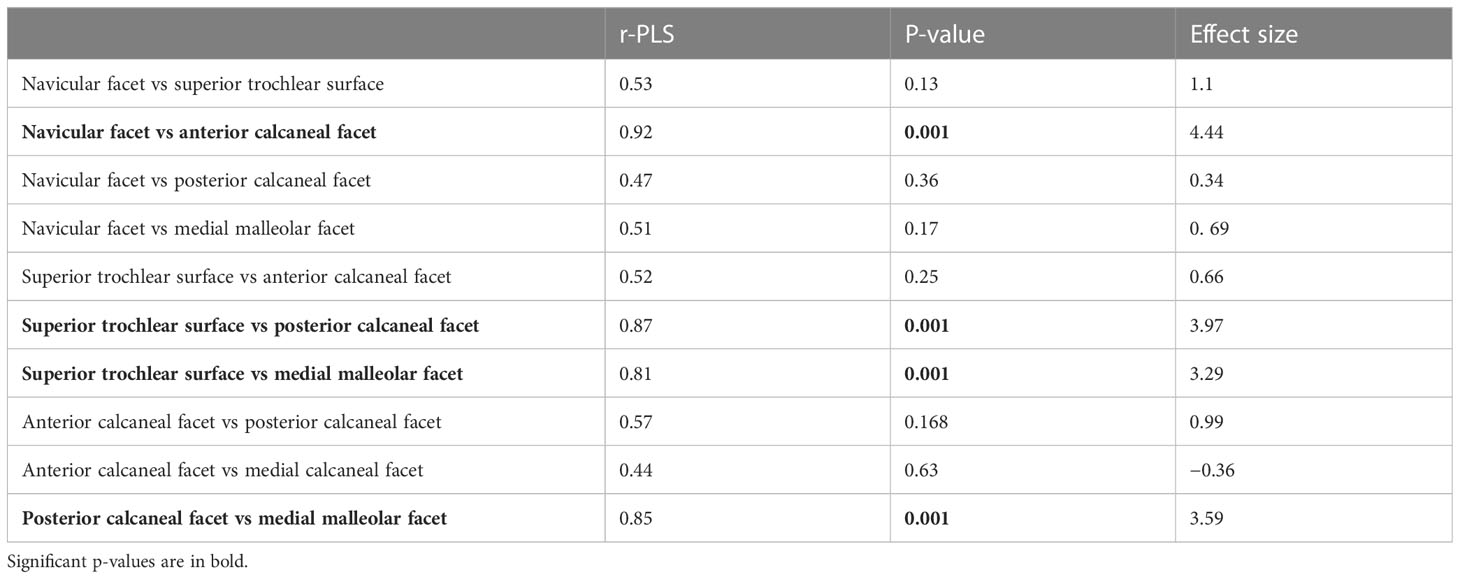
Table 6 PLS results for the association between articular facets.
Mean values for age classes are listed in Table 7 (individual values are listed in Tables S6, S7) and represented in Figure 4. In the 5.1–6-year class, trabecular architecture shows lower BV/TV values and thinner trabeculae that are more densely packed than in the oldest age class. The highest average BV/TV values are observed in the 6.1–10-year age class. The number of trabeculae decreases in the 6.1–10-year group and is accompanied by an increase in spacing and strut thickness. After 10.1 years, tali show fewer and thicker trabeculae, while spacing decreases again. BV/TV values increase with age in different areas of the talus, at different rates. Between 5.1 and 6 years, BV/TV values are initially quite low. In this age class, higher values are observed at the superior trochlear surface, superior and most distal part of the head, the posterior calcaneal facet, and the lateral malleolar process (Figure 4). Between 6.1 and 10 years, the relative pattern is similar between locations, but there are overall higher magnitudes across all locations. After 10 years, patterns in BV/TV values between locations shift to being the highest in almost all the talar body, except for the medial and inferior part of the head, in the most distal part of the anterior calcaneal facet, and in the postero-lateral part of the superior trochlear surface.
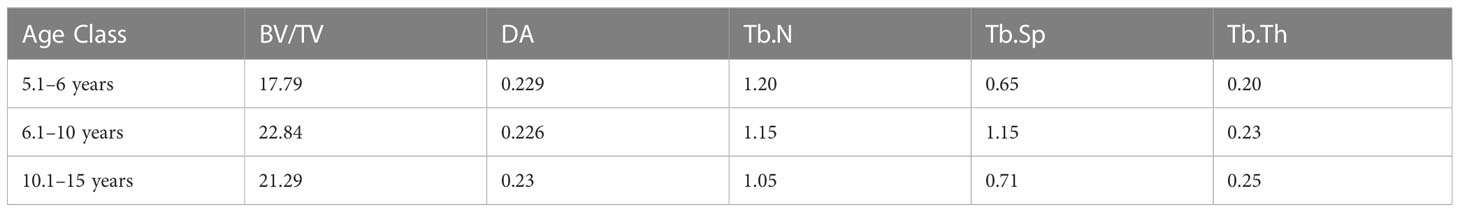
Table 7 Mean age-groups values.
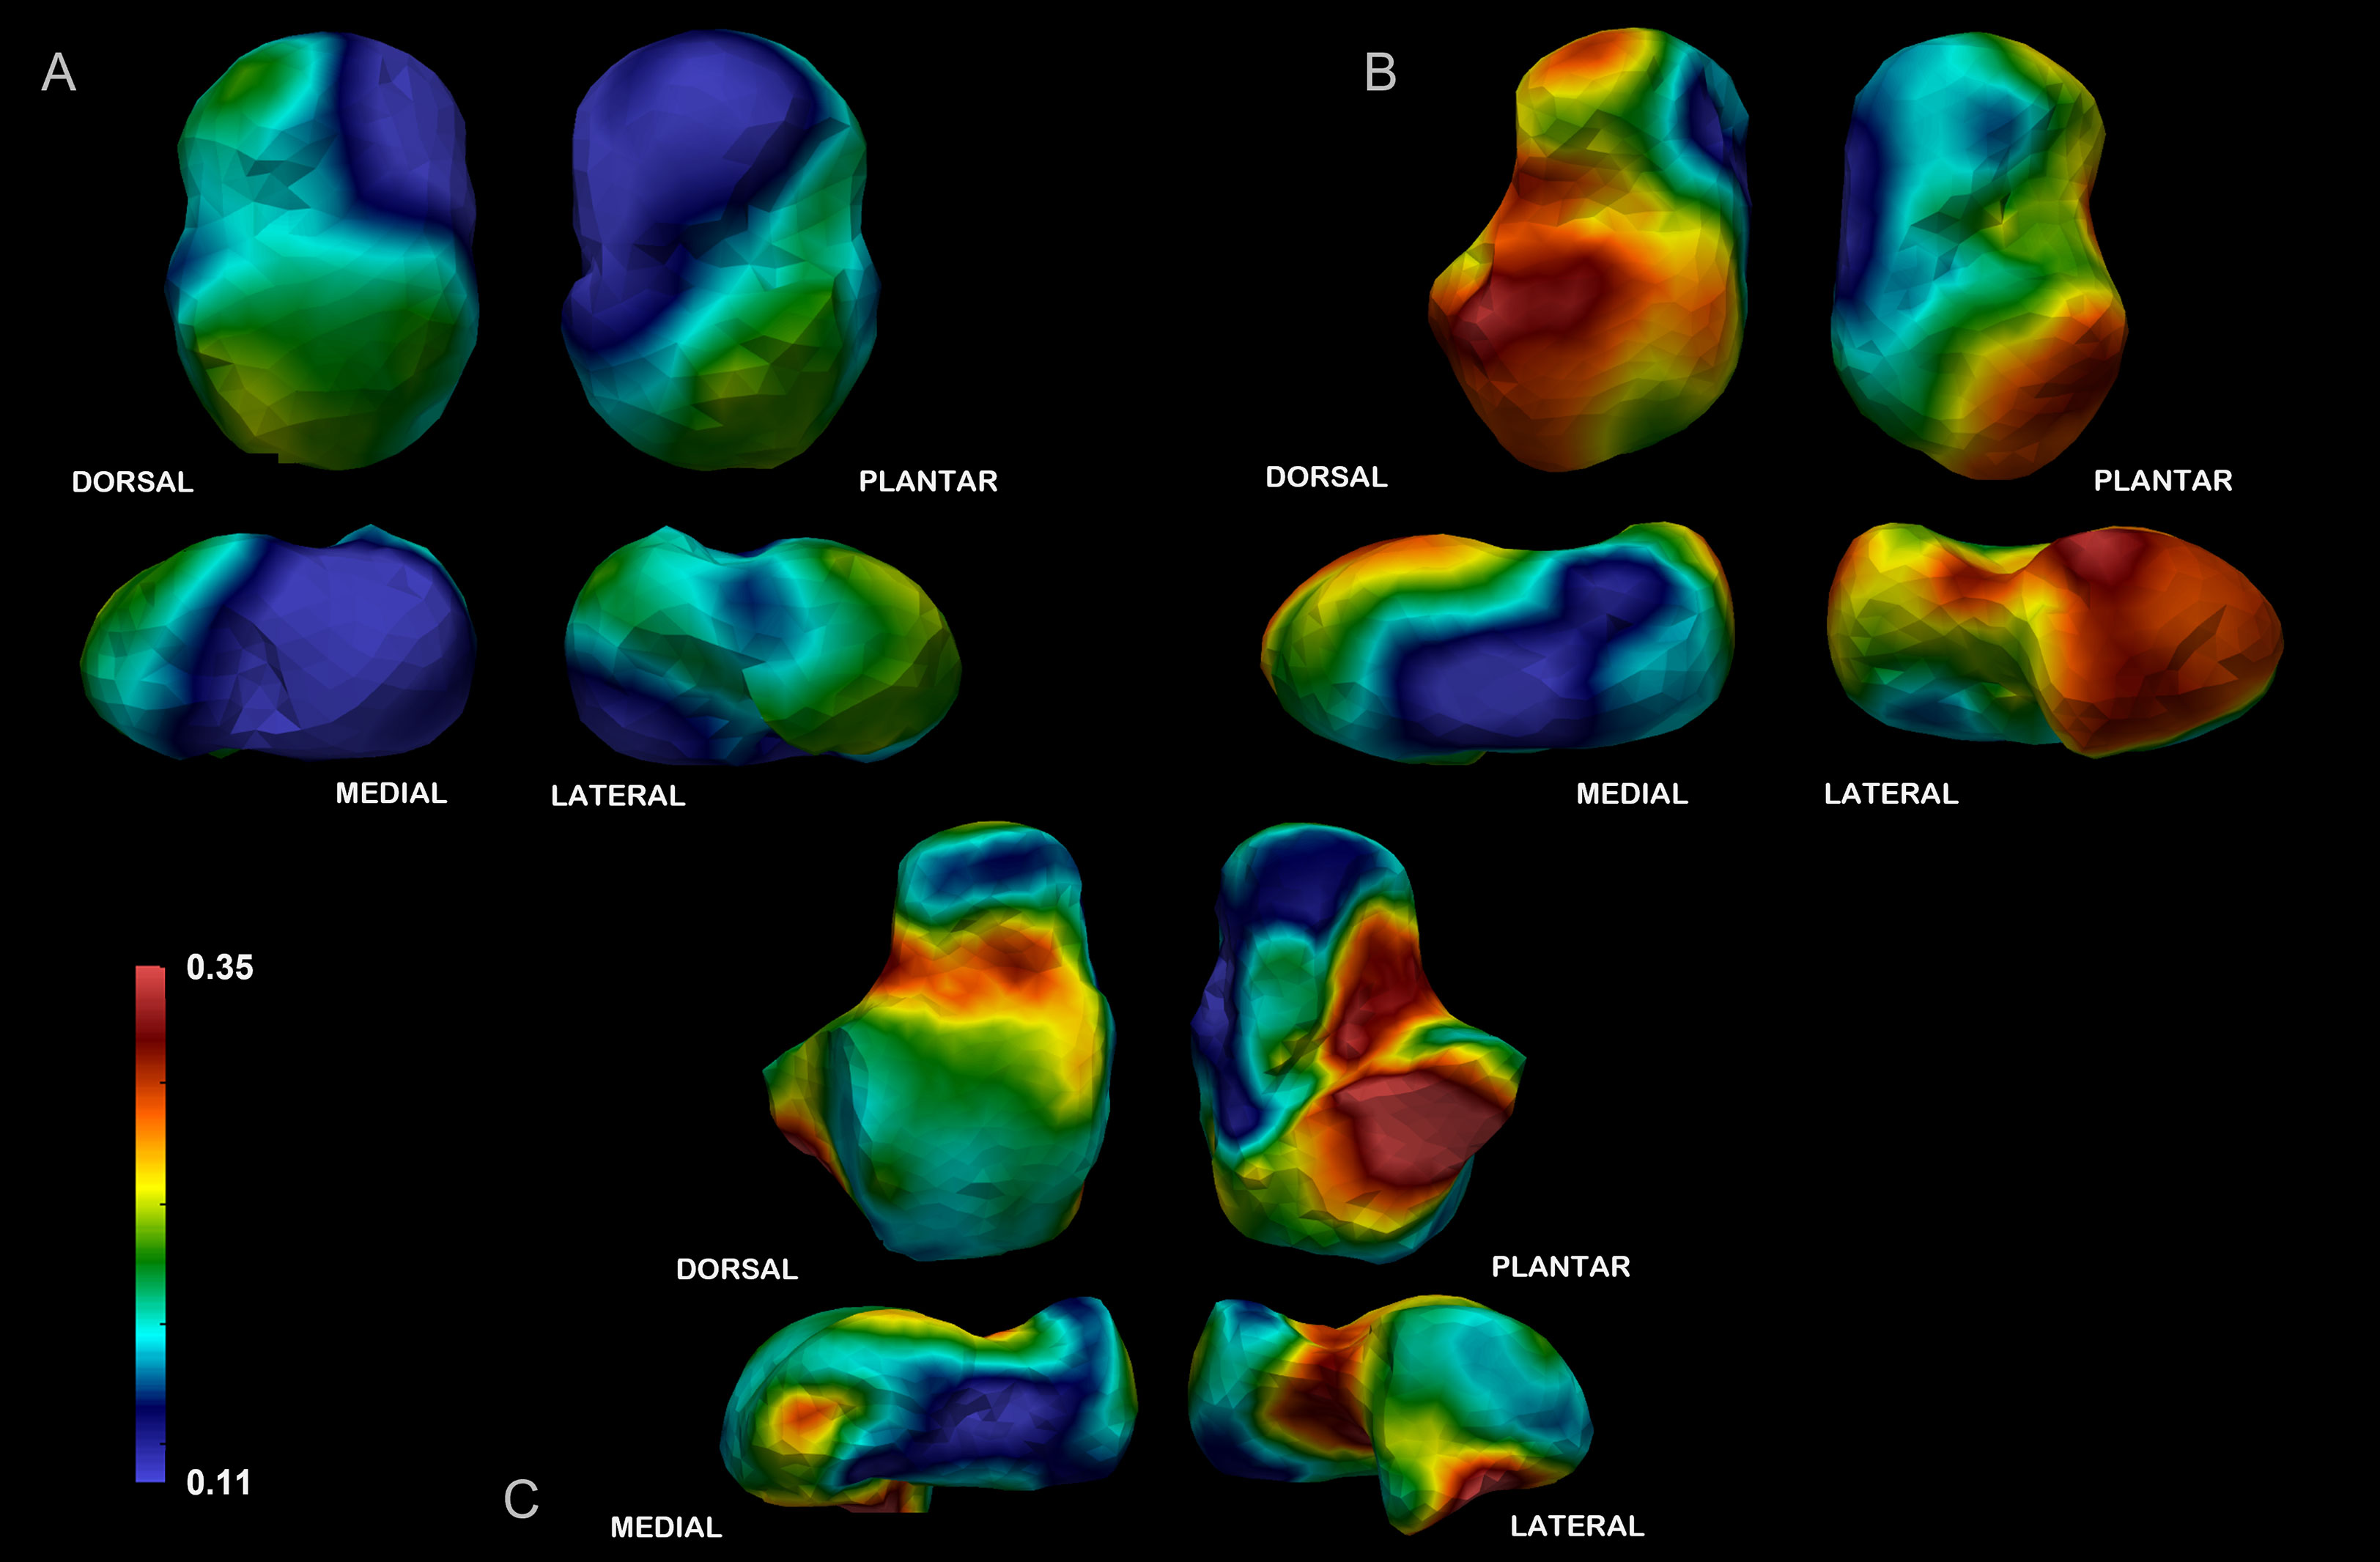
Figure 4 BV/TV average. Warm colors represent high values. The individuals represented in the pictures are representative of the closest-to-the-mean individuals of each age group. (A) In the 5.1–6-year class BV/TV values are initially quite low. The highest values are observed in the superior trochlear surface, medial-superior and most distal part of the head, the posterior calcaneal facet, and the lateral malleolar process. (B) The highest average BV/TV values are observed in the 6.1–10-year age class, especially in the superior trochlear surface and lateral malleolar facet. In general, the relative spatial distribution of BV/TV is like the younger age group. (C) In the oldest class, the spatial arrangement of high BV/TV values shifts to including almost all the talar body, except for the medial and inferior part of the head, in the most distal part of the anterior calcaneal facet, and in the postero-lateral part of the superior trochlear surface. Renderings in each age group are displayed in dorsal, plantar, lateral, and medial views, from upper-left, clockwise.
DA is more stable across age classes by comparison with similar values in all three classes. There is a slight increase in the 10.1–15 group (Figure 5), suggesting that a plateau is reached early during ontogeny.
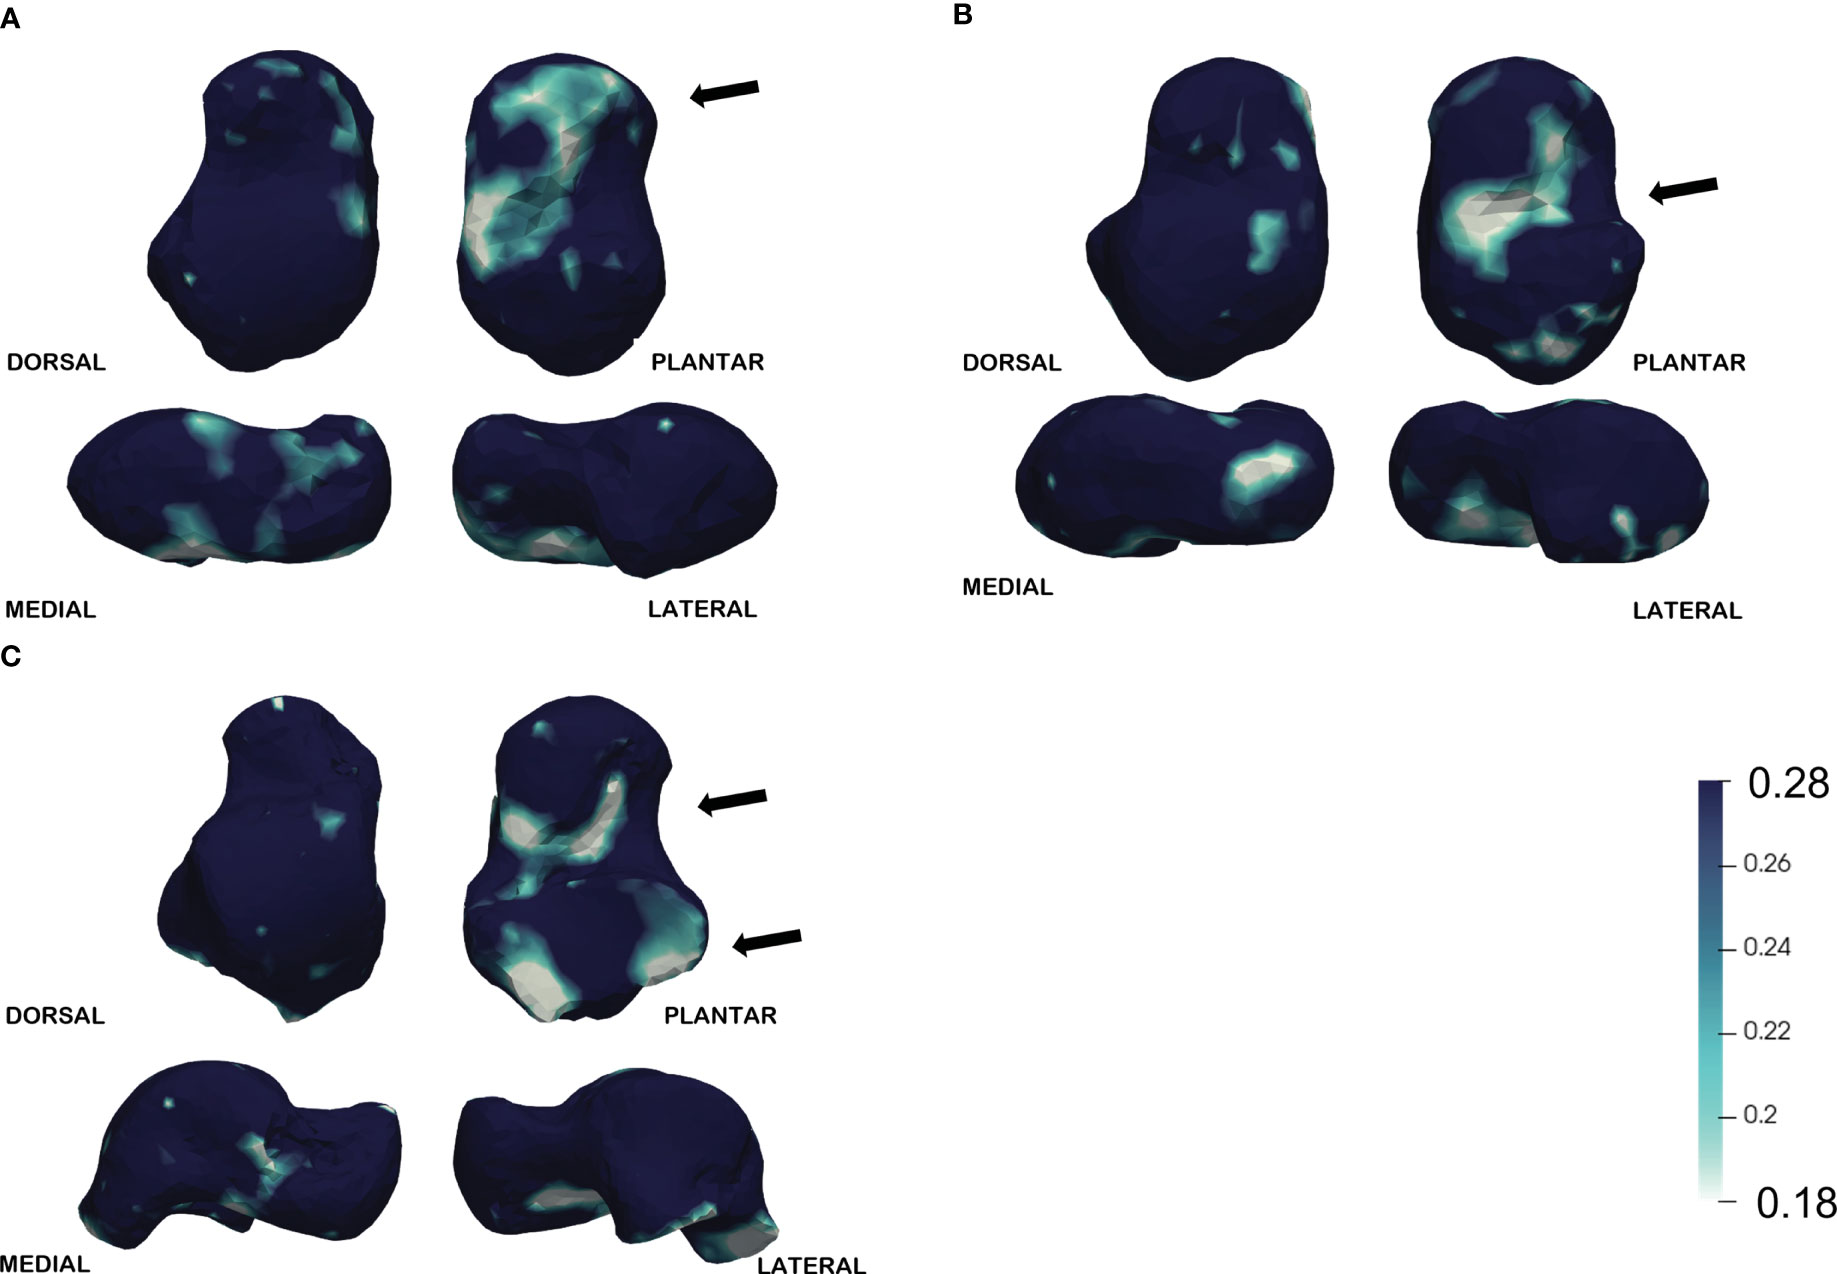
Figure 5 DA average. Darker colors represent higher (more anisotropic) values. DA is more stable across age classes by comparison. (A) In the youngest class (5.1–6.1) the lower values are displayed mostly in the inferior surface, namely on the anterior calcaneal facet and in the medial region of the sulcus tali. (B) Similarly, in the middle group (6.1–10) the lower values are displayed on the sulcus tali, (C) while in the oldest class (10.1–15) the lower values are visible also in the posterior calcaneal facet. The arrows indicate the regions with the lower DA values for each age class.
In the youngest class (5.1–6) the lower values are displayed mostly on the inferior surface, namely on the anterior calcaneal facet and in the medial region of the sulcus tali. Similarly, in the middle group (6.1–10) the lower values are displayed on the sulcus tali, while in the oldest class (10.1–15) the lower values are visible also in the posterior calcaneal facet.
The T-test for homologous points in the point clouds in adjacent classes indicates significant differences between mean age classes. Results showed that BV/TV differs significantly between the youngest and middle age classes (5.1–6 vs 6.1–10 years, Figure 6). Significant differences between these classes are particularly visible in the lateral side and part of the lateral portion of the head, the lateral portion of the superior trochlear surface, and the lateral malleolar region, with higher values occurring in the middle age class in almost all the significantly different regions (i.e., yellow-marked areas in Figure 6). No significant differences are observed between the middle and oldest age classes.
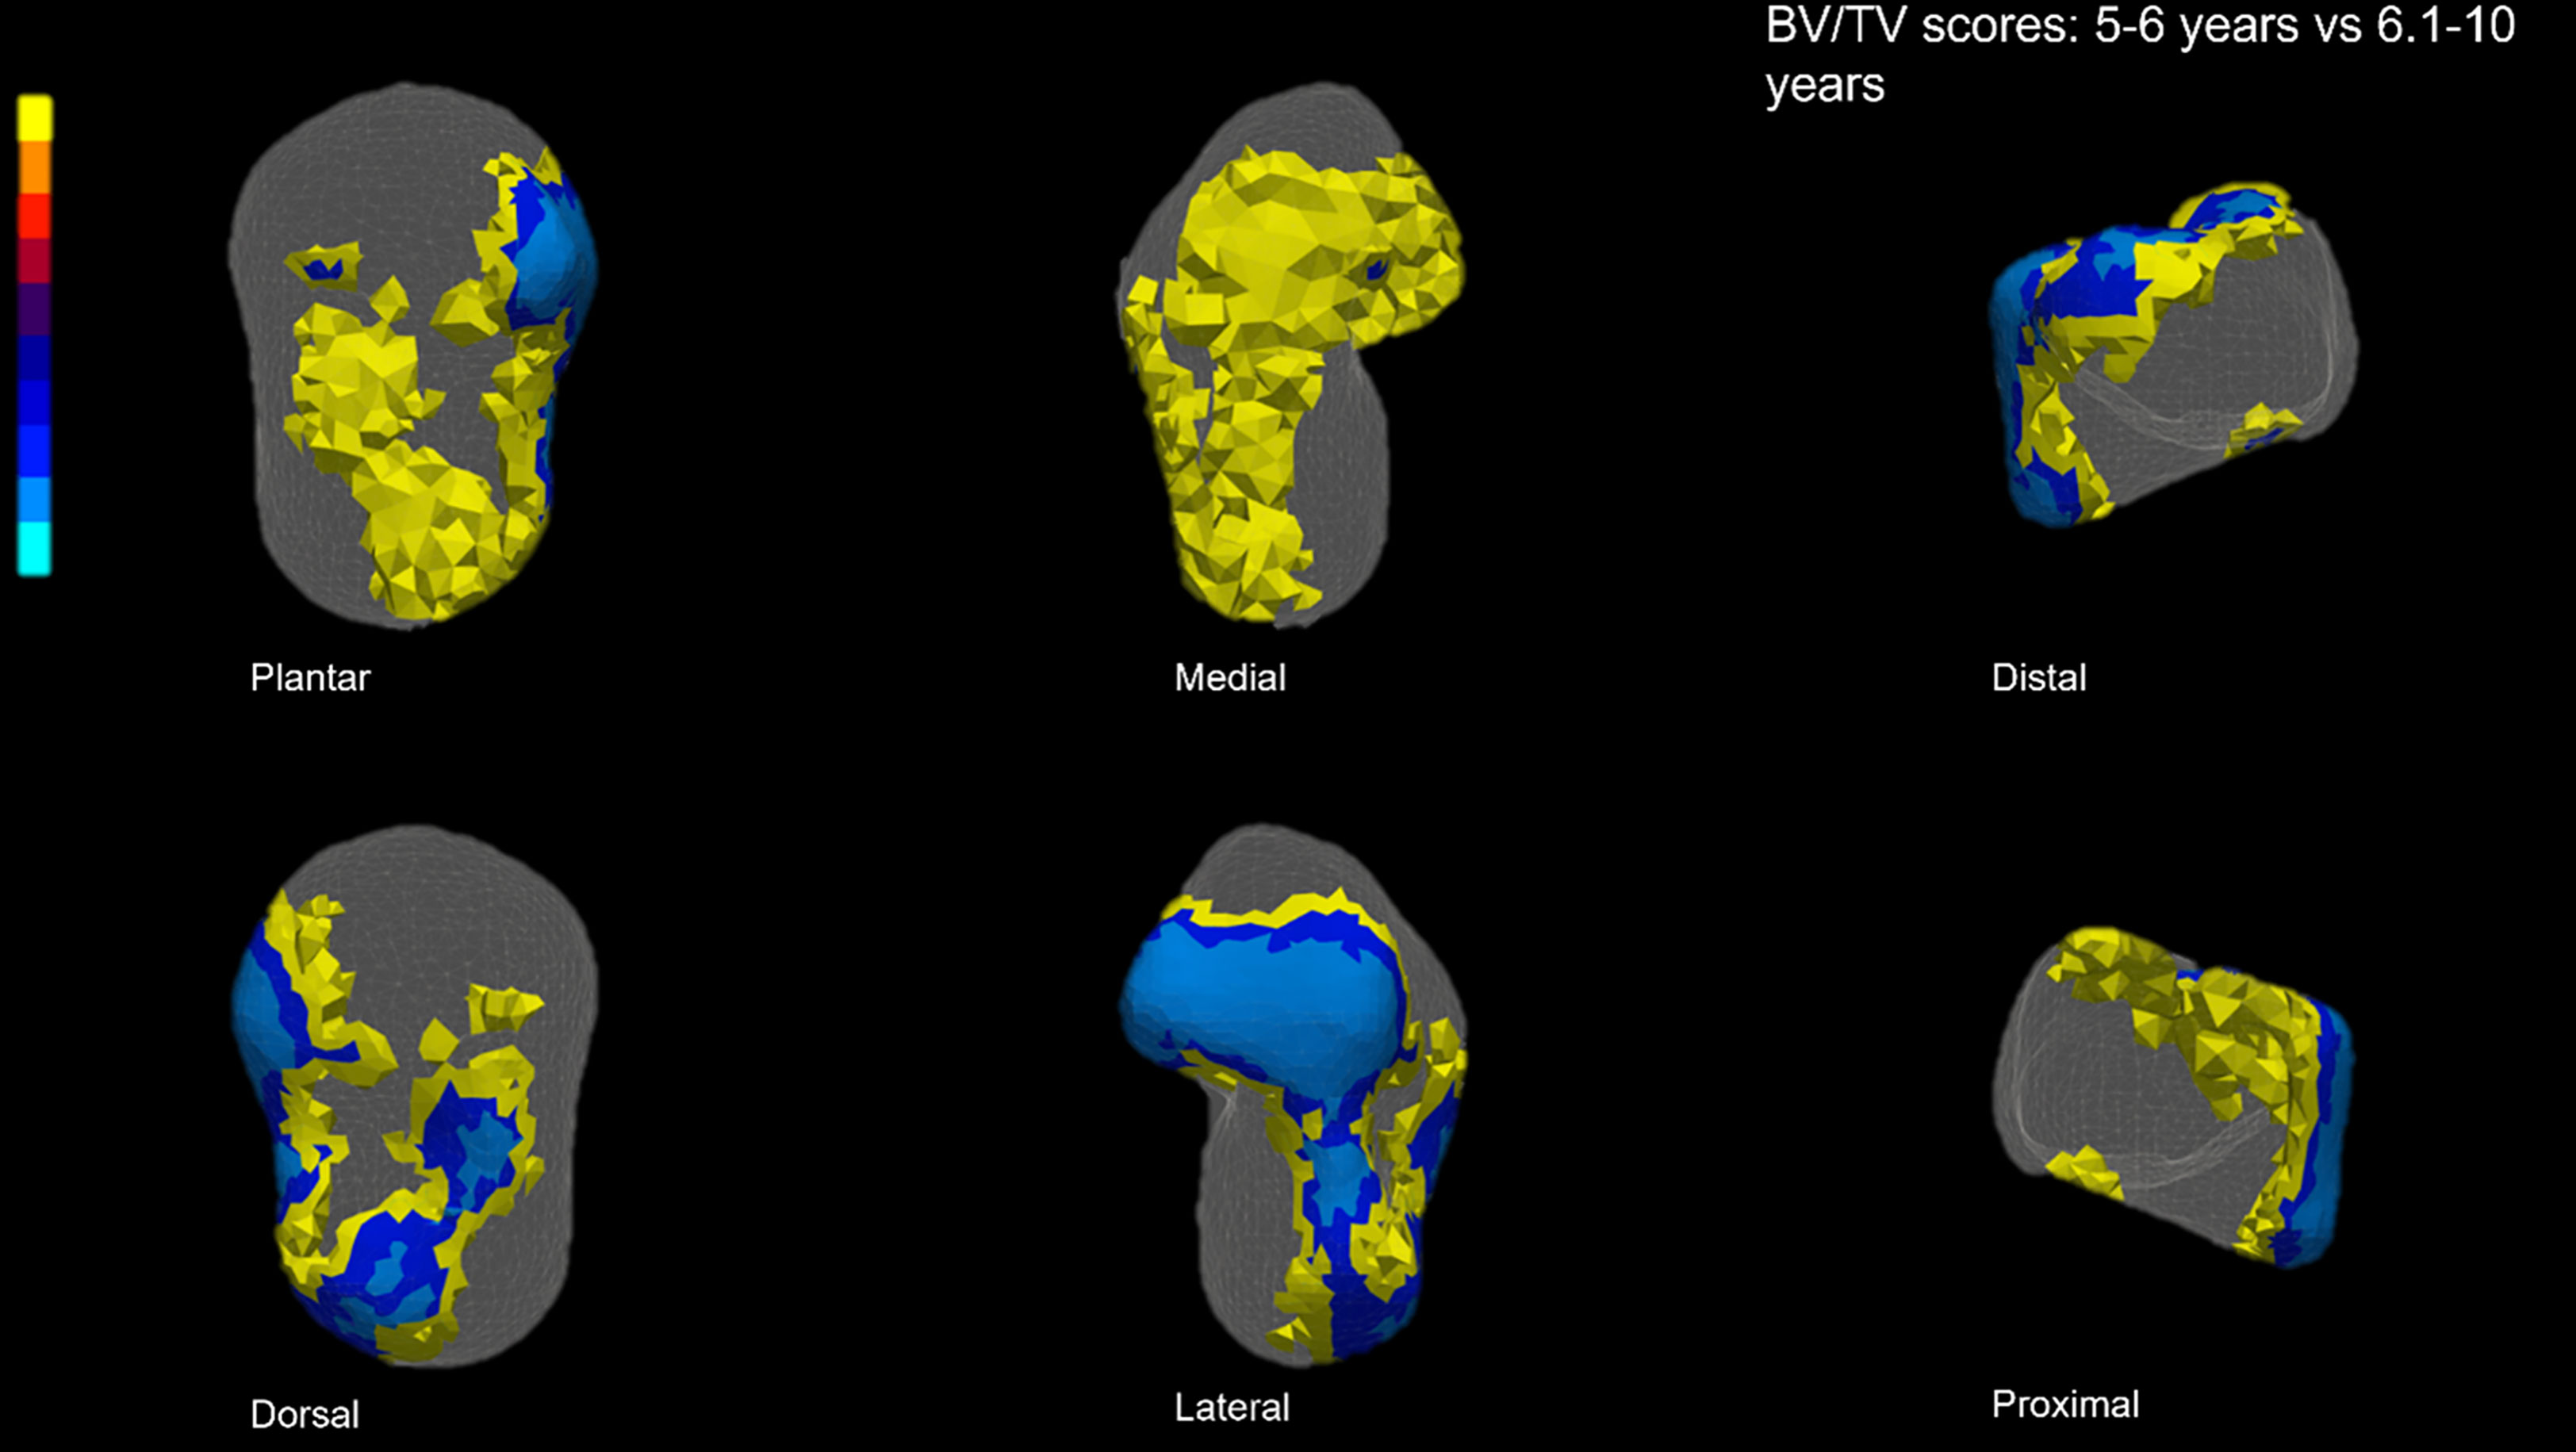
Figure 6 Significant BV/TV T-Scores. Yellow indicates higher BV/TV in the 5–6.1 year, while blue represents higher BV/TV in the 6.1–10-year group. The youngest individuals exhibit higher BV/TV in the lateral side of the talus, including the lateral region of the head, in the superior trochlear surface, and in the neck region (in medial and plantar views, due to the transparency of the model, the inner part of the colored regions is displayed). Increased BV/TV in the 6.1–10-year age class is particularly clear in the lateral malleolar process and lateral and superior part of the head.
For DA, T-test scores also showed significant differences among age classes. The youngest age class significantly differs from the 6.1–10 age class, specifically in the lateral side of the superior trochlear surface (Figure 7) and most of the lateral process. Significant differences are also visible when comparing 6.1–10 vs 10.1–15-year age classes (Figure 8), specifically in the lateral and anterior parts of the superior trochlear surface.
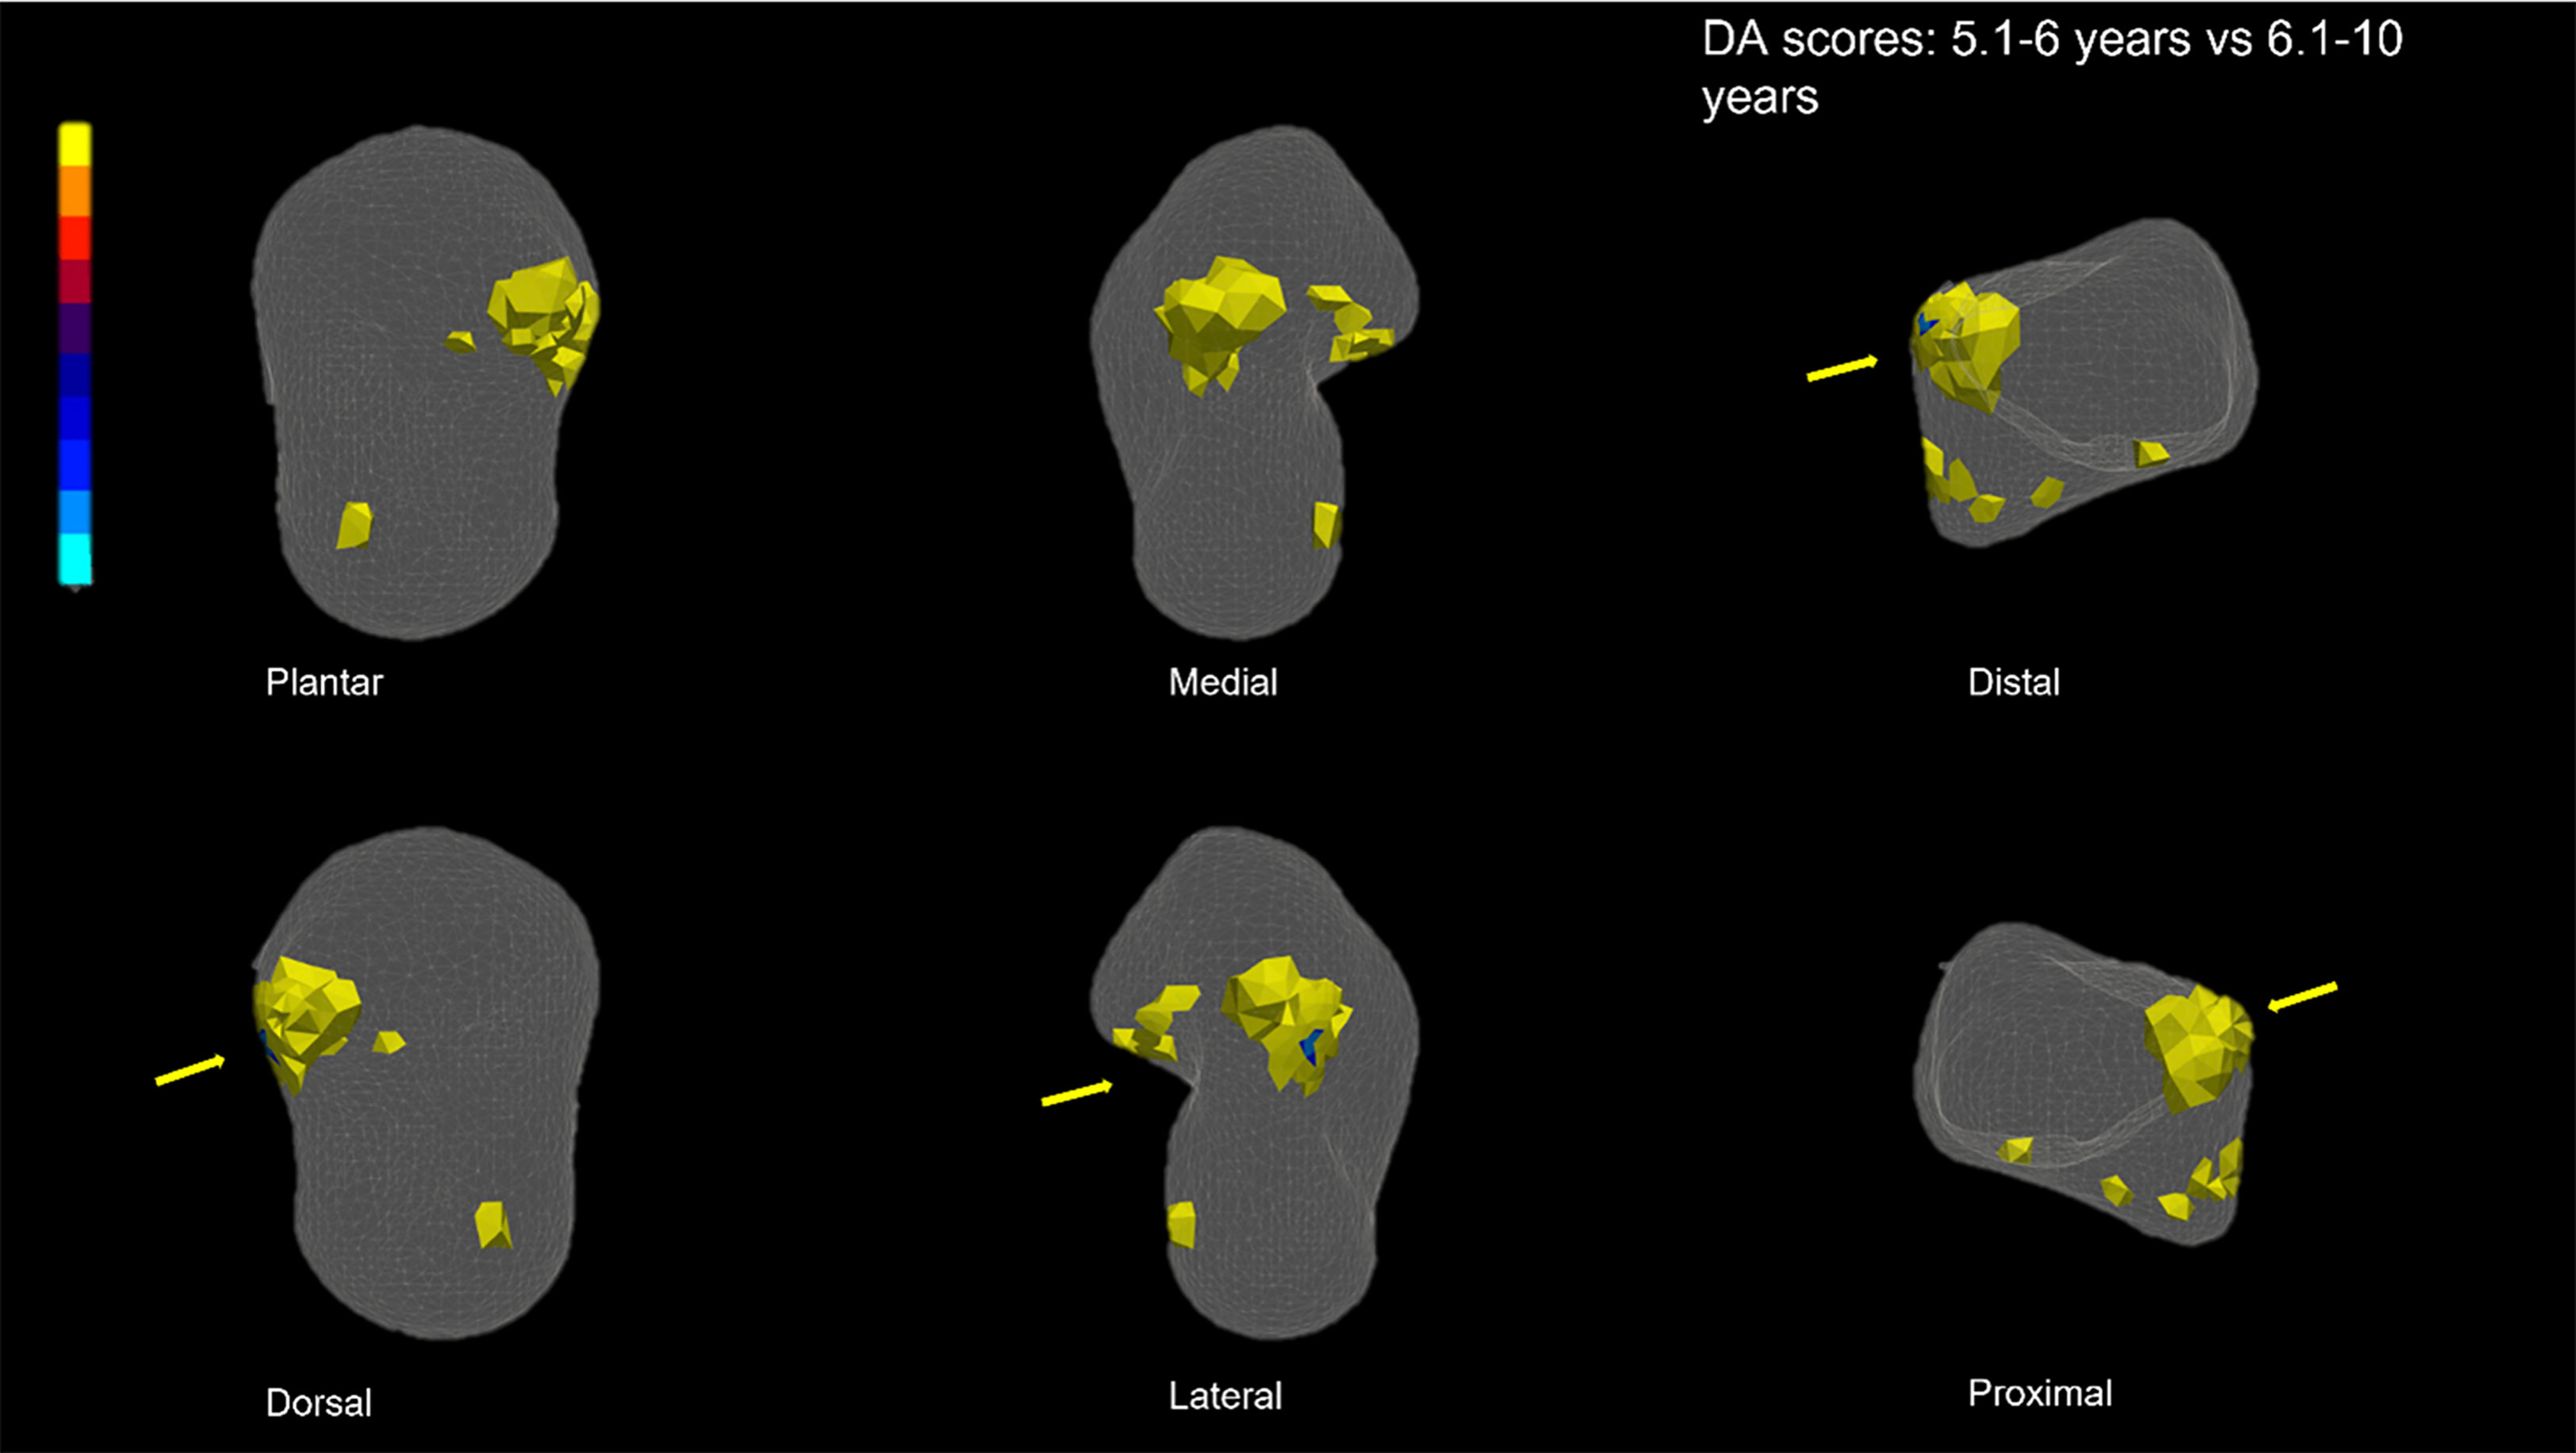
Figure 7 DA T-Score. Scores are represented into a transparent talus to facilitate the visualization of the internal area. Warm colours represent where values are higher in the 6.1–10 age group than in the 10.1–15-year group in the pairwise class comparison. T-test results for DA show that DA is significantly higher in a small lateral portion of the posterior calcaneal facet, and on the anterior-medial region of the superior trochlear surface (in lateral view, due to the transparency of the model, the inner part of the colored regions is displayed). The arrows indicate the medal side.
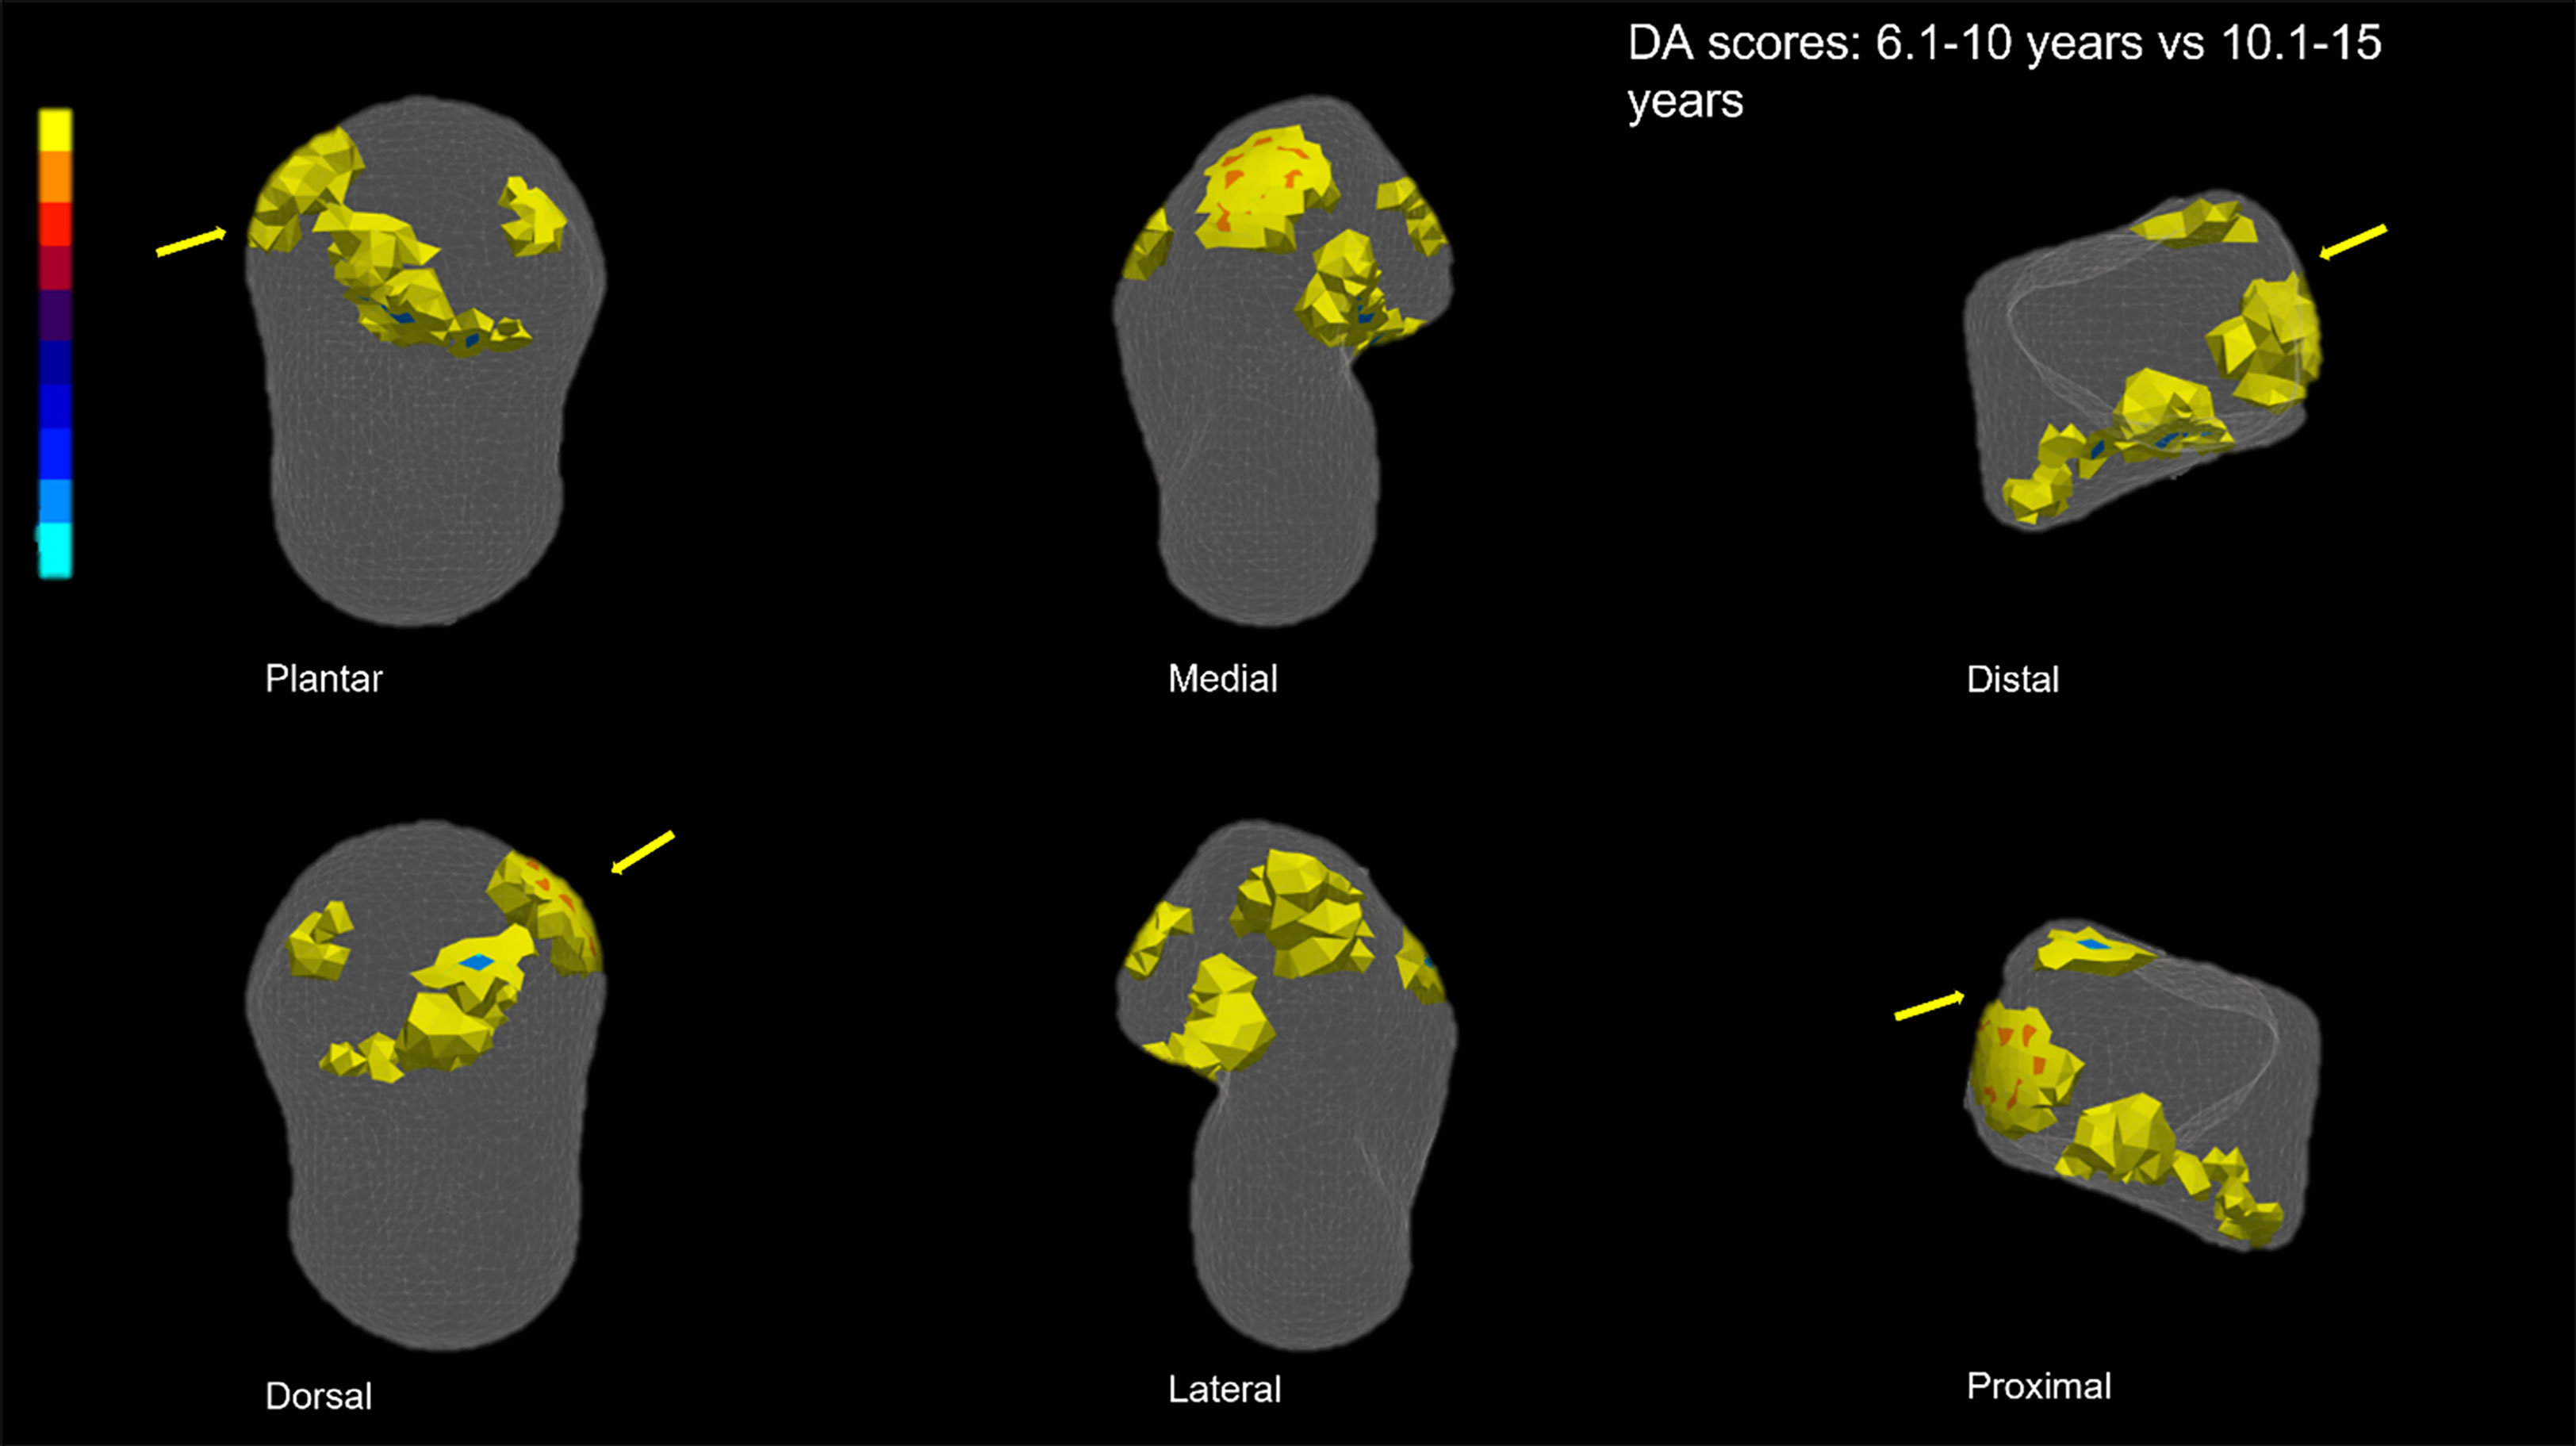
Figure 8 DA T-Score. Scores are represented into a transparent talus to facilitate the visualization of the internal area. Warm colours represent values that are higher in the 5.1–6-year group in the pairwise class comparison than those in the 6.1–10 year. T-test results for DA show that DA is significantly higher in the anterior-lateral region of the superior trochlear surface and on the lateral process in the 5.1–6-year group (in medial view, due to the transparency of the model, the inner part of the colored regions is displayed). The arrows indicate the lateral side.
This work investigates the morphology of the human talus from 5 years of age to the end of foot growth (approximated at 15 years of age), focusing on internal and external structural changes during this period. Both internal structure and external morphology exhibit adjustments during growth, potentially reflecting ontogenetic changes in joint positions and load distribution. Globally, results are in line with previous ontogenetic studies of other skeletal elements, e.g., the tibia (Raichlen et al., 2015), calcaneus (Saers et al., 2020), radius (Colombo et al., 2019), and talus (Hellier and Jeffery, 2006). We hypothesized a slight increase in talar facet size during late childhood followed by a more pronounced rotation of articular facets in response to increased locomotor loading. We also assumed that the superior trochlear surface and posterior calcaneal facets would covary, as would the navicular and anterior/middle calcaneal facets. We further hypothesized that BV/TV would increase during growth, reaching maximum values around adolescence, accompanied by an increase in trabecular thickness, while DA would stabilize, as gait attains more consistent and predictable kinematics, with the highest DA values located beneath articular surfaces of the talar head and posterior calcaneal facet and lower values located beneath articular surfaces of the superior trochlear surface and anterior calcaneal facets. We hypothesized that the highest BV/TV values would be expected in the lateral side of the superior trochlear surface and head. All hypotheses were supported, except for one. Specifically, we hypothesized that DA would increase slightly in the middle age class, around age 7–8 years old. Indeed, DA was observed to stabilize early during ontogeny, as the mean values are similar in all the age classes. However, the highest values were attained in the talar head, as predicted, but also in the posterior part of the talar body rather than the predicted posterior calcaneal facet.
This study shows that, as the overall size of the talus increases, shape and orientation of talar facets also change. The youngest age class, i.e., 5.1–6, exhibits an already functional talus but one that is still characterized by a relatively immature shape (e.g., has subtly expressed margins of articular surfaces) with articular facets only minimally rotated towards an adult configuration. In adolescents, talar shape has achieved adult form after the age of 11, with all the articular facets and posterior processes well-developed. This probably reflects a body mass increase and a more balanced distribution of the forces over broader articular surfaces. Additionally, the head, the superior trochlear surface, and posterior calcaneal facets are adjusting to becoming more medially oriented, as previously assessed by Hellier and Jeffery (2006). This presumably enables increased functional weight transfer through the medial column of the foot during push-off, i.e., forces passing through the navicular and towards the hallux. Significant changes in talar shape among age classes are also driven by ontogenetic allometry. The greatest differences are found between the oldest and middle (i.e., 6.1–10 years) age classes, coinciding with a pubertal growth spurt. This contrasts with the pattern of change exhibited between the youngest and middle age classes, which shows continuous and progressive growth along with only gradual subtle changes in shape. After age 10–11, the growth rate increases and morphological changes become more evident, with an increase not only in overall size but also in the shape and orientation of talar facets. Within the oldest age class, the 10–11-year individuals still overlap in morphospace with the 6.1–10-year age class (Figure 2), while older individuals (e.g., age 11 and older) exhibit greater increases in size and adult-like morphological development. This suggests that talar shape reaches an adult-like morphology at around 12 years, with the development of the posterior processes and the groove of the flexor hallucis longus tendon emerging as adult-like in forms (Cunningham et al., 2016). In form space, all differences appear to be attributable to the great increase in talar size, which also is linked to the pubertal growth spurt (Ubelaker, 2007).
Even though substantial changes in foot shape, observed in living individuals, occur during early childhood, considerable changes continue to take place into late adolescence, such as an increase in height of the medial longitudinal arch (Stavlas et al., 2005). The medial longitudinal arch normally develops relatively early during childhood; however, in some individuals, the foot may appear flat until puberty, with the attainment of normal arch height, delayed until adolescence (Waseda et al., 2014). In their study of foot structure in 10,155 children, they observed that arch height ratio is almost flat, in both males and females, until age 10, and then significantly increases between ages 11 and 13. A low-arched foot may be related to greater ligament laxity during childhood, which disappears during the late phases of growth as arch height increases (Staheli et al., 1987).
In the analyses of singular talar facets, noteworthy outcomes are observed. Facets are mostly discernable from 5 years of age onwards, although margins become more defined at different developmental times and rates. Subtalar joints, i.e., anterior, middle, and posterior calcaneal facets, start increasing in surface area and show more defined margins earlier than other facets, already being identifiable in the youngest age class of the study, i.e., 5.1–6 years. By comparison, the posterior margins of the superior trochlear surface and the medial malleolar facet develop later in the ontogenetic sample.
The present study confirmed that the margins of the lateral malleolar facet are the last to become well-defined (Scheuer and Black, 2004). Moreover, this facet could not be reliably included in the single facet analysis for the developmental period because of its poorly demarcated margins, or absence, in the youngest age class.
The shape analyses of singular facets show that, in general, shape does not separate the age groups, confirming a more constrained shape of the articular facets, as proposed by previous studies (Hellier and Jeffery, 2006). The anterior calcaneal facet has a smooth anterior margin in the youngest age class, and its morphological changes are predominantly focused on its anterior-posterior elongation. The medial malleolar facet is visible in 5-year-olds, and after age 10 it exhibits the greatest increase in size and change in morphology. The posterior calcaneal facet becomes more rectangular after age 10 and shifts from a flattened to a relatively concave surface. The significant results in the singular facet analyses were guided mainly by the allometric differences due to growth in surface area and size, as expected. In form space, all differences appear to be attributable to the substantial increase in talar size over the three age classes, which also are linked to the pubertal growth spurt (Ubelaker, 2007).
The change in trochlear shape observed in the present study, with an enlarged, more convex surface, may facilitate the absorption and distribution of peak forces throughout the superior trochlear surface. These joint loads then pass through trabecular bone beneath the trochlear surface to the posterior calcaneal facet of the calcaneus, and also forward through the talar neck, ultimately passing through the talonavicular and anterior subtalar joints (Pal and Routal, 1998; Hellier and Jeffery, 2006). Subsequently, these forces pass through the medial column of the foot, during the mid-stance and push-off.
Interestingly, when covariation between facets was tested, trochlear shape changes were significantly linked to shape changes of the medial malleolar and posterior calcaneal facets, while the navicular facet exhibited strong covariation with the anterior calcaneal facet. Changes in posterior calcaneal facet changes in shape were significantly linked to changes in the medial malleolar facet. This highlights the correlation in orientation of some of talar articular facets during growth, consistent with those observed in previous studies (Hellier and Jeffery, 2006). Specifically, covariation in shape changes and orientation in 1) the superior trochlear surface and posterior calcaneal facets and 2) the navicular and anterior calcaneal facets may be linked as biomechanical adaptations for effective transmission of forces through the talus (Hellier and Jeffery, 2006), as changing their orientations conjointly may reduce mechanical loading. For example, as a response to increased loads during growth associated with increases in body weight, and to ameliorate the transmission of forces to other tarsals, the talar head rotates medially and plantarly, the posterior calcaneal facet rotates medially to facilitate the transmission of forces to the calcaneus, i.e., heel.
Considering internal morphology, trabecular bone varies between age classes. While BV/TV shifts during the age 5–15 range, DA is relatively more stable over the developmental period examined in the study since it exhibits smaller variations between age classes. It is possible to highlight that significantly higher values in the anteromedial region of the trochlea are recorded in the 6.1–10-year age group, possibly reflecting an increase in medial weight shift typical of the adult-like locomotor patterns. At heel strike, load is initially transmitted from the posterior part of the superior trochlear surface to the posterior subtalar joint (Pal and Routal, 1998). During midstance, load is transmitted to the heel through the posterior and anterior calcaneal facets, and distally towards the navicular through the talar head. From heel rise to toe-off, body weight is transmitted to the forefoot, while the inferior portions of the talar neck and head are subjected to tensile forces. Changes captured in trabecular structure after age 6 are supposedly linked to changes in body size and proportions, i.e., increase in BV/TV values. The lowest BV/TV values were observed on the medial side of the talus and anterior calcaneal facet. At around 10–12 years, body mass increases at faster rates due to the pubertal growth spurt, and socially, adolescents are supposed to participate in adult activities i.e., probably more intense activities (Lewis, 2007). Trabecular structure in the talus was expected to increase with age, following allometric scaling patterns (Shaw and Ryan, 2012; Saers et al., 2019). Growth spurt onset changes depend on sex: females are supposed to increase growth rates by age 10, which is earlier than boys where increased growth rates occur by about age 12 (Ubelaker, 2007). Unfortunately, we could not explore the potential effect of sexual dimorphism on creating differences in growth patterns across the groups in our sample. Our sample from Bologna, the only one for which the sex of the individuals was known, was not homogenous i.e., female individuals were mostly in the 5–6.1 group, while male individuals were older. This limits our analysis of the role played by sexual dimorphism during growth in the talar external and internal morphology.
There were a few limitations in this study. The sample was not homogeneous since it was composed of different populations rather than a single group, and for most of the individuals we only had age estimations. We recognize this is an intrinsic limit of anthropological studies, when archaeological samples are concerned. Future studies need to increase the number of individuals for whom the age-at-death is known. Also, we do not have any kind of information about the walking habit of the individuals under study, which likely differed between rural and urban environments, as well as modification through time. We do not have information about the habitual footwear of the different groups in the sample nor about their body mass. These limitations would likely guide our future research questions, which will be aimed to increase the number of individuals for which this information is available. This would greatly increase our knowledge about the late ontogeny of the human talus.
This is the first study to explore late talar growth by examining both internal and external morphologies. Taken together, these results may help understand how the talus adapts to changes in locomotor activity and how it responds to the increase in body mass during the late phases of growth. Results contribute to a better understanding of talar plasticity, improving interpretations of adult human talar form. Future studies should consider building on this investigation by adding new populations, i.e., those with known sex, age, and weight, to explore whether dimorphism in talar form could be linked to the puberty growth spurt.
The raw data supporting the conclusions of this article will be made available by the authors, without undue reservation.
CF conceived and designed the study. CF and RS collected the data. TR and SB contributed theoretical context for the data. CF analyzed the data and RS, EB, KC, and AC, contributed analysis tools. MGB, MN, FB, IE, OM-L, TH, TS, IP, and CT contributed resources. TR and SB supervised the project. EB, RS, KC, TR, and SB contributed substantially to the interpretation of data. CF wrote the original manuscript with input from all authors. All authors contributed to the article and approved the submitted version.
We would like to thank Alessandra Sperduti (Servizio di Bioarcheologia, Museo delle Civiltà, Ministero della Cultura, Roma), Luca Bondioli (Museo delle Civiltà, Roma), Tim Stecko (Center for Quantitative Imaging (CQI), Pennsylvania State University), Andrea Rimpf (Ilok Town Museum), Siniša Krznar (Institute of Archaeology), Dženi Los (Kaducej Ltd.). The work of TH was supported by the Árpád dynasty program: The anthropological and genetic composition of the Árpád Age Hungarian population (V.1 subproject).
The authors declare that the research was conducted in the absence of any commercial or financial relationships that could be construed as a potential conflict of interest.
All claims expressed in this article are solely those of the authors and do not necessarily represent those of their affiliated organizations, or those of the publisher, the editors and the reviewers. Any product that may be evaluated in this article, or claim that may be made by its manufacturer, is not guaranteed or endorsed by the publisher.
The Supplementary Material for this article can be found online at: https://www.frontiersin.org/articles/10.3389/fevo.2023.1205277/full#supplementary-material
Acquaah F., Robson Brown K. A., Ahmed F., Jeffery N., Abel R. L. (2015). Early trabecular development in human vertebrae: overproduction, constructive regression, and refinement. Front. Endocrinol. 6 (MAY). doi: 10.3389/fendo.2015.00067
Adams D. C., Collyer M. L., Kaliontzopoupou A. (2018). “2017 Geomorph: software for geometric morphometric analyses,” in R package version 3.0. 5. Ed. A’ndSherratt E. (Vienna, Austria: R Foundation).
Adams D. C., Rohlf F. J., Slice D. E. (2013). A field comes of age: geometric morphometrics in the 21st century. Hystrix 24 (1). doi: 10.4404/hystrix-24.1-6283
Baken E. K., Collyer M. L., Kaliontzopoulou A., Adams D. C. (2021). Geomorph v4.0 and gmShiny: enhanced analytics and a new graphical interface for a comprehensive morphometric experience. Methods Ecol. Evol. 12 (12), 2355–2363. doi: 10.1111/2041-210X.13723
Barak M. M., Lieberman D. E., Hublin J. J. (2011). A Wolff in sheep’s clothing: trabecular bone adaptation in response to changes in joint loading orientation. Bone 49 (6), 1141–1151. doi: 10.1016/j.bone.2011.08.020
Barnes H. V. (1975). Physical growth and development during puberty. Med. Clinics North America 59 (6), 1305–1317. doi: 10.1016/S0025-7125(16)31931-9
Belcastro M. G., Bonfiglioli B., Pedrosi M. E., Zuppello M., Tanganelli V., Mariotti V. (2017). The history and composition of the identified human skeletal collection of the certosa cemetery (Bologna, Italy, 19th–20th century). Int. J. Osteoarchaeology 27 (5), 912–925. doi: 10.1002/oa.2605
Bookstein F. L. (1997). Landmark methods for forms without landmarks: morphometrics of group differences in outline shape. Med. Image Anal. 1 (3), 225–243. doi: 10.1016/S1361-8415(97)85012-8
Boyer D. M., Yapuncich G. C., Butler J. E., Dunn R. H., Seiffet E. R.. (2015). Evolution of postural diversity in primates as reflected by the size and shape of the medial tibial facet of the talus. Am. J. Phys. Anthropology 157 (1), 134–177. doi: 10.1002/ajpa.22702
Colombo A., Tsegai Z. J., Stephens N. B., Bettuzzi M., Morigi M., Belcastro M., et al. (2018). Autonomous bipedal walking acquisition in children: comparison of trabecular bone microarchitecture in the radial and femoral distal metaphyses. In 20th Conference of the British Association for Biological Anthropology and Osteoarchaeology.
Colombo A., Stephens N. B., Tsegai Z. J., Bettuzzi M., Morigi M. P., Belcastro M. G., et al. (2019). Trabecular analysis of the distal radial metaphysis during the acquisition of crawling and bipedal walking in childhood: a preliminary study. Bulletins Memoires la Societe d’Anthropologie Paris 31 (1–2), 43–51. doi: 10.3166/bmsap-2018-0041
Cunningham C., Scheuer L., Black S. (2016). Developmental juvenile osteology. 2nd ed. (San Diego: Academic press).
Delaunay B. (1934). Sur la sphere vide. Izv. Akad. Nauk SSSR, Otdelenie Matematicheskii i Estestvennyka Nauk, 7 (793-800), 1-2.
DeMars L. J. D., Stephens N. B., Saers J. P., Gordon A., Stock J. T., Ryan T. M. (2021). Using point clouds to investigate the relationship between trabecular bone phenotype and behavior: an example utilizing the human calcaneus. Am. J. Hum. Biol. 33 (2), 1–16. doi: 10.1002/ajhb.23468
Dunmore C. J., Wollny G., Skinner M. (2018). MIA-clustering: a novel method for segmentation of paleontological material. PeerJ 6, e4374. doi: 10.7717/peerj.4374
Ferembach D. (1980). Recommendations for age and sex diagnoses of skeletons. J. Hum. Evol. 9 (7), 517–549. doi: 10.1016/0047-2484(80)90061-5
Figus C., Stephens N. B., Sorrentino R., Bortolini E., Arrighi S., Higgins O. A., et al. (2023). Morphologies in-between : the impact of the first steps on the human talus. The Anatomical Record 1–19. doi: 10.1002/ar.25010
Figus C., Stephens N. B., Sorrentino R., Bortolini E., Oxilia G., Lugli F., et al. (2022). Human talar ontogeny : insights from morphological and trabecular changes during postnatal growth. American Journal of Biological Anthropology 179 (2), 211–228. doi: 10.1002/ajpa.24596
Friston K. J. (1995). ‘Commentary and opinion: II. statistical parametric mapping: ontology and current issues.’. J. Cereb. Blood Flow Metab. 15 (3), 361–370. doi: 10.1038/jcbfm.1995.45
Gao T., Winchester J., Stephens N. (2020). NBStephens/auto3dgm-matlab-gorgon: auto3dgm with transformation matrices. doi: 10.5281/ZENODO.4010432
Gosman J. H., Ketcham R. A. (2009). Patterns in ontogeny of human trabecular bone from SunWatch Village in the Prehistoric Ohio Valley: general features of microarchitectural change. American Journal of Physical Anthropology: The Official Publication of the American Association of Physical Anthropologists 138 (3), 318-332.
Gross T., Kivell T. L., Skinner M. M., Nguyen N. H., Pahr D. H. (2014). A CT-image-based framework for the holistic analysis of cortical and trabecular bone morphology. Palaeontologia Electronica 17 (3), 1-13. doi: 10.26879/438
Gunz P., Mitteroecker P. (2013). Semilandmarks: a method for quantifying curves and surfaces. Hystrix 24 (1), 103-109. doi: 10.4404/hystrix-24.1-6292
Havill L. M., Allen M. R., Bredbenner T. L., Burr D. B., Nicolella D. P., Turner C. H., et al. (2010). Heritability of lumbar trabecular bone mechanical properties in baboons. Bone 46 (3), 835–840. doi: 10.1016/j.bone.2009.11.002
Hellier C. A., Jeffery N. (2006). Morphological plasticity in the juvenile talus. Foot Ankle Surg. 12 (3), 139–147. doi: 10.1016/j.fas.2006.03.008
Hildebrand T., Rüegsegger P. (1997). Quantification of bone microarchitecture with the structure model index. Comput. Methods Biomechanics Biomed. Eng. 1 (1), 15–23. doi: 10.1080/01495739708936692
Hu Y., Schneider T., Wang B., Zorin D., Panozzo D. (2020). Fast tetrahedral meshing in the wild. ACM Trans. Graphics 39 (4), 60–61. doi: 10.1145/3386569.3392385
Judex S., Garman R., Squire M., Donahue L. R., Rubin C. (2004). Genetically based influences on the site-specific regulation of trabecular and cortical bone morphology. J. Bone Mineral Res. 19 (4), 600–606. doi: 10.1359/JBMR.040101
Keller T. S., Garman R., Squire M., Donahue L. R., Rubin C. (2001). The influence of bone volume fraction and ash fraction on bone strength and modulus. Bone 29 (1), 74–78.
Kivell T. L. (2016). A review of trabecular bone functional adaptation: what have we learned from trabecular analyses in extant hominoids and what can we apply to fossils? J. Anat. 228 (4), 569–594. doi: 10.1111/joa.12446
Krznar S., Rimpf A. (2018). “Research results from ilok–krstbajer site,” in Annales instituti archaeologici (Institut za arheologiju) 14 (1), 9–12.
László O. (2018). “Gyermekkorú maradványok összehasonlító biológiai antropológiai vizsgálata történeti népességekben,” in Anthropologiai Közlemények 59, 55–63.
Lewis M. E. (2007). The bioarchaeology of children: perspectives from biological and forensic anthropology (Cambridge: Cambridge University Press) 50.
Lieberman D. E., Devlin M. J., Pearson O. M. (2001). Articular area responses to mechanical loading: effects of exercise, age, and skeletal location. Am. J. Phys. Anthropology 116 (4), 266–277. doi: 10.1002/ajpa.1123
Los D. (2020). Results of the archaeological excavations of the site AN 2 beli manastir – popova zemlja. In Annales Instituti Archaeologici (Institut za arheologiju) 60 (1), 90–102.
Mesterházy-Ács Z. (2015). “Párták és pártaövek paks-cseresznyés lelőhelyről,” in Fiatal középkoros régészek VI. konferenciájának tanulmánykötete. Eds. Szőllősy C., Pokrovenszki K. (Székesfehérvár: Szent István Király Múzeum), 191–203.
Moorrees C. F. A., Fanning E. A., Hunt E. E. (1963). Formation and resorption of three deciduous teeth in children. Am. J. Phys. Anthropology 21 (2), 205–213. doi: 10.1002/ajpa.1330210212
Morel J.-P. (2006). De marseille à velia: problèmes phocéens. Comptes rendus Des. séances l’Académie Des. Inscriptions Belles-Lettres 150 (4), 1723–1783. doi: 10.3406/crai.2006.88124
Myronenko A., Song X. (2010). Point set registration: coherent point drifts. IEEE Trans. Pattern Anal. Mach. Intell. 32 (12), 2262–2275. doi: 10.1109/TPAMI.2010.46
Pal G. P., Routal R. V. (1998). Architecture of the cancellous bone of the human talus. Anatomical Rec. 252 (2), 185–193. doi: 10.1002/(SICI)1097-0185(199810)252:2
Raichlen D. A., Gordon A. D., Foster A. D., Webber J. T., Sukhdeo S. M., Scott R. S., et al. (2015). An ontogenetic framework linking locomotion and trabecular bone architecture with applications for reconstructing hominin life history. J. Hum. Evol. 81, 1–12. doi: 10.1016/j.jhevol.2015.01.003
Rohlf F. J., Slice D. (1990). Extensions of the procrustes method for the optimal superimposition of landmarks. Systematic Zoology 39 (1), 40–59. doi: 10.2307/2992207
Ruff C. B., Scott W. W., Liu A. Y.-C. (1991). Articular and diaphyseal remodeling of the proximal femur with changes in body mass in adults. Am. J. Phys. Anthropology 86 (3), 397–413. doi: 10.1002/ajpa.1330860306
Russo G. A., Kirk E. C. (2013). Foramen magnum position in bipedal mammals. J. Hum. Evol. 65 (5), 656–670. doi: 10.1016/j.jhevol.2013.07.007
Ryan T. M., Krovitz G. E. (2006). Trabecular bone ontogeny in the human proximal femur. J. Hum. Evol. 51 (6), 591–602. doi: 10.1016/j.jhevol.2006.06.004
Saers J. P. P., Ryan T. M., Stock J. T. (2019). Trabecular bone structure scales allometrically in the foot of four human groups. J. Hum. Evol. 135, 102654. doi: 10.1016/j.jhevol.2019.102654
Saers J. P. P., Ryan T. M., Stock J. T. (2020). Baby steps towards linking calcaneal trabecular bone ontogeny and the development of bipedal human gait. J. Anat. 236 (3), 474–492. doi: 10.1111/joa.13120
Scheuer L., Black S. (2004). The juvenile skeleton, developmental juvenile osteology. 1st ed. (San Diego: Elsevier).
Schlager S. (2017). “Morpho and rvcg - shape analysis in r: r-packages for geometric morphometrics, shape analysis and surface manipulations,” in Statistical shape and deformation analysis: methods, implementation and applications (San Diego: Elsevier), 217–256. doi: 10.1016/B978-0-12-810493-4.00011-0
Shaw C. N., Ryan T. M. (2012). Does skeletal anatomy reflect adaptation to locomotor patterns? cortical and trabecular architecture in human and nonhuman anthropoids. Am. J. Phys. Anthropology 147 (2), 187–200. doi: 10.1002/ajpa.21635
Slice D. E. (2006). Modern morphometrics in physical anthropology, choice reviews online (Germany: Springer Science & Business Media). doi: 10.5860/choice.43-4752
Smith B. H. (1991). Standards of human tooth formation and dental age assessment (New York: Wiley-Liss Inc.).
Sorrentino R., Belcastro M. G., Figus C., Stephens N. B., Turley K., Harcourt-Smith W., et al. (2020a). Exploring sexual dimorphism of the modern human talus through geometric morphometric methods. PloS One 15 (2), 1–17. doi: 10.1371/journal.pone.0229255
Sorrentino R., Carlson K. J., Bortolini E., Minghetti C., Feletti F., Fiorenza L., et al. (2020b). Morphometric analysis of the hominin talus: evolutionary and functional implications. J. Hum. Evol. 142, 102747. doi: 10.1016/j.jhevol.2020.102747
Staheli L. T., Chew D. E., Corbett M. (1987). The longitudinal arch. a survey of eight hundred and eighty-two feet in normal children and adults. J. Bone Joint Surg. - Ser. A 69 (3), 426–428. doi: 10.2106/00004623-198769030-00014
Stavlas P., Grivas T. B., Michas C., Vasiliadis E., Polyzois V. (2005). The evolution of foot morphology in children between 6 and 17 years of age: a cross-sectional study based on footprints in a mediterranean population. J. Foot Ankle Surg. 44 (6), 424–428. doi: 10.1053/j.jfas.2005.07.023
Stephens N. B., Kivell T. L., Gross T., Pahr D. H., Lazenby R. A., Hublin J. J., et al. (2016). Trabecular architecture in the thumb of pan and homo: implications for investigating hand use, loading, and hand preference in the fossil record. Am. J. Phys. Anthropology 161 (4), 603–619. doi: 10.1002/ajpa.23061
Stephens N. B., Kivell T. L., Pahr D. H., Hublin J. J., Skinner M. M. (2018). Trabecular bone patterning across the human hand. J. Hum. Evol. 123, 1–23. doi: 10.1016/j.jhevol.2018.05.004
Stoukal M. (1978). Die laenger der laengsknochen altslawischer bevoelkerung–unter besondere beruecksichtigung von waschstumsfragem.’. Homo 39 (1), 53–69.
Su A., Carlson K. J. (2017). Comparative analysis of trabecular bone structure and orientation in south African hominin tali. J. Hum. Evol. 106, 1–18. doi: 10.1016/j.jhevol.2016.12.006
Sullivan C., Kaszynski A. (2019). PyVista: 3D plotting and mesh analysis through a streamlined interface for the visualization toolkit (VTK). J. Open Source Software 4 (37), 1450. doi: 10.21105/joss.01450
Swan K. R., Ives R., Wilson L. A., Humphrey L. T. (2020). Ontogenetic changes in femoral cross-sectional geometry during childhood locomotor development. Am. J. Phys. Anthropology 173 (1), 80–95. doi: 10.1002/ajpa.24080
Turley K., Frost S. R. (2013). The shape and presentation of the catarrhine talus: a geometric morphometric analysis. Anatomical Rec. 296 (6), 877–890. doi: 10.1002/ar.22696
Turley K., Frost S. R. (2014a). The appositional articular morphology of the talo-crural joint: the influence of substrate use on joint shape. Anatomical Rec. 297 (4), 618–629. doi: 10.1002/ar.22879
Turley K., Frost S. R. (2014b). The ontogeny of talo-crural appositional articular morphology among catarrhine taxa: adult shape reflects substrate use. Am. J. Phys. Anthropology 154 (3), 447–458. doi: 10.1002/ajpa.22528
Turley K., White F. J., Frost S. R. (2015). Phenotypic plasticity: the impact of habitat and behavior (substrate use) on adult talo-crural appositional articular joint shape both between and within closely related hominoid species. Hum. Evol. 30 (1–2), 49–67. doi: 10.14673/HE2015121002
Ubelaker D. H. (2007). Review of: the bioarchaeology of children: perspectives from biological and forensic anthropology. J. Forensic Sci. doi: 10.1111/j.1556-4029.2007.00542.x
Virtanen P., Gommers R., Oliphant T. E., Haberland M., Reddy T., Cournapeau D., et al. (2020a). ‘Author correction: SciPy 1.0: fundamental algorithms for scientific computing in Python (Nature methods, (2020), 17(3), (261-272), 10.1038/s41592-019-0686-2)’. Nat. Methods 17 (3), 352. doi: 10.1038/s41592-020-0772-5
Virtanen P., Gommers R., Oliphant T. E., Haberland M., Reddy T., Cournapeau D., et al. (2020b). SciPy 1.0: fundamental algorithms for scientific computing in Python. Nat. Methods 17 (3), 261–272. doi: 10.1038/s41592-019-0686-2
Waseda A., Suda Y., Inokuchi S., Nishiwaki Y., Toyama Y. (2014). Standard growth of the foot arch in childhood and adolescence-derived from the measurement results of 10,155 children. Foot Ankle Surg. 20 (3), 208–214. doi: 10.1016/j.fas.2014.04.007
Keywords: bipedalism, late ontogeny, geometric morphometrics, trabecular analysis, talus
Citation: Figus C, Sorrentino R, Carlson KJ, Colombo A, Bortolini E, Bernardini F, Erjavec I, Hajdu T, Szeniczey T, Mateovics-László O, Pap I, Tuniz C, Novak M, Belcastro MG, Ryan TM and Benazzi S (2023) Becoming adults: exploring the late ontogeny of the human talus. Front. Ecol. Evol. 11:1205277. doi: 10.3389/fevo.2023.1205277
Received: 13 April 2023; Accepted: 06 June 2023;
Published: 04 July 2023.
Edited by:
Raymond Louis Bernor, Howard University, United StatesReviewed by:
Noel Boaz, Integrative Centers for Science and Medicine, United StatesCopyright © 2023 Figus, Sorrentino, Carlson, Colombo, Bortolini, Bernardini, Erjavec, Hajdu, Szeniczey, Mateovics-László, Pap, Tuniz, Novak, Belcastro, Ryan and Benazzi. This is an open-access article distributed under the terms of the Creative Commons Attribution License (CC BY). The use, distribution or reproduction in other forums is permitted, provided the original author(s) and the copyright owner(s) are credited and that the original publication in this journal is cited, in accordance with accepted academic practice. No use, distribution or reproduction is permitted which does not comply with these terms.
*Correspondence: Carla Figus, carla.figus3@unibo.it
Disclaimer: All claims expressed in this article are solely those of the authors and do not necessarily represent those of their affiliated organizations, or those of the publisher, the editors and the reviewers. Any product that may be evaluated in this article or claim that may be made by its manufacturer is not guaranteed or endorsed by the publisher.
Research integrity at Frontiers
Learn more about the work of our research integrity team to safeguard the quality of each article we publish.