Modeling species invasions using thermal and trophic niche dynamics under climate change
 Simone Libralato
 Alberto Caccin
 Fabio Pranovi
- 1ECHO Group, Division of Oceanography, Istituto Nazionale di Oceanografia e di Geofisica Sperimentale, Trieste, Italy
- 2Department of Environmental Sciences, Informatics and Statistics, Center for Estuarine and Costal Marine Sciences, University of Venice, Venice, Italy
Changing marine temperatures modify the distributional ranges of natural populations, but the success of invasion of new areas depends on local physical and ecological conditions. We explore the invasion by thermophilic species and their ecosystem effects by simulating a sea surface temperature (SST) increase using a trophodynamic model for the northern Adriatic Sea (NAS), in which thermal and trophic niches are explicitly represented for each thermophilic non-indigenous species (NIS) and native species. The NAS acts as a cul-de-sac for local species, preventing a further poleward migration as a response to temperature rise. In this situation, model results showed that effects of warming and invasion produced complex, non-linear changes on biomasses but never resulted in a complete overturn of a group of native species and/or a bloom of invasive ones. Despite this, the diversity index stabilizes at increased values after simulating invasion, possibly indicating that in such enclosed systems the establishment of invasive species could represent an enrichment in ecosystem structure. In addition, the absence of complete species substitution clearly showed the contribution of resident species toward increasing the resilience, i.e., the capability of the system to cope with invasion without changing substantially. Contrasting scenarios highlighted that changes in ecosystem primary production and species adaptation had secondary effects in ecosystem structure, while results for scenarios with different exploitation levels indicated that fishing can destabilize community structure in these change contexts, e.g., reducing community resilience. The results confirmed the importance of an ecological niche approach to analyze possible effects of invasion and highlighted the complexity of dynamics linked to temperature-driven species invasion', in terms of both the predicted strength of impacts and the direction of biomass change.
Introduction
Global ocean temperatures have risen by 0.11°C per decade over the period 1971–2010 (Jones et al., 2013). This tendency is predicted to continue in the future, in particular for the Mediterranean Sea where warming scenarios project a mean annual temperature rise 1.25 times higher than the global average long term predictions for 2081–2100 (Jones et al., 2013). Changing marine temperatures play a role in modifying the distributional ranges and density of natural populations. The poleward shift of thermal habitats makes previously inhospitable areas accessible to more thermophilic (warmer-water) species, and makes the same areas less suitable for the native ones (Walther et al., 2002, 2009; Parmesan, 2006; Bazairi et al., 2010). These two processes are expected to open the so-called “invasion window,” changing an ecosystem's susceptibility to invasion (Carlton, 1996; Drake et al., 2006; Caplat et al., 2009). Climatic changes thus ultimately influence biodiversity (Bianchi and Morri, 2000), increase the risk of extinction for less adaptable species (Bazairi et al., 2010) and affect fisheries (Cheung et al., 2010). An increasing trend of non-indigenous thermophilic species has already been recorded in the Mediterranean Sea (Ben Rais Lasram and Mouillot, 2009; Zenetos et al., 2012), possibly resulting in an irreversible marine ecosystem shift (Ruiz et al., 1997).
Thermal and trophic opportunities, disadvantages and competition within ecological niches all play a role in determining a species' potential for successful invasion. Successfully invading thermophilic species are expected to take advantage of increased average temperatures (Dulčić and Grbec, 2000; UNEP - MAP - RAC/SPA, 2008; Dulčić et al., 2010, 2011; Brotz and Pauly, 2012; Zenetos et al., 2012; Pecarevič et al, 2013) but they also need to either find or make trophic niche space, such as by outcompeting native species (e.g., Pranovi et al., 2003). Meanwhile, some local native species might be negatively affected by higher temperatures, but may be able to exploit new trophic opportunities as a trade-off. It is therefore not trivial to predict the potential invasion of non-indigenous species (NIS) and their impacts (Jones et al., 2013; Pinnegar et al., 2014).
In this work we explore which are the potential thermophilic invaders and their ecosystem effects by representing combined thermal and trophic niches for both native and non-indigenous species. Dynamic thermal and trophic niches have been described using a trophodynamics model wherein water temperature is simulated to rise according to global and local sea surface temperature (SST) scenarios (Somot et al., 2006; Jones et al., 2013).
We used the northern Adriatic Sea (NAS) basin as the ideal hotspot to investigate the effects of climate change. This semi-enclosed and shallow basin (Figure 1) is exposed to cold north-easterly winds and receives cold waters from many alpine rivers that contribute to create a sub-atlantic climate, and therefore hosts several species adapted to boreal conditions (Tortonese, 1964). Moreover, its position within the Mediterranean, makes the NAS a cul-de-sac for these species, preventing further poleward migration as a response to temperature rise (Ben Rais Lasram et al., 2010). Multiple gears target several marine demersal and pelagic species living in the shallow and highly productive grounds of NAS (Pranovi et al., 2001; Pranovi and Link, 2009) with documented historical changes and effects on the marine communities (Fortibuoni et al., 2010; Barausse et al., 2011).
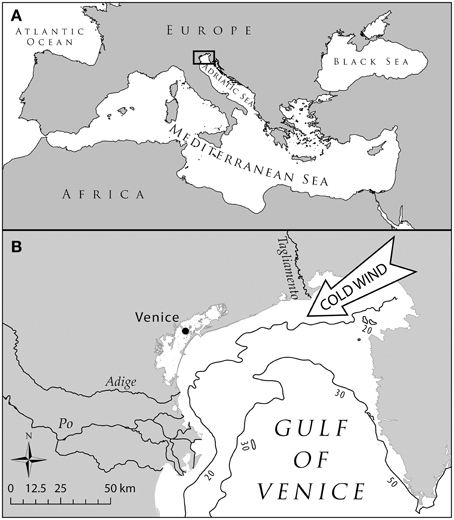
Figure 1. Map of the Northern Adriatic Sea. (A) Localization of the basin within the Mediterranean Sea; panel (B): detail of the area highlighting the main features determining a subatlantic climate, i.e., the north-easterly cold winds and the main rivers discharging in the Northern Adriatic Sea the cold waters from northern alpine areas.
Within this context, some questions arise in relation to the potential arrival of thermophilic non-indigenous species (NIS), such as:
– Are changes in community structure simply linear with temperature, implying easier predictability? How uncertain are our estimated biomass changes due to temperature changes?
– What is the combined effect of trophic and thermal opportunities in the dynamically changing environment both for native and non-indigenous species? Can we characterize species that benefit from climatic changes as those that show biomass increases (winners) and species harmed by climatic changes as those that show biomass decreases (losers) for both native and non-indigenous species?
– What role does the adaptation of native species to rising temperatures, changes in primary production, and changes in fisheries pressure play on the changes in community structure?
– Overall, how does invasion by NIS restructure the biological community?
We explore emerging ecosystem changes using a dynamic food web model for the NAS that:
(i) Includes, as initial conditions “seeds” for NIS at extremely low biomass;
(ii) has defined thermal niche preferences and trophic interactions for non-indigenous and native species, or groups of species;
(iii) is subjected to scenarios of water temperature increase.
With such a model structure we intend to simulate the potential opening of the invasion window due to climatic changes. The general goal is to explore the possible broad community consequences of the establishment of new species under climate change.
Materials and Methods
The Food-web Model
An existing model representing the NAS ecosystem in the 1990s (Zucchetta, 2002; Pranovi and Link, 2009) was updated with 2007–2008 data. The ecosystem was modeled with a mid-complexity structure using 30 living functional groups and 2 non-living groups (“Detritus” and “Carcass”), in order not to compromise the capability to represent the main trophodynamic processes, while maintaining an acceptable level of synthesis. Functional groups were defined by aggregating species with ecological similarities (Christian and Luczkovich, 1999) such as food preferences, predators, life history traits and habitat preferences (Table 1 and Supplementary Materials, Table S1). Some taxa were described by dedicated groups because of their importance as target species for local fisheries, namely Thunnus thynnus (Bluefin Tuna, BFT group), Platichthys flesus, Scophthalmus maximus, Scophthalmus rhombus, and Solea solea as a Flatfish group (FFS), Aequipecten opercularis and Pecten jacobeus as a Pectinidae group (PEC), and the venus clams Chamelea gallina and Venus verrucosa as a Veneridae group (VEN) (Table 1). Fishing activity was represented through five fleets: tuna fisheries (that include longline and purse seine), mid-water trawl, otter-trawl, hydraulic dredge, and rapido trawl (a typical fishing gear used in the Adriatic to harvest flatfish and scallops—see Pranovi et al., 2001). These fisheries are modeled by representing both commercial catches (landings) and by-catch of non-commercial species: this latter constitutes the discard, which makes up a particularly large fraction of catches for otter and rapido trawl (Pranovi et al., 2001). Therefore, the abiotic compartment “Carcass” has been added to account for the discard from fishing activities, and the consequent scavenging processes that are important in the NAS ecosystem dynamics (Zucchetta, 2002; Pranovi and Link, 2009).
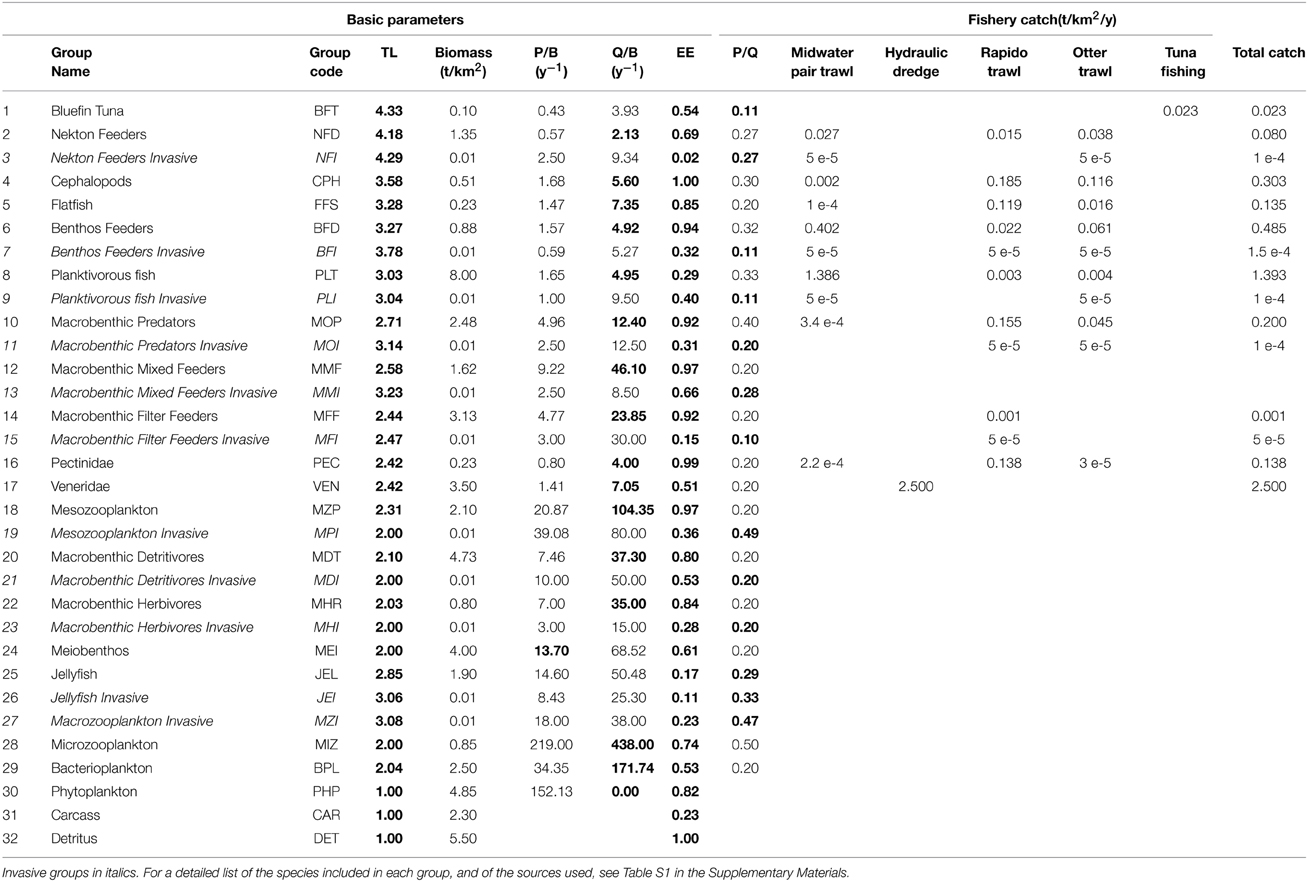
Table 1. Functional groups included in the model, with input and output (in bold) basic parameters of the Ecopath mass balance: trophic level (TL), production rate (P/B), consumption rate (Q/B), Ecotrophic efficiency (EE), growth efficiency (P/Q).
Dedicated functional groups, exclusively composed of thermophilic non-indigenous species, were introduced at all trophic levels as potential homologous of some native ones. The invasive groups represent species recorded recently in the basin such as the planktivorous fish Sardinella aurita and the barracuda Sphyraena viridensis, or NIS recorded in other parts of the Mediterranean and whose arrival in the NAS is likely to occur in the near future (e.g., the opistobranch Halgerda willeyi, Zenetos et al., 2012). Parameters for the new groups were calculated taking into account productivity and consumption rates of the species composing the group, as well as the specific diets, which were derived from the data available on SeaLifeBase (Palomares and Pauly, 2014). The initial biomass for the invasive groups was set to very low values, so to represent a “pre-invasion” status.
The modeled functional groups and their main parameters are summarized in Table 1, while Table S1 in the Supplementary Materials details the sources used to determine the parameters, and Table S2 shows the diet composition matrix. A synthetic view of the model structure and main energy flows are reported in the Figure 2.
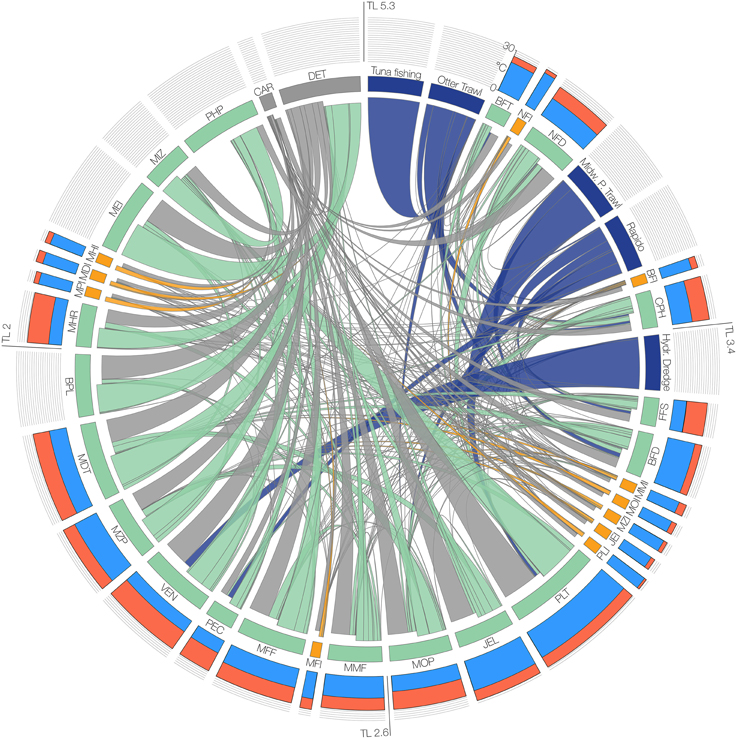
Figure 2. Scheme of the structure of the food-web model. Functional groups and fisheries are arranged clockwise in decreasing order of trophic level (TL). Barplots of the outer circle represent optimal temperature and maximum temperature (Topt and Tmax values in cyan and red bars, respectively) in the scale 0–30°C for the functional groups, which are represented in the inner circle as labeled boxes (group codes are reported in Table 1). The width of the boxes is proportional to the group biomass, and the color indicates the group type (Green = Native, Orange = Invasive, Blue = Fishery, Gray = Non-living). Links, representing trophic interactions, are proportional to the flow between two groups; inbound flows are those closest to each box.
The model, built in Ecopath with Ecosim 6.4 (Christensen et al., 2000; Christensen and Walters, 2004; Christensen, 2009), is based on a system of ordinary differential equations, describing the biomass variation of each functional group over time (t) as follows:
where Bi is the total biomass of the ith group composing the modeled food-web, (P/Q)i is its production/consumption ratio, Qji is the consumption of group i (predator) on group(s) j, Qij is the consumption by group j on group i (prey), Ii is the immigration rate, Mi is the natural mortality rate, Fi is the fishing mortality rate and ei is the density dependent emigration rate. Initial conditions and parametrization were set on the basis of the mass balance Ecopath model (Table 1). In the NAS model ei and Ii were set as zero, Mi was estimated from Ecopath production rate (P/B)i and ecotrophic efficiency (EEi) as Mi = (1-EEi)(P/B)i. Initial estimates of fishing mortality were calculated from the ratio between the catches [YEi = Yi(t = 0)] and biomass [BEi = Bi(t = 0)] in Ecopath, i.e., FEi = YEi/BEi. A time series multiplier ff(t) was entered in Ecosim to modulate changes of fishing mortality over time, Fi(t) = ff(t)* FEi. It has to be noted that in EwE, non-living compartments (Detritus and Carcass) are set to be flow-based so their dynamic is almost insensitive to their initial biomass.
Each element Q in Equation 1 is based on the foraging arena (Walters et al., 2000; Walters and Christensen, 2007; Christensen, 2009; Ahrens et al., 2012), which assumes that only a portion of the prey can be vulnerable to predator: this accessible biomass is regulated by a vulnerability rate (vij) and the quantity of prey consumed by a predator will be:
where aij is the search rate and the forcing function f(T,t) can be used to account for external drivers changing over time, such as temperature T (Ainsworth et al., 2011). Ecopath mass balance biomasses Bi and Bj, predator consumption rate (Q/B)j and diet proportion DCij, are used to estimate aij. More details on Ecopath and Ecosim parametrization can be found elsewhere (Christensen and Walters, 2004b).
For consumer groups, to relate the growth rate of a population to temperature, we set the forcing function as the one initially proposed by (Lassiter and Kearns, 1974):
where T is the SST, Topt is the optimum temperature for a given species, at which, with other factors constant, the consumption and growth is maximum; Tmax is the maximum tolerated temperature, above which the consumption and growth is null, and c is a parameter accounting for the sensitivity of a species' consumption (i.e., its productivity) to temperature variations.
For primary producers, two types of forcing functions were considered to modify productivity, a linear variation with temperature, and an exponential one (Eppley, 1972):
Estimating Temperature Dependence Parameters
Although, some empirical data regarding thermal preferences and effects of temperature on physiological processes are available in literature or datasets (e.g., Coutant, 1977; Block et al., 2001; Roessig and Woodley, 2004) few of them regard Mediterranean marine species and potential invaders. Therefore, in order to be consistent across the many species that we included in the model, temperature dependence parameters were estimated using a geographical distribution approach similar to what has been adopted in other cases (Dulvy et al., 2008; Cheung et al., 2013; Parravicini et al., 2015).
The parameters Topt, Tmax, and c were estimated for each species on the basis of their latitudinal distribution in the northern hemisphere and by reconstructing a mean latitudinal SST profile to relate latitude to temperature. Species latitudinal distribution was derived from Global Biodiversity Information Facility database (www.gbif.org) considering occurrences up to year 2000 to exclude possible recent range modifications due to climate change. A yearly mean latitudinal SST profile for the northern Atlantic Ocean was reconstructed using SST data from 1945 to 2000 of the online NOAA database (nodc.noaa.gov). The Topt for each species was defined as the mean annual SST at the latitude corresponding to the median of the species' latitudinal range. Similarly, Tmax was defined as the mean annual SST at the latitude corresponding to the 5th percentile of the species latitudinal distribution. The parameter c, that indicates the rate of change of a group's consumption and productivity with changes in SST, was applied considering a species preferred habitat and its possible relation to the surface. Thus, high values of c were assigned to pelagic species, intermediate values to demersal ones, and lowest values of c were assigned to benthic species in order to represent decreasing response of species to SST changes. This parametrization permits to represent the fact that a species that can move and adjust its location quickly will maintain the highest productivity relative to its specified base rate.
Once estimated for all species, the temperature parameters for each functional group were calculated using biomass weighted averages of the values of the species composing the group. Our resulting temperature parameters were compared also with values of Topt and Tmax from (Cheung et al., 2013) for validation (see Table S2, Supplementary Material).
Sensitivity Tests and Scenario Analysis
The model was tested for sensitivity to SST trend changes, and to the parameters of temperature forcing function in Equation 3.
The initial temperature was set to the mean SST registered in the basin in 2007 (Tstart = 18.4°C); the final temperature change was comprised between +0.8 and +1.2°C in 10 years, and then kept constant for 20 years to reach steady state (Tend = 19.2 ~ 19.6°C). A set of 20 simulations over 30 years was run each with a different Tend at regular intervals of 0.02°C. For each simulation, the final biomass (Bend), the relative biomass variation (Bend/Bstart) and the value of the forcing function (f(T)) were calculated for each group; further, the relative sensitivity, S (Campolongo et al., 2000), was calculated as follows:
where ΔB = Bend – Bstart and ΔT = Tend – Tstart. This relative sensitivity is a measure of expected changes around the starting conditions (local sensitivity) and it indicates the expected relative change in biomass (% change) due to a unit relative change in temperature (i.e., 1%) (Zádor et al., 2006).
Moreover, in order to test the sensitivity of the model to the uncertainty on temperature parameters, 100 simulations were performed assuming a linear temperature rise of +1°C in 10 years and using different combinations of Topt, Tmax, and c for every functional group. Parameter values were randomly extracted from normal distributions centered on the actual estimated parameter and having SD = 0.7. The distribution of results in terms of relative biomass variation (Bend/Bstart) was used to evaluate the uncertainty of predicted changes.
In order to test ecological changes induced by adaptation, changes in primary productivity (PP) and fisheries and their combined effects a set of 24 scenarios (Table 2) grouped into six groups were implemented. The reference scenario with current PP and fisheries pressure was run for 50 years under the IPCC A2 that implies a 0.03°C SST rise per year (applied for the first 30 years) on the basis of temperature projections by Somot et al. (2006).
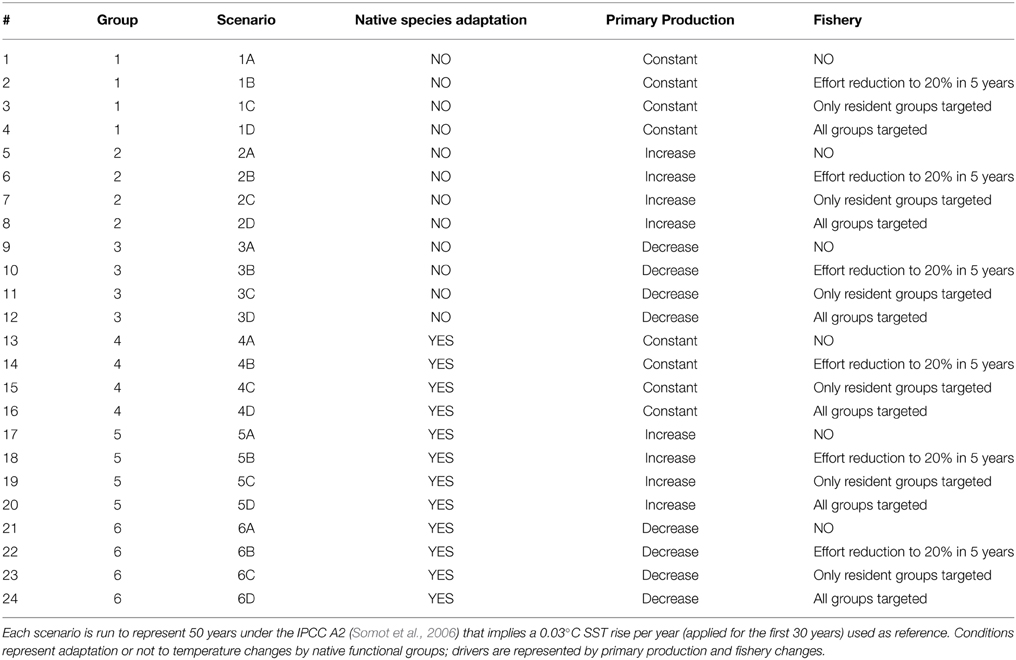
Table 2. Conditions and drivers used in the scenario analysis on top of the reference climatic change.
Then the capability of autochthonous groups to adapt to temperature changes was represented by applying the temperature-based forcing functions to the search rates of every group in the system (non-adaptation; scenarios 1–3) or to all groups but with a delay for native groups (adaptation, scenarios 4–6) on the assumption that the search rate of the native is affected by T rise only after a few years after T starts changing (Table 2). Specifically, a delay of 5 years was assumed for groups with Topt <= 10°C (FFS, PEC, VEN, MHR), and a delay of 10 years was applied to all the others.
PP was represented by (i) no change (scenarios 1 and 4), (ii) an exponential increase in production with temperature (scenarios 2 and 5), and (ii) a linear decrease of 20% in 30 years representing the oligotrophication trend actually detected in the basin (Giani et al., 2012; scenarios 3 and 6) (Table 2).
Moreover, the reference simulation (current fishing effort exerted on native species only; scenarios C) was compared with simulations representing as effort reduction to zero (no fishing; scenarios A), an effort reduction by 20% (fishery on all groups; scenarios B), and the new invasive species as an opportunity for fishermen (F for invasive species equal to the native counterpart; scenarios D) (Table 2).
Ecosystem Structure, Functioning, and Ecological Niches
Ecosystem effects of invasion in combination to other factors represented under different scenarios were evaluated by looking at changes in biomass of functional groups and by analysing the Kempton's Q75, an index that synthesizes the community structure in the form of biodiversity index (Ainsworth and Pitcher, 2006). The Q75 index is calculated as:
where S is the total number of functional groups and R75 and R25 are the biomasses at the 75th and 25th percentile, respectively. Moreover, for distinguishing the prevalence of trophic effects or of temperature-related effects on the various groups, the Mixed Trophic Impact (MTI) index was used (Ulanowicz and Puccia, 1990). MTI results from the application of the input-output analysis on the food web flows and quantifies the direct and indirect trophic effects that one group has on each other of the food web (See Supplementary Materials, Figure S1). The sum of MTI by row represents the overall effect (MTIj) of a group on the food web and it is a prediction of biomass changes as a consequence of the biomass variation of all the other groups in the system (Libralato et al., 2006). Therefore, by plotting biomass changes obtained from simulations of increasing SST against MTIj (that do not include temperature effects) enables to distinguish results that are fairly in line with MTIj predictions and that are therefore mainly driven by trophic (direct and indirect) opportunities and disadvantages, from results that contrast with MTIj, for which direct and indirect effect of temperature rise can be considered to be dominant.
Results in terms of biomass change with SST change scenarios allows us to distinguish between groups with positive (winners) and negative (losers) biomass change: these were compared with predator and prey niche overlap (Christensen et al., 2000) to identify possible trophic niche shifts and partial niche substitutions.
Results
The analysis of sensitivity to the variability of T highlights the existence of nonlinear effects within the modeled food web (some example functional groups are represented in Figure 3). In particular, analyzing the relationship between the value of f(T) (Equation 3) calculated for Tend and the biomass (Figure 3A) or the relative sensitivity index S (Equation 5, Figure 3B), nonlinear changing rates emerged for every functional group.
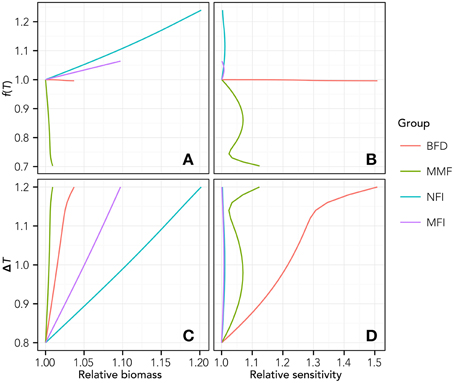
Figure 3. Relationship between T increase and relative biomass change (A), Temperature forcing function (see Equation 3) and relative biomass change (B), T increase and relative sensitivity as from equation 5 (C) and temperature forcing and relative sensitivity (D). For the sake of clarity, results are reported only for some representative groups, i.e., the BFD, Benthic Feeders group; MMF, Macrobenthic Mixed Feeders; NFI, Nekton Feeders Invasive; MFI, Macrobenthic Filter Feeders Invasive.
The results of uncertainty tests on the parameters of temperature equation by species (Equation 3) showed considerable changes and variability in the functional group biomass estimated by the model after 30 years of simulation (Figure 4). Although, as expected, all invasive species benefited of environmental changes, the resulting positive biomass change was different for each functional group. Moreover, uncertainty analysis showed that new ecosystem conditions might have non-zero probabilities to result in negative effects for some invasive thermophilic groups such as MOI, MMI, JEI, and MZI (Figure 4). Some native groups showed large probability of increasing biomasses (BFT, PLT, MEI, JEL, MIZ, BPL), whereas others (NFD, CPH, FFS, MOP, PEC, VEN, MZP, MHR) had higher probabilities of decreasing their biomass in the new environmental conditions. Some groups, such as BFD, MMF, MFF, and MDT, had very large probabilities of maintaining current densities even with new climatic conditions. Variability rarely exceeded ±30% of the median value (Figure 4). In general, medium-high TL groups showed larger dispersion of results than low TL groups. Moreover, although MOI and MMI had the largest variability in final biomass, several native groups (BFT, BFD, PEC, VEN, MHR) were more sensitive to simulated changes than any other invasive groups.
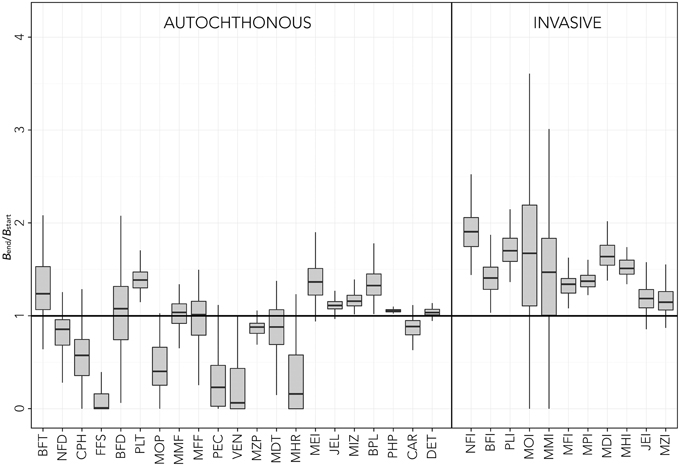
Figure 4. Sensitivity tests on the temperature forcing function parameters [f(T,t), Equation 3]. Results are reported in terms of biomass at the end of the simulations (Bend) relative to initial biomass (Bstart). Box plots represent the median (black line) and interquartile range (gray box) for relative biomass of each functional group. Native groups are reported on the left, invasive groups on the right. The solid line (Bend/Bstart = 1) represents no change. See Table 1 for explanation of functional groups codes.
Comparing biomass changes for both native and invasive functional groups for simulations based on the SST increase scenarios with simulations where the SST increase is combined with modifications of the primary production and fishery (Figure 5) permits us to disentangle climate from the other sources of perturbation. Results seem to confirm the heterogeneity in terms of responses of different groups to the SST increase, with positive, negative and neutral “behavior” (Figure 5, top left panel). Given a fishery scenario, the increase or decrease in PP produced a unidirectional shift of all groups toward higher or lower biomass (Figure 5, panels in central and right columns respectively) compared to constant PP (panels in the left column). For the current fishing conditions (lowest row of panels, D), this translates in a shift above and below the reference 1:1 line. Fishing seems to produce a strong effect on the ecosystem: current fishing conditions including (row D) or excluding (row C) fishing on invasive species have prevailing and dominating effect on biomass changes, regardless of PP changes. Reducing (row B) or eliminating fishing (rows A) implies considerable restructure of the food web due to the biomass increases of both invasive and native functional groups.
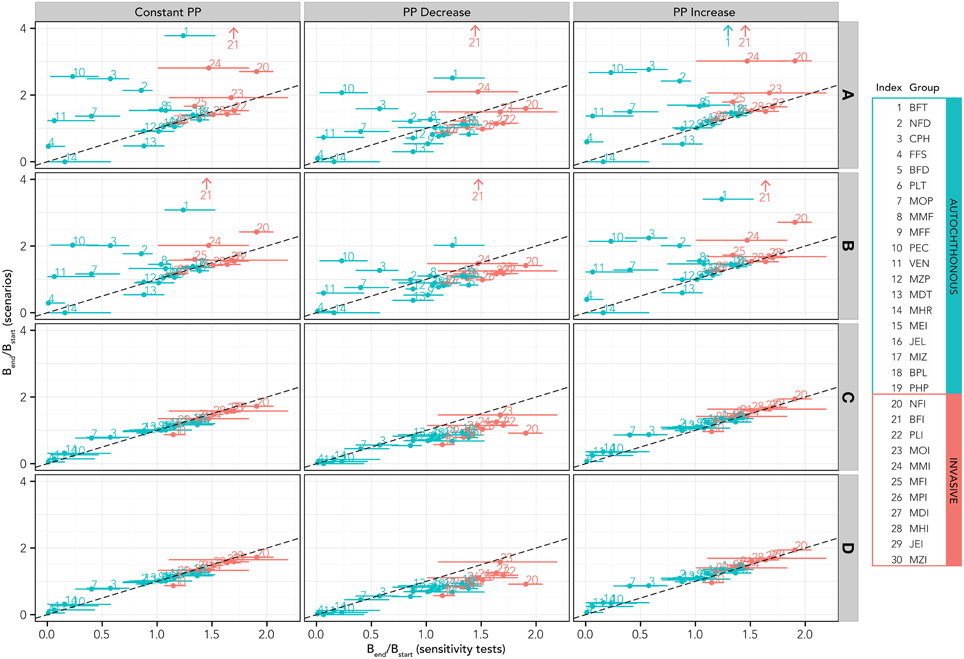
Figure 5. Results of the simulations based on simultaneous SST increase, changes in primary production and fishing activities. Results for all scenarios are reported in terms of relative biomass variation with respect to initial conditions for each functional group. In all these scenarios, the native species are allowed to adapt to the SST increase, at least in the first phase of the simulation (analogous scenarios with no adaptation are reported in the Supplementary Material). According to the scenario definitions in Table 2, A = no fishery, B = fishery on all groups, but reduced to 20% of the present effort level, C = fishery only on native species, D = fishery on all species at the present effort level. Functional group codes are defined in Table 1.
Changes in the ecosystem structure, due to thermophilic species invasion, were well captured by the Kempton's Q75 index, showing a common pattern that supports the ecosystem development theory (Odum, 1969): the initial steady rise due both to the increase of invasive biomass and initial reduction of the most abundant native species, is followed by a maximum plateau (generally, attained before the forcing function stops acting, vertical dotted line) and then a drop, after which the index tends to stabilize at a value higher than the initial one (Figure 6). It is worthy to note that the adaptation of native species (scenarios 4–6) produced a more gradual variation, with a reduction and shift of the peak. Changes in PP slightly affected the peak (both in term of position and value; scenarios 2, 3, 5, and 6). Finally, modifications in the fishing pressure regime exacerbated the effects in terms of changes in the community structure, amplifying the peak and shifting it in the time and leading to ultimate reductions in biodiversity (Figures 6C,D).
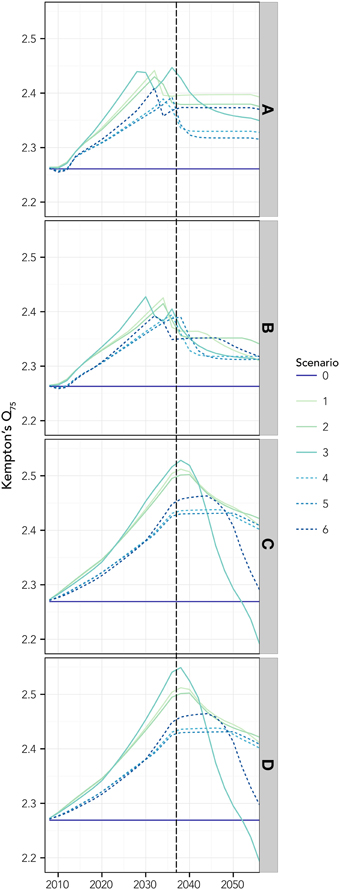
Figure 6. The Kempton's Q75 index, estimated for different tested scenarios. Reference scenario with current primary productivity PP and fisheries pressure was run for 50 years under the IPCC A2 that implies a 0.03°C SST rise per year (applied for the first 30 years) on the basis of temperature projections by Somot et al. (2006). Scenarios 1–3 are simulated with no adaptation of native species to changes in SST, while in scenarios 4–6 adaptation to SST is simulated. Scenarios 1 and 4, represent no changes in PP, while scenario 2 and 5 increase, and 3 and 6 decrease of PP. (A–D) refers to scenarios with increasing fishing pressure: (A) no fishing; (B) actual effort reduced by 20% in 5 years; (C) only resident species are targeted at actual effort; (D) all species are targeted at actual fishing effort. All scenarios are summarized in Table 2. The vertical dashed line represents the point beyond which the forcing stops acting.
By comparing the MTI with the biomass changes resulting from the sensitivity tests, it was possible to highlight the model capabilities to distinguish the prevalence of climate-related or trophic-web related effects. Plotting the relative biomass variation index against the MTI index (Figure 7), different groups can be detected:
• (A) those for which trophic effects were indicated to be negligible (MTI < 2), but the high biomass variation [positive or negative, (Bend/Bstart) > 1.5 or <0.5], highlighted that their changes were driven mainly by temperature (e.g., FFS, MHR, MHI, PLI, MDI);
• (B) those with little/intermediate biomass variation 0.5 < (Bend/Bstart) < 1.5, but with large expected trophic effects, e.g., MTI >> 2 (BFT, MMI, CPH), for which it seems that temperature and trophic effects act in an antagonistic way;
• (C) groups with high biomass change [(Bend/Bstart) > 1.5 or < 0.5] and high trophic effects (MTI >> 2) were indicated (NFI, MOI, PEC), for which a synergistic effect of trophic and temperature impacts can be hypothesized;
• (D) those groups with low intermediate changes in biomass and low expected trophic effects that showed mixed somewhat small effects (most functional groups).
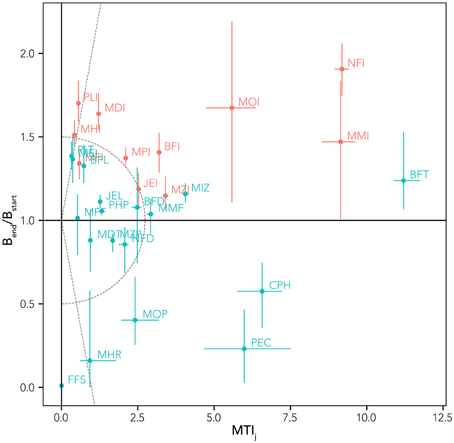
Figure 7. Relationship between relative biomass variation (Bend/Bstart) from reference simulation (whiskers indicate range of variability from sensitivity tests) and overall impact index (MTIj) for all the trophic groups. Native groups are in blue and invasive groups are in red. The solid line (Bend/Bstart = 1) defines winners (above the line) and losers (below the line) in a context of climate change. Dotted lines separate areas of the graph with different dominance of trophic and thermic effects.
This analysis (Figure 7) allows discriminating between trophic and thermal drivers and resulting identification of winners (biomass change >1) and losers (<1). Combining this analysis with the niche overlapping index permits us to describe possible trophic substitutions and adjustments in the biological community (Figure 8). High values of index of predation overlap between losers and winners (dark blue cells in Figure 8) suggest, for example, that NFI and PLI (invasive winners) can substitute as predator NFD, FFS, and CPH (native losers); the invasive MOI potentially substitutes (at least in part) the native groups MOP and MDT as predator. As prey, the invasive NFI substitutes the native NFD, invasive PLI takes advantage of decreasing VEN and PEC, and MOI substitutes FFS (Figure 8).
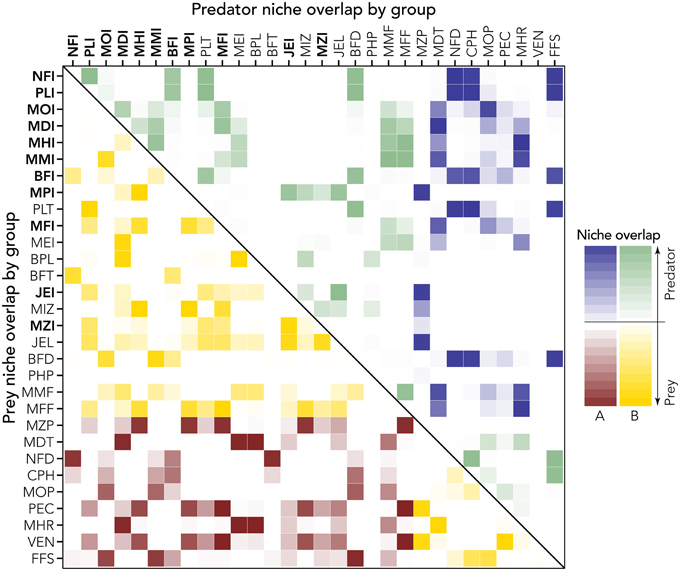
Figure 8. Prey and predator niche overlap (lower and upper diagonal part of the matrix, respectively). Intensity of the color represents strength of the niche overlap (light = low niche overlap; dark = high niche overlap). Groups (codes are explained in Table 1; invasive groups are bold) are ordered in terms of relative biomass change (y-axis of Figure 7), thus to distinguish losers (A) from winners (B, see also colors). The high value of niche overlap for winners and losers permits the identification of niche substitution. For example, NFI is a winner and as prey, substitutes mainly the niche of the loser NFD (lower diagonal matrix). As predator, instead (upper diagonal matrix) the winner NFI occupies the niche of a few losers such as FFS, CPH, and NFD.
Discussion
Changes in species distributions is a climate change effect of primary interest and can integrate changes in phenology, condition, and biological communities (e.g., Parmesan, 2006; Lejeusne et al., 2010). However, previous analysis already showed that thermal niche alone cannot completely explain invasive species distributions (e.g., Parravicini et al., 2015). Combining thermal and trophic niche, for both native and non-indigenous species, in the food web model resulted a successful approach to represent the invasion and explore ecological effects of NIS. Niche availability, indeed, has been demonstrated as one of the most important aspects in determining the invasion success of NIS (Ward and Master, 2007). The so-called “invasion window” (Carlton, 1996; Drake et al., 2006; Caplat et al., 2009), depends on the niche availability, i.e., the set of ecological conditions that can transform an invasive species into “the right species at the right moment” (Pranovi et al., 2006).
Climatic changes, and in particular ocean warming, are expected to act as a factor contributing to the opening of the invasion window beyond the direct favoring of thermophilic species. In fact, thermal regime modifications that negatively affect native species might destabilize community structure, increasing niche availability and so further favoring the success of invasive species establishment (Wolkovich and Cleland, 2014). In this context, an explicit and “open” modeling scheme was developed instead of the ordinary approach of comparing characteristics of marine food web models with and without the addition of one or more invasive species (Arias-González et al., 2011; Pinnegar et al., 2014). Here, the SST was used as a forcing function driving the ecological dynamics of the different groups in the model, which includes a “seed bank” of non-indigenous species, thus permitting us to represent the invasion window opening and the establishment of invaders to emerge as a combined result of both direct and indirect trophic and thermic opportunities. Results of simulations representing an increase in the range of 0.8–1.2°C over 30 years and accounting for the uncertainty in the biological thermal preferences, robustly highlighted complex non-linear and non-homogeneous changes across groups of species. The establishment of invaders according to better thermal and trophic fitness, in fact, was accompanied by highly variable effects (biomass changes) on native species. Overall the biomasses of some species with boreal affinity, i.e., more sensitive to increasing temperature, such as the flatfishes (FFS), were importantly reduced, and the trophic overlap index permitted us to see that such trophic niche depletion provides opportunities for invasive groups even if taxonomically and ecologically very distant, such as the Planktivorous fish Invasive group (PLI, Figure 8). This exemplifies the complex processes involved in the reorganization of the entire food web due to community structure modifications that can be manifested by combining trophic with thermal niche changes. This increases the number of dimensions explicitly accounted for, thus approximating the real world multidimensional hypervolume of niche space (Pianka, 1981; Rosenfeld, 2002; Okey, 2003).
The combination of increase/decrease of species in relation to their thermal affinity is expected to produce a more or less gradual (depending on the rate of warming) substitution of temperate and boreal species with warmer-water species, as constrained also by variables such as pH, dissolved oxygen, and other habitat variables. Poleward shifts in distributional areas were predicted (Albouy et al., 2012) and already recorded (Parmesan, 2006; Cheung et al., 2013), all around the world. According to the shifting scheme just reported, every species can simultaneously act as native loser and non-indigenous winner, depending on the perspective (original or new ecosystem, respectively), and the phenomenon of native species substitution with thermophilic non-indigenous invaders (eulerian view) can be seen as a simple species shifts (lagrangian view point). However, at the “end of the line,” i.e., where no further Northward shift (in the boreal hemisphere) is possible due to the cul-de-sac effect, or other expressions of poleward boundedness, the destabilization and resistance of the native community that cannot shift may be more evident, leading to a more complex opening of invasion windows.
This is the case of semi-enclosed basins, such as the Mediterranean Sea and its northern sub-basins, or the high latitude systems, as for example the Barents Sea, which act as a cul-de-sac for the native species (Ben Rais Lasram et al., 2010), and prevent further migration. The direct and indirect effects of warming and invasion estimated using the food web model for the Northern Adriatic Sea, never resulted in a complete overturn of a group of native species or in a bloom of an invasive species, at least within the projected perturbations. Possibly the cul-de-sac regions represent areas where climate-induced changes are more complex than a simple poleward shift. These areas, therefore, provide good case studies to explore the ecological dynamics related to the simultaneous change of the environmental conditions (due to water warming) and of community structure (due to species invasion and native species contraction).
Invasion by thermophilic NIS implies important changes in the marine ecosystem structure that are confirmed by our results in terms of changes in biomass of ecosystem components after the establishment of non-indigenous species. However, the results obtained in the present study showed that the direction of change is not always as expected, as indicated by the increase of the diversity index (after a transient period with large increase of diversity).
The consistent increase of diversity, both under changes in productivity of the system and adaptation of the residents, was not only due to the increase in biomass of invasive groups but primarily by the reduction of biomass of residents, which increased the evenness among groups. Despite a complex set of biomass changes, the fact that the diversity index stabilizes at increased values after invasion indicates that in such enclosed systems, the establishment of invasive species represents an enrichment in ecosystem structure. This is not necessarily a positive change since the increase of biodiversity might be accompanied by loss of non-trophic function or habitat (Galil, 2007) that are not included in the analysis here. Overall the absence of complete species substitution suggests a possible contribution of resident species in increasing the resilience of the system to invasion. As highlighted by Carey and Wahl (2010), indeed, the biodiversity of native species can mitigate the impact of NIS, for instance by saturating niche availability.
Within this context, results obtained at different fishing pressure illustrate how much fisheries can destabilize ecosystem structure and processes in terms of dynamics of the diversity index. In particular current fishing pressure (only on native species; or on both native and invasive species) represents a constraint stronger than invasion for density changes and it has a sort of “homogenization effect” on almost all the groups, strongly diminishing effects of both SST and primary production changes. In contrast, high fishing pressure on native or both on native and invasive influenced the synthetic diversity index by simply delaying the effects of invasion (Figure 6). Reducing fishing pressure in the context of invasion, instead, resulted in a complete restructure of the food web, with significant biomass changes (Figure 5) and with limited effects on the diversity index (Figure 6).
Overall these results indicate that invasion affects both the structure, with possible effects on the functioning of the ecosystem. Adaptation of native species has minor effects on density but results in delaying dynamics of the diversity index, while fisheries substantially impact species biomass changes and thus ecosystem structure.
The combination of thermal and trophic niches in the food web model of species invasion suggests that, due to direct and indirect effects, it is fairly difficult to predict winners and losers a priori. Although for some species the effect of temperature is dominant (such as FFS), while others have a dominant trophic effect (such as BFT), the majority of modeled groups indicate that they are affected by a combinations of the two factors, with varying interactions of the two effects. This is confirmed by the fact that in only a few cases the winners occupy similar niche of a loser.
In conclusion, the results indicated the utility of an enhanced and explicit ecological niche approach for advancing in the analysis of possible effects of species invasion. Moreover, results highlighted the complexity of dynamics linked to an invasion by thermophilic non-indigenous species, not only in terms of predicted impacts and their strengths, but also in terms of the directions of resulting changes in biomass.
Within the context of habitat modifications induced by climate change (e.g., SST increase), the thermophilic NIS invasion is generally viewed as a gradual substitution between native and invading species, both shifting northward (Cheung et al., 2010). In semi-enclosed basins, however, the two groups are forced to compete, with the native species able to partially counteract (resist) the invasion, or at least persist after invasion, as indicated also by the predicted delay of native species adaptation to the SST increase.
These findings highlight the importance of native species for ecosystem resilience, facilitating the system's ability to cope with the modifications induced by climate changes. In this respect, fishing operations play an important role in shaping community structure as it was also emerging from previous analyses of historical data (Fortibuoni et al., 2010; Barausse et al., 2011). In light of the fact that anthropogenic pressure (here exemplified by fisheries) is the main stressor responsible for the loss of ecosystem resilience (Fortibuoni et al., 2015) to climate-related changes, the process of defining management strategy that policy makers and managers would normally consider are those that reduce fishing pressures that disproportionately degrade the system, or reduce the resilience. However, the present approach could be useful for evaluating management strategies that include deliberate and profitable counteraction of climate effects, such as targeting newly arriving species in a way that maximize or preserve the historical values or other values in the overall social-ecological system.
Conflict of Interest Statement
The authors declare that the research was conducted in the absence of any commercial or financial relationships that could be construed as a potential conflict of interest.
Acknowledgments
The authors wish to thank Elisabetta Betulla Morello (Marie Curie fellow, CNR – ISMAR, Ancona, Italy), Tomaso Fortibuoni (ISPRA, Chioggia, Italy) and Thomas A. Okey (School of Environmental Studies, University of Victoria, Canada) for providing valuable comments and suggestions on an early draft of this paper. SL has been partially funded by the Flagship Project RITMARE - The Italian Research for the Sea - coordinated by the Italian National Research Council and funded by the Italian Ministry of Education, University and Research within the National Research Program 2011-2013.
Supplementary Material
The Supplementary Material for this article can be found online at: https://www.frontiersin.org/article/10.3389/fmars.2015.00029/abstract
References
Ahrens, R. N. M., Walters, C. J., and Christensen, V. (2012). Foraging arena theory. Fish Fish. 13, 41–59. doi: 10.1111/j.1467-2979.2011.00432.x
Ainsworth, C. H., and Pitcher, T. J. (2006). Modifying Kempton's species diversity index for use with ecosystem simulation models. Ecol. Indic. 6, 623–630. doi: 10.1016/j.ecolind.2005.08.024
Ainsworth, C. H., Samhouri, J. F., Busch, D. S., Cheung, W. W. L., Dunne, J. P., and Okey, T. A. (2011). Potential impacts of climate change on Northeast Pacific marine foodwebs and fisheries. ICES J. Mar. Sci. 68, 1217–1229. doi: 10.1093/icesjms/fsr043
Albouy, C., Guilhaumon, F., Araújo, M. B., Mouillot, D., and Leprieur, F. (2012). Combining projected changes in species richness and composition reveals climate change impacts on coastal Mediterranean fish assemblages. Glob. Change Biol. 18, 2995–3003. doi: 10.1111/j.1365-2486.2012.02772.x
Arias-González, J. E., González-Gándara, C., Luis Cabrera, J., and Christensen, V. (2011). Predicted impact of the invasive lionfish Pterois volitans on the food web of a Caribbean coral reef. Environ. Res. 111, 917–25. doi: 10.1016/j.envres.2011.07.008
Barausse, A., Michieli, A., Riginella, E., Palmeri, L., and Mazzoldi, C. (2011). Long-term changes in community composition and life-history traits in a highly exploited basin (northern Adriatic Sea): the role of environment and anthropogenic pressures. J. Fish Biol. 79, 1453–1486. doi: 10.1111/j.1095-8649.2011.03139.x
Bazairi, H., Ben Haj, S., Boero, F., Cebrian, D., De Juan, S., Limam, A., et al. (2010). The Mediterranean Sea Biodiversity: State of the Ecosystems, Pressures, Impacts and Future Priorities. Tunis: UNEP-MAP RAC/SPA.
Ben Rais Lasram, F., Guilhaumon, F., Albouy, C., Somot, S., Thuiller, W., and Mouillot, D. (2010). The Mediterranean Sea as a “cul-de-sac” for endemic fishes facing climate change. Glob. Change Biol. 16, 3233–3245. doi: 10.1111/j.1365-2486.2010.02224.x
Ben Rais Lasram, F., and Mouillot, D. (2009). Increasing southern invasion enhances congruence between endemic and exotic Mediterranean fish fauna. Biol. Invasions 11, 697–711. doi: 10.1007/s10530-008-9284-4
Bianchi, C. N., and Morri, C. (2000). Marine biodiversity of the mediterranean sea: situation, problems and prospects for future research. Mar. Pollut. Bull. 40, 367–376. doi: 10.1016/S0025-326X(00)00027-8
Block, B. A., Dewar, H., Blackwell, S. B., Williams, T. D., Prince, E. D., Farwell, C. J., et al. (2001). Migratory Movements, Depth Preferences, and Thermal Biology of Atlantic Bluefin Tuna. Science 293, 1310–1314. doi: 10.1126/science.1061197
Brotz, L., and Pauly, D. (2012). Jellyfish populations in the Mediterranean Sea. Acta Adriat. 53, 213–232.
Campolongo, F., Tarantola, S., and Saltelli, A. (2000). Sensitivity anaysis as an ingredient of modeling. Stat. Sci. 15, 377–395. doi: 10.1214/ss/1009213004
Caplat, P., Anand, M., and Bauch, C. (2009). Modelling invasibility in endogenously oscillating tree populations: timing of invasion matters. Biol. Invasions 12, 219–231. doi: 10.1007/s10530-009-9444-1
Carey, M. P., and Wahl, D. H. (2010). Native fish diversity alters the effects of an invasive species on food webs. Ecology 91, 2965–2974. doi: 10.1890/09-1213.1
Carlton, J. T. (1996). Pattern, process and prediction in marine invasion ecology. Biol. Conserv. 78, 97–106. doi: 10.1016/0006-3207(96)00020-1
Cheung, W. W. L., Lam, V. W. Y., Sarmiento, J. L., Kearney, K., Watson, R. E. G., Zeller, D., et al. (2010). Large-scale redistribution of maximum fisheries catch potential in the global ocean under climate change. Glob. Change Biol. 16, 24–35. doi: 10.1111/j.1365-2486.2009.01995.x
Cheung, W. W. L., Watson, R., and Pauly, D. (2013). Signature of ocean warming in global fisheries catch. Nature 497, 365–368. doi: 10.1038/nature12156
Christensen, V. (2009). “Ecopath with Ecosim: linking fisheries and ecology,” in Handbook of Ecological Modelling and Informatics, eds S. E. Jorgensen, T. S. Chon, and F. Recknagel (Southampton, UK: WIT Press), 55–70.
Christensen, V., and Walters, C. J. (2004). Ecopath with Ecosim: methods, capabilities and limitations. Ecol. Model. 172, 109–139. doi: 10.1016/j.ecolmodel.2003.09.003
Christensen, V., Walters, C. J., and Pauly, D. (2000). Ecopath with Ecosim: a User's Guide, October 2000 Edition. Fisheries Centre, University of British Columbia, Vancouver, Canada and ICLARM, Penang, Malaysia.
Christian, R. R., and Luczkovich, J. J. (1999). Organizing and understanding a winter's seagrass foodweb network through effective trophic levels. Ecol. Model. 117, 99–124. doi: 10.1016/S0304-3800(99)00022-8
Coutant, C. C. (1977). Compilation of temperature preference data. J. Fish. Res. Board Can. 34, 739–745. doi: 10.1139/f77-115
Drake, J. M., Drury, K. L. S., Lodge, D. M., Blukacz, A., Yan, N. D., and Dwyer, G. (2006). Demographic stochasticity, environmental variability, and windows of invasion risk for Bythotrephes longimanus in North America. Biol. Invasions 8, 843–861. doi: 10.1007/s10530-005-4205-2
Dulčić, J., Dragičević, B., Grgičević, R., and Lipej, L. (2011). First substantiated record of Lessepsian migrant - the dusky spinefoot Siganus luridus (Actinopterygii: Perciformes: Siganidae) - in the Adriatic Sea. Acta Ichthyol. Piscat. 41, 141–143. doi: 10.3750/AIP2011.41.2.12
Dulčić, J., and Grbec, B. (2000). Climate changes and Adriatic ichthyofauna. Fish. Oceanogr. 9, 187–191. doi: 10.1046/j.1365-2419.2000.00128.x
Dulčić, J., Pallaoro, A., Dragičević, B., and Stagličić-Radica, N. (2010). First record of dwarf flathead Elates ransonnetii (Platycepahlidae) in The Adriatic Sea. Cybium 34, 222–233.
Dulvy, N. K., Rogers, S. I., Jennings, S., Stelzenmüller, V., Dye, S. R., and Skjoldal, H. R. (2008). Climate change and deepening of the North Sea fish assemblage: a biotic indicator of warming seas. J. Appl. Ecol. 45, 1029–1039. doi: 10.1111/j.1365-2664.2008.01488.x
Eppley, R. W. (1972). Temperature and Phytoplankton growth in the sea. Fish. Bull. Natl. Ocean. Atmos. Adm. 70, 1063–1085.
Fortibuoni, T., Aldighieri, F., Giovanardi, O., Pranovi, F., and Zucchetta, M. (2015). Climate impact on Italian fisheries (Mediterranean Sea). Reg. Environ. Change 15, 931–937. doi: 10.1007/s10113-015-0781-6
Fortibuoni, T., Libralato, S., Raicevich, S., Giovanardi, O., and Solidoro, C. (2010). Coding early naturalists' accounts into long-term fish community changes in the adriatic sea (1800-2000). PLoS ONE 5:e15502. doi: 10.1371/journal.pone.0015502
Galil, B. S. (2007). Loss or gain? Invasive aliens and biodiversity in the Mediterranean Sea. Mar. Pollut. Bull. 55, 314–322. doi: 10.1016/j.marpolbul.2006.11.008
Giani, M., Djakovac, T., Degobbis, D., Cozzi, S., Solidoro, C., and Fonda Umani, S. (2012). Recent changes in the marine ecosystems of the northern Adriatic Sea. Estuar. Coast. Shelf Sci. 115, 1–13. doi: 10.1016/j.ecss.2012.08.023
IPCC. (2013). “Climate Change 2013: The Physical Science Basis,” in Contribution of Working Group I to the Fifth Assessment Report of the Intergovernmental Panel on Climate Change, eds T. F. Stocker, D. Qin, G.-K. Plattner, M. M. B. Tignor, S. K. Allen, J. Boschung, A. Nauels, Y. Xia, V. Bex, and P. M. Midgley (Cambridge; New York, NY: Cambridge University Press).
Jones, M. C., Dye, S. R., Pinnegar, J. K., Warren, R., and Cheung, W. W. L. (2013). Applying distribution model projections for an uncertain future: the case of the Pacific oyster in UK waters. Aquat. Conserv. Mar. Freshw. Ecosyst. 23, 710–722. doi: 10.1002/aqc.2364
Lassiter, R. R., and Kearns, D. K. (1974). “Phytoplankton population changes and nutrient fluctuations in a simple aquatic ecosystem model,” in Modelling the Eutrophication Process, eds E. J. Middlebrookers, D. H. Falkenberger, and T. E. Maloney (Ann Arbour, MI: Ann Arbour Science), 131–138.
Lejeusne, C., Chevaldonné, P., Pergent-Martini, C., Boudouresque, C. F., and Pérez, T. (2010). Climate change effects on a miniature ocean: the highly diverse, highly impacted Mediterranean Sea. Trends Ecol. Evol. 25, 250–260. doi: 10.1016/j.tree.2009.10.009
Libralato, S., Christensen, V., and Pauly, D. (2006). A method for identifying keystone species in food web models. Ecol. Model. 195, 153–171. doi: 10.1016/j.ecolmodel.2005.11.029
Odum, E. P. (1969). The strategy of ecosystem development. Science 164, 262–270. doi: 10.1126/science.164.3877.262
Okey, T. A. (2003). Macrobenthic colonist guilds and renegades in Monterey Canyon (USA) drift algae: partitioning multidimensions. Ecol. Monogr. 73, 415–440. doi: 10.1890/01-4088
Palomares, M. L. D., and Pauly, D. (2014). SeaLifeBase. World Wide Web electronic publication. Available online at: www.sealifebase.org
Parmesan, C. (2006). Ecological and evolutionary responses to recent climate change. Annu. Rev. Ecol. Evol. Syst. 37, 637–669. doi: 10.1146/annurev.ecolsys.37.091305.110100
Parravicini, V., Azzurro, E., Kulbicki, M., and Belmaker, J. (2015). Niche shift can impair the ability to predict invasion risk in the marine realm: an illustration using Mediterranean fish invaders. Ecol. Lett. 18, 246–253. doi: 10.1111/ele.12401
Pecarevič, M., Mikus, J., Bratos Cetinič, A., Dulčić, J., and Calič, M. (2013). Introduced marine species in Croatian waters (Eastern Adriatic Sea). Mediterr. Mar. Sci. 14, 224–237. doi: 10.12681/mms.383
Pianka, E. R. (1981). “Competition and niche theory,” in Theoretical Ecology Principles and Applications, ed R. M. May (Oxford, UK: Ariel), 167–196.
Pinnegar, J. K., Tomczak, M. T., and Link, J. S. (2014). How to determine the likely indirect food-web consequences of a newly introduced non-native species: a worked example. Ecol. Model. 272, 379–387. doi: 10.1016/j.ecolmodel.2013.09.027
Pranovi, F., Franceschini, G., Casale, M., Zucchetta, M., Torricelli, P., and Giovanardi, O. (2006). An ecological imbalance induced by a non-native species: the Manila clam in the Venice Lagoon. Biol. Invasions 8, 595–609. doi: 10.1007/s10530-005-1602-5
Pranovi, F., Libralato, S., Raicevich, S., Granzotto, A., Pastres, R., and Giovanardi, O. (2003). Mechanical clam dredging in Venice lagoon: Ecosystem effects evaluated with a trophic mass-balance model. Mar. Biol. 143, 393–403. doi: 10.1007/s00227-003-1072-1
Pranovi, F., and Link, J. S. (2009). Ecosystem exploitation and trophodynamic indicators: a comparison between the Northern Adriatic Sea and Southern New England. Prog. Oceanogr. 81, 149–164. doi: 10.1016/j.pocean.2009.04.008
Pranovi, F., Raicevich, S., Franceschini, G., Torricelli, P., and Giovanardi, O. (2001). Discard analysis and damage to non-target species in the“ rapido” trawl fishery. Mar. Biol. 139, 863–875. doi: 10.1007/s002270100646
Roessig, J., and Woodley, C. (2004). Effects of global climate change on marine and estuarine fishes and fisheries. Fish Biol. Fish. 14, 251–275. doi: 10.1007/s11160-004-6749-0
Rosenfeld, J. S. (2002). Functional redundancy in ecology and conservation. Oikos 98, 156–162. doi: 10.1034/j.1600-0706.2002.980116.x
Ruiz, G. M., Carlton, J. T., Grosholz, E. D., and Hines, A. H. (1997). Global invasions of marine and estuarine habitats by non-indigenous species: mechanisms, extent, and consequences. Am. Zool. 37, 621–632. doi: 10.1093/icb/37.6.621
Somot, S., Sevault, F., and Déqué, M. (2006). Transient climate change scenario simulation of the Mediterranean Sea for the twenty-first century using a high-resolution ocean circulation model. Clim. Dyn. 27, 851–879. doi: 10.1007/s00382-006-0167-z
Tortonese, E. (1964). Main biogeographical features and problems of the Mediterranean fish fauna. Copeia 1, 98–107. doi: 10.2307/1440837
UNEP - MAP - RAC/SPA. (2008). Impact of Climate Change on Biodiversity in the Mediterranean Sea. Tunis: RAC/SPA.
Walters, C. J., and Christensen, V. (2007). Adding realism to foraging arena predictions of trophic flow rates in Ecosim ecosystem models: shared foraging arenas and bout feeding. Ecol. Model. 209, 342–350. doi: 10.1016/j.ecolmodel.2007.06.025
Walters, C. J., Pauly, D., Christensen, V., and Kitchell, J. F. (2000). Representing density dependent consequences of life history strategies in aquatic ecosystems: EcoSim II. Ecosystems 3, 70–83. doi: 10.1007/s100210000011
Walther, G.-R., Post, E., Convey, P., Menzel, A., Parmesan, C., Beebee, T. J. C., et al. (2002). Ecological responses to recent climate change. Nature 416, 389–395. doi: 10.1038/416389a
Walther, G.-R., Roques, A., Hulme, P. E., Sykes, M. T., Pyaek, P., Kühn, I., et al. (2009). Alien species in a warmer world: risks and opportunities. Trends Ecol. Evol. 24, 686–693. doi: 10.1016/j.tree.2009.06.008
Ward, N. L., and Master, G. J. (2007). Linking climate change and species invasion: an illustration using insect herbivores. Glob. Change Biol. 13, 1605–1615. doi: 10.1111/j.1365-2486.2007.01399.x
Wolkovich, E. M., and Cleland, E. E. (2014). Phenological niches and the future of invaded ecosystems with climate change. AoB Plants 6, 1–16. doi: 10.1093/aobpla/plu013
Zádor, J., Zsély, I. G., and Turányi, T. (2006). Local and global uncertainty analysis of complex chemical kinetic systems. Reliab. Eng. Syst. Saf. 91, 1232–1240. doi: 10.1016/j.ress.2005.11.020
Zenetos, A., Gofas, S., Morri, C., Rosso, A., Violanti, D., Garcia Raso, J. E., et al. (2012). Alien species in the Mediterranean Sea by 2012. A contribution to the application of European Union's Marine Strategy Framework Directive (MSFD). Part 2. Introduction trends and pathways. Mediterr. Mar. Sci. 13, 328–352. doi: 10.12681/mms.327
Keywords: non-indigenous species, ecological niche, warming scenarios, community structure, food web, Mediterranean Sea
Citation: Libralato S, Caccin A and Pranovi F (2015) Modeling species invasions using thermal and trophic niche dynamics under climate change. Front. Mar. Sci. 2:29. doi: 10.3389/fmars.2015.00029
Received: 25 March 2015; Accepted: 11 May 2015;
Published: 27 May 2015.
Edited by:
Athanassios C. Tsikliras, Aristotle University of Thessaloniki, GreeceReviewed by:
Brett W. Molony, Department of Fisheries, Western Australia, AustraliaSanja Matic-Skoko, Institute of Oceanography and Fisheries, Croatia
Copyright © 2015 Libralato, Caccin and Pranovi. This is an open-access article distributed under the terms of the Creative Commons Attribution License (CC BY). The use, distribution or reproduction in other forums is permitted, provided the original author(s) or licensor are credited and that the original publication in this journal is cited, in accordance with accepted academic practice. No use, distribution or reproduction is permitted which does not comply with these terms.
*Correspondence: Simone Libralato, ECHO Group, Division of Oceanography, Istituto Nazionale di Oceanografia e di Geofisica Sperimentale, Via Beirut 2/4 (Ex-Sissa Building), 34151 Trieste, Italy, slibralato@ogs.trieste.it