Analysis of Long-Term Changes in a Mediterranean Marine Ecosystem Based on Fishery Landings
 Tomaso Fortibuoni1,2*
  Otello Giovanardi2,3
  Fabio Pranovi4
  Saša Raicevich2,3
  Cosimo Solidoro1,5
  Simone Libralato1
- 1ECHO Group, Division of Oceanography, National Institute of Oceanography and Experimental Geophysics, Trieste, Italy
- 2Italian National Institute of Environmental Protection and Research, Chioggia, Italy
- 3Institute of Marine Sciences, National Research Council, Ancona, Italy
- 4Department of Environmental Sciences, Informatics and Statistics, Ca' Foscari University, Venice, Italy
- 5The Abdus Salam International Centre for Theoretical Physics, Trieste, Italy
In the Mediterranean Sea, structured and standardized monitoring programs of marine resources were set only in the last decades, so the analysis of changes in marine communities over longer time scale has to rely on other sources. In this work, we used seven decades (1945–2014) of disaggregated landings statistics for the Northern Adriatic Sea (Mediterranean) to infer changes in the ecosystem. Analysis of landings composition was enriched with the application of a suite of ecological indicators (e.g., trophodynamic indicators, such as the primary production required to sustain the catches—PPR; size-based indicators, such as the large species indicator—LSI; other indicators, such as the elasmobranchs-bony fish ratio—E/B ratio). Indicators were further compared with main ecosystem drivers, i.e., fishing capacity, nutrient loads and climate change. Species most vulnerable to fishing (i.e., elasmobranchs and large-sized species) dramatically declined at the beginning of the industrialization of fishery that occurred right afterwards World War II, as can be inferred by the negative drop of LSI and E/B ratio in the mid-1950s. However, until the mid-1980s landings and PPR increased due to improvements in fishing activities (e.g., the introduction of more efficient fishing gears) increasing fishing capacity, high productivity of the ecosystem. Overall, the effects of fishing were buffered by an increase in productivity in the period of high nutrient discharge (up to mid-1980s), while significant changes in fish community structure were already occurring. From the mid-1980s, a reduction in nutrient load caused a decline in productivity but the food-web structure was already modified and unable to support, or recover from, such unbalanced situation, resulting in the collapse of landings. This collapse is coherent with alternative stable states hypothesis, typical of complex real systems, that implies drastic interventions that go beyond fisheries management and include regulation of nutrient release for recovery. The work highlights that, despite poor capabilities to track species dynamics, landings and applied indicators might help to shed light on the long-term dynamics of marine communities, thus contributing to place current situation in an historical framework with potential for supporting management.
Introduction
Long-term analyses of the interactions between human society and the oceans are necessary for understanding the processes that brought the marine ecosystems as we see today, avoiding the so-called “shifting the baseline syndrome” and understanding the magnitude and causes of change (Pauly, 1995; Jackson et al., 2001). In this framework, marine historical ecology (MHE) can bring a significant contribution to present-day management of marine ecosystems, both for conservation and for sustainable exploitation of resources (Engelhard et al., 2015). However, often the analyses of historical changes in marine communities cannot be based on results of structured and standardized monitoring programs, since in most of the cases those were set in the very last decades. The need to bridge the gap between request of knowledge on past status of ecosystems and the available monitoring data, triggered the uses of different approaches to extract information from data coming from other sources, including paleontological, archeological, and historical sources, as well as the use of landings (e.g., Rosenberg et al., 2005; Sàenz-Arroyo et al., 2005; Lotze et al., 2006; Fortibuoni et al., 2010, 2016; Van Beveren et al., 2016).
In this context, detailed and disaggregated fishery statistics represent an important source of information that can be used as proxies to evaluate long-term changes in marine fisheries and communities. Changes in the composition of landings, evaluated through opportune weighting metrics (indicators), showed to reflect changes in the structure of underlying fish communities due to anthropogenic impacts and environmental changes (e.g., Caddy, 1993; Pauly et al., 1998; de Leiva Moreno et al., 2000; Pinnegar et al., 2002; Libralato et al., 2004; Pauly and Watson, 2005; Baeta et al., 2009; Munyandorero and Guenter, 2010; Kleisner et al., 2013). Moreover, catch statistics are recognized to be linked to fishing and environmental pressures and respond selectively to management action (Coll et al., 2016).
Nevertheless, the intrinsic limitations of fishery-dependent data—such as landings—include the lack of standardization, the dependence from fishing fleet activity features as well as market preferences of products that usually change across time and space. All this imposes caution in deriving marine population densities directly from catch statistics (e.g., Essington et al., 2006; Pauly et al., 2013).
The capability to connect modification in landings composition to changes in the community at sea is more robust when local disaggregated landings result from multi-target and multi-gear fisheries (i.e., several distinct métiers), and when changes in fishing activities (e.g., introduction of new technologies, shift from one fishing gear to another, shift in fishing grounds, fishing capacity as number and tonnage of boats) are traceable. In this context an important aspect to be considered is the trend in indices over time, rather than the absolute values they assume, being reference points or limit values for many indicators not yet been established (Shin et al., 2010).
The Northern Adriatic Sea (Mediterranean Sea) represents a valuable case study for MHE, due to the long history of exploitation (Botter et al., 2006; Fortibuoni, 2010), human-induced changes (Lotze et al., 2011), as well as documented long-term modifications of the physical and chemical oceanographic characteristics of the basin due to anthropogenic impact (Mozetič et al., 2009; Solidoro et al., 2009) and temperature change (Russo et al., 2002).
In this study, a long-term time-series (1945–2014) of landings disaggregated by species (Mazzoldi et al., 2014) for the Northern Adriatic Sea was analyzed to detect changes in total yields and variations in landings composition by functional groups over time. A suite of ecological indicators was applied to landings data to integrate responses to multiple stressors (Fu et al., 2015; Coll et al., 2016). They include trophodynamic indicators (e.g., mean trophic level, primary production required), climatic indicators (mean temperature of the catch), and other indicators, such as elasmobranchs-bony fish ratio. These indicators were compared with independent data describing main ecosystem drivers, in order to corroborate findings.
Our analysis falls within the general need of taking into account ecological processes when considering long-term changes in fishery resources where fishery-independent data are lacking, by testing several ecological indicators, and their responsiveness to fishery and environmental drivers. The approach is suitable to be applied for the purposes of the Ecosystem Approach to Fishery Management (EAFM) and contributes to establishing historical baselines to be used to compare current and future ecosystem status, for instance in the context of the Marine Strategy Framework Directive (MSFD) implementation.
Materials and Methods
Area of Study
The Northern Adriatic Sea is the shallowest (average depth of 33.5 m) and northern-most area of the Adriatic and Mediterranean Seas (Figure 1). This area is characterized by strong riverine outflows from the Po River (the largest Italian river) that is a primary source of nutrients and organic matter to the basin (Giani et al., 2012). Water circulation is dominated by two counter-clockwise gyres, which confine a large part of the nutrient-enriched riverine inputs along western coastal regions (Zavatarelli et al., 1998). In fact, the western coastal waters were long considered as ones of the most productive of the Mediterranean Sea (Hopkins et al., 1999), and occasionally local hypoxia/anoxia events have been reported especially close to the Po River mouth (Giani et al., 2012). The reduction in phosphorus loads in Italian rivers in the 1980s triggered reversal in the eutrophication trend and was indicated as the start of a (cultural) oligotrophication process for the basin (Mozetič et al., 2009; Solidoro et al., 2009).
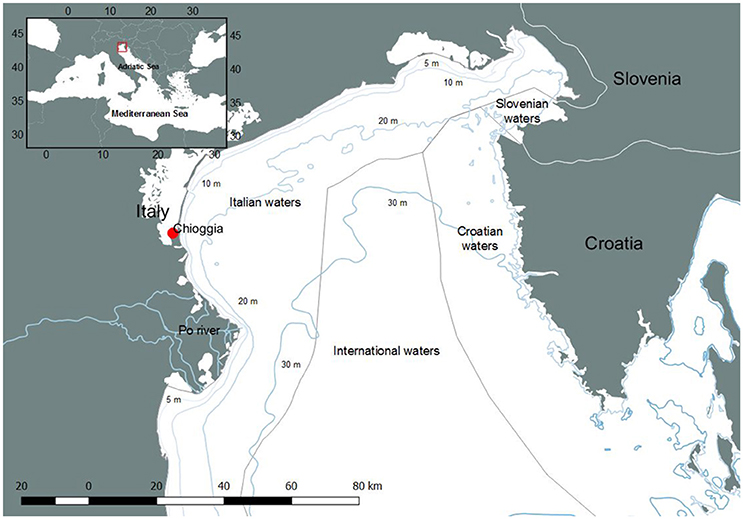
Figure 1. The area of study (Northern Adriatic Sea). Commercial fisheries landings derive from the area shown in the figure, Slovenian and Croatian waters excluded.
The seabed is characterized by muddy and sandy bottoms, with the presence of few rocky outcrops. Due to the presence of a wide flat trawlable platform coupled with the high productivity, the Northern Adriatic Sea is the Italian basin with the highest fishery pressure, and one of the most exploited areas in the Mediterranean Sea (AdriaMed, 2004).
History of Fisheries in the Northern Adriatic Sea
The biological resources of the study area have been intensively exploited since centuries, and the port of Chioggia (Figure 1) hosts the most important fishing fleet of the Adriatic Sea and one of the most important of the entire Mediterranean basin (Botter et al., 2006; Fortibuoni, 2010; Mion et al., 2015).
Before and immediately after World War II (WWII) the Chioggia fishing fleet adopted a wide variety of artisanal gears, both passive and active and the industrialization of fisheries in the Adriatic Sea gradually became consolidated starting from the 1950s, having begun in the period between the two world wars with the first experiments with engines (Fortibuoni, 2010). The period following WWII was characterized by marked changes in fishing equipment and technologies. There was a great increase in both demand for fish products and technical innovations, which enabled fleets to expand considerably. Consequently, there was a continuous and substantial increase in the fishing capacity (Cataudella and Spagnolo, 2011).
The use of progressively larger ships and engines allowed fishing areas to be expanded as well as larger and heavier gears to be used. As an example, the bottom otter-trawl was previously towed by pair sailing boats (Botter et al., 2006), and after WWII it was increasingly adopted by single mechanized vessels. Most traditional fishing gears were abandoned (e.g., beach seines and longlines, commonly used throughout the nineteenth century) and new and more efficient ones were introduced. However, the geographical characteristics of the Northern Adriatic Sea (shallow and semi-closed basin) constrained the expansion of fisheries, thus fishery grounds exploited by Chioggia's fleets can be considered almost stable throughout the period analyzed (Mazzoldi et al., 2014).
The first of the major innovations in fishing equipment introduced was the “saccaleva” surrounding net aided with a light source for attracting fish. It became widespread in the 1940s in Chioggia and gradually replaced all other methods for fishing small pelagic fish, such as the traditional “menaide” drift net (Fortibuoni, 2010). Successively, the “saccaleva” was substituted in the late 1960s by the more efficient “volante” (mid-water pelagic trawl, towed by paired vessels) that since the 1970s is the main gear used to catch pelagic species (Cingolani et al., 1996). In the mid-1950s the “rapido” trawl (a sort of beam trawl rigged with 10 cm long iron teeth; Pranovi et al., 2001) was introduced targeting flatfish and shellfish (such as the Mediterranean scallop Pecten jacobaeus), but also demersal resources, as spottail mantis shrimp (Squilla mantis) and common cuttlefish (Sepia officinalis). In the early 1970s, the first hydraulic dredge came into use, substituting the traditional hand-maneuvered gears to harvest different species of clams (Romanelli et al., 2009). In relation to this, the clam fishery quickly became one of the most valuable.
Furthermore, in the mid-1980s, the introduction of LORAN (Long Range Navigation) and subsequently the video plotter and GPS (Global Positioning System) greatly improved navigation precision, allowing the exploitation of areas that were previously inaccessible because of their proximity to unsuitable trawling sites, as the presence of rocky outcrops.
As regard fisheries management, a comprehensive scheme in Italy was initiated with the Law 41/1982, establishing that all professional fishing vessels had to possess a license reporting the characteristics of the vessel (e.g., GT), limitations of fishing areas, gear use and spatial licensing (Piroddi et al., 2015). The Italian fisheries management system is actually based on fishing effort/capacity regulation systems, and technical measures. No quotas or TACs (total allowable catch) have been established, except for Atlantic bluefin tuna (Thunnus thynnus) and Striped venus clam (Chamelea gallina). From 1983, the national fishing fleet was subject to reduction constraints in relation to two reference parameters, fleet tonnage and engine power. A further incentive toward fleet capacity/effort reduction was provided by European Structural Funds that financed the voluntary removal of vessels. Moreover, in recent years there has been a voluntary departure from the sector due to the general old age of the fishing fleet and the fisheries crisis (Cataudella and Spagnolo, 2011). However, as regards the Chioggia's fishing fleet, fishing capacity (i.e., total GT) has increased until recent years (Barausse et al., 2011).
Data
Landings Dataset
Official landings data (1945–2014) from the Chioggia's wholesale fish-market were retrieved from the Clodia database (Clodia database, 2015). Landings of a wide variety of benthic and pelagic species represent the aggregated commercialized quantities caught by the highly diversified fishing gears employed by fishermen of Chioggia. Data do not include any estimate of the discard, and landings disaggregated by gear are not available. Landings refer only to fish and seafood caught by local fishermen from the Chioggia's fleet that operates in the Adriatic Sea. The database was validated by Mazzoldi et al. (2014) to show that landings composition provides reliable indication of fish abundance.
Information on the habitat (pelagic/demersal) and maximum length (Lmax) for each species were taken from FishBase (Froese and Pauly, 2016). Moreover, the thermal preference (median temperature preference, T) was assigned according to Cheung et al. (2013). The trophic level of species (TL), specific for the Northern Adriatic Sea, was obtained from Fortibuoni et al. (2013), from other literature and estimates (e.g., Stergiou and Karpouzi, 2002) or retrieved from FishBase in the case of fish, and SeaLifeBase (Palomares and Pauly, 2016) in the case of invertebrates.
Ecosystem Drivers: Fishing Capacity, Nutrient Loads, and Climate Change
Data on Chioggia's fishing fleet capacity in terms of gross registered tonnage (GRT) were gathered from ISTAT (Italian National Institute of Statistics) for the period 1951–1989 and in terms of gross tonnage (GT) from the Community Fleet Register for the period 1990–2014. Total fishing capacity was expressed as GT for the entire time-series and used as a proxy for fishing pressure in the analyses because no long-term records of fishing effort were available. It was also not possible to include in fishing pressure any estimate of the technological creep due to the lack of data (e.g., CPUE from scientific surveys; Engelhard, 2016).
The monthly discharge of the Po river (m3/s), measured at Pontelagoscuro (Ferrara, Italy) for the period 1945–2014 was provided by the Regional Environmental Protection Agency of Emilia Romagna and used to calculate monthly mean annual discharge. Nutrient yearly discharge, in terms of annual input of nitrogen (NO3) and phosphorus (PO4) load (t/y) from the Po river, was obtained from Ludwig et al. (2009) for the period 1960–2000, and from EU FP7 PERSEUS project for the period 2001–2014.
The winter (December-March) station based index of the North Atlantic Oscillation index (Hurrell and National Center for Atmospheric Research Staff, 2016) was used to represent the large-scale climatic variability in the area in the period 1945–2014. The NAO is based on the difference of normalized sea level pressure between Lisbon (Portugal) and Stykkisholmur/Reykjavik (Iceland). Positive values of the NAO index are typically associated with stronger-than-average westerlies over the middle latitudes and wetter/milder weather over western Europe.
Finally, monthly data on sea surface temperature (SST) were downloaded from the International Comprehensive Ocean–Atmosphere Data Set (ICOADS). SST data at 13°E–45°N, 15°E–45°N, 13°E–43°N, and 15°E–43°N for the period 1957–2014 were used to compute the annual mean values.
Ecological Indicators
Data were also used to compute ecological indicators, meant to provide a holistic description of the system. Disaggregated landings per species (landed quantities in kg per year) were integrated into metrics by applying a suite of ecological indicators (described in Table 1) based on TL, thermal preference, habitat and species' size.
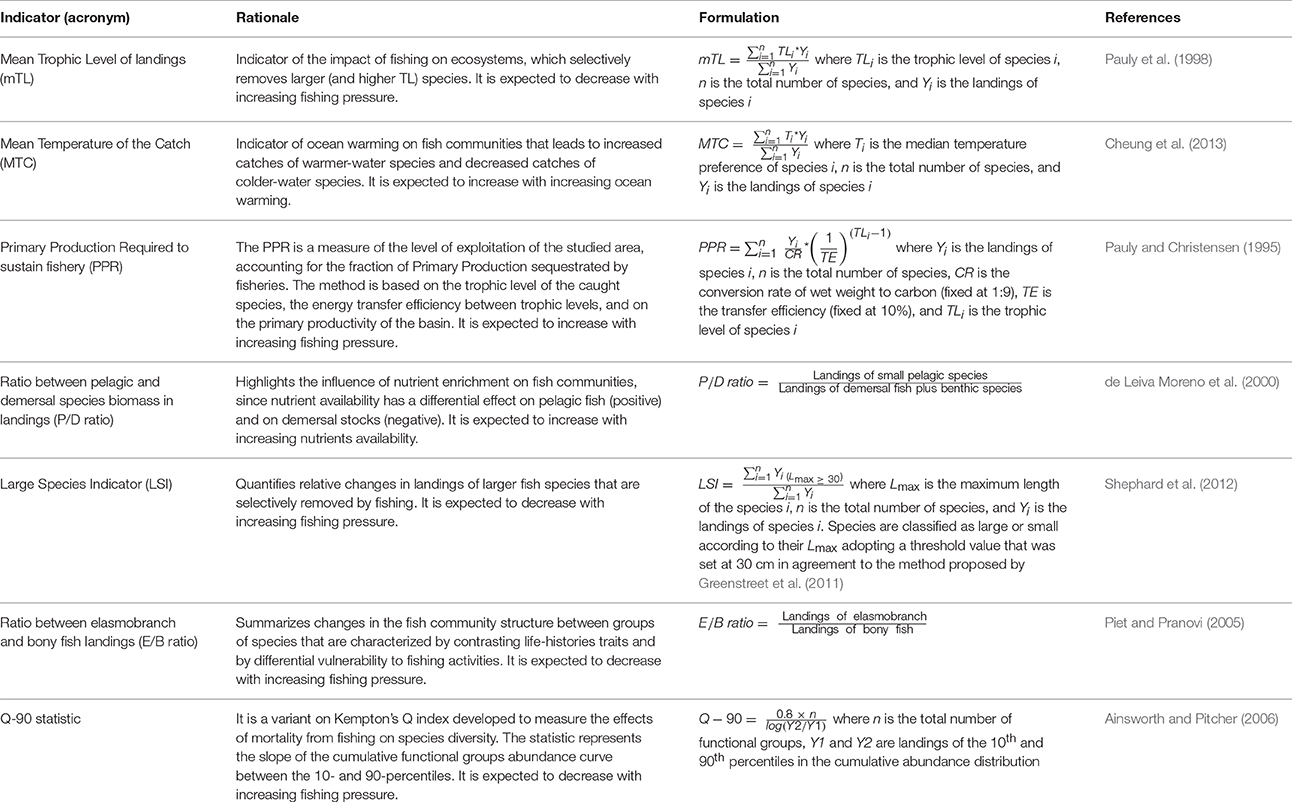
Table 1. Ecological indicators calculated for the time series of landings.
Metrics used included: the mean Trophic Level of landings, an indicator of food webs structure (mTL; Pauly et al., 1998); the Mean Temperature of the Catch (MTC; Cheung et al., 2013), which is the average inferred temperature preference of the species weighted by their annual catch used for evaluating the effect of sea warming on fish communities; the ratio of small pelagic fish to demersal and benthic landings (P/D ratio; de Leiva Moreno et al., 2000); the Large Species Indicator (LSI), i.e., the biomass proportion in landings of large-sized fish species (Shephard et al., 2012); the ratio between elasmobranch and bony fish in the landings (E/B ratio; Piet and Pranovi, 2005); the Primary Production Required to sustain fishery catches (PPR; Pauly and Christensen, 1995) that is the amount of energy exported from the system by landings and can be seen as the ecological footprint of fishing activities (Swartz et al., 2010); the Q-90 statistic (Ainsworth and Pitcher, 2006) that is a variant on Kempton's Q index to evaluate biodiversity (Kempton and Taylor, 1976). Landings per Unit of Fishing Capacity (LPUC) were also computed considering the yearly total gross tonnage of the fleet.
Analysis of Data
Multivariate Analysis
Landings data were aggregated into 12 functional groups, according to their taxonomical and ecological features, to reduce missing values and restrict the number of variables in order to better elucidate main changes. Invertebrates were subdivided into three groups, i.e., bivalves, cephalopods, and crustaceans (no reliable data for gastropods were available in the database and thus this group was omitted). Pelagic bony fish species were grouped into three size classes according to fish species Lmax (small: Lmax < 30 cm; medium: 30 cm ≤ Lmax < 90 cm; large: Lmax ≥ 90 cm). Analogously, three groups were used for aggregating demersal bony fish species by size. Flatfishes, sharks and “skates and rays” represented three further groups.
Functional groups' proportion in landings (%) was computed yearly in order to analyse landings composition and remove the effect of landings abundances. A fourth root transformation was applied to data to downweight the influence of predominant groups (Kaiser et al., 2000) and the similarity between every pair of years was computed using the Bray-Curtis similarity coefficient. Chronological clustering using the un-weighted pair-group average (Legendre and Legendre, 1998) was applied to identify periods with similar landings composition. Functional groups' proportion in landings was compared among periods by means of the non-parametric Kruskal-Wallis H-test (α = 0.05). Ecological indicators were compared between consecutive periods identified through cluster analysis by means of the non-parametric Mann-Whitney U-test (α = 0.05). Analysis was done with PAST v. 3.14 (PAleontological STatistics; Hammer et al., 2001).
Ecological indicators and drivers relationship was analyzed for the period 1960–2014 (for which all drivers were available) through the statistical procedure BIO-ENV from PRIMER v. 6.1.5 (global BEST-test; Clarke et al., 2008). The method consists in the computation of the correlation coefficients between similarity matrices of ecological indicators and drivers, and identifies the combination of drivers that maximizes the correlation. Indicators and drivers were normalized prior to the construction of the Euclidean distance matrices, since they represented different units of measure. The skewness and the individual correlations between drivers were explored by constructing a draftsman plot and examining the resulting Spearman rank correlations to eventually reduce redundancy and dimensionality of the data. We included all drivers in the analysis after testing the absence of highly correlated drivers (ρ ≥ 0.95).
Time-Series Analysis
Trends in total landings (Y), ecological indicators and drivers time-series were analyzed using the Mann–Kendall test and the non-parametric Sen's method was used to quantify the magnitude (slope) of the trend, using the Microsoft Excel template MAKESENS (Mann-Kendall test for trend and Sen's slope estimates) developed by Salmi et al. (2002).
Drivers time-series were further explored using the sequential t-test analysis of regime shift (STARS v. 3.4) first developed by Rodionov (2004) in order to detect potential abrupt changes in the mean. The algorithm was applied to the filtered time series calculated by removing red noise through a “pre-whitening” procedure based on the IP4 method (Rodionov, 2006) to take into account the effect of serial correlation on shift detection. The cut-off length was set at 10 years, the significance level at 0.05 and Huber's weight parameter at 1.
Results
Multivariate Analysis
Chronological clustering allowed distinguishing seven periods with different landings composition at a similarity threshold of 0.94: 1945, 1946–1954, 1955–1961, 1962–1985, 1986–1993, 1994–2008, and 2009–2014 (Figure 2). Year 1945, which represented an autonomous cluster at this similarity threshold, was associated to the first period (then becoming 1945–1954).
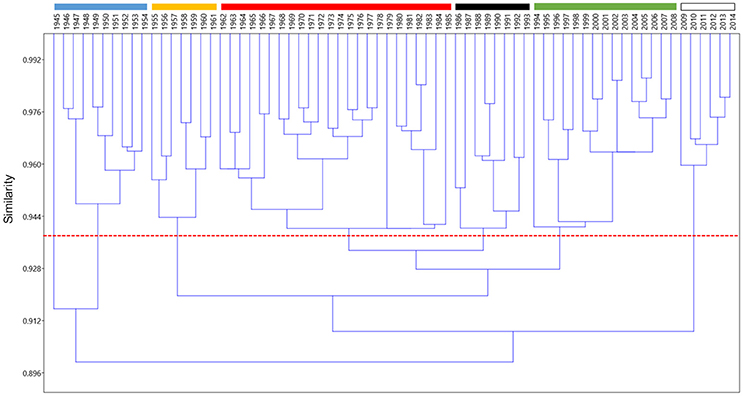
Figure 2. Chronological clustering (Bray-Curtis similarity, unweighted pair-group average) of the composition of landings for the years 1945–2014.
The difference among periods of functional groups' proportion in landings was statistically significant for all functional groups. Landings were dominated by small pelagics in all periods, with a percentage contribution ranging between 37% (SD: 8%; 1945–1954) and 68% (SD: 3%; 2009–2014). Cephalopods was the second most relevant group in the landings in all periods, with a contribution ranging between 10% (SD: 2%; 1955–1961) and 20% (SD: 5%; 1986–1993). In the first two periods, the third group in terms of biomass was medium pelagics that represented more than 10% of the landings [13% (SD: 4%) and 10% (SD: 6%), respectively], but then medium pelagics declined in the following periods down to 1.1% (SD: 0.4%) in recent years (2009–2014). Medium demersals ranged between 12% (SD: 2%; 1945–1954) and 6% (SD: 1%; 1955–1961). The other groups contributed with <10% in all periods. It is worth noting that skates and rays showed a sharp decline, from 3% (SD: 1%) in 1945–1954 to 0.04% (SD: 0.01%) in 2009–2014 (Figure 3). Another interesting dynamic was showed by bivalves that from 2% (SD: 1%) of the landings biomass in the first period increased to 8% (SD: 6%) in the period 1986–1993, and then sharply declined down to 1.9% (SD: 0.4%) in the most recent period (Figure 3).
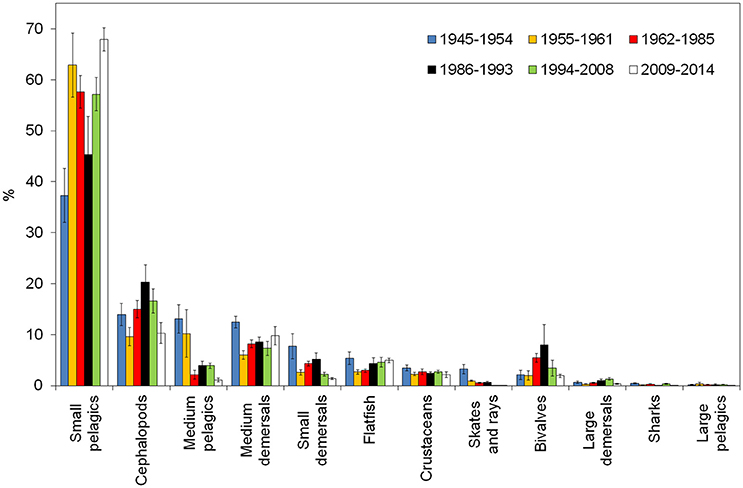
Figure 3. Percentage composition of the fish community in the periods identified through chronological clustering. The confidence interval (95%) is reported in the vertical bar.
Mann-Whitney U-test results are reported in Table 2. Y, MTC, LPUC, PPR, and P/D ratio significantly increased between the first two periods, while mTL, LSI and E/B ratio significantly decreased (Figures 4, 5). Between 1955–1961 and 1962–1985 only MTC significantly increased, while mTL, LSI, and P/D ratio significantly decreased (Figure 5). In the subsequent period, mTL and LSI significantly increased, while Y, LPUC, PPR, Q-90, and P/D ratio significantly decreased (Figures 4, 5). Between 1986–1993 and 1994–2008 a significant increase of MTC, Q-90, and P/D ratio was observed, while E/B ratio further decreased (Figure 5). Finally, by comparing the last two periods (1994–2008 and 2009–2014) a significant decrease of MTC, PPR, LSI, Q-90, and E/B ratio occurred, while P/D ratio significantly increased (Figure 5).
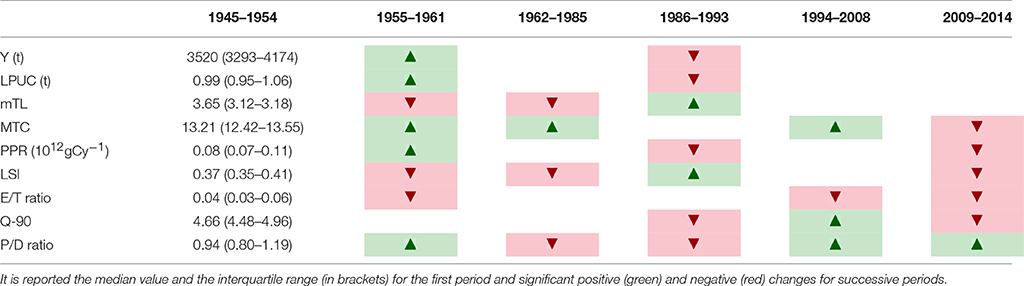
Table 2. Significant differences (Mann-Whitney U-test, p < 0.05) of total landings (Y), landings per unit of capacity (LPUC), and ecological indicators between successive periods.
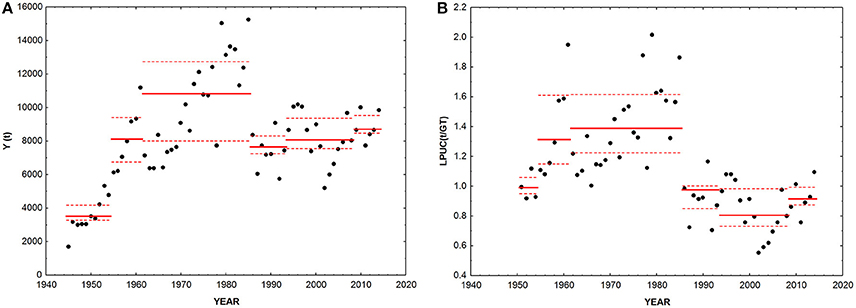
Figure 4. (A) Total landings (Y) and (B) landings per unit of fishing capacity (LPUC). Black dots, data; continuous red line, median value in each period identified through the cluster analysis; dotted red lines, interquartile range in each period.
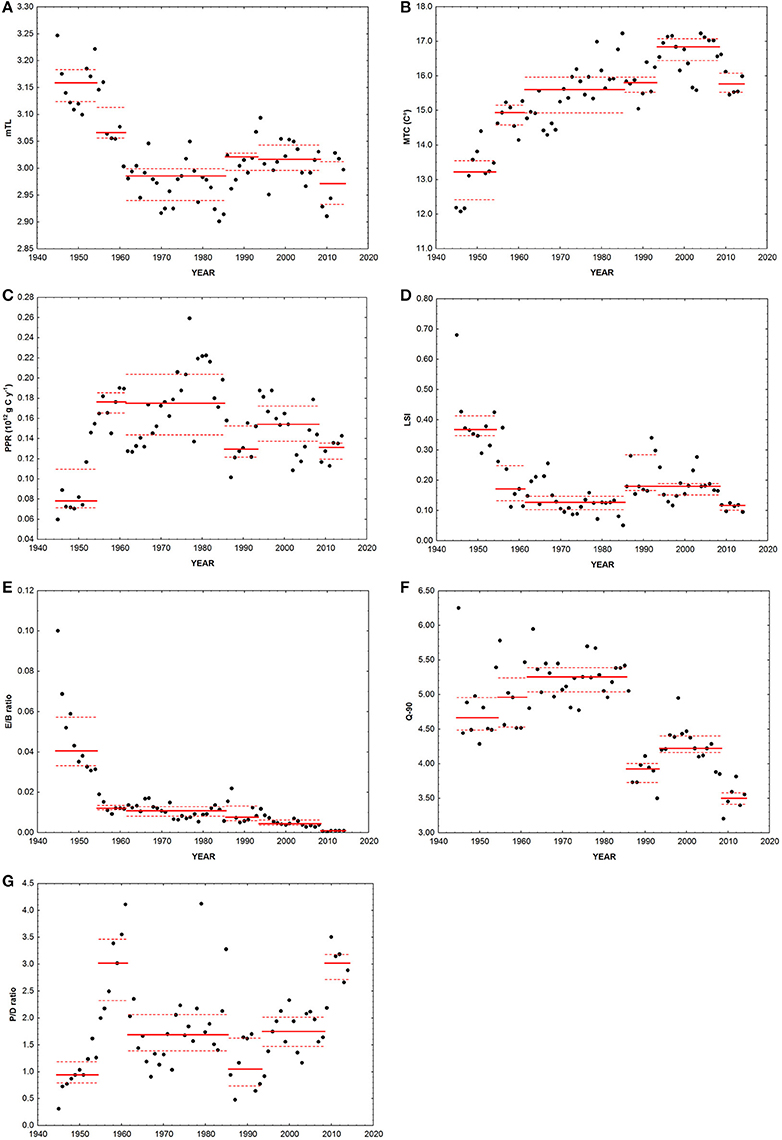
Figure 5. Ecological indicators calculated on the basis of landings disaggregated data. Black dots, data; continuous red line, median value in each period identified through the cluster analysis; dotted red lines, interquartile range in each period. (A) mTL, mean trophic level; (B) MTC, mean temperature of the catch; (C) PPR, primary production required; (D) LSI, large species indicator; (E) E/B ratio, ratio between elasmobranch and bony fish in the landings; (F) Q-90, a variant on Kempton's Q index; (G) P/D ratio, ratio of small pelagic fish to demersal fish plus benthic landings.
The global BEST-test showed a moderate (ρ = 0.26–0.34) significant (p < 0.01) link between ecological indicators and drivers. The similarity matrices obtained with phosphorous discharge and fishing capacity correlated highest (ρ = 0.34) with the similarity matrix of ecological indicators.
Time-Series Analysis
Landings (Y) significantly increased between 1945 and 2014 (Z = 3.36, p < 0.001, slope = 58.9 t year−1, Figure 4A). Conversely, landings rescaled over fishing capacity (LPUC) significantly declined in the whole period of study (Z = −3.95, p < 0.001, slope = −8.13 t GT−1 year−1, Figure 4B). The mTL significantly declined along the whole time series (Z = −3.38, p < 0.001, slope = −0.002 year−1, Figure 5A). MTC significantly increased from 1945 to 2014 (Z = 7.27, p < 0.001, slope = 0.048°C year−1, Figure 5B). PPR showed no significant trend between 1945 and 2014 (Figure 5C). LSI and E/B ratio significantly declined from 1945 to 2014 (Z = −3.21, p < 0.01, slope = −0.002 year−1; Z = −8.67, p < 0.001, slope = −0.0003 year−1, Figures 5D,E). The same temporal trend resulted for Q-90 (Z = −4.92, p < 0.001, slope = −0.021 year−1, Figure 5F). The P/D ratio significantly increased from 1945 to 2014 (Z = 2.7, p < 0.01, slope = −0.02 year−1, Figure 5G).
As regards drivers, Po river mean annual discharge did not show a significant trend. However, the time-series presented a significant negative drop in mean in 2003 and a positive one in 2008 (Figure 6A). Nitrogen load significantly increased between 1945 and 2014 (Z = 4.17, p < 0.001, slope = 1.37 t year−1). The time-series presented a significant positive drop in mean in 1972 (Figure 6B). Conversely, phosphate load did not show any significant trend, but an increase in the mean value in 1972 and a significant decrease in 1988 (Figure 6C). Neither the NAO showed any significant trend, but two negative shifts in 1962 and 2009 and a positive shift between the two in 1972 (Figure 6D). SST significantly increased in the period of study (Z = 3.56, p < 0.001, slope = −0.01°C year−1) and showed two positive shifts in mean in 1998 and 2011 (Figure 6E). Finally, also fishing capacity significantly increased (Z = 9.46, p < 0.001, slope = 89.88 GT year−1) without any significant shift in the mean (Figure 6F).
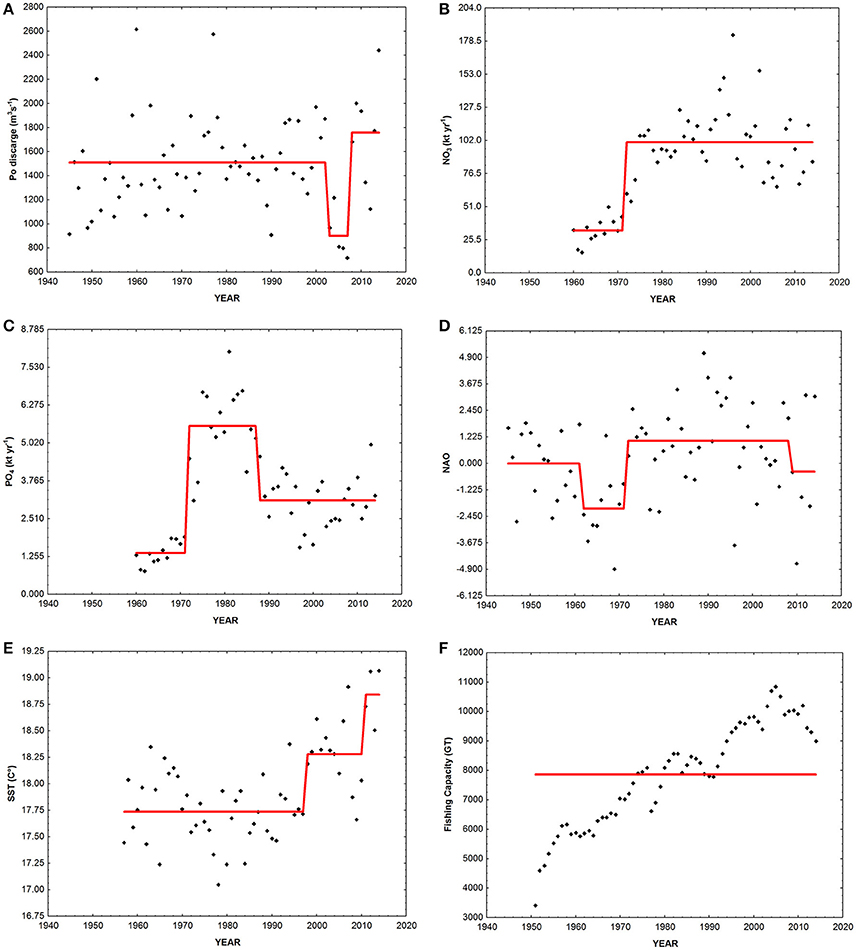
Figure 6. Time-series of drivers of ecosystem change. Black diamonds, data; red line, regime shift. (A) Po discharge, mean annual Po river freshwater discharge; (B) NO3, annual nitrogen flux from the Po river; (C) PO4, annual phosporus flux from the Po river; (D) NAO, North Atlantic Oscillation index; (E) SST, sea surface temperature; (F) GT, total gross tonnage of vessels of the Chioggia's fishing fleet.
Discussion
Six periods with significantly different community structure were identified through cluster analysis of the landings composition by functional group. The most abundant group was small pelagics (mainly European anchovy Engraulis encrasicolus and European pilchard Sardina pilchardus) in all periods, followed by cephalopods in almost all periods. Major changes in community composition between periods include skate and rays and medium pelagics decline, and bivalves dome-shaped trajectory.
The increase of bivalves' proportion in the landings from 2% in 1955–1961, to 5 and 8% in the following periods, is probably linked to the introduction in the mid-1950s of the “rapido” trawl, and successively in the 1970s of the hydraulic dredge, that substantially improved fishing efficiency. However, the proportion of this functional group in the landings decreased to 3% in 1994–2008, and further decreased to 2% in 2009–2014. This sharp decrease is related to the collapse of the Mediterranean scallop (Pecten jacobaeus) in the late 1990s (data not shown) due to overfishing. In fact, between the 1960s and the 1990s, the species showed large fluctuations determined both by the intensity of fishing effort and by mass mortalities due to hypoxic conditions that occurred episodically over wide areas of the Northern Adriatic Sea (Hall-Spencer et al., 1999). A previous study (Maurizio and Castagnolo, 1986) showed that after a 6-month period of fishing, commercially sized P. jacobaeus catches collapsed by 83%, indicating the high vulnerability of the species to unsustainable exploitation, and the need for the institution of selected areas closed to trawling (Hall-Spencer et al., 1999).
Moreover, a suite of ecological indicators applied to time-series of landings provided the basis for gaining useful insights on possible causes of long-term changes. The use of multiple metrics allowed to obtain a picture of how the ecosystem has changed over the past 70 years, since different metrics emphasize distinct aspects of the underlying communities, and consequently allow disentangling the role of different drivers.
Early Changes: The Decline in Size of Fished Communities
LSI, E/B ratio, and mTL showed a significant decrease between 1945 and 2014. Among the range of ecological indicators analyzed in this paper, these are directly (LSI) and indirectly (E/B ratio and mTL) related to size. Since fishing is usually size-selective, both within and among species (Jennings, 2005), these indicators are considered to be sensitive to fishing disturbance and are expected to decrease under unsustainable exploitation.
It is worth noting that LSI does not take into account the actual size-distribution of exploited populations (that requires the availability of information of the size of caught individuals), but it is based on the Lmax of species (see Table 1). Thus, the LSI changes are attributable to changes in composition of populations rather than species' size composition. Therefore, the LSI differs substantially from the Large Fish Indicator (LFI, Greenstreet et al., 2011), but it may be useful for management purposes since it requires less detailed data than LFI for highlighting effects of fishing, and can be applied also to long-term landings data series where the size structure of catches is most often not known.
The negative trend for these indicators highlights a shift toward smaller species in the community, or anyway a decrease of proportion of larger fish. Larger fish (which usually have high trophic levels) are more vulnerable to fishing and have less capacity to sustain great rates of mortality (Dulvy and Reynolds, 2002; Jennings, 2005; Myers and Worm, 2005). This phenomenon could be further exacerbated by the possible increase of small species due to the “predation release” as their predators are depleted (Bruno and O'Connor, 2005; Jennings, 2005; Myers et al., 2007).
Therefore, fishing seems to have had significant detrimental effects on the fish community composition since the first years of the time-series. Indeed in mid-1950s, the first rearrangement of the fish community structure occurred, as emerged from the cluster analysis, with a shift from large-sized high trophic level species to small planktivorous ones. Consequently, a significant negative decrease of mTL, LSI, and E/B ratio was observed.
The decline of elasmobranchs and large-sized species started even before the 1950s in the area (i.e., in the nineteenth century; Fortibuoni et al., 2010; Raicevich and Fortibuoni, 2013), but was exacerbated afterwards probably as a consequence of the industrialization of fishery and the introduction of new highly impacting fishing gears (Ferretti et al., 2013; Barausse et al., 2014). Especially linked to the decrease of skates and rays (Barausse et al., 2014; Engelhard et al., 2015), the E/B ratio decline indicates the important role of elasmobranchs as sensitive key species for detecting early signals of fisheries disturbances (Baum et al., 2003).
However, the early collapse of large-sized species is not only a consequence of the decline of elasmobranchs. In the mid-1950s medium pelagic species reached a maximum in landings (1449 kg in 1956), and dramatically declined afterwards. Medium pelagics (mainly the Atlantic mackerel Scomber scombrus) represent an important group of species for the local fish market, whose decline is hardly a consequence of changes in market demand (Meneghesso et al., 2013). Thus, it can be assumed quite conservatively that the decline in catches for medium pelagics reflects a dramatic decline of populations at sea.
Overall, the decline in mTL, E/B ratio and LSI clearly highlight that there has been a long-term fishing-down food web phenomenon (sensu Pauly et al., 1998).
Signals of Structural Changes
The Q-90 index significantly declined between 1945 and 2014, with a significant negative median-shift in the mid-1980s, indicating a reduction in the biodiversity of landings with increasing fishing impact. The change in biodiversity of landings is concurrent to the significant decrease of total landings and LPUC, suggesting that main modification of marine communities affected local fisheries production.
In the mid-1980s, regime shifts are reported for different ecosystem components in many areas, the Mediterranean Sea, the North Sea, the Baltic Sea, and the Black Sea, possibly suggesting regional effects of a larger scale northern hemispheric pattern (Conversi et al., 2010). Barausse et al. (2011) reported that a similar shift occurred also in the Northern Adriatic fish community, including also medium-high trophic level species belonging to both the demersal and pelagic habitats. Our analysis, however, while confirming the existence of the shift, do not support the hypothesis that climatic drivers played a major effect on it, and rather point to the impact of local pressures, i.e., overexploitation and nutrient loads.
Such structural changes may have altered food-web structure and impaired its functioning and resilience. Coll et al. (2008) compared North-Central Adriatic Sea food-web structure between the 1970s and 1990s, and reported a high food-web degradation regarding overexploitation of higher trophic levels and a simplification of food-web structure (lower omnivory and higher generality). Thus, it is not surprising that LPUC showed a downwards significant shift in 1986, reaching its minimum value in 2002. Only in 2014, the index recovered to values comparable to the very beginning of the time-series, when fishing technologies were markedly less developed and efficient.
Changes in the Trophic State
The significant positive trend over time in the P/D index found in the present study may depend both from eutrophication and overexploitation of resources (Libralato et al., 2004). Indeed, eutrophication and overfishing may have similar and synergistic effects on fish communities, i.e., a decline in diversity, an initial increase in productivity of benthic/demersal and pelagic food webs, then the progressive dominance of the production system by short-lived, especially pelagic species (Caddy, 1993). However, the P/D ratio in the present case seems to point out the importance of eutrophication driven events.
Pelagic fishes are generally influenced by nutrient enrichment when it stimulates the plankton production (Caddy, 1993), while demersal fishes are influenced by the dynamics of benthic community, which generally responds negatively to the conditions of excessive enrichment as shown by de Leiva Moreno et al. (2000). These authors found a mean value of P/D equal to 3.76 in the Adriatic for the historical series 1978–1988. In the present study, the P/D index had a wide dynamic trajectory, ranging between 0.31 and 4.12 with a mean value of 1.81 (± 0.84), thus confirming the Adriatic as a mesotrophic ecosystem (de Leiva Moreno et al., 2000). The index reached some peaks that can be partly related to severe anoxic/hypoxic events. For instance, anoxias in bottom waters linked to eutrophication occurred in the periods 1955–1956 and 1972–1982 (Sangiorgi and Donders, 2004), when the P/D index reached a value of ~2. Finally, the P/D index showed an increasing trend in recent years (significant upward median-shift in 2009), probably linked to a partial recovery of small pelagic species, mainly European anchovy (Carpi et al., 2015).
PPR showed a significant positive median-shift in the mid-1950s. In the mid-1980s, PPR collapsed, mainly driven by the strong reduction of small pelagic landings. As regards anchovy, its population started declining since the late-1970s, and the reasons of this abrupt reduction have been previously ascribed to climate forcing (Santojanni et al., 2006), modified inflow of Mediterranean waters in the Adriatic Sea and associated salinity changes (Grbec et al., 2002), over-fishing, increased predation of eggs and larvae by the jellyfish Pelagia noctiluca and the presence of mucilage events (Regner, 1996). PPR further significantly decreased in the last period 2009–2014.
It is worth noting that during the 1970s an increase of eutrophication occurred in the basin, lasting until the mid-1980s (Giani et al., 2012). Although nitrogen loads increased up to the mid-1970s and then maintained approximately the same values up to now (Figure 6B), phosphate peaked in the mid-1980s (Figure 6C), and its following marked decline may have resulted in limiting production. In 1985, to reduce the negative effects of cultural eutrophication (e.g., anoxia events), the nutrient load delivered to the Adriatic Sea was reduced, mainly by changing the chemical composition of soap powders (banning phosphorous from the mixture) and by improving the treatment of urban sewage and farm litter products (Decree-law No. 667 of November 25th 1985—Urgent measures to limit the eutrophication of waters).
A significant decrease of phytoplankton abundance was also observed after the 1980s, along with changes in its species composition with a shift toward smaller organisms. Such changes modified also zooplankton community (Kamburska and Fonda-Umani, 2009). This trend was a consequence of a reduction of phosphorous load, being the Northern Adriatic waters phosphorous-limited (Solidoro et al., 2009), and a decline of atmospheric precipitation and the runoff in the basin (Giani et al., 2012).
Signals of Climatic Changes
MTC significantly increased between 1945 and 2014 at a decadal rate of 0.5°C, with three significant positive median-shifts in the mid-1950s, in the early-1960s, and in the mid-1990s. A significant negative median-shift was instead observed in the last period (2009–2014), even if the median value (15.8°C) was still much higher than at the one observed at the beginning of the time-series (1945–1954: 13.2°C). Thus, overall an increasing dominance in catches of warm affinity species occurred in the landings of Chioggia, coherently with the pattern observed in other Mediterranean areas (Cheung et al., 2013; Tsikliras and Stergiou, 2014; Fortibuoni et al., 2015; Tsikliras et al., 2015). Also SST significantly increased between 1957 and 2014, with a positive shift in mean in 1998. However, SST resulted not to be one of the main ecological drivers in driving community changes in the Northern Adriatic Sea, and results from this study do not allow establishing a relationship between MTC, SST in the area and NAO.
Integrating in a Coherent Framework the Community Changes
Long-term changes in the Northern Adriatic fish community resulted to be mainly related to the impacts of fisheries and nutrient dynamics, while climate had a secondary role up to now. A coherent dynamic is obtained by scaling the PPR to N:P ratio (NO3/PO4) to account for the changes in the limiting factor (Solidoro et al., 2009), and comparing it with the fishing capacity through time (Figure 7).
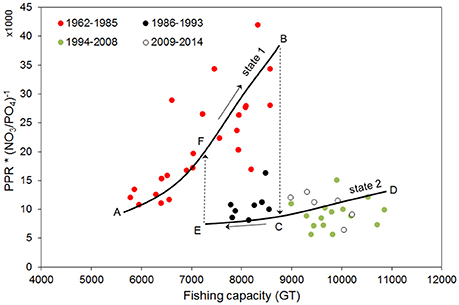
Figure 7. Dynamics of fisheries production under changes of fishing capacity and nutrient limitation from 1960 to 2014. PPR is scaled to N:P ratio to take into account changes in the nutrient limiting factor. Solid lines represent subjective indication of average main trajectories identifiable as two alternative states of the system (state 1: line A–B; state 2: C–D–E). The mid-1980s shift is coherent with a catastrophic shift between two alternative stable states (dashed arrow from B to C) and the presence of hysteretic behavior. For going back from the actual state (state 2, lower solid line) to a state prior to the catastrophic event of mid-1980s (state 1, upper solid line) it is necessary to considerably reduce fishing capacity (left dashed line E–F, placed subjectively).
The PPR to N:P ratio increased up to the mid-1980s, showing that the exploitation development was supported by nutrient enrichment. In the mid-1980s there was an abrupt collapse after which, even for large changes in fishing capacity, PPR to N:P ratio attained much lower values (Figure 7). Notably, the mid-1980s shift is coherent with a shift between two alternative stable states, as described in Scheffer and Carpenter (2003): from the first state (line A–B in Figure 7), to a second state (line C–D–E in Figure 7). Therefore, in the mid-1980s a shift between two alternative stable states of the system likely occurred in the Northern Adriatic Sea, which is reflected also in a change in the community structure (see chronological clustering; Figure 2). The shift to a new community composition and the lower trophic potential (see previous sections) thus resulted in a much lower productive capacity (here represented by PPR to N:P ratio), even for the high fishing effort exerted in the last decades of the time series (Figure 6F). Importantly, to induce a switch back to the original state, it is not sufficient to restore the conditions present before the collapse (Scheffer and Carpenter, 2003): Figure 7 shows the hysteresis (B–C–E–F) typical to alternative stable points of complex systems. From the actual situation (state 2), to reach the same PPR to N:P ratio observed before its collapse (state 1), a relevant reduction of fishing capacity is necessary (see the hypothetical line E–F).
Although from our data it is not possible to estimate the reduction in fishing capacity necessary to switch back from state 2 to state 1, Figure 7 highlights that a reduction in fishing capacity to values lower than the ones that characterized the 1980s would be necessary, together with an intervention on nutrient loads. This result points to the fact that the current critical situation of fisheries is not solely the result of mismanagement of the fisheries sector, but is due also to other environmental policies, in particular those relative to water quality. Thus, actual management needs to account for the fact that the ecosystem is now in a different state (state 2), and the reversal of the shift of the mid-1980s implies changes in fishing capacity and nutrient balance that go far beyond those of the period of the shift.
Overcoming Limitations in the Use of Landings for Ecological Analyses
This work gives support to the possibility of using landings statistics for inferring changes in marine ecosystems through the analysis of landings composition and the application of a set of ecological indicators. Despite the intrinsic limitations of fishery-dependent data (Essington et al., 2006; Hilborn, 2007), the analysis reported here highlights that opportune indicators can produce interesting and useful assessments from landings, especially if combined with local knowledge on fisheries changes. In particular, the capability to understand relationship between landings composition to community at sea is more robust when local disaggregated landings result from multi-target and multi-gear fisheries (i.e., several distinct métiers), and when changes in fishing activities (e.g., introduction of new technologies, shift from one fishing gear to another, number and tonnage of boats) are traceable.
Being aware of the poor capabilities of landings absolute quantities to assess single species abundances (Pauly et al., 2013), we used landings composition (percentage proportion of functional groups in total landings) to detect community changes. Moreover, the use of data lumped into functional groups allowed overcoming problems of changes in aggregation detail in landings statistics.
The potential is great given that landings data are the most widespread information that can be used to analyse marine ecosystem changes in the past, and probably the cheapest information that can be collected by surveying archives and statistical bulletins and that can be used also in data poor conditions.
Conclusions
The analysis of landings from the fish market of Chioggia allowed inferring information on long-term changes in the Northern Adriatic ecosystem. Most vulnerable species (i.e., elasmobranchs and large-sized species) considerably declined at the beginning of the industrialization of fishery and continued to decline in the following decades, probably because the exploitation rates were not sustainable. Indeed, fishing capacity increased enormously during the 1960s and 1970s, i.e., larger boats, higher tonnage and engine horsepower, improved fishing gears, use of high-technology equipment (Fortibuoni, 2010). Until the mid-1980s total landings continuously increased, possibly as a consequence of the modernization of fishing fleets and of the growing cultural eutrophication. However, while landings were still increasing, the LPUC was already declining.
Later, the nutrient load (in terms of phosphorus) delivered to the Adriatic Sea decreased, thus leading to a combination of high exploitation and reduced productivity, which may well-explain the collapse in landings in the following years. Indeed, from our analysis resulted that phosphorous load (a proxy of primary production) and fishing capacity (a proxy of fishing effort) were the main drivers of change among the considered explanatory variables. Conversely, climate relate variables had a smaller impact.
It is likely that long-term effects of fishing drove significant changes in fish community structure in the Northern Adriatic Sea that were partially masked or balanced by an increase in productivity in the period of high nutrient discharge. Once productivity declined, the food-web structure was already modified and probably the resilience of the system was unpaired. The ecosystem was in a “fishing status” (sensu Jennings and Kaiser, 1998), thus reducing its recoverability from environmental driven imbalance. As regards the role played by fishing, it is expected that over time the enhanced skipper skills, adoption of auxiliary equipment and more efficient gear and materials, replacement of old vessels by new ones and upgraded engines (Damalas et al., 2014; Engelhard, 2016), resulted in an increased catching efficiency. However, since no reliable information was available for the area we did not consider the effect of the technological creep, keeping our results rather conservative with respect to fishing impacts.
This study shows that the Northern Adriatic ecosystem and ecological drivers has dramatically changed in the last decades, and thus greater knowledge of past states is crucial to set appropriate baselines for current management. Indeed, the actual crisis faced by the Northern Adriatic Sea fishery sector may be ascribed both to long-term over-exploitation and changes in nutrient load. This evidence should be considered in fishery management, for instance by rescaling the fishing capacity according to the present status of environmental parameters (e.g., trophic conditions related to nutrient discharges). Since fisheries management in Italy (as in the whole Mediterranean) is predominantly capacity/effort-based, accounting for changes in these parameters is decisive. However, because of technological creep, measuring nominal capacity and effort in conventional terms (e.g., GT, KW, days at sea) may produce estimates far from the effective fishing mortality exerted by the fleet (Damalas et al., 2014). All this may partly explain why in Italian waters the positive impact on resources expected from fishing capacity/effort reduction was lower than expected (Cataudella and Spagnolo, 2011). Thus, research on fishing power change and fine-scale analysis of fishing effort through time are highly recommended in order to understand real changes in the capacity of fishing fleets, and their potential to exploit fish stocks (Engelhard, 2016). Moreover, the results might provide evidence on the need for considering broadly the ecosystems impacts of human interventions and management actions, since actual critical state of the fisheries have been exacerbated by regulations on water quality.
Author Contributions
SL, SR, and TF conceived the study. SL, CS, and TF defined the hypotheses and methodologies. TF, SL, and CS analyzed and discussed the results with input from SR, FP, and OG. All authors were involved in reviewing and editing the manuscript, and approved it for publication.
Funding
The authors acknowledge partial support from EU FP 7 project PERSEUS (Policy-oriented Marine Environmental Research for the Southern European Seas, http://www.perseus-net.eu/) and the Italian RITMARE Flagship Project—The Italian Research for the Sea (http://www.ritmare.it) coordinated by the Italian National Research Council and funded by the Italian Ministry of Education, University and Research within the National Research Program 2011–2013.
Conflict of Interest Statement
The authors declare that the research was conducted in the absence of any commercial or financial relationships that could be construed as a potential conflict of interest.
Acknowledgments
We acknowledge Paolo Lazzari (National Institute of Oceanography and Experimental Geophysics, Italy), Virna Meccia (Max Planck Institute for Meteorology, Germany), Cristina Mazziotti and Giovanna Pirretti (Regional Environmental Protection Agency, Italy) for helping us with the collection of ecosystem drivers data (nutrients load, climatic data, Po river discharge), and Carlotta Mazzoldi (University of Padua, Italy) for providing us landings data. This study was benefited from discussions with colleagues of the ICES Working Group on the History of Fish and Fisheries. This article is based upon work from COST Action IS1403, Oceans Past Platform (OPP), supported by COST (European Cooperation in Science and Technology).
References
AdriaMed (2004). AdriaMed Seminar on Fishing Capacity: Definition, Measurement and Assessment. AdriaMed Technical Documents, FAO-MiPAF Scientific Cooperation to Support Responsible Fisheries in the Adriatic Sea, Termoli, p. 119. GCP/RER/010/ITA/TD-13.
Ainsworth, C. H., and Pitcher, T. J. (2006). Modifying Kempton's species diversity index for use with ecosystem simulation models. Ecol. Ind. 6, 623–630. doi: 10.1016/j.ecolind.2005.08.024
Baeta, F., Costa, M. J., and Cabral, H. (2009). Changes in the trophic level of Portuguese landings and fish market price variation in the last decades. Fish. Res. 97, 216–222. doi: 10.1016/j.fishres.2009.02.006
Barausse, A., Correale, V., Curkovic, A., Finotto, L., Riginella, E., Visentin, E., et al. (2014). The role of fisheries and the environment in driving the decline of elasmobranchs in the northern Adriatic Sea. ICES J. Mar. Sci. 71, 1593–1603. doi: 10.1093/icesjms/fst222
Barausse, A., Michieli, A., Riginella, E., Palmeri, L., and Mazzoldi, C. (2011). Long-term changes in community composition and life-history traits in a highly exploited basin (Northern Adriatic Sea): the role of environment and anthropogenic pressures. J. Fish Biol. 79, 1453–1486. doi: 10.1111/j.1095-8649.2011.03139.x
Baum, J. K., Myers, R. A., Kehler, D. G., Worm, B., Harley, S. J., and Doherty, P. A. (2003). Collapse and conservation of shark populations in the Northwest Atlantic. Science 299, 389–392. doi: 10.1126/science.1079777
Botter, L., Giovanardi, O., and Raicevich, S. (2006). The migration of Chioggia's fishing fleet in the Adriatic from the mid-nineteenth to the early twentieth centuries. J. Mediterr. Stud. 16, 27–44.
Bruno, J. F., and O'Connor, M. I. (2005). Cascading effects of predator diversity and omnivory in a marine food web. Ecol. Lett. 8, 1048–1056. doi: 10.1111/j.1461-0248.2005.00808.x
Caddy, J. F. (1993). Toward a comparative evaluation of human impacts on fishery ecosystems of enclosed and semi-enclosed seas. Rev. Fish. Sci. 1, 57–95. doi: 10.1080/10641269309388535
Carpi, P., Santojanni, A., Donato, F., Colella, S., Keč, Č. V., Zorica, B., et al. (2015). A joint stock assessment for the anchovy stock of the northern and central Adriatic Sea: comparison of two catch-at-age models. Sci. Mar. 79, 57–70. doi: 10.3989/scimar.03903.29A
Cataudella, S., and Spagnolo, M. (2011). The State of Italian Marine Fisheries and Aquaculture. Rome: Ministero delle Politiche Agricole Alimentari e Forestali.
Cheung, W. L., Watson, R., and Pauly, D. (2013). Signature of ocean warming in global fisheries catch. Nature 497, 365–369. doi: 10.1038/nature12156
Cingolani, N., Giannetti, G., and Arneri, E. (1996). Anchovy fisheries in the Adriatic sea. Sci. Mar. 60, 269–277.
Clarke, K. R., Somerfield, P. I., and Gorley, R. N. (2008). Testing of null hypotheses in exploratory community analyses: similarity profiles and biota-environment linkage. J. Exp. Mar. Biol. Ecol. 366, 56–69. doi: 10.1016/j.jembe.2008.07.009
Clodia database (2015). Database of Fishery Data from Chioggia, Northern Adriatic Sea. Available online at: http://chioggia.scienze.unipd.it/Database_landing.html
Coll, M., Lotze, H. K., and Romanuk, T. N. (2008). Structural degradation in Mediterranean sea food webs: testing ecological hypotheses using stochastic and mass-balance modelling. Ecosystems 11, 939–960. doi: 10.1007/s10021-008-9171-y
Coll, M., Shannon, L. J., Kleisner, K. M., Juan-Jordá, M. J., Bundy, A., Akoglu, A. G., et al. (2016). Ecological indicators to capture the effects of fishing on biodiversity and conservation status of marine ecosystems. Ecol. Ind. 60, 947–962. doi: 10.1016/j.ecolind.2015.08.048
Conversi, A., Fonda Umani, S., Peluso, T., Molinero, J. C., Santojanni, A., and Edwards, M. (2010). The Mediterranean sea regime shift at the end of the 1980s, and intriguing parallelisms with other european basins. PLoS ONE 5:e10633. doi: 10.1371/journal.pone.0010633
Damalas, D., Maravelias, C. D., and Kavadas, S. (2014). Advances in fishing power: a study spanning 50 years. Rev. Fish. Sci. Aquacult. 22, 112–121. doi: 10.1080/10641262.2013.839620
de Leiva Moreno, J. I., Agostini, V. N., Caddy, J. F., and Carocci, F. (2000). Is the pelagic-demersal ratio from fishery landings a useful proxy for nutrient availability? A preliminary data exploration for the semi-enclosed seas around Europe. ICES J. Mar. Sci. 57, 1091–1102. doi: 10.1006/jmsc.2000.0705
Dulvy, N. K., and Reynolds, J. D. (2002). Predicting extinction vulnerability in skates. Conserv. Biol. 16, 440–450. doi: 10.1046/j.1523-1739.2002.00416.x
Engelhard, G. H. (2016). “On the need to study fishing power change: challenges and perspectives,” in Perspectives on Oceans Past, eds K. S. Máñez and B. Poulsen (Dordrecht: Springer Publishers Netherlands), 89–101.
Engelhard, G. H., Thurstan, R. H., MacKenzie, B. R., Alleway, H. K., Bannister, R. C. A., Cardinale, M., et al. (2015). ICES meets marine historical ecology: placing the history of fish and fisheries in current policy context. ICES J. Mar. Sci. 73, 1386–1403. doi: 10.1093/icesjms/fsv219
Essington, T. E., Beaudreau, A. H., and Wiedenmann, J. (2006). Fishing through marine food webs. Proc. Natl. Acad. Sci. U.S.A. 103, 3171–3175. doi: 10.1073/pnas.0510964103
Ferretti, F., Osio, G. C., Jenkins, C. J., Rosenberg, A. A., and Lotze, H. K. (2013). Long-term change in a meso-predator community in response to prolonged and heterogeneous human impact. Sci. Rep. 3:1057. doi: 10.1038/srep01057
Fortibuoni, T. (2010). La Pesca in Alto Adriatico dalla Caduta Della Serenissima ad oggi: un'Analisi Storica ed Ecologica. Ph.D. thesis, University of Trieste, Trieste.
Fortibuoni, T., Aldighieri, F., Giovanardi, O., Pranovi, F., and Zucchetta, M. (2015). Climate impact on Italian fisheries (Mediterranean Sea). Reg. Environ. Change 15, 931–937. doi: 10.1007/s10113-015-0781-6
Fortibuoni, T., Borme, D., Franceschini, G., Giovanardi, O., and Raicevich, S. (2016). Common, rare or extirpated? Shifting baselines for common angelshark, Squatina squatina (Elasmobranchii: Squatinidae), in the Northern Adriatic Sea (Mediterranean Sea). Hydrobiologia 772, 247–259. doi: 10.1007/s10750-016-2671-4
Fortibuoni, T., Libralato, S., Raicevich, S., Giovanardi, O., and Solidoro, C. (2010). Coding early naturalists' accounts into long-term fish community changes in the Adriatic Sea (1800–2000). PLoS ONE 5:e15502. doi: 10.1371/journal.pone.0015502
Fortibuoni, T., Noventa, S., Rampazzo, F., Gion, C., Formalewicz, M., Berto, D., et al. (2013). Evidence of butyltin biomagnification along the northern Adriatic food-web (Mediterranean Sea) elucidated by stable isotope ratios. Environ. Sci. Technol. 47, 3370–3377. doi: 10.1021/es304875b
Froese, R., and Pauly, D. (2016). FishBase. World Wide Web Electronic Publication. Available online at: www.fishbase.org
Fu, C., Large, S., Knight, B., Richardson, A. J., Bundy, A., Reygondeau, G., et al. (2015). Relationships among fisheries exploitation, environmental conditions, and ecological indicators across a series of marine ecosystems. J. Mar. Syst. 148, 101–111. doi: 10.1016/j.jmarsys.2015.01.004
Giani, M., Djakovac, T., Degobbis, D., Cozzi, S., Solidoro, C., and Fonda Umani, S. (2012). Recent changes in the marine ecosystems of the northern Adriatic Sea. Estuar. Coast. Shelf S. 115, 1–13. doi: 10.1016/j.ecss.2012.08.023
Grbec, B., Dulcic, J., and Morovi, M. (2002). Long-term changes in landings of small pelagic fish in the eastern Adriatic—possible influence of climate oscillations over the Northern Hemisphere. Clim. Res. 20, 241–252. doi: 10.3354/cr020241
Greenstreet, S. P. R., Rogers, S. I., Rice, J. C., Piet, G. J., Guirey, E. J., Fraser, H. M., et al. (2011). Development of the EcoQO for fish communities in the North Sea. ICES J. Mar. Sci. 68, 1–11. doi: 10.1093/icesjms/fsq156
Hall-Spencer, J. M., Froglia, C., Atkinson, R. J. A., and Moore, P. G. (1999). The impact of Rapido trawling for scallops, Pecten jacobaeus (L.), on the benthos of the Gulf of Venice. ICES J. Mar. Sci. 56, 111–124. doi: 10.1006/jmsc.1998.0424
Hammer, Ø., Harper, D. A. T., and Ryan, P. D. (2001). PAST: Paleontological Statistics Software package for education and data analysis. Palaeontol. Electron. 4, 1–9.
Hilborn, R. (2007). Reinterpreting the state of fisheries and their management. Ecosystems 10, 1362–1369. doi: 10.1007/s10021-007-9100-5
Hopkins, T. S., Artegiani, A., Kinder, C., and Pariante, R. (1999). “A discussion of the northern Adriatic circulation and flushing as determined from the ELNA hydrography,” in The Adriatic Sea. Ecosystem Research Report 32, eds T. S. Hopkins, A. Artegiani, G. Cauwet, D. Degobbis, and A. Malej (Brussels: European Commission), 85–106.
Hurrell, J. (2016). The Climate Data Guide: Hurrell North Atlantic Oscillation (NAO) Index (Station-Based). Available online at: https://climatedataguide.ucar.edu/climate-data/hurrell-north-atlantic-oscillation-nao-index-station-based
Jackson, J. B. C., Kirby, M. X., Berger, W. H., Bjorndal, K. A., Botsford, L. W., Bourque, B. J., et al. (2001). Historical overfishing and the recent collapse of coastal ecosystems. Science 293, 629–637. doi: 10.1126/science.1059199
Jennings, S. (2005). Indicators to support an ecosystem approach to fisheries. Fish Fish. 6, 212–232. doi: 10.1111/j.1467-2979.2005.00189.x
Jennings, S., and Kaiser, M. J. (1998). The effects of fishing on marine ecosystems. Adv. Mar. Biol. 34, 201–352. doi: 10.1016/S0065-2881(08)60212-6
Kaiser, M. J., Ramsay, K., Richardson, C. A., Spence, F. E., and Brand, A. R. (2000). Chronic fishing disturbance has changed shelf sea benthic community structure. J. Anim. Ecol. 69, 494–503. doi: 10.1046/j.1365-2656.2000.00412.x
Kamburska, L., and Fonda-Umani, S. (2009). From seasonal to decadal inter-annual variability of mesozooplankton biomass in the northern Adriatic Sea (Gulf of Trieste). J. Mar. Syst. 78, 490–504. doi: 10.1016/j.jmarsys.2008.12.007
Kempton, R. A., and Taylor, L. R. (1976). Models and statistics for species diversity. Nature 262, 818–820. doi: 10.1038/262818a0
Kleisner, K., Zeller, D., Froese, R., and Pauly, D. (2013). Using global catch data for inferences on the world's marine fisheries. Fish Fish. 14, 293–311. doi: 10.1111/j.1467-2979.2012.00469.x
Libralato, S., Pranovi, F., Raicevich, S., Da Ponte, F., Giovanardi, O., Pastres, R., et al. (2004). Ecological stages of the Venice Lagoon analysed using landing time series data. J. Mar. Syst. 51, 331–344. doi: 10.1016/j.jmarsys.2004.05.020
Lotze, H. K., Coll, M., and Dunne, J. A. (2011). Historical changes in marine resources, food-web structure and ecosystem functioning in the Adriatic Sea, Mediterranean. Ecosystems 14, 198–222. doi: 10.1007/s10021-010-9404-8
Lotze, H. K., Lenihan, H. S., Bourque, B. J., Bradbury, R. H., Cooke, R. G., Kay, M. C., et al. (2006). Depletion, degradation, and recovery potential of estuaries and coastal seas. Science 312, 1806–1808. doi: 10.1126/science.1128035
Ludwig, W., Dumonta, E., Meybeck, M., and Heussner, S. (2009). River discharges of water and nutrients to the Mediterranean and Black Sea: major drivers for ecosystem changes during past and future decades? Prog. Oceanogr. 80, 199–217. doi: 10.1016/j.pocean.2009.02.001
Maurizio, C., and Castagnolo, L. (1986). Variazioni di taglia in un banco commerciale di Pecten jacobaeus L. e Chlamys opercularis L. al largo di Chioggia. Un anno di studi. Nova Thalassia 8, 635–640.
Mazzoldi, C., Sambo, A., and Riginella, E. (2014). The Clodia database: a long time series of fishery data from the Adriatic Sea. Sci. Data. 1:140018. doi: 10.1038/sdata.2014.18
Meneghesso, C., Riginella, E., La Mesa, M., Donato, F., and Mazzoldi, C. (2013). Life-history traits and population decline of the Atlantic mackerel Scomber scombrus in the Adriatic Sea. J. Fish Biol. 83, 1249–1267. doi: 10.1111/jfb.12223
Mion, M., Piras, C., Fortibuoni, T., Celić, I., Franceschini, G., Giovanardi, O., et al. (2015). Collection and validation of self-sampled e-logbook data in a Mediterranean demersal trawl fishery. Reg. Stud. Mar. Sci. 2, 76–86. doi: 10.1016/j.rsma.2015.08.009
Mozetič, P., Solidoro, C., Cossarini, G., Socal, G., Precali, R., Francé, J., et al. (2009). Recent trends towards oligotrophication of the Northern Adriatic: evidence from chlorophyll a time series. Estuar. Coasts 33, 362–375. doi: 10.1007/s12237-009-9191-7
Munyandorero, J., and Guenter, C. B. (2010). A six-decade portrait of florida marine fisheries via landings-based trophodynamic indicators. N. Am. J. Fish. Manage. 30, 259–280. doi: 10.1577/M08-202.1
Myers, R. A., Baum, J. K., Shepherd, T. D., Powers, S. P., and Peterson, C. H. (2007). Cascading effects of the loss of apex predatory sharks from a coastal ocean. Science 315, 1846–1850. doi: 10.1126/science.1138657
Myers, R. A., and Worm, B. (2005). Extinction, survival or recovery of large predatory fishes. Philos. Trans. R. Soc. B 360, 13–20. doi: 10.1098/rstb.2004.1573
Palomares, M. L. D., and Pauly, D. (2016). SeaLifeBase. World Wide Web Electronic Publication. Available online at: http://www.sealifebase.org
Pauly, D. (1995). Anecdotes and the shifting baseline syndrome of fisheries. Trends Ecol. Evol. 10:430. doi: 10.1016/S0169-5347(00)89171-5
Pauly, D., and Christensen, V. (1995). Primary production required to sustain global fisheries. Nature 374, 255–257. doi: 10.1038/374255a0
Pauly, D., Christensen, V., Dalsgaard, J., Froese, R., and Torres, F. Jr. (1998). Fishing down marine food webs. Science 279, 860–863. doi: 10.1126/science.279.5352.860
Pauly, D., Hilborn, R., and Branch, T. (2013). Fisheries: does catch reflect abundance? Nature 494, 303–306. doi: 10.1038/494303a
Pauly, D., and Watson, R. (2005). Background and interpretation of the ‘Marine Trophic Index’ as a measure of biodiversity. Philos. Trans. R. Soc. B 360, 415–423. doi: 10.1098/rstb.2004.1597
Piet, G., and Pranovi, F. (2005). A Review of the Indicators for Ecosystem Structure and Functioning. Project No. 513754. INDECO - Development of Indicators of Environmental Performance of the Common Fisheries Policy.
Pinnegar, J. K., Jennings, S., O'Brien, C. M., and Polunin, N. V. C. (2002). Long-term changes in the trophic level of the Celtic Sea fish community and fish market price distribution. J. Appl. Ecol. 39, 377–390. doi: 10.1046/j.1365-2664.2002.00723.x
Piroddi, C., Gristina, M., Zylich, K., Greer, K., Ulman, A., Zeller, D., et al. (2015). Reconstruction of Italy's marine fisheries removals and fishing capacity, 1950–2010. Fish. Res. 172, 137–147. doi: 10.1016/j.fishres.2015.06.028
Pranovi, F., Raicevich, S., Franceschini, G., Torricelli, P., and Giovanardi, O. (2001). Discard analysis and damage to non-target species in the “rapido” trawl fishery. Mar. Biol. 139, 863–875. doi: 10.1007/s002270100646
Raicevich, S., and Fortibuoni, T. (2013). “Assessing neoextirpations in the Adriatic Sea: an historical ecology approach” in Marine Extinctions - Patterns and Processes, ed F. Briand (Monaco: CIESM Publisher), 97–111.
Regner, S. (1996). Effects of environmental changes on early stages and reproduction of anchovy in the Adriatic Sea. Sci. Mar. 60, 167–177.
Rodionov, S. N. (2004). A sequential algorithm for testing climate regime shifts. Geophys. Res. Lett. 31, L09204. doi: 10.1029/2004GL019448
Rodionov, S. N. (2006). Use of prewhitening in climate regime shift detection. Geophys. Res. Lett. 33, L12707. doi: 10.1029/2006GL025904
Romanelli, M., Cordisco, C. A., and Giovanardi, O. (2009). The long-term decline of the Chamelea gallina L. (Bivalvia: Veneridae) clam fishery in the Adriatic Sea: is a synthesis possible? Acta Adriat. 50, 171–205.
Rosenberg, A. A., Bolster, W. J., Alexander, K. E., Leavenworth, W. B., Cooper, A. B., and McKenzie, M. G. (2005). The history of ocean resources: modeling cod biomass using historical records. Front. Ecol. Environ. 3, 84–90. doi: 10.2307/3868514
Russo, A., Rabitti, S., and Bastianini, M. (2002). Decadal climatic anomalies in the Northern Adriatic Sea inferred from a new oceanographic data set. Mar. Ecol. 23, 340–351. doi: 10.1111/j.1439-0485.2002.tb00032.x
Sàenz-Arroyo, A., Roberts, C. M., Torre, J., Carino-Olvera, M., and Enriquez-Andrade, R. R. (2005). Rapidly shifting environmental baselines among fishers of the Gulf of California. Proc. R. Soc. Lond. B Bio. 272, 1957–1962. doi: 10.1098/rspb.2005.3175
Salmi, T., Määttä, A., Anttila, P., Ruoho-Airola, T., and Amnell, T. (2002). Detecting Trends of Annual Values of Atmospheric Pollutants by the Mann-Kendall Test and Sen's Slope Estimates: the Excel Template Application MAKESENS. Publications of Air Quality.
Sangiorgi, F., and Donders, T. H. (2004). Reconstructing 150 years of eutrophication in the north-western Adriatic Sea (Italy) using dinoflagellate cysts, pollen and spores. Estuar. Coast. Shelf S. 60, 69–79. doi: 10.1016/j.ecss.2003.12.001
Santojanni, A., Arneri, E., Bernardini, V., Cingolani, N., Di Marco, M., and Russo, A. (2006). Effects of environmental variables on recruitment of anchovy in the Adriatic Sea. Clim. Res. 31, 181–193. doi: 10.3354/cr031181
Scheffer, M., and Carpenter, S. R. (2003). Catastrophic regime shifts in ecosystems: linking theory to observation. Trends Ecol. Evol. 18, 648–656. doi: 10.1016/j.tree.2003.09.002
Shephard, S., Fung, T., Houle, J. E., Farnsworth, K. D., Reid, D. G., and Rossberg, A. G. (2012). Size-selective fishing drives species composition in the Celtic Sea. ICES J. Mar. Sci. 69, 223–234. doi: 10.1093/icesjms/fsr200
Shin, Y.-J., Bundy, A., Shannon, L. J., Simier, M., Coll, M., Fulton, E. A., et al. (2010). Can simple be useful and reliable? Using ecological indicators to represent and compare the states of marine ecosystems. ICES J. Mar. Sci. 67, 717–731. doi: 10.1093/icesjms/fsp287
Solidoro, C., Bastianini, M., Bandelj, V., Codermatz, R., Cossarini, G., Melaku Canu, D., et al. (2009). Current state, scales of variability, and trends of biogeochemical properties in the northern Adriatic Sea. J. Geophys. Res. 114, C07S91. doi: 10.1029/2008JC004838
Stergiou, K. I., and Karpouzi, V. S. (2002). Feeding habits and trophic levels of Mediterranean fish. Rev. Fish Biol. Fish. 11, 217–254. doi: 10.1023/A:1020556722822
Swartz, W., Sala, E., Tracey, S., Watson, R., and Pauly, D. (2010). The spatial expansion and ecological footprint of fisheries (1950 to Present). PLoS ONE 5:e15143. doi: 10.1371/journal.pone.0015143
Tsikliras, A. C., Peristeraki, P., Tserpes, G., and Stergiou, K. I. (2015). Mean temperature of the catch (MTC) in the Greek Seas based on landings and survey data. Front. Mar. Sci 2:23. doi: 10.3389/fmars.2015.00023
Tsikliras, A. C., and Stergiou, K. I. (2014). Mean temperature of the catch increases quickly in the Mediterranean Sea. Mar. Ecol. Prog. Ser. 515, 281–284. doi: 10.3354/meps11005
Van Beveren, E., Fromentin, J.-M., Rouyer, T., Bonhommeau, S., Brosset, P., and Saraux, C. (2016). The fisheries history of small pelagics in the Northern Mediterranean. ICES J. Mar. Sci. 73, 1474–1484. doi: 10.1093/icesjms/fsw023
Keywords: landings, marine historical ecology, ecological indicators, long-term changes, ecosystem drivers, Adriatic Sea
Citation: Fortibuoni T, Giovanardi O, Pranovi F, Raicevich S, Solidoro C and Libralato S (2017) Analysis of Long-Term Changes in a Mediterranean Marine Ecosystem Based on Fishery Landings. Front. Mar. Sci. 4:33. doi: 10.3389/fmars.2017.00033
Received: 10 November 2016; Accepted: 27 January 2017;
Published: 13 February 2017.
Edited by:
Maria Lourdes D. Palomares, FishBase Information and Research Group, PhilippinesReviewed by:
Valeria Mamouridis, Institut de Ciències del Mar (CSIC), SpainDimitrios K. Moutopoulos, Technological Educational Institute of Messolonghi, Greece
Copyright © 2017 Fortibuoni, Giovanardi, Pranovi, Raicevich, Solidoro and Libralato. This is an open-access article distributed under the terms of the Creative Commons Attribution License (CC BY). The use, distribution or reproduction in other forums is permitted, provided the original author(s) or licensor are credited and that the original publication in this journal is cited, in accordance with accepted academic practice. No use, distribution or reproduction is permitted which does not comply with these terms.
*Correspondence: Tomaso Fortibuoni, tfortibuoni@inogs.it