Water Masses Variability in Inner Kongsfjorden (Svalbard) During 2010–2020
 Francesco De Rovere1,2
  Leonardo Langone2
  Katrin Schroeder3
  Stefano Miserocchi2
  Federico Giglio2
  Stefano Aliani4
  Jacopo Chiggiato3*
- 1Department of Environmental Sciences, Informatics and Statistics, Università Ca’ Foscari di Venezia, Venice, Italy
- 2Consiglio Nazionale delle Ricerche, Istituto di Scienze Polari, Bologna, Italy
- 3Consiglio Nazionale delle Ricerche, Istituto di Scienze Marine, Venice, Italy
- 4Consiglio Nazionale delle Ricerche, Istituto di Scienze Marine, Lerici, Italy
Kongsfjorden is an Arctic fjord located in the Svalbard archipelago. Its hydrography is influenced by the warm and saline Atlantic Water (AW) in the West Spitsbergen Current and the cold and fresh Polar Water circulating on the shelf. We assess the so-called atlantification of Kongsfjorden in the 2010–2020 decade by inspecting modifications in water properties and water masses variability through moored data and summer CTD surveys. Atlantification in this fjord has emerged as an increasing temperature and salinity, resulting from enhanced advection of Atlantic waters from the West Spitsbergen Current. The water column in inner Kongsfjorden warmed by 0.13°C/yr at 35 m and 0.06°C/yr at 85 m depth from 2010 to 2020, while salinity increased by 0.3 PSU. Depth-averaged temperatures have increased by 0.26°C/yr in the warmest months of the year, whereas they appear relatively stable in the coldest months. Both temperature and salinity present a linear regression change point in January 2017, with latter years featuring decreasing values. Highly diluted AW is found at the beginning of the decade, which give way to more and more pure AW in latter years, culminating in extensive intrusions in 2016 and 2017 determining the warmest and saltiest conditions over the decade in inner Kongsfjorden. Observations in the 2010–2020 decade confirm that Kongsfjorden has transitioned to an Atlantic-type fjord, featuring depleted sea ice conditions and rather regular shallow intrusions of AW in summer and frequently also in winter. Although single intrusions of AW are associated with dynamical events on the shelf, we found that the long-term temperature evolution in the inner Kongsfjord is consistent with the meridional temperature transport of the West Spitsbergen Current. The AW current flowing northward from lower latitudes along the western Svalbard archipelago thus has profoundly driven local conditions in the inner fjord in this decade.
Introduction
Since the mid-1980s, Arctic surface air temperature has been warming at a pace almost twice as fast as the global mean, a phenomenon named Arctic Amplification (Andersen et al., 2020). Over the past few decades, the increased ocean heat content and the reduced sea-ice volumes in the Arctic (Mayer et al., 2019) are probably resulting from an enhanced heat transport from the Atlantic Ocean since mid-1990s (Tsubouchi et al., 2021). Focusing on the European Arctic, marine ecosystems are experiencing an “atlantification” process, i.e., the advance of the typical Atlantic oceanic regime toward higher latitudes (Polyakov et al., 2017), especially in the Barents Sea (Årthun et al., 2012; Lind et al., 2018), with a consequent increase in the surface heat and salinity content, a weaker halocline and an enhanced sea-ice loss. Understanding the future evolution of the Arctic requires knowledge about the influence of the Atlantic water masses on high-latitudes as well as on their interactions with Arctic waters.
This study assesses the atlantification of inner Kongsfjorden (Svalbard) in the 2010–2020 decade by analysing continuous temperature and salinity observations gathered by the Mooring Dirigibile Italia (MDI) managed by the Italian National Research Council (CNR). The Svalbard archipelago is positioned at the eastern edge of the Fram Strait. Figure 1A reports a map of the main island, i.e., Spitsbergen, along with main Atlantic and Arctic currents. The Western Svalbard hydrography is primarily influenced by the warm and saline Atlantic Water (AW) and the fresh and cold Arctic Water (ArW). AW is transported northward in the upper 800 m of the West Spitsbergen Current (WSC). The WSC flows on the continental slope of West Spitsbergen and is a major source of AW to the Arctic (Polyakov et al., 2005). The cold and fresh ArW reaches the southern end of the archipelago from the Barents Sea and flow clockwise on the shallowest layers of the West Spitsbergen Shelf (WSS) transported by the Spitsbergen Polar Current (SPC) (Helland-Hansen and Nansen, 1909). The WSS is thus a peculiar area where the mixing between Atlantic, Arctic and glacial waters takes place (Saloranta and Svendsen, 2001). Water masses mixing and interactions with West Spitsbergen fjords ultimately cool and fresh the WSC before it flows into the Arctic basin (Saloranta and Haugan, 2004). The map of inner Kongsfjorden is shown in Figure 1B. The fjord is connected with WSC waters through Kongsfjordrenna, a 300 m deep trough along the WSS, extending from the shelf break to the fjord mouth. Several tidewater glaciers influence Kongsfjorden dynamics: Kongsvegen, Kronebreen, Kongsbreen, Conwaybreen, and Blomstrandbreen (Tverberg et al., 2019), the first three terminating a few kilometres away from MDI. Svendsen et al. (2002) first defined water masses in Kongsfjorden and described their seasonal variability. Fjord waters cool in autumn and winter due to heat loss to the atmosphere, triggering convective processes and producing Local Water (LW). LW has low temperatures (<1°C) and spans a wide salinity range reflecting their variable origin, i.e., in the outer basin or close to glaciers’ front. Winter Cooled Water (WCW) is a cold (< −0.5°C) and saline (>34.4) water resulting from sea-ice production and brine rejection. WCW usually sinks toward bottom depressions and remnants can be found also in summer. The onset of the spring season produces a low-density surface layer via sea-ice melting, solar heating and freshwater input from glaciers and rivers, increasing vertical stability. This water is classified as Surface Water (SW), characterised by low salinities (<34) and variable temperatures (>1°C). SW tends to flow out of the fjord and is compensated by an inflow of AW and ArW. This mixture can be composed of “pure” AW, fresher Transformed Atlantic Water (TAW), Cooled Atlantic Water (CAW) or transitional Intermediate Water (IW). Different mechanisms contribute to AW intrusions into Kongsfjorden. AW is moved onto the WSS and toward Western Svalbard fjords by wind-driven cross-shelf exchanges (Goszczko et al., 2018), as upwelling events (Cottier et al., 2007), coastally trapped waves (Inall et al., 2015) and geostrophic advection of WSC waters (Nilsen et al., 2016). Cottier et al. (2005) suggested that a geostrophic control mechanism (Klinck et al., 1981) generated by a strong lateral density gradient between fjord and outer waters prevents AW on the shelf from entering the fjord in winter. AW is thus often found in summer when the large freshwater input in the fjord weakens the horizontal density gradient. However, intense winds blowing on the shelf can damp the geostrophic control mechanism also in winter, resulting in extensive AW intrusions (Cottier et al., 2007). Accordingly, the most important scales for AW intrusions are seasonal, i.e., the breakdown of the fjord’s geostrophic control, and synoptic, i.e., the occurrence of intense winds on the shelf. Tverberg et al. (2019) proposed that in summer the advection of AW through the Kongsfjordrenna and into Kongsfjorden is influenced by the particular water column’s stratification characterising the preceding winter, distinguished in three different scenarios. In what they call Winter Deep winters, convection extends to the fjord bottom with absent or limited AW advection, leaving dense bottom waters and causing summer AW intrusions to occur at intermediate depth. Winter convection limited to intermediate depths defines Winter Intermediate scenarios, where AW advection is restricted to the deeper part of the water column both in winter and summer. Winter Open winters refer to years with no sea ice formation and AW intrusions at shallow depths. AW is then cooled and transferred toward the bottom through winter convection, inducing summer AW advection to take place at shallow depths. Therefore, the system has its own “memory” on a seasonal scale, which is mediated by autumn/winter air-sea interactions defining the water column’s stratification and the depth of AW advection in the fjord the following summer.
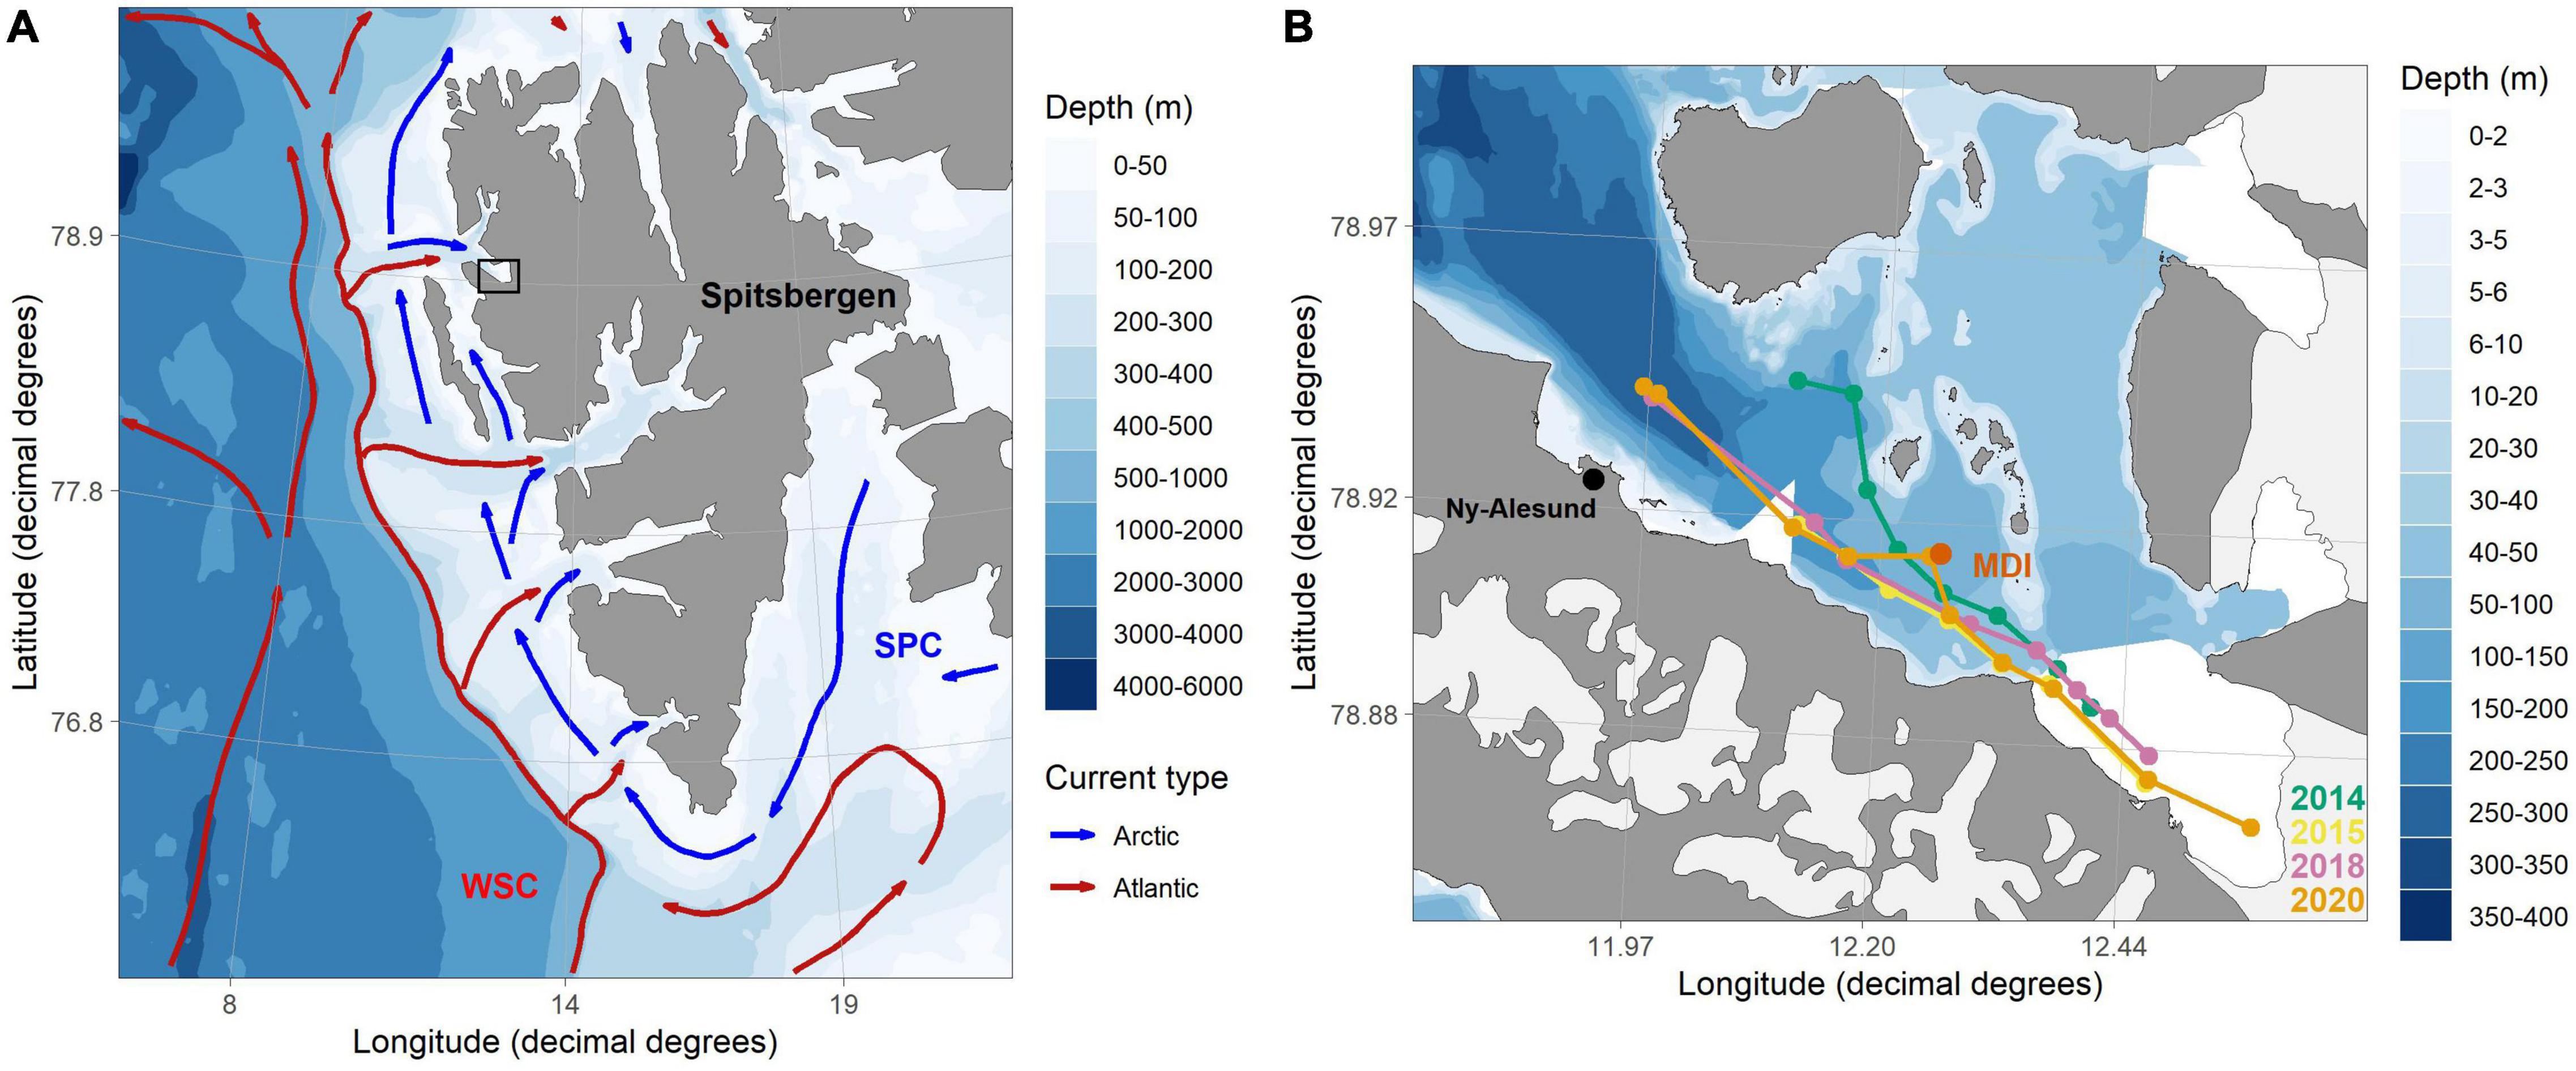
Figure 1. (A) Map and bathymetry of the western Svalbard archipelago with main currents. Red and blue arrows show the main Atlantic and Arctic water currents, respectively. The black rectangle identifies the inner Kongsfjorden area represented in (B).(B) Map and bathymetry of inner Kongsfjorden. The MDI position is indicated by a red dot. Coloured dots and lines identify CTD sections analysed in this study. These maps have been created using the “PlotSvalbard” R Package (Vihtakari, 2020).
Atlantic water in the WSC has warmed in the last century (Pavlov et al., 2013) and more significantly in the latter decades (Onarheim et al., 2014). Furthermore, more frequent and intense AW intrusion events, both in winter and summer, are characterising this fjord in recent years (Tverberg et al., 2019). Kongsfjorden (Tverberg et al., 2019) and nearby Isfjorden (Skogseth et al., 2020) shifted after winter 2006 from being typical Arctic fjords, featuring Winter Deep/Intermediate scenarios with the presence of sea-ice and limited or deep inflow of AW, to a more Atlantic type fjord characterised by Winter Open scenarios, with no sea ice and occasional AW advection in the higher part of the water column. Also changing atmospheric patterns can contribute to atlantification but their actual role has not been assessed yet. The number of intense low-pressure systems passing Svalbard in winter is increasing (Zahn et al., 2018) with potential implications on cross-shelf exchanges. More extreme atmospheric events as the one occurred between December 2015 and January 2016 (Overland and Wang, 2016; Kim et al., 2017) could potentially boost winter AW advection on the WSS. Atlantification and an increasing ocean heat have been observed to play a dominant role on the stability of ecosystem’s structure in the fjord and tidewater glaciers. Vihtakari et al. (2018) found a shift in black-legged kittiwakes’ diet from Arctic prey dominance to a mixed diet with a high contribution of Atlantic species after 2006, marking a shift in the food web. Furthermore, AW is hypothesised to be the main factor controlling spring blooms in the fjord (Hegseth and Tverberg, 2013; Payne and Roesler, 2019). Warm waters have been observed to largely affect frontal ablation rates of Svalbard’s tidewater glaciers, including Kronebreen in Kongsfjorden, through submarine melting (Luckman et al., 2015; Holmes et al., 2019). Accordingly, atlantification of waters in Svalbard fjords is having a great impact on the mass balance of tidewater glaciers.
This study inspects the atlantification of Kongsfjorden in the 2010–2020 decade by investigating continuous temperature and salinity from moored observations. Previous studies investigated water masses variability in Kongsfjorden primarily through summer (and sometimes winter) CTD surveys. To the best of our knowledge, no studies focused on investigating continuous high-resolution thermohaline data to understand the long-term water masses variability in the inner Kongsfjord. Furthermore, a record of AW intrusions from 2016 onward is currently absent. We make use of MDI data to fill these gaps of knowledge. The present study is organised as follows. Data and methods are described in section “Materials and Methods.” Section “Results” reports the results. Here, time series are inspected through linear regression to understand their multi-annual variability at specific depths. Depth-averaged temperatures are calculated to investigate the heat content temporal evolution of the inner Kongsfjord. Temperature and salinity observations are utilised to identify water masses and to delineate their temporal variability. CTD surveys conducted by CNR in the inner Kongsfjord are then compared against MDI time series. Furthermore, CTD sections illustrating spatial water column characteristics are examined. Section “Discussion” discusses observations with a focus on the long-term and intra-seasonal water masses variability as well as on winter scenarios (Tverberg et al., 2019). Furthermore, the local long-term evolution of the water column is put into perspective with the WSC meridional temperature transport. Section “Conclusion” summarises the results of this study into few conclusions.
Materials and Methods
Data
Mooring Dirigibile Italia was installed in September 2010 by CNR and is annually serviced with instrumentation and data recovery, and installation of new batteries. The position of the mooring has been selected through bathymetric and seismic surveys at GPS position 78°55′ N–12°15′ E, approximately at 105 m depth (D’Angelo et al., 2018), in between Kronebreen’s front and the sudden seafloor rise from 300 to 100 m depth. The current MDI configuration is described as follows. Two temperature and salinity sensors (SeaCat SBE16) are currently placed at 27 and 89 m depth. Three temperature recorders (SeaCat SBE56) are stationing at 58, 64, and 97 m depth. Additional devices measuring current velocity, turbidity, dissolved oxygen, total mass, and organic carbon fluxes complete the mooring but data are not used in this study. The oceanographic mooring has been continuously updated through the years. Thus, sensors have different operational periods and their depth has varied. A nominal depth is assigned to each temperature sensor based on their longest operational depth, as follows: 25, 35, 54, 62, 85, and 92 m. Nominal depths are used throughout this study. Figure 2 shows the MDI configuration in September 2020 along with data availability, nominal and actual depths of MDI sensors from 2010 to present.
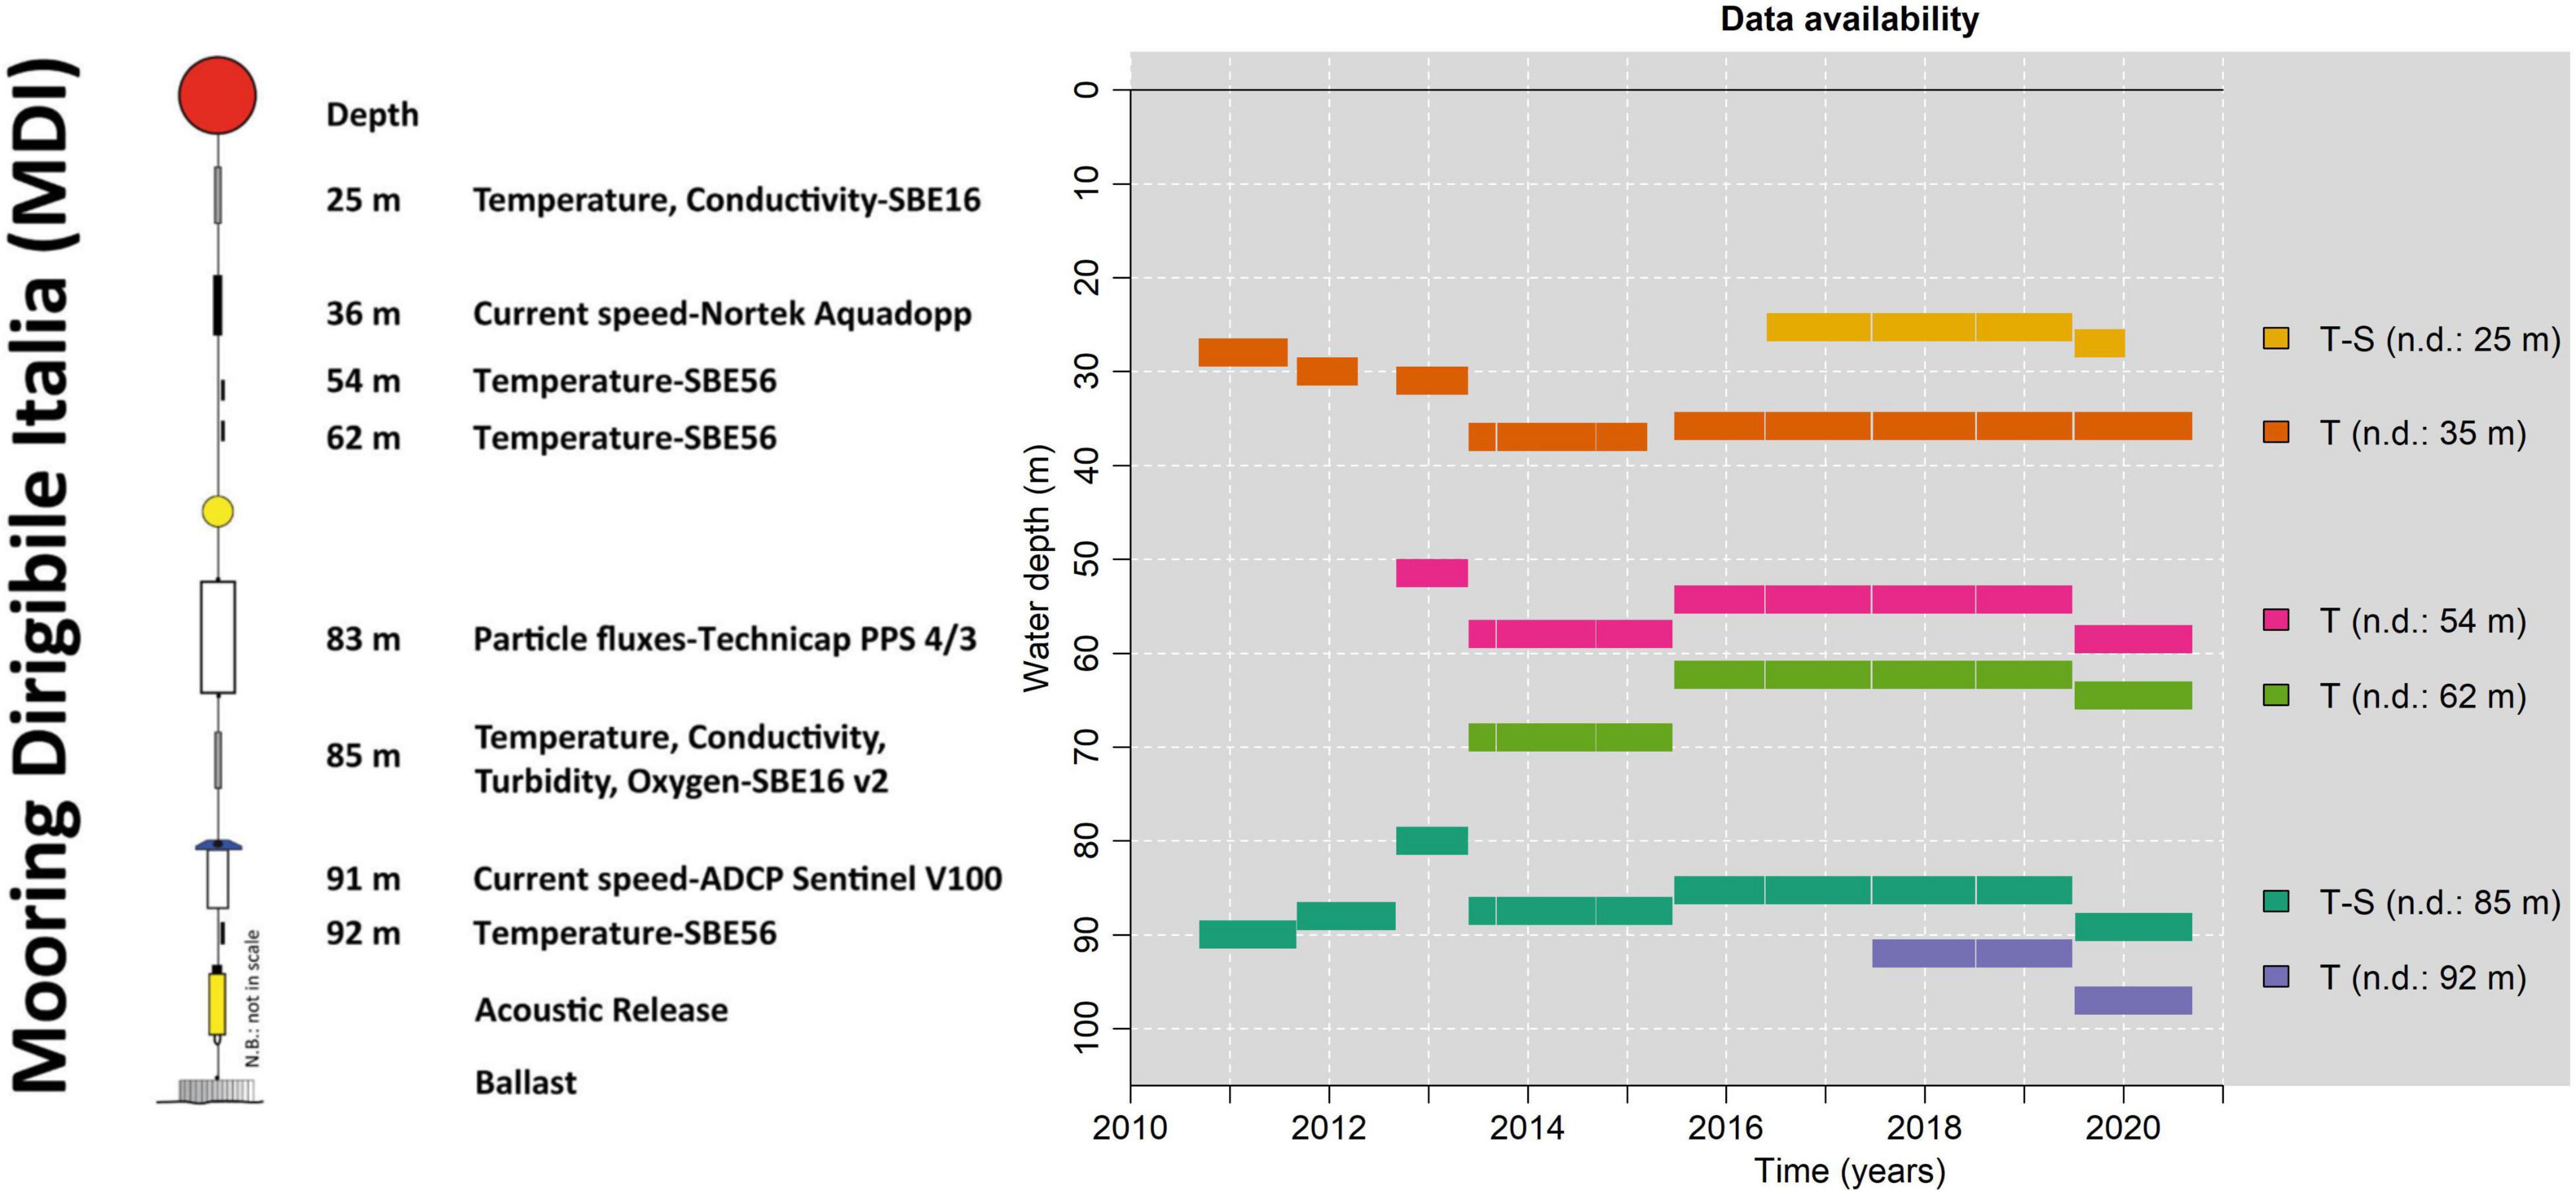
Figure 2. (Left) MDI configuration as deployed in September 2020. (Right) Data availability and depth below the sea level for each instrument utilised in this study from 2010 to 2020. Legend reports the measured parameters, i.e., temperature (T) and salinity (S), along with the nominal depth (n.d.). For a complete description of the mooring the reader is referred to https://www.isp.cnr.it/index.php/en/infrastructures/observation-facilities/moorings.
Raw data were checked to eliminate spikes and inaccurate observations linked to mooring deployment and recovery. Sensors’ temporal resolutions vary between 10, 20, and 30 min. We calculate daily medians of temperature and salinity for each available depth to uniform time series at a suitable temporal resolution for the purpose of this study. The calculation of the median was preferred to benefit from its insensitivity to outliers. Few data gaps are present: observations at 25 m interrupt a few days after the beginning of 2020, and 35 m monitoring failed for a few months in spring and summer 2012 and 2015, due to exhausted batteries. MDI observations are displayed in section “Mooring Data.”
In addition to long-term mooring observational data we make use of conductivity-temperature-depth (CTD) surveys performed in Kongsfjorden, some of which were previously presented in Aliani et al. (2016) and Cantoni et al. (2020). Hydrological surveys were carried out during mooring maintenance every year except in 2011, 2012, and 2019. CTD profiles in the proximity of MDI are averaged into a mean profile and compared with moored observations. In addition, selected profiles are used to depict temperature and salinity sections in inner Kongsfjorden, whose positions are indicated in Figure 1. Only CTD observations obtained during the downcast are averaged at a 1 m resolution to produce the final profiles. Supplementary Tables 1, 2 describe date, position and depths of CTD profiles used in this study. CTD data are displayed in section “Conductivity-Temperature-Depth Data.”
In the main analysis, results are put in perspective with the large-scale oceanic variability through a reanalysis dataset. The WSC meridional temperature transport (H) upstream of Kongsfjorden through a selected transect T1 positioned on the WSS is calculated using the formula:
Where Cp is the specific heat at constant pressure of seawater, v is the northward ocean current velocity, θ is the potential temperature and ρ is the seawater density (Hall and Bryden, 1982). v, θ, and ρ are obtained from daily oceanic reanalyses by the E.U. Copernicus Marine Service Information (Global Monitoring and Forecasting Center, 2018). T1 is set at 78.5 °N and spans from 7 °E to 10 °E longitude and from 50 to 800 m depth, i.e., the extent of the AW layer. At the time this study was conducted, reanalysis data were available until July 2019.
Time-Series Analysis
Temperature and salinity daily medians are inspected through time series plots and least square linear regression to understand multiannual variability at specific depths. The evolution of the water column’s heat content is examined by averaging MDI temperatures observed by the two longest operating sensors, i.e., 35 and 85 m, at a monthly resolution and then during the coldest [March-April-May (MAM)] and warmest [September-October-November (SON)] months of the year. The resulting depth-averaged MAM and SON temperature series are examined through linear regression. Daily median maxima and minima observed in MAM and SON for each year, respectively, are displayed along with corresponding averages. Note that here the warmest and coldest months of the year do not correspond to the definition of summer [July-August-September (JAS)] and winter [January-February-March (JFM)] months. We adopt this particular procedure for the analysis of the water column’s heat content to reproduce the work of Cottier et al. (2019) and to allow a direct comparison between results.
Water masses variability in inner Kongsfjorden is examined through temperature and salinity observations from SBE16 sensors positioned at 25 and 85 m depth. Water properties are classified according to Tverberg et al. (2019) categorisation, established to define water masses in the Kongsfjorden area. We also make use of the CAW category introduced by Sundfjord et al. (2017). Table 1 reports the specific temperature and salinity boundaries for each water mass.
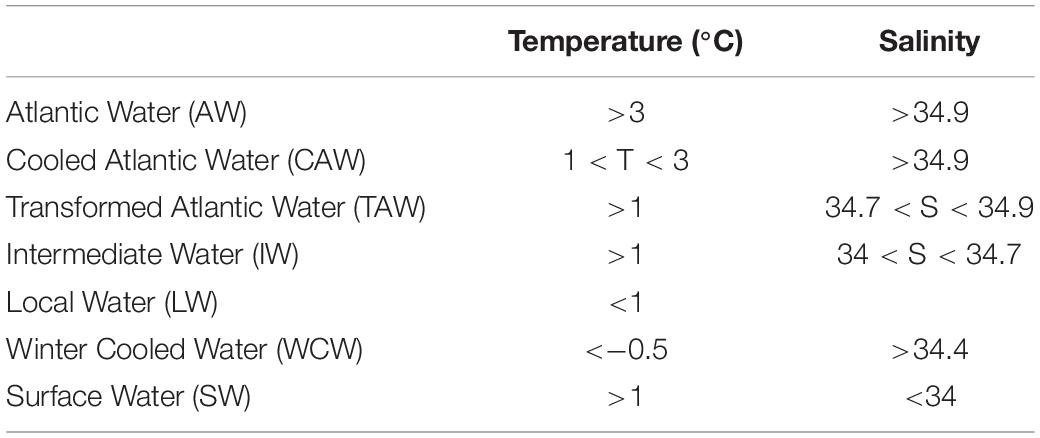
Table 1. Water masses categorisation adapted from Sundfjord et al. (2017) and Tverberg et al. (2019).
Time series are further assessed by a linear regression change point analysis. Segmented regression models are used to inspect whether the relation of the observed variables with time is piecewise linear and to estimate the times at which multiple segments connect together, i.e., the change points. Segmented regression models and associated change points are estimated through the “segmented” R package (Muggeo, 2008).
Results
Mooring Data
Daily median temperature time series are reported in Figure 3.
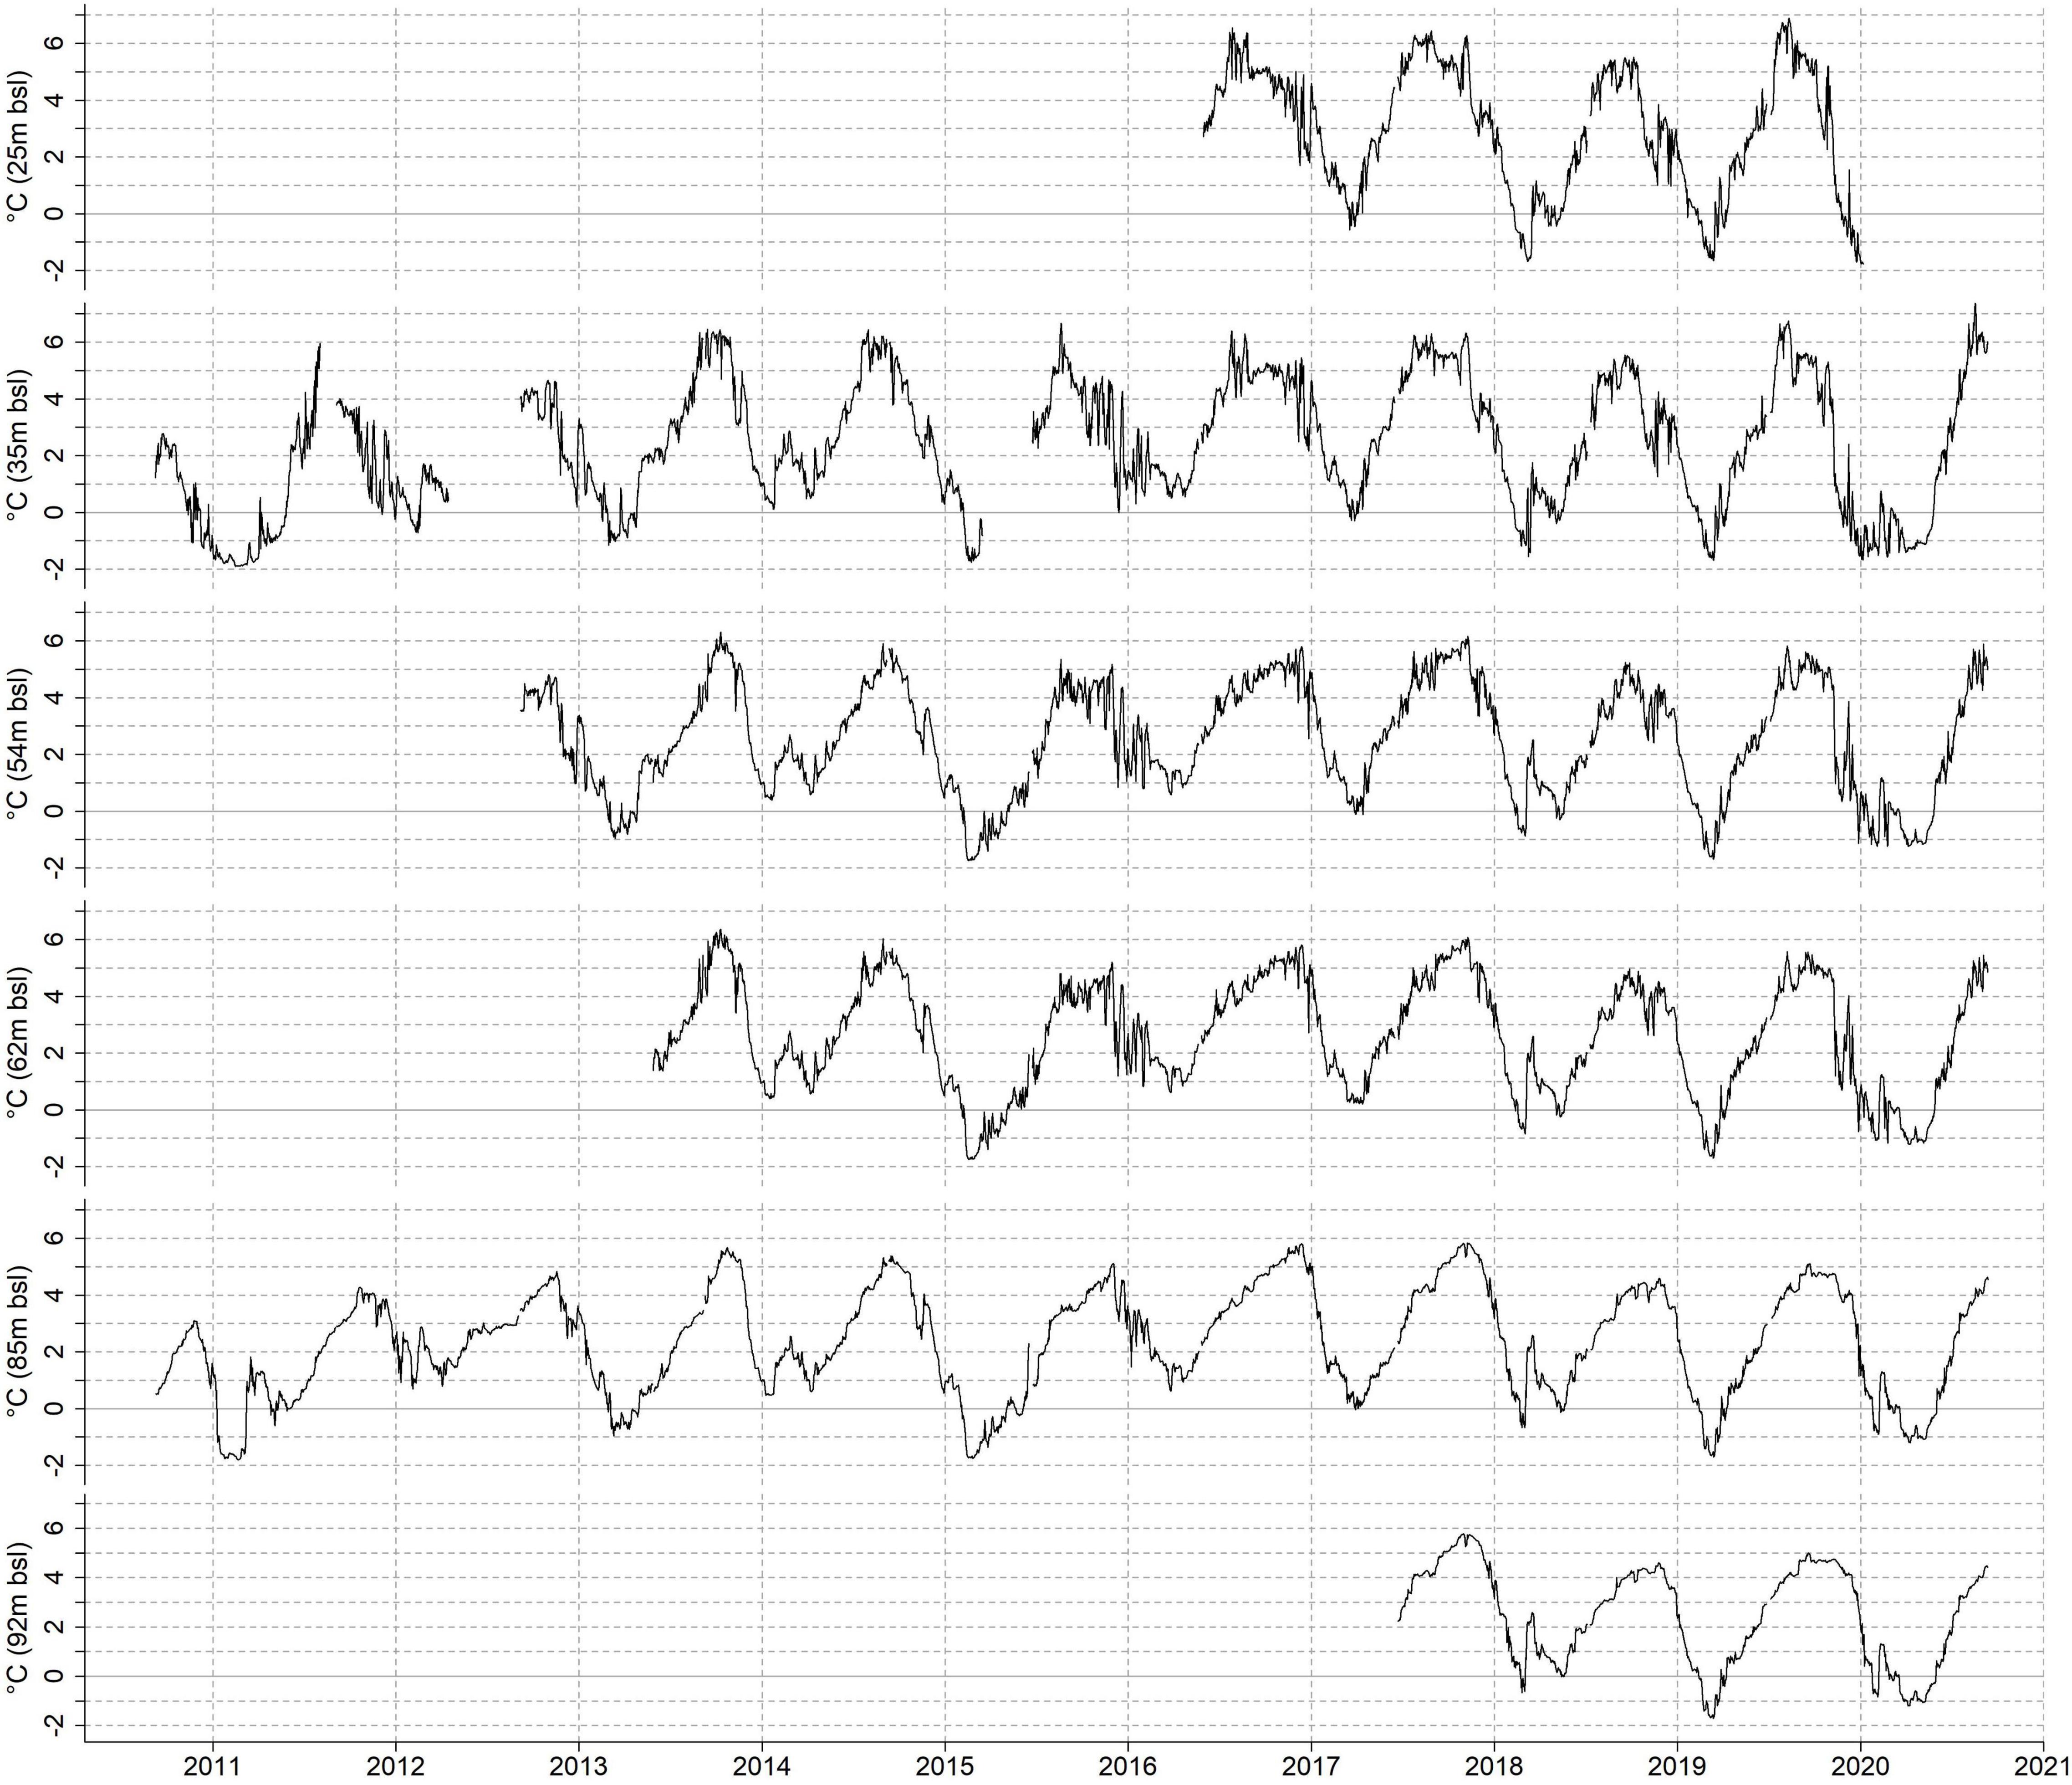
Figure 3. Daily median temperature series observed by MDI sensors at different depths (in m below sea level – bsl).
All temperature series exhibit a clear seasonality, whose amplitude slightly decreases with depth. The average seasonal amplitude ranges between 6.81°C at 35 m and 5.77°C at 85 m. Furthermore, higher frequency variabilities on the order of several days or weeks are less pronounced toward the bottom of the water column at 85 and 92 m depth. It is worth noting the simultaneous occurrence of winter local temperature maxima at all depths in some years, e.g., 2011, 2012, 2014, 2018, and 2020.
We limit the linear regression analysis and further arguments to the three depths with the longest observational period in each layer (35, 54, and 85 m), thus including the two longest MDI series. Temperature series at 35 and 85 m show a considerable warming between 2010 and 2020. In particular, the near surface warms at 0.13°C/yr (p-value < 0.01), almost a double rate compared to the near bottom, i.e., 0.06°C/yr (p-value < 0.01).
Temperatures in warmest months (Figure 4A) are rising at a pace of 0.21°C/yr, but a sudden increase in average temperatures is observed between 2010 and 2013 from 1.5°C to almost 4.5°C, followed by more stable values ranging between 4°C and 5.5°C. Coldest months (Figure 4B) do not exhibit a significant linear temperature change over the considered period. However, temperatures in MAM started decreasing progressively in 2016 and fell from 1.5°C to −0.5°C circa.
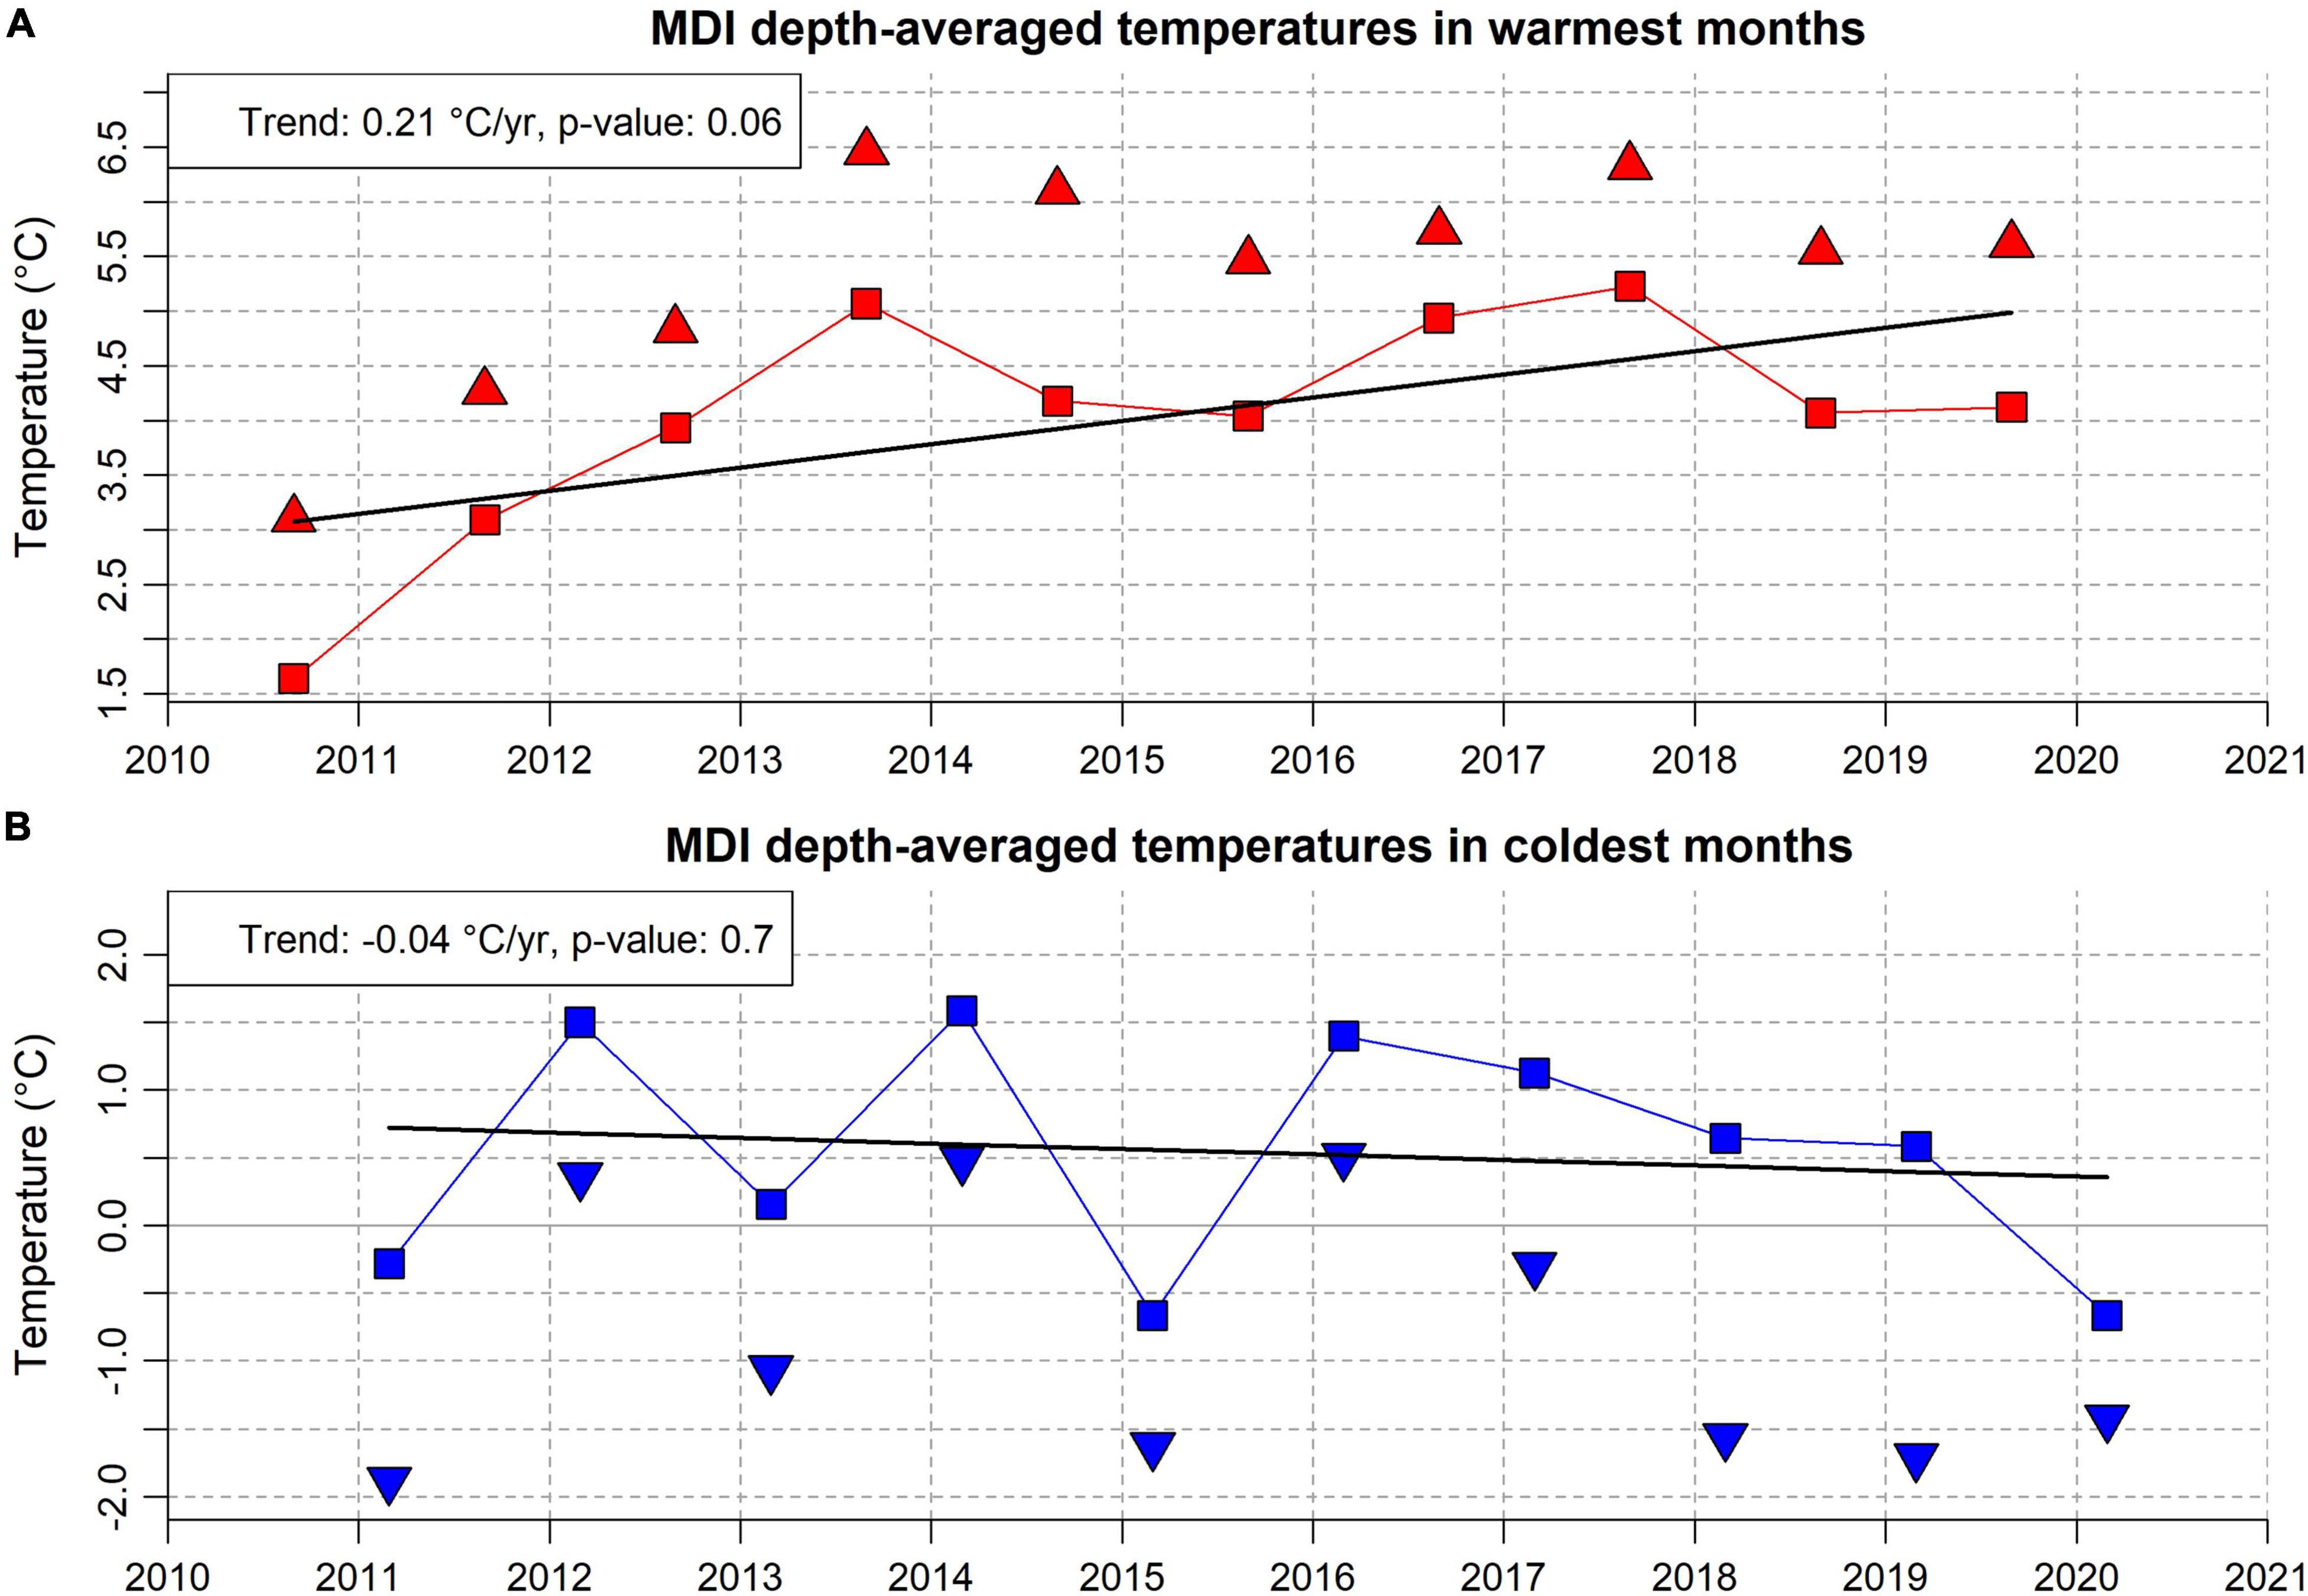
Figure 4. (A) Temperature average (red squares) and maxima (red triangles) over depth observed in the warmest months of the year (SON). (B) Temperature average (blue squares) and minima (blue triangles) over depth observed in the coldest months of the year (MAM). Averages, maxima and minima are calculated using daily temperature medians from the two longest operating sensors positioned at 35 and 85 m. Black lines report linear trends calculated over averages.
Salinity daily medians observed at 25 and 85 m are reported in Figure 5 along with temperature and water masses classification. Salinity at the shallower depth shows a seasonal evolution, featuring lower values in summer-autumn and higher ones in winter-spring. The deeper sensor exhibits a slightly similar seasonal evolution but embedded in a low frequency variation. Indeed, 85 m salinity has grown from 2010 and peaks around 2016–2017, after which it decreases. Over the whole observational period, salinity at 85 m increases at a rate of +0.031/yr. Salinity trends in the common operating period (from May 2016 to September 2020) are consistent between the two depths: −0.071/yr for 25 m and −0.079/yr for 85 m. All coefficients are statistically significant at the 95% confidence level.
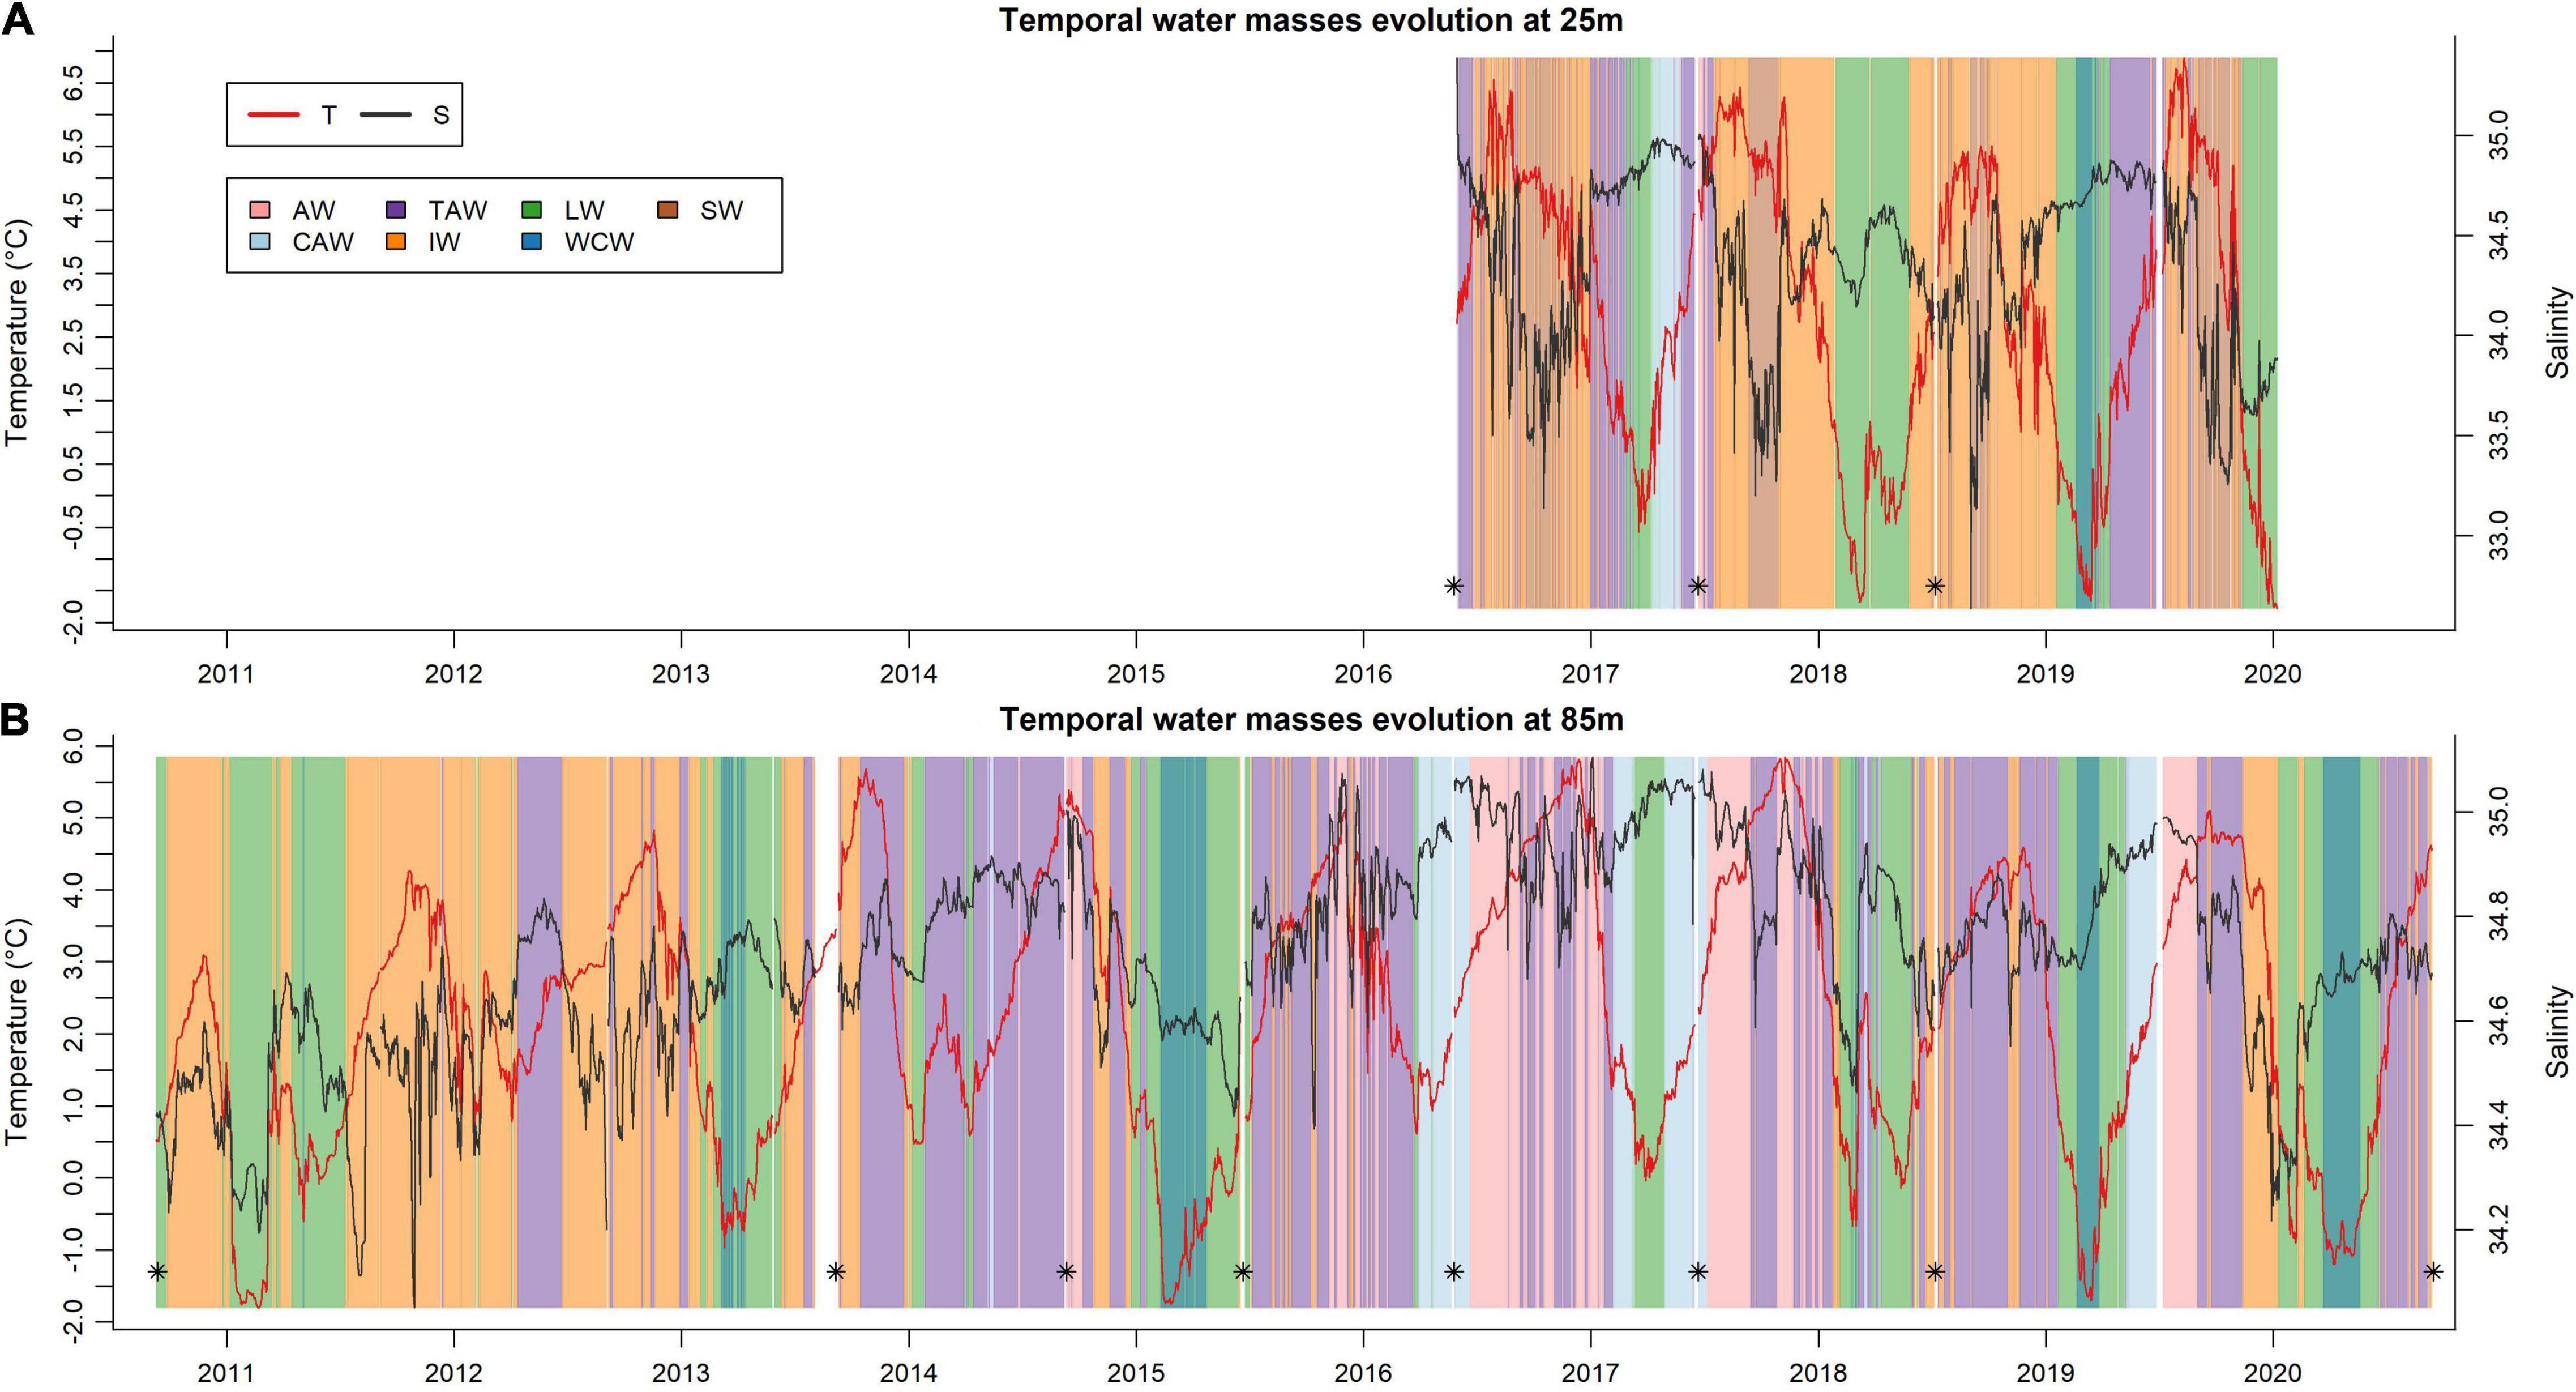
Figure 5. Temperature (red) and salinity (dark grey) daily medians along with water masses observed at 25 m (A) and 85 m (B) depth. Water masses are classified according to Table 1 and highlighted here by different colours (see legend). * indicate timing of CTD surveys carried out by CNR.
Figure 5 displays a distinct water mass seasonal variability at 25 m. IW is the most frequent water mass and is typically observed in summer and autumn months. SW develops for several weeks in between the end of August and November, reflecting a large salinity drop. Waters of Atlantic origin appear only as TAW and CAW while no AW is observed. LW and WCW periods are seen in winter. Multi-year water masses variability is better represented at 85 m depth. Observations reveal the presence of large volumes of highly diluted AW (in the form of IW) at the beginning of the decade, which give way to more and more pure AW, culminating in broad intrusions in 2016 and 2017, even protracting to the following winter. Water of clear Atlantic origin (AW/TAW/CAW) has been seen every year since 2012. However, it becomes present for a large part of the year only from 2014, especially in summer and autumn months. Starting from 2018, AW and TAW are seen in shorter periods while LW and WCW last for the whole winter of 2019 and 2020. The almost concomitant timing of LW and WCW at the two depths in 2017, 2018, and 2019 points to the occurrence of deep convection in inner Kongsfjorden. We assume that the other LW and WCW periods observed at 85 m depth are associated with convective phenomena and a homogenised water column. As discussed in section “Temperature and Salinity Long-Term Evolutions and Water Masses Variability,” the peculiar multi-annual variability identified through 85 m depth observations heavily influences salinity and temperature long-term evolutions in inner Kongsfjorden.
Conductivity-Temperature-Depth Data
CTD data acquired in the proximity of MDI are averaged every year to produce instantaneous representations of the water column properties. Mean temperature and salinity are reported in a T-S diagram in Figure 6.
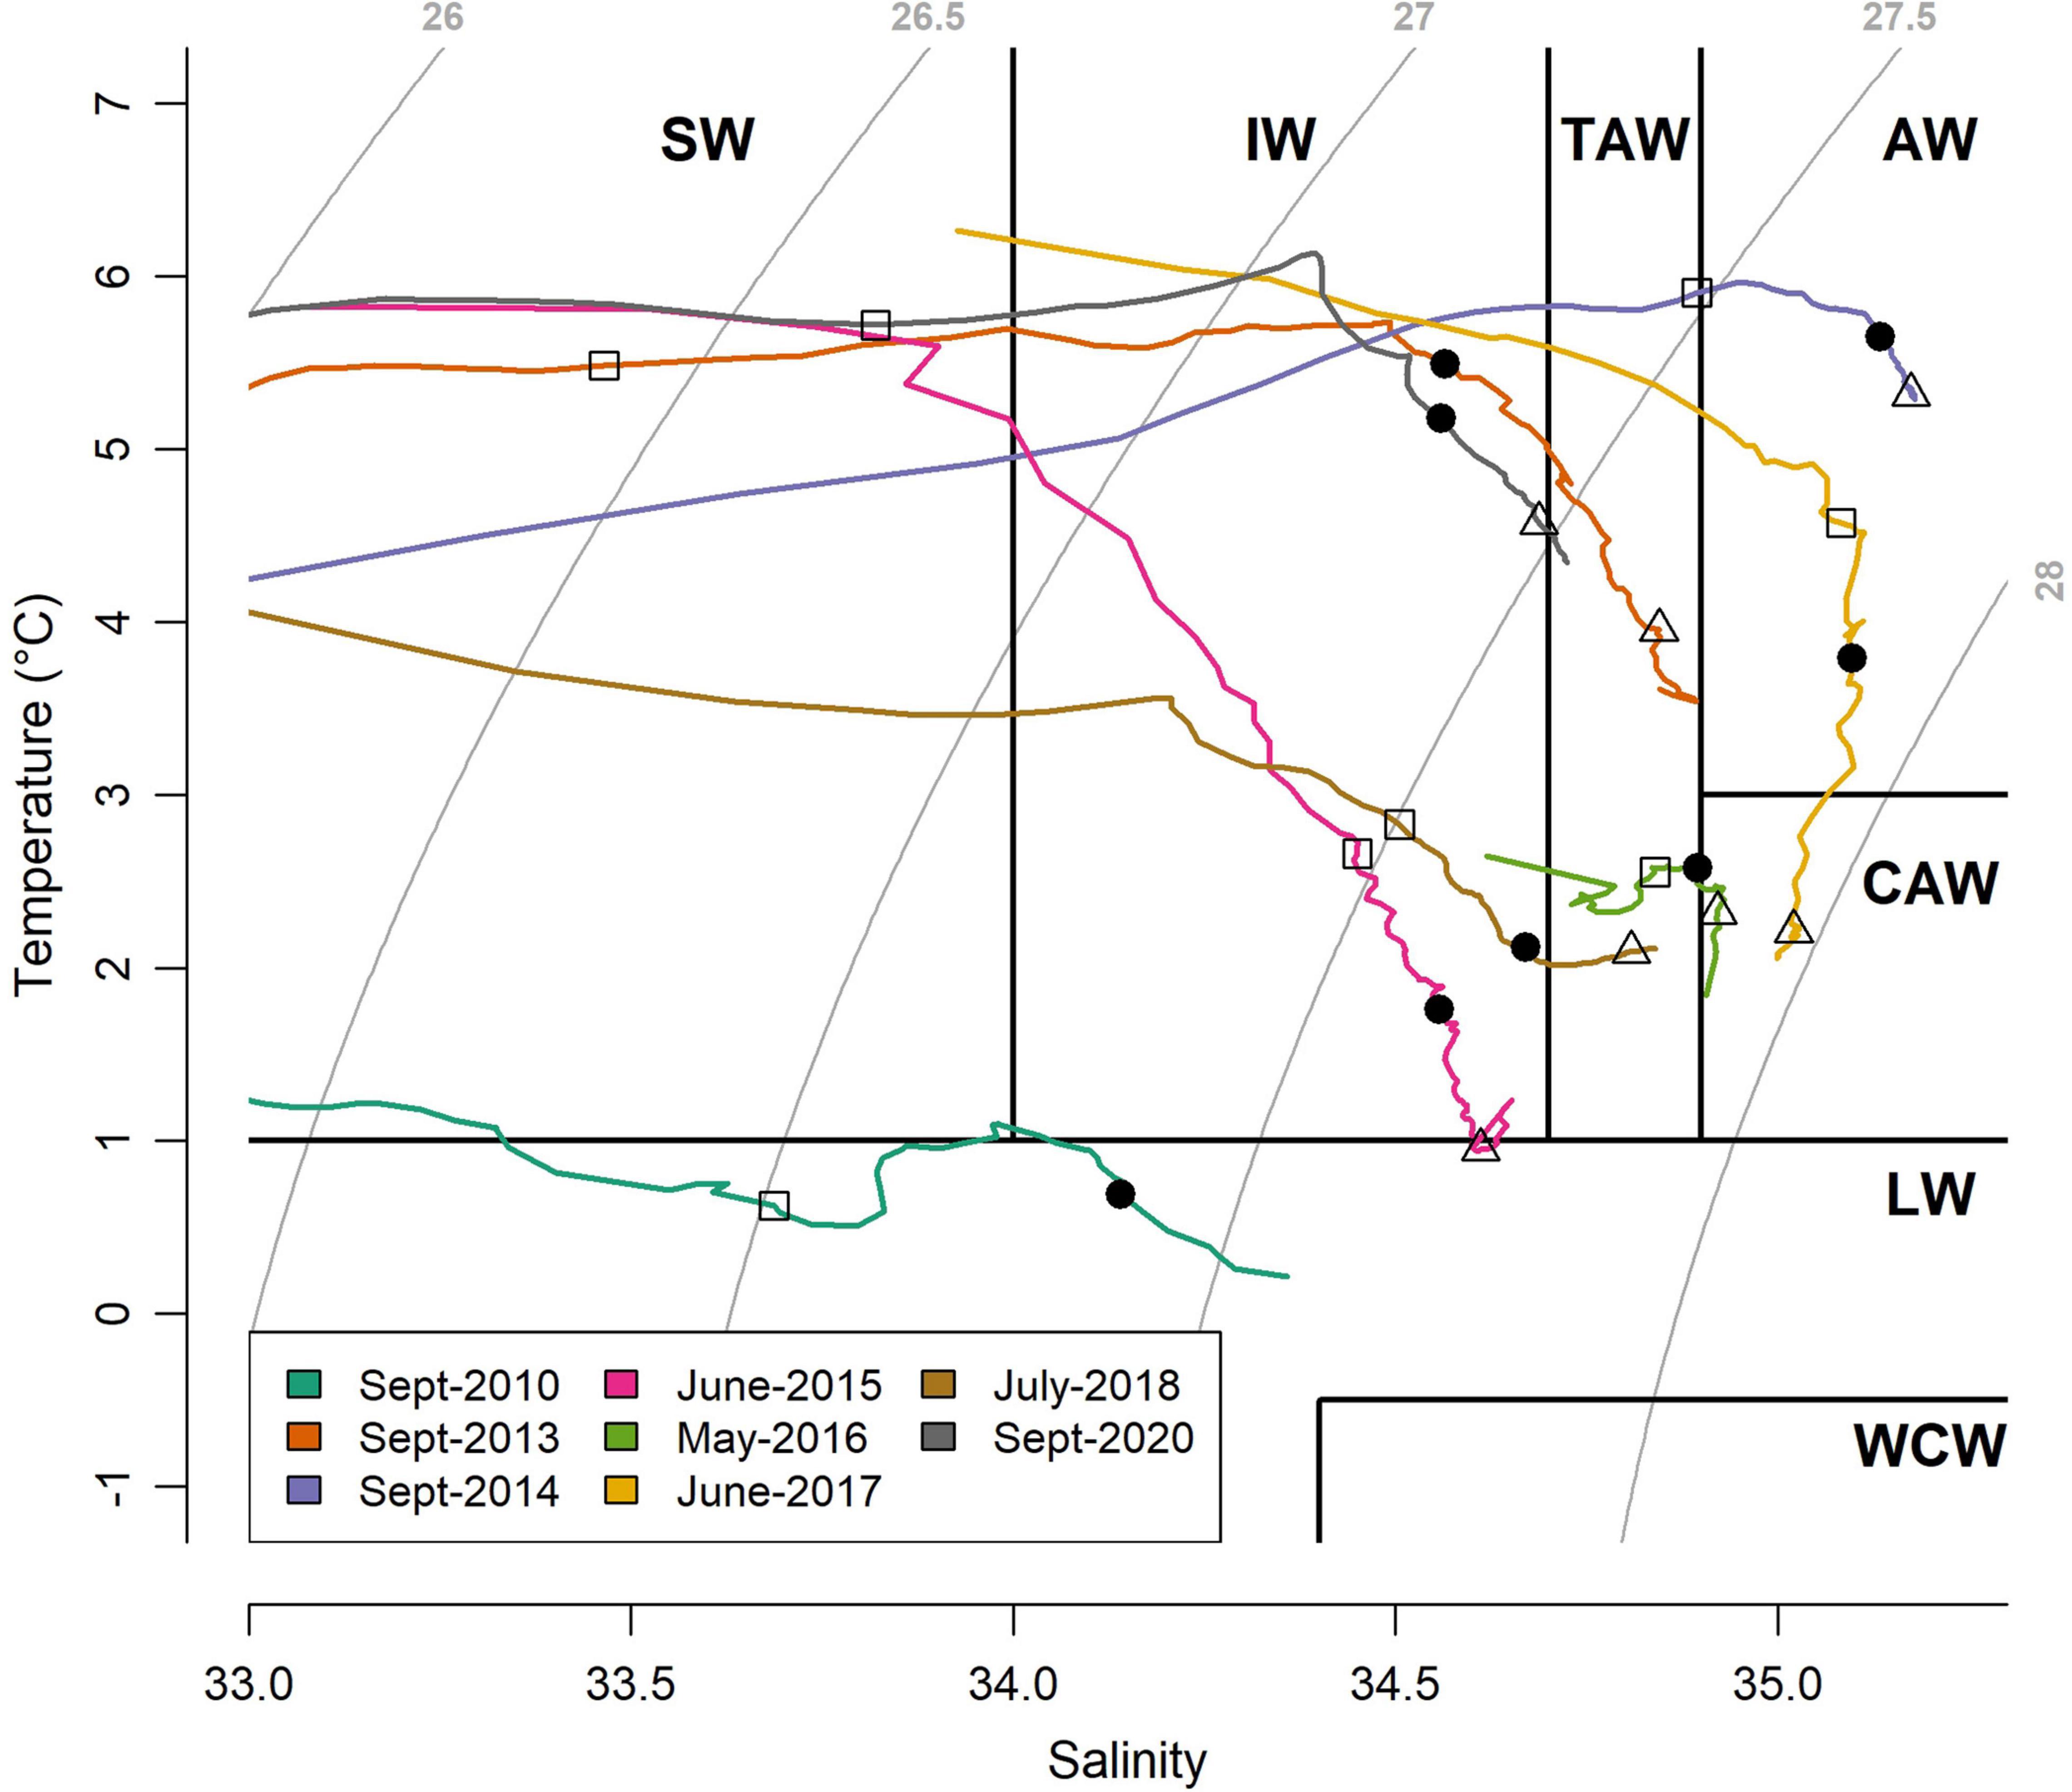
Figure 6. Mean temperature and salinity profile in the proximity of the MDI site for each year. Water mass categories are as in Table 1. Colours discern the different years. Symbols indicate specific depths: 25 m (squares), 50 m (black circles) and 85 m (triangles). Isopycnals are shown in grey. CTD surveys in the vicinity of MDI are not available for 2011, 2012, and 2019. The specific location and timing of CTD profiles used here are reported in Supplementary Table 1.
September 2010 showed a water column dominated by LW. September 2013 was characterised by TAW and IW in the lower and central part of the profile and SW in the upper part. AW characterised the water column below 30 m in September 2014, with cooler and fresher waters in the surface layer. June 2015 presented IW for depths below 35 m, while the surface layer is less salty and reaches almost 6°C. At 85 m depth, LW was present. May 2016 showed restrained variability. The deeper part of the water column is classified as CAW, while the remaining waters were almost entirely TAW. The June 2017 profile features CAW near the bottom and AW in its central and upper part. Water column in July 2018 was characterised by TAW in the deeper half and IW in the upper part. Similarly to 2013, 2020 profile featured TAW and IW below approximately 40 m and SW above. Overall, mean CTD profiles well agree with water masses identified in MDI data.
Conductivity-temperature-depth sections are displayed in Figures 7, 8 and are grouped by season. Specifically, Figure 7 reports data acquired in late spring 2015 and early summer 2018, whereas Figure 8 presents observations obtained in late summer 2014 and 2020. All CTD profiles used for temperature and salinity sections have been acquired in the southern side of inner Kongsfjorden and their positions are displayed in Figure 1. The horizontal axis reports the distance from the profile closest to the fjord mouth.
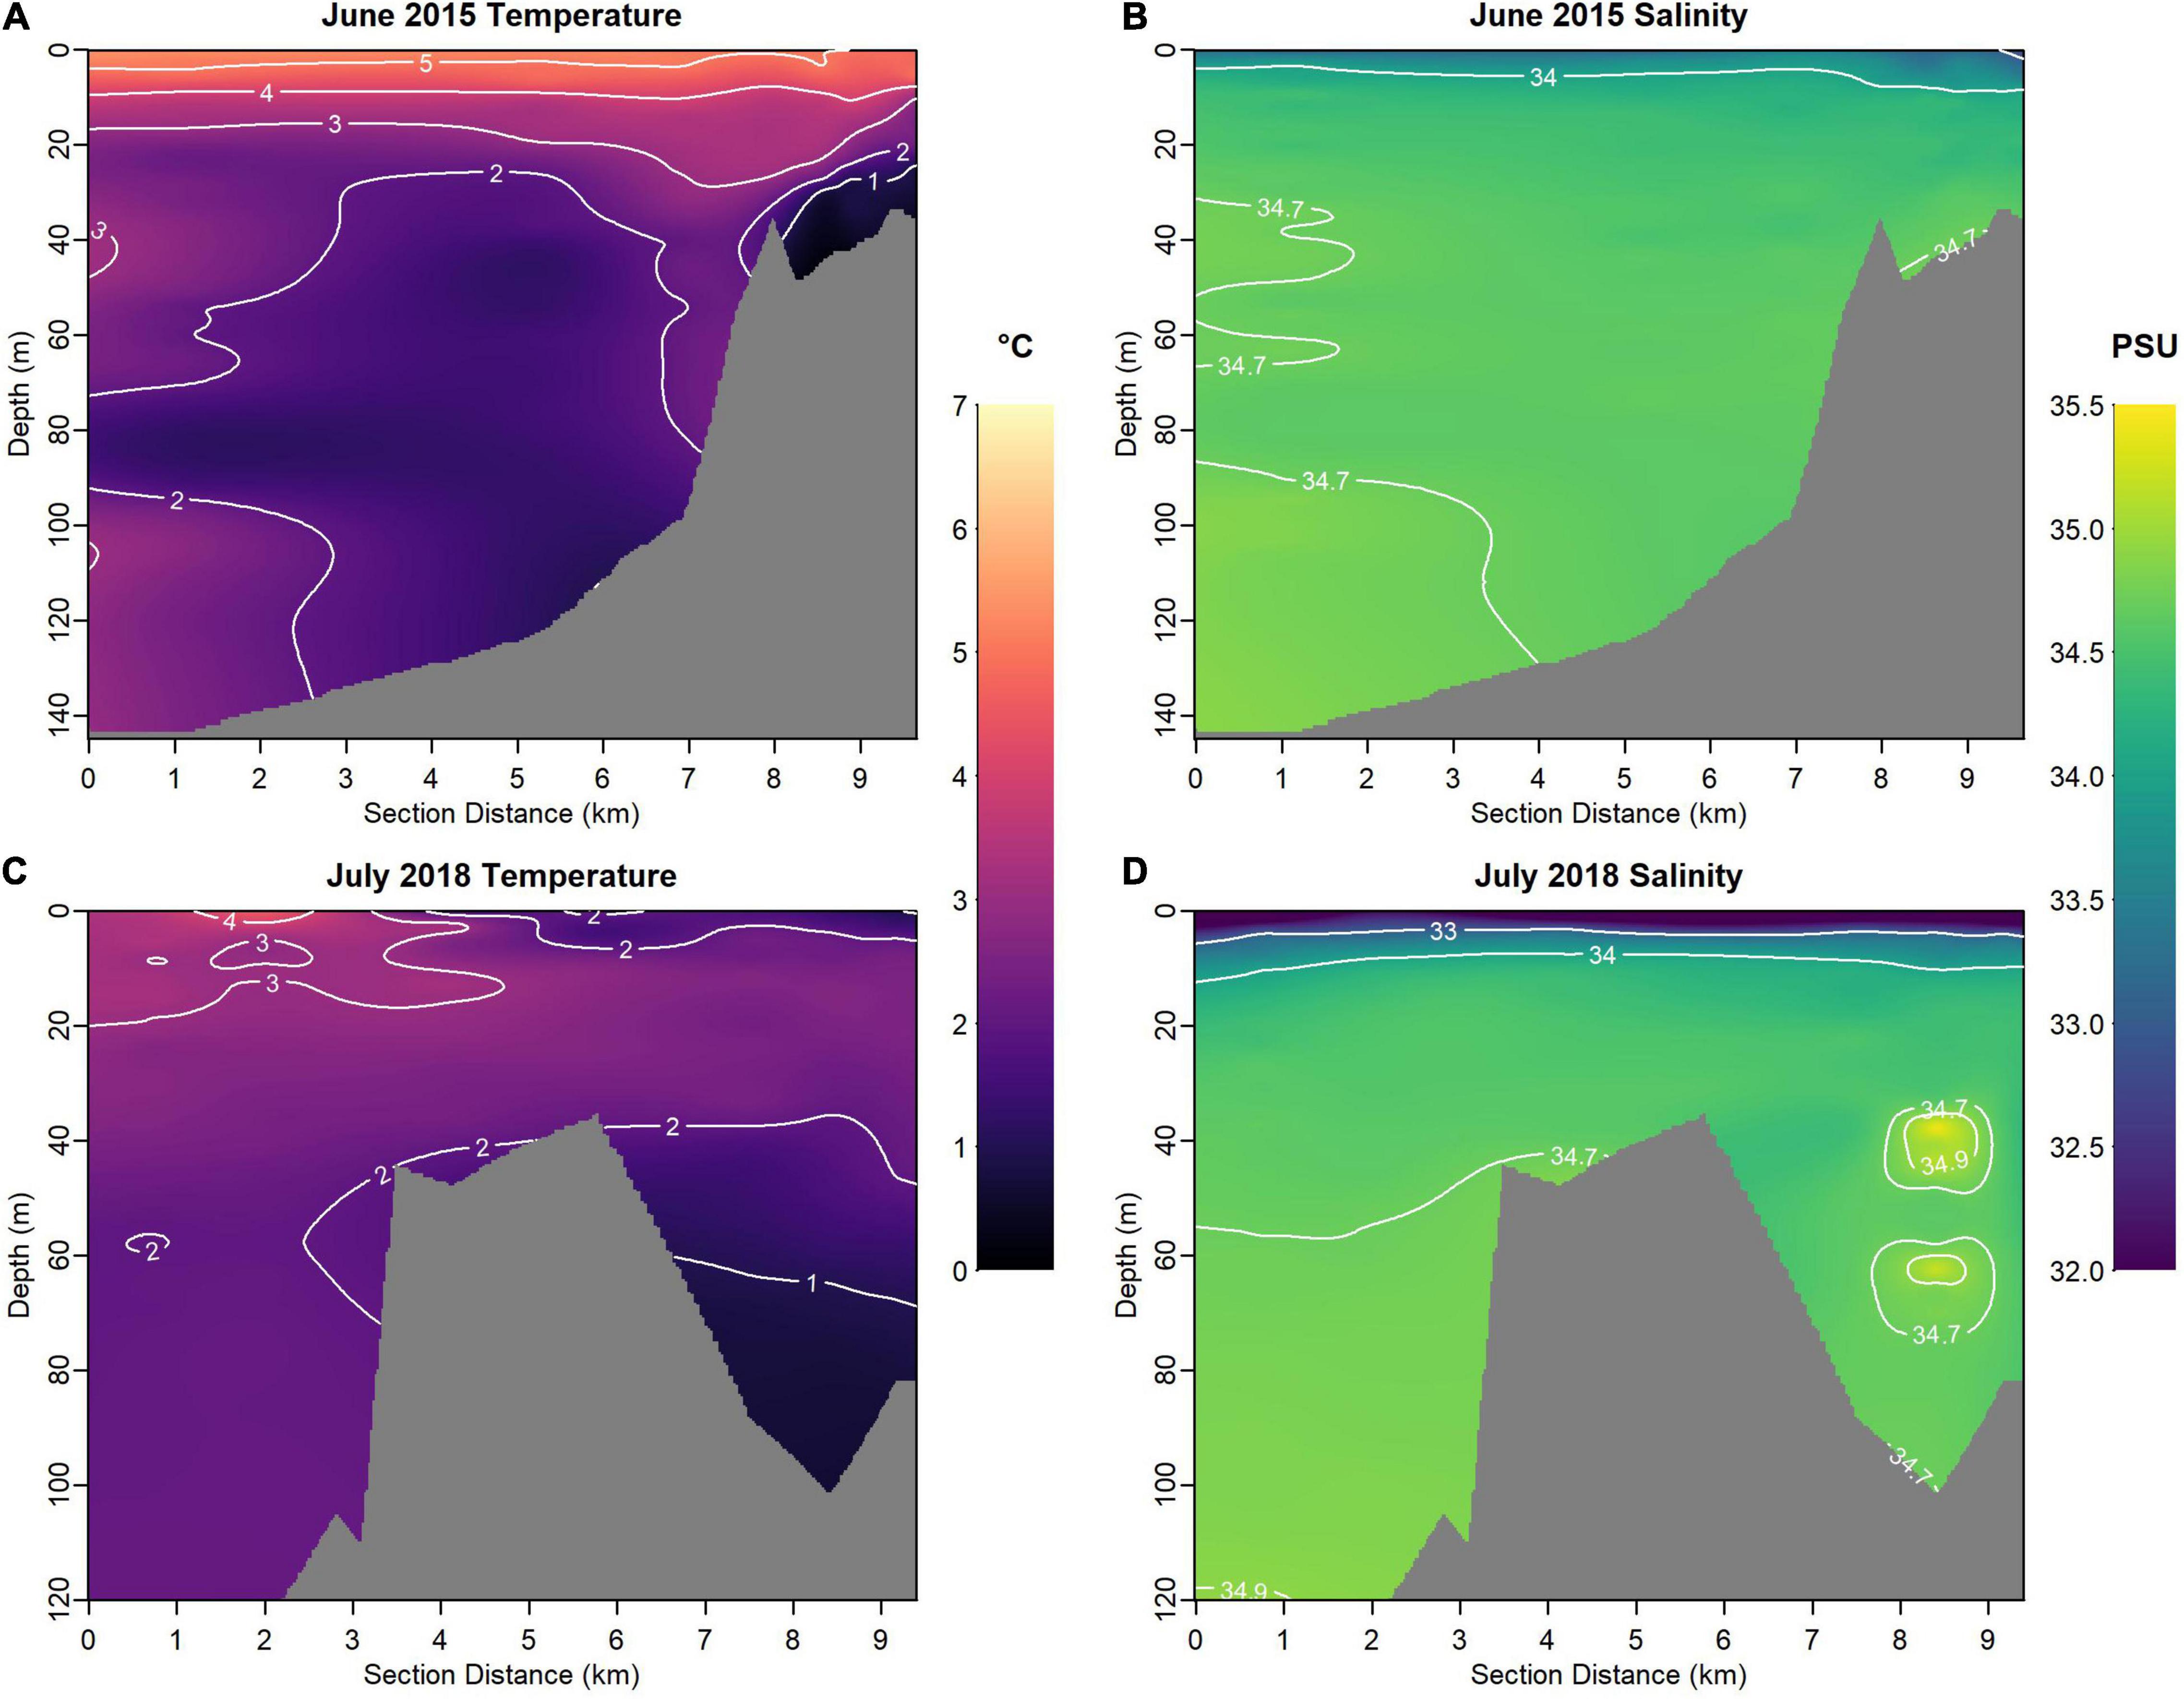
Figure 7. Temperature and salinity sections reporting data acquired in (A,B) June 2015 and (C,D) July 2018 in the southern side of inner Kongsfjorden. Data gridding is performed through the DIVA algorithm.
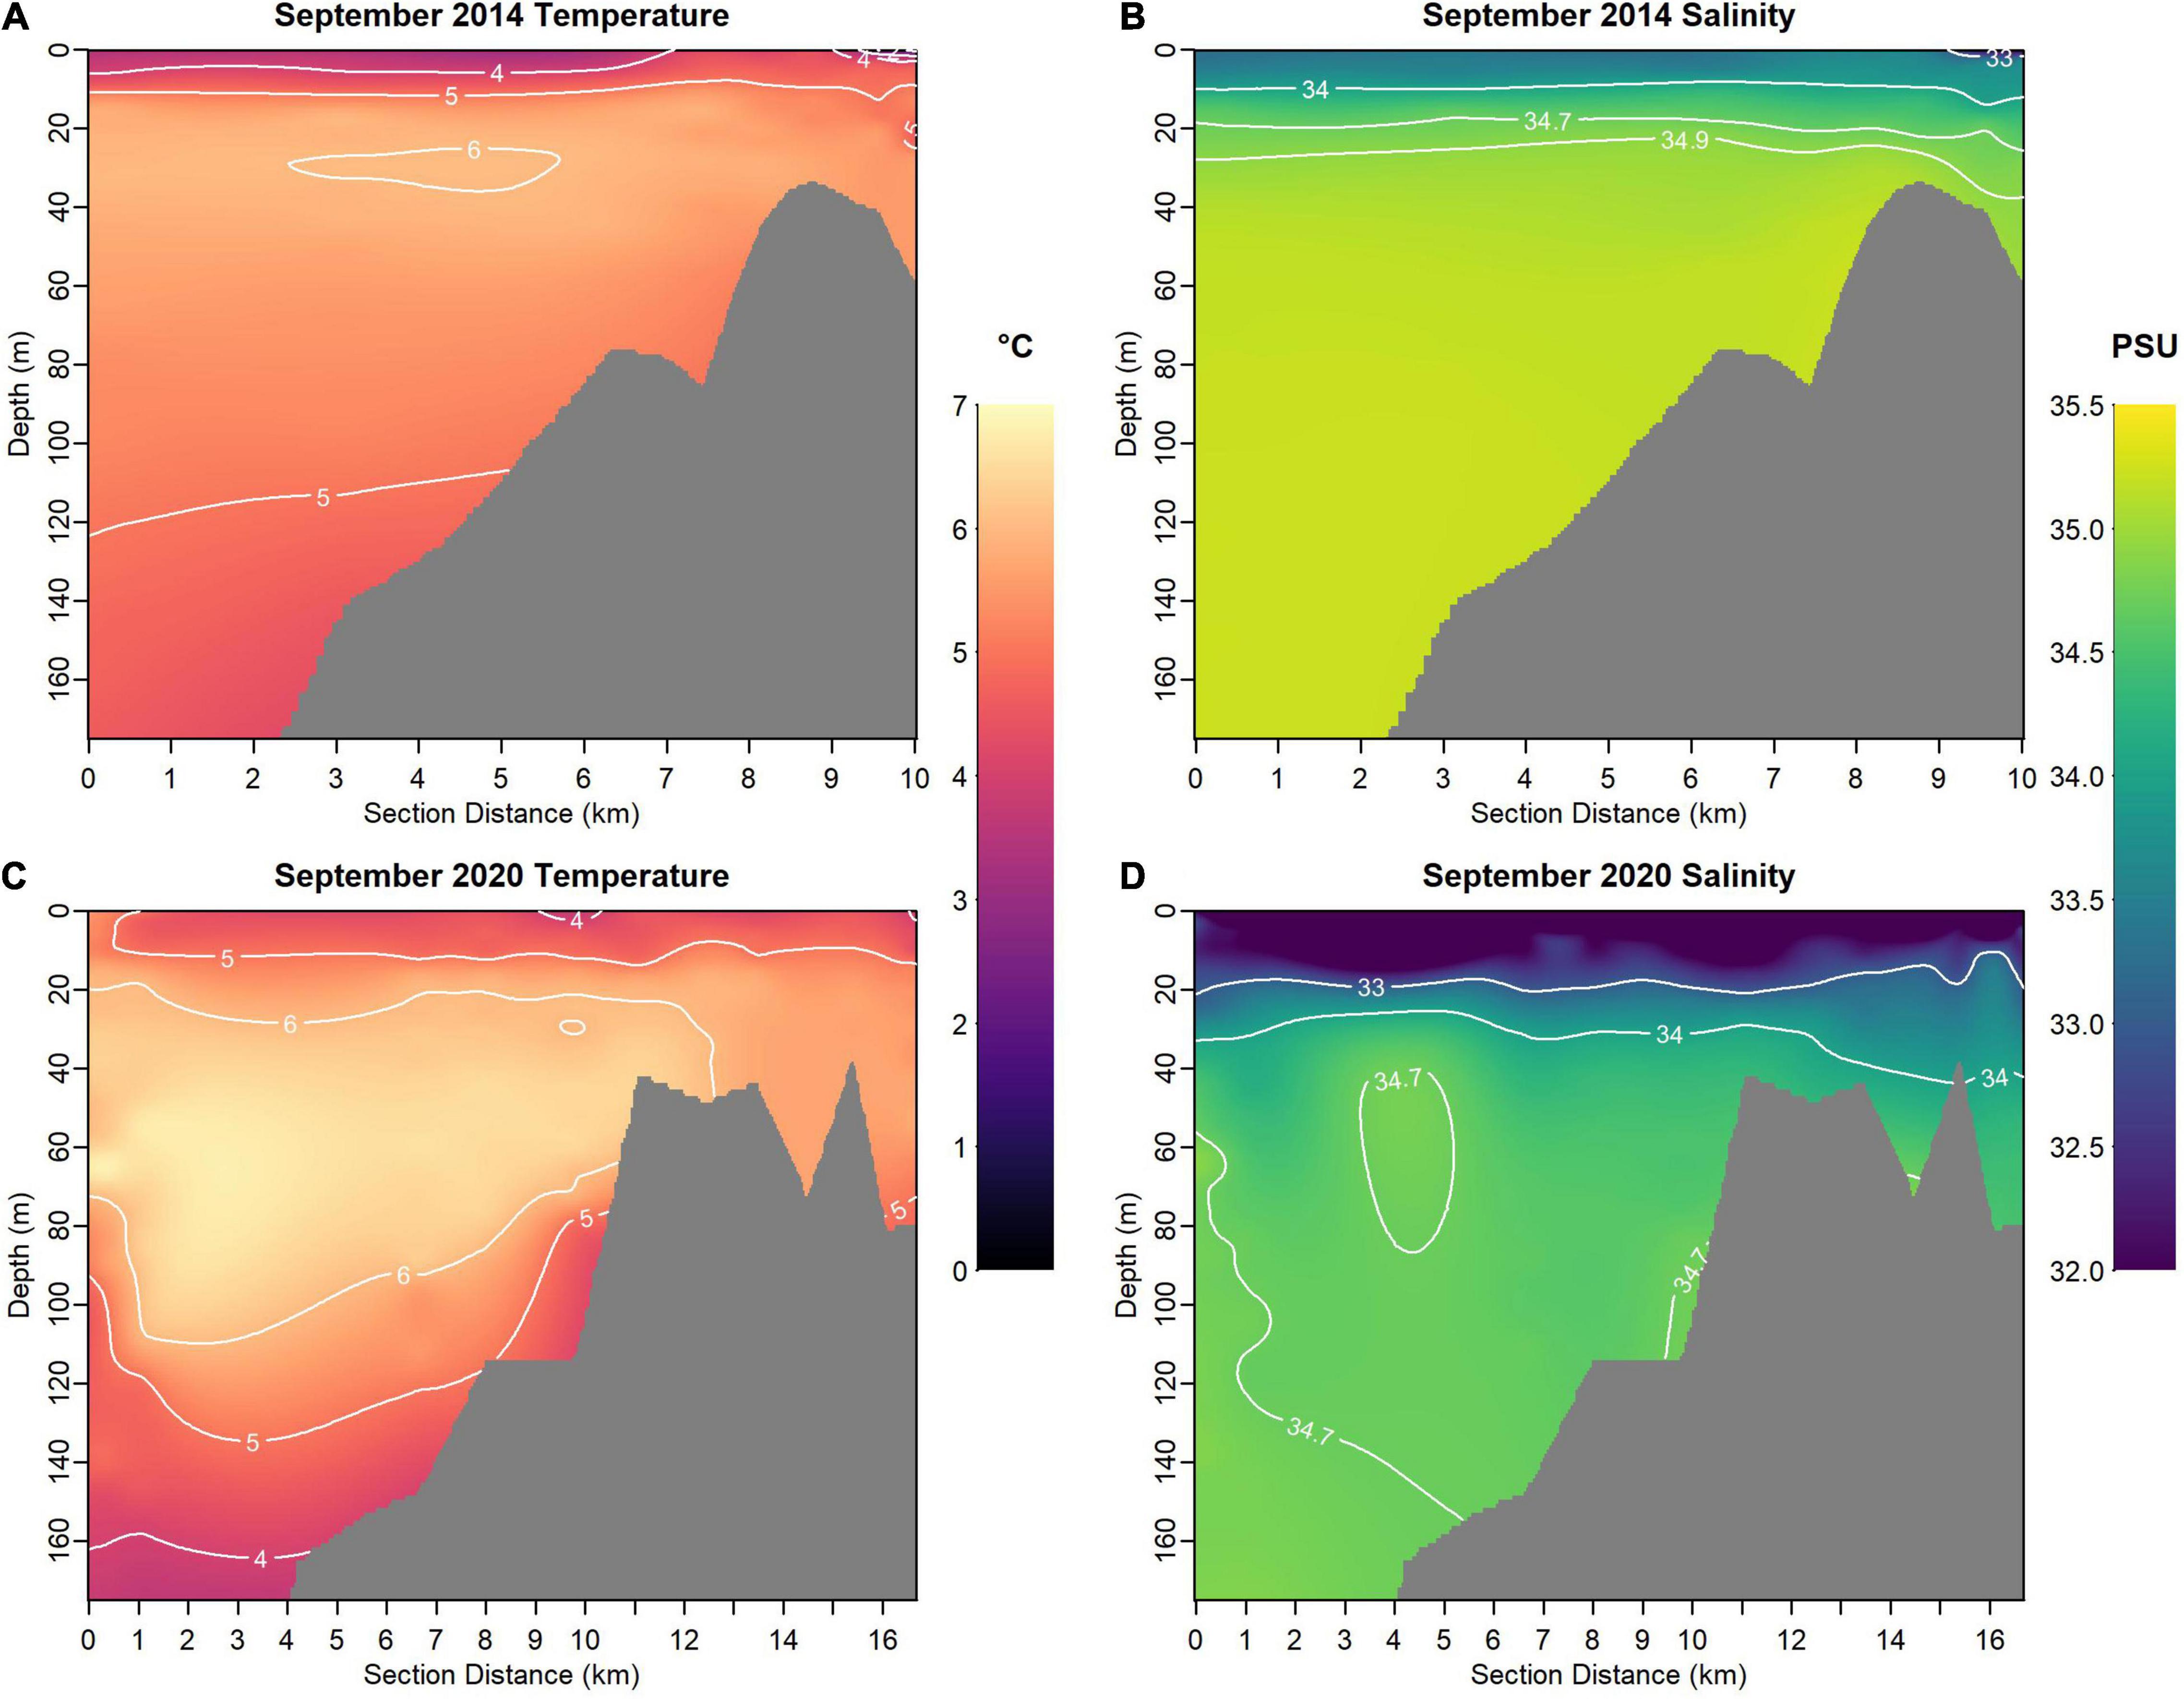
Figure 8. Temperature and salinity sections reporting data acquired in (A,B) September 2014 and (C,D) September 2020 in the southern side of inner Kongsfjorden. Data gridding is performed through the DIVA algorithm.
June 2015 featured LW in the shallowest layers and large volumes of IW underneath. Waters are relatively fresh with salinities lower than 34.7. The July 2018 section is dominated by LW. The inner fjord is almost entirely covered by cool waters with temperatures below 3°C and salinities greater than 34 units. It is noteworthy the presence of small pockets of cool salty waters, i.e., CAW, close to the tidewater glaciers’ front.
The September 2014 sections show a water column clearly dominated by AW, from 30 m depth to the fjord bottom. Near-surface layers are occupied by TAW and IW, featuring lower salinities. The September 2020 section exhibits a warm water column, where temperatures are above 5°C in the intermediate layers. These waters are composed by an upper LW layer and TAW underneath.
Discussion
Insights From Mooring Dirigibile Italia Temperature Series
Figure 9 compares MDI temperature series at selected layers and advection of AW and TAW in inner Kongsfjorden.
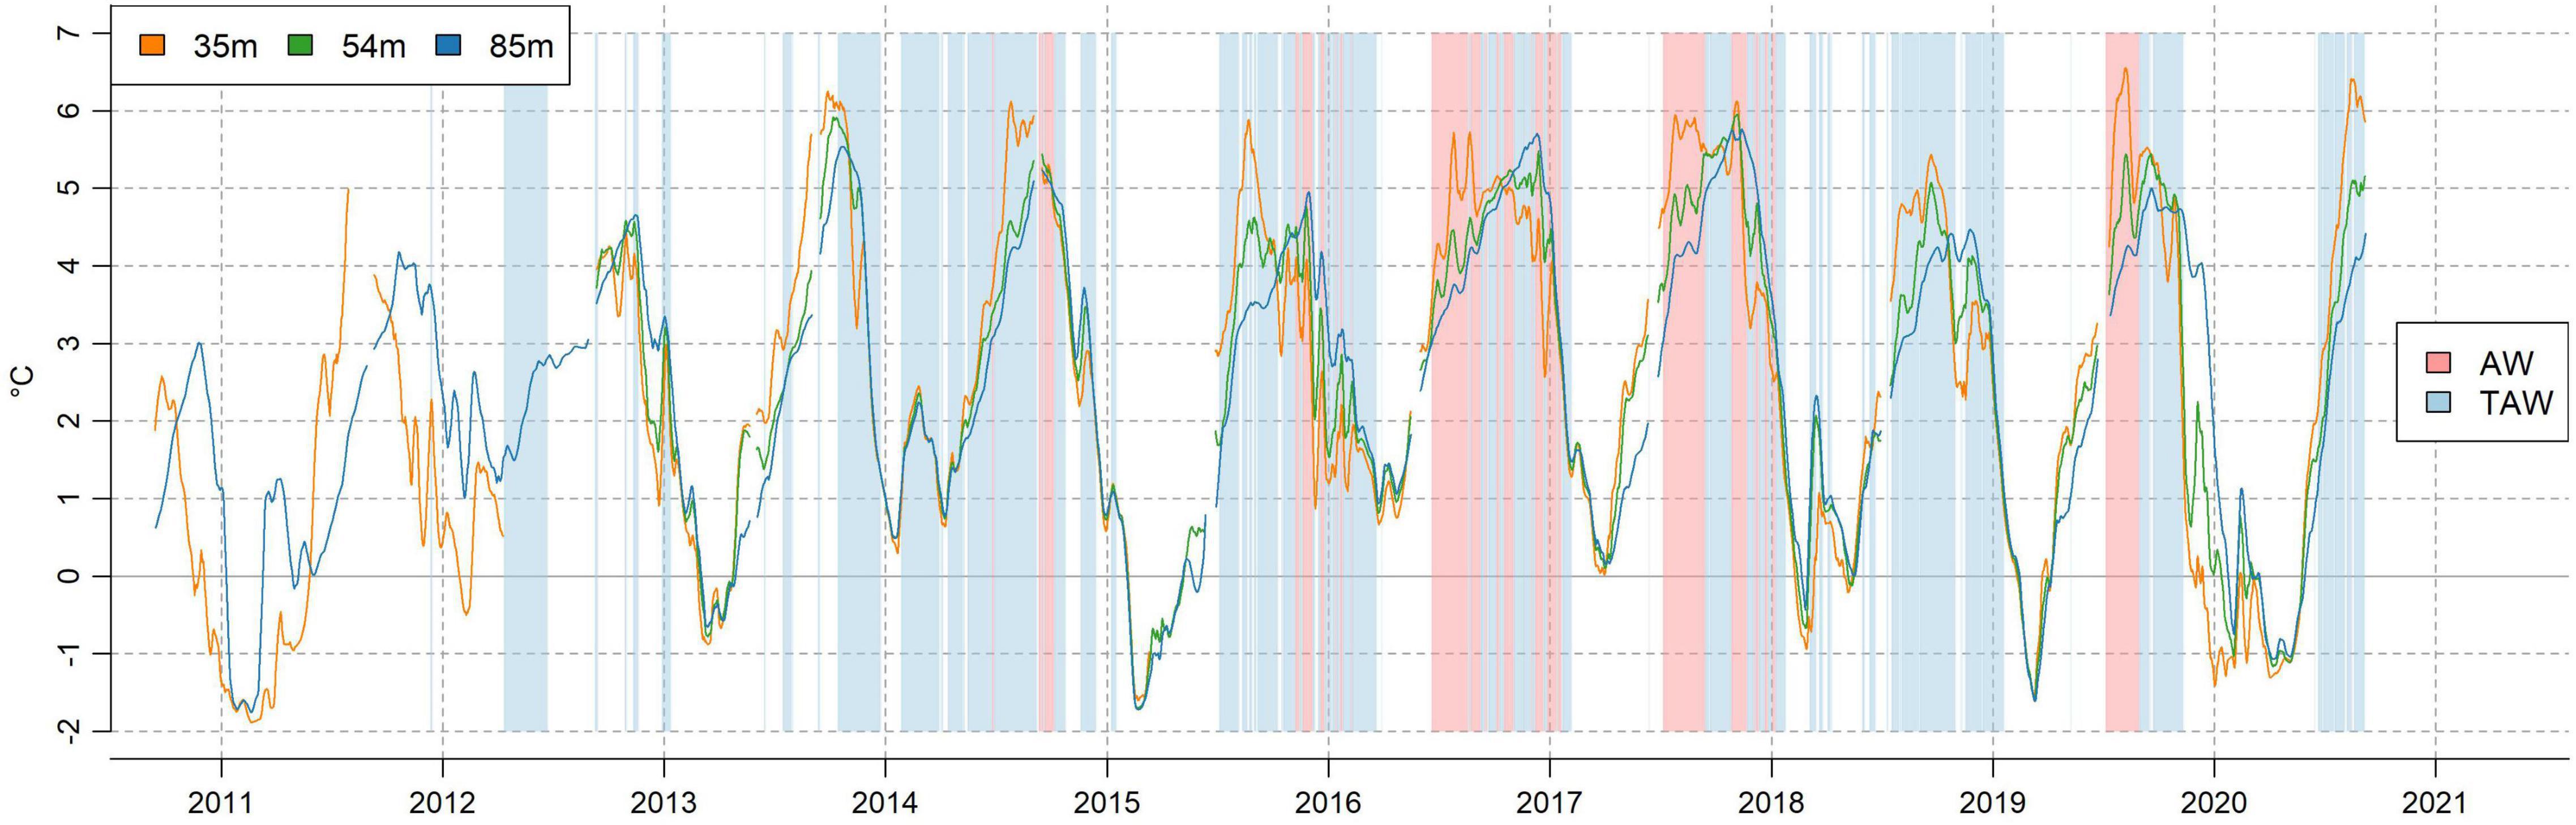
Figure 9. Coloured lines represent daily water temperatures medians at selected depths smoothed with a moving average of 11 days. Coloured shadings identify AW and TAW periods, respectively, as identified by 85 m temperature and salinity sensors.
Near-surface and near-bottom waters reach their annual temperature maximum at different times, respectively, in summer and autumn, except for 2012. This is clearly evident in 2011, 2013, 2015, and 2016, where summer waters at 35 m are almost 2°C warmer than 85 m waters. In autumn, the water column gradually cools at the near-surface while it continues to warm at 85 m. Accordingly, the near-surface is largely subjected to air-sea interactions (heat loss to the atmosphere) and freshwater input, whereas the near-bottom is influenced by the horizontal advection of warm waters. Interestingly, in 2016, 2017, and 2019 there is a correspondence between periods of near-bottom AW intrusions and the sudden increase of near-surface temperature.
Temperature time series reported in Figure 3 shows the occurrence of local temperature maxima at all depths in winters 2011, 2012, 2014, 2018, and 2020. These events are accompanied by a sudden growth in salinity and are identified as winter episodic intrusions of IW (2011, 2012, and 2020) and TAW (2014 and 2018). These winter inflows of waters with variable Atlantic origin have a nearly biannual frequency. During these episodes, the water column features an almost uniform temperature at all the observed depths, except in 2011 and 2012. Winter 2016 does not exhibit a single temperature peak but high frequency variations with large amplitudes never decreasing less than 1°C. This peculiar event may be related to the extremely warm Arctic air temperatures observed in the same time interval (Overland and Wang, 2016). Anomalously warm air temperatures observed in January and February 2016 were initially caused by a very intense Atlantic windstorm that entered the Arctic (Kim et al., 2017). High frequency variations in Kongsfjorden water temperatures may have been caused by strong and largely variable winds on the WSS, moving alternately warm and cold waters from the WSC and SPC to the inner fjord.
Figure 10 compares monthly water temperatures observed by MDI against fjord’s landfast sea ice coverage using data from Gerland and Pavlova (2020). Sea-ice in the inner Kongsfjord has been extensively discussed in Pavlova et al. (2019) and Gerland et al. (2020). Generally, MDI observations and fjord’s sea-ice conditions follow a simple relation: water temperatures below 0°C are linked to favourable sea-ice conditions, both in terms of areal extension (winters 2011, 2013, 2018, and 2019) and thickness (winters 2011 and 2015, see Figure 4.5 in Pavlova et al., 2019), whereas temperatures above 0°C prevent sea-ice growing (winters 2012 and 2014). The lowest temperatures of the decade are found in January and February 2011 and are associated with the formation of extensive and thick sea-ice as well as convection extended to the fjord’s bottom (Figure 5). As evidenced in panels (b,c) and correlation coefficients, the above relation is stronger for temperatures at 35 m than at 85 m. As an example, 85 m temperatures present a local maximum in March 2011 reaching almost 2°C, while 35 m temperatures remain between 0 and −2°C. Hence, warm waters intruded in the inner Kongsfjord but were restricted to the lower part of the water column and they did not significantly affect sea-ice conditions, as fast-ice coverage remained similar between March and April 2011. A similar case occurred in March 2018, where a winter local temperature maximum is observed at all investigated depths but a large fast-ice coverage characterises the inner Kongsfjord. On the opposite, warm water advections occurred in winters 2012 and 2014, preventing the formation of fast-ice in the inner fjord by maintaining the water column temperatures above 0°C. Another peculiar case is winter 2016, which exhibits presence of landfast sea-ice in the inner fjord, while MDI temperatures are well above 0.5°C for the whole winter and spring. Although sea ice cover data is not yet available for winter 2020, direct (visual) observations by one of the authors (LL) documented a persistent sea ice cover of the fjord from late January to May and cold temperatures are found at MDI, with a warm water incursion occurring in February (Figure 9). Overall, observations confirm that near-surface warm water advections in Kongsfjorden prevent sea-ice formation, as extensively reported in the scientific literature (Cottier et al., 2005; Nilsen et al., 2016; Tverberg et al., 2019). However, warm water advection occurred also in years with considerable fast-ice coverage (2011, 2018, and 2020), but they have been restricted to the near-bottom and they did not significantly influence sea ice conditions in inner Kongsfjorden.
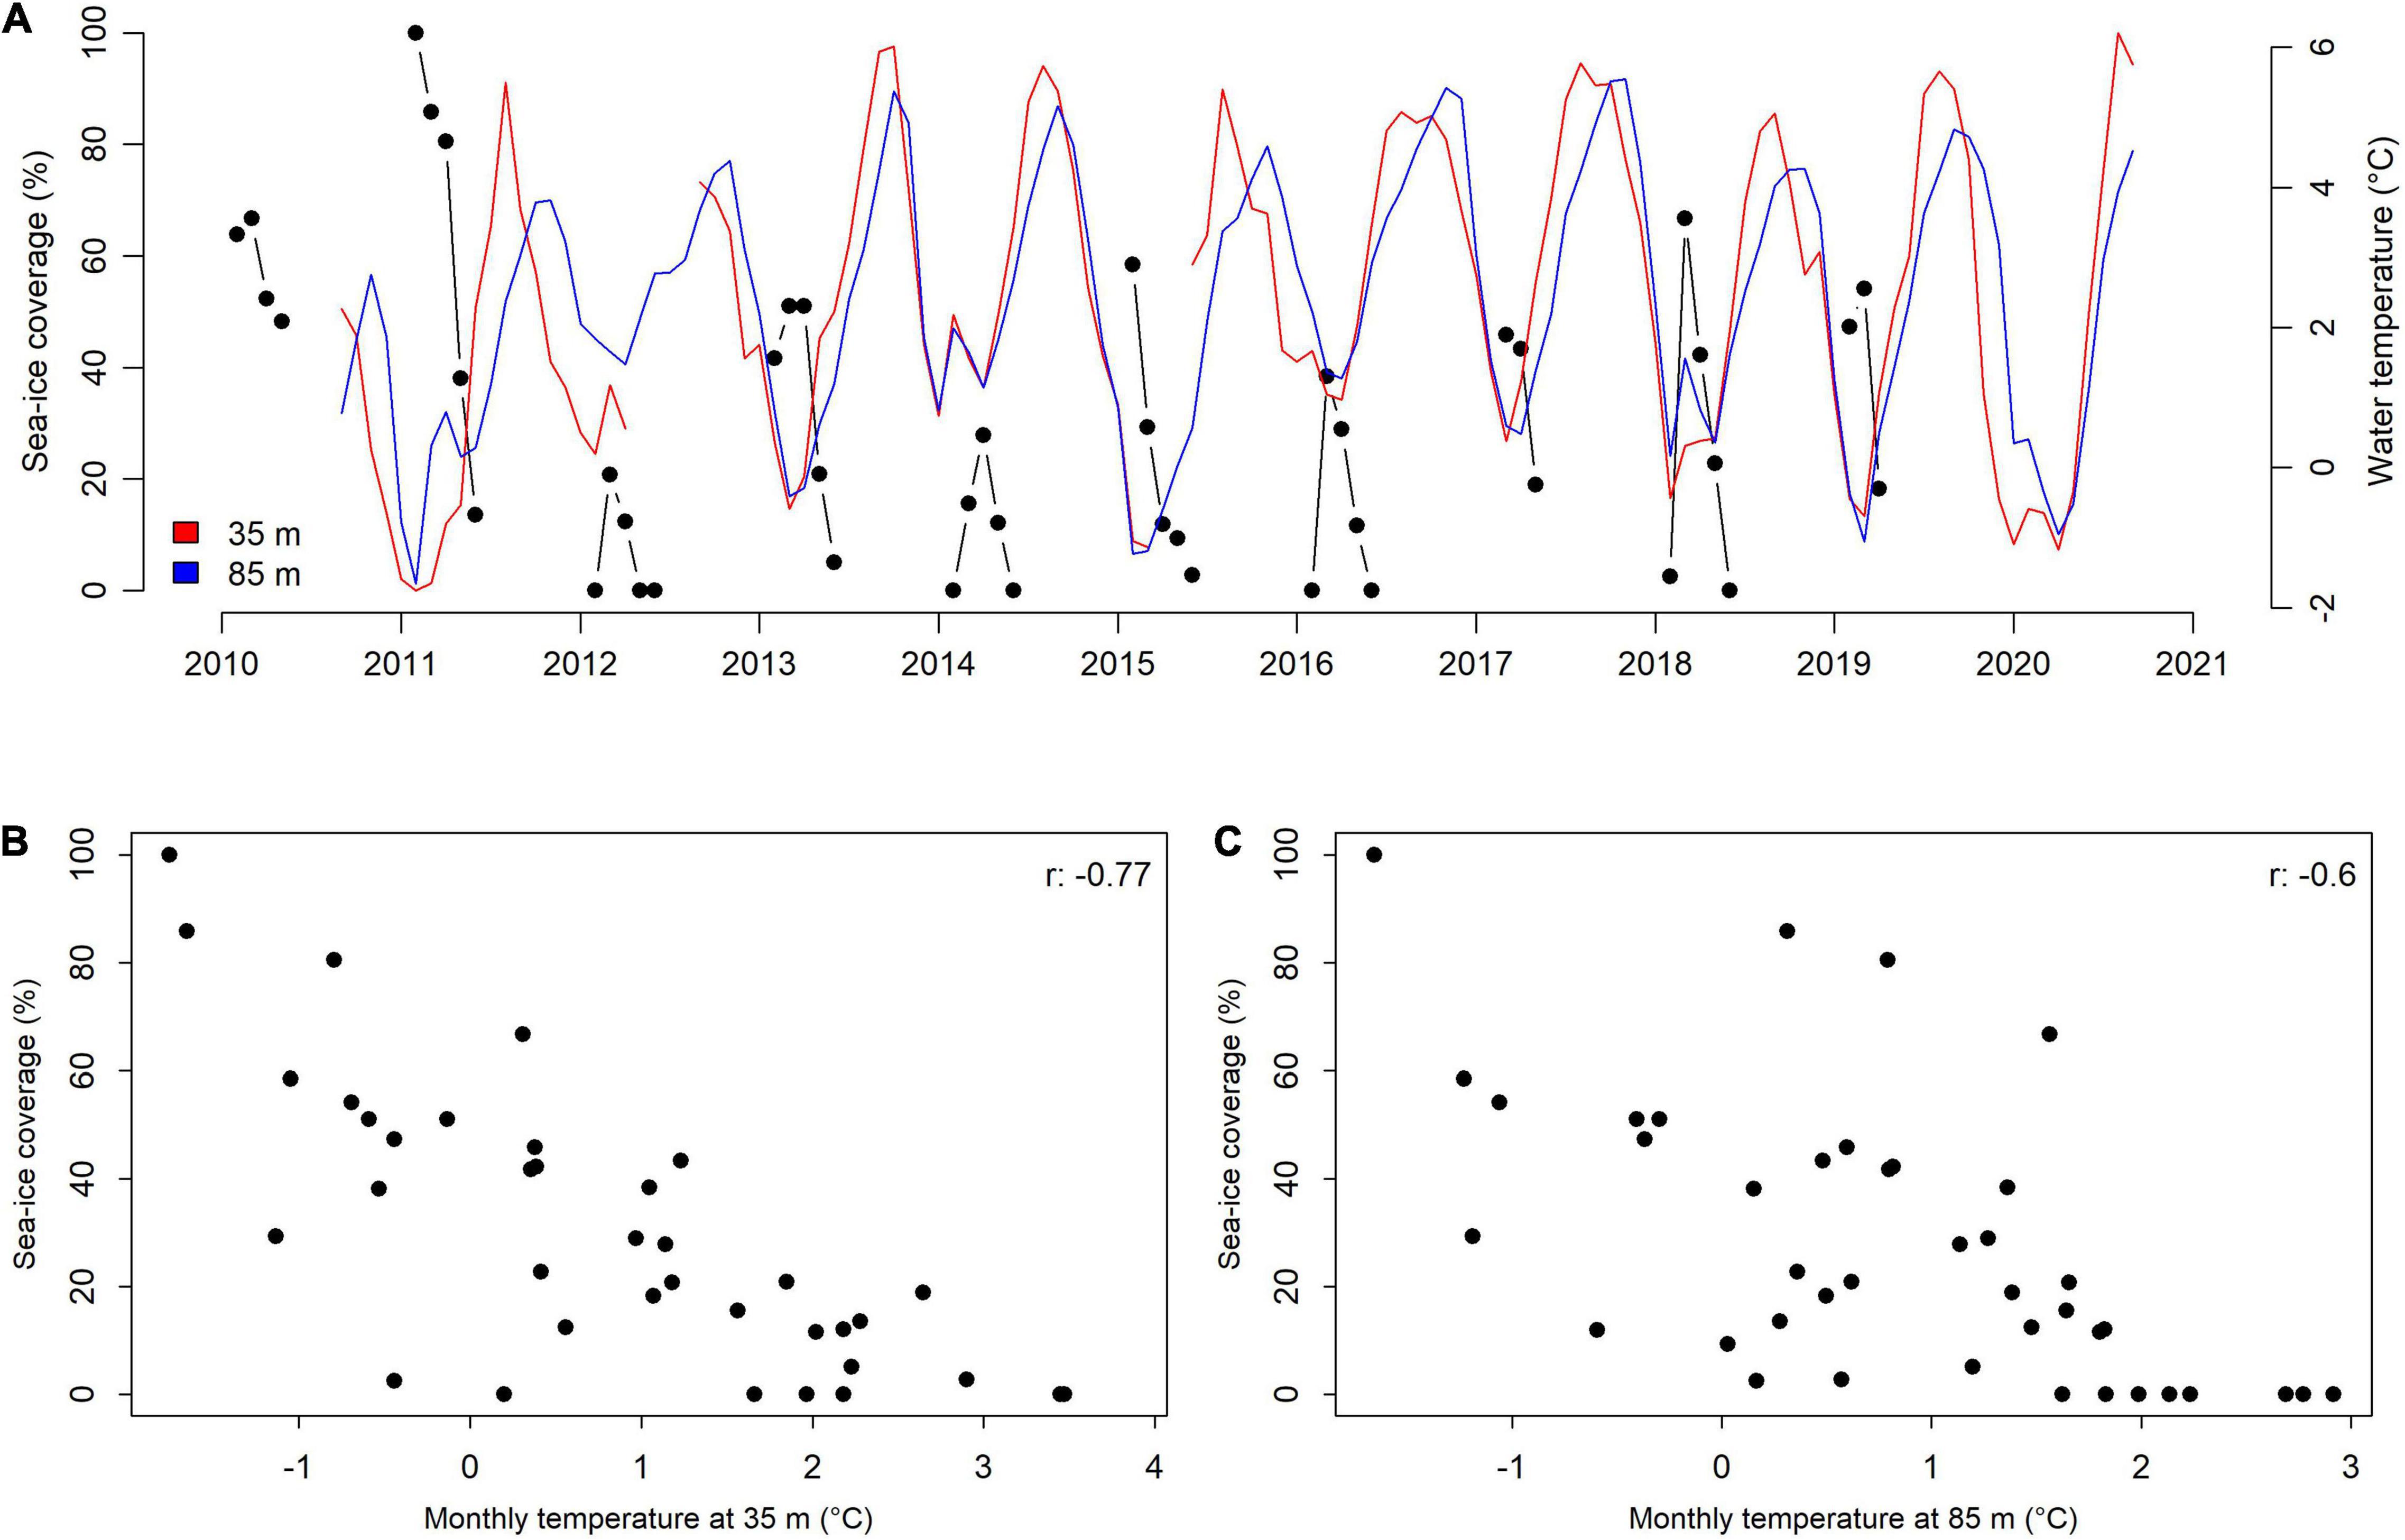
Figure 10. (A) Monthly mean water temperatures at 35 m (red) and 85 m (blue) from MDI time series and monthly February-June sea-ice coverage (black dots) in inner Kongsfjorden (Gerland and Pavlova, 2020). Regression plots of February-June sea-ice coverage against February-June (B) 35 m water temperature and (C) 85 m water temperatures and relative Pearson correlation coefficients (Rodgers and Nicewander, 1988).
Temperature and Salinity Long-Term Evolutions and Water Masses Variability
Despite the linear regression analysis indicates an overall temperature increase in the 2010–2020 decade, starting from 2016 SON temperatures are stable (Figure 4A) and even a cooling is seen in the coldest months (Figure 4B). Motivated by these evidences, a change point analysis (see section “Materials and Methods”) is conducted on de-seasoned temperature series at 35 and 85 m to identify whether the relation of these variables with time is piecewise linear and when different segments connect together. Seasonality removal is performed by subtracting the annual mean cycle to the temperature daily median series to exclude any influence given by the seasonal cycle on the calculation of the change point. A change point analysis is conducted on 85 m salinity daily medians as well. Results are displayed in Figure 11.
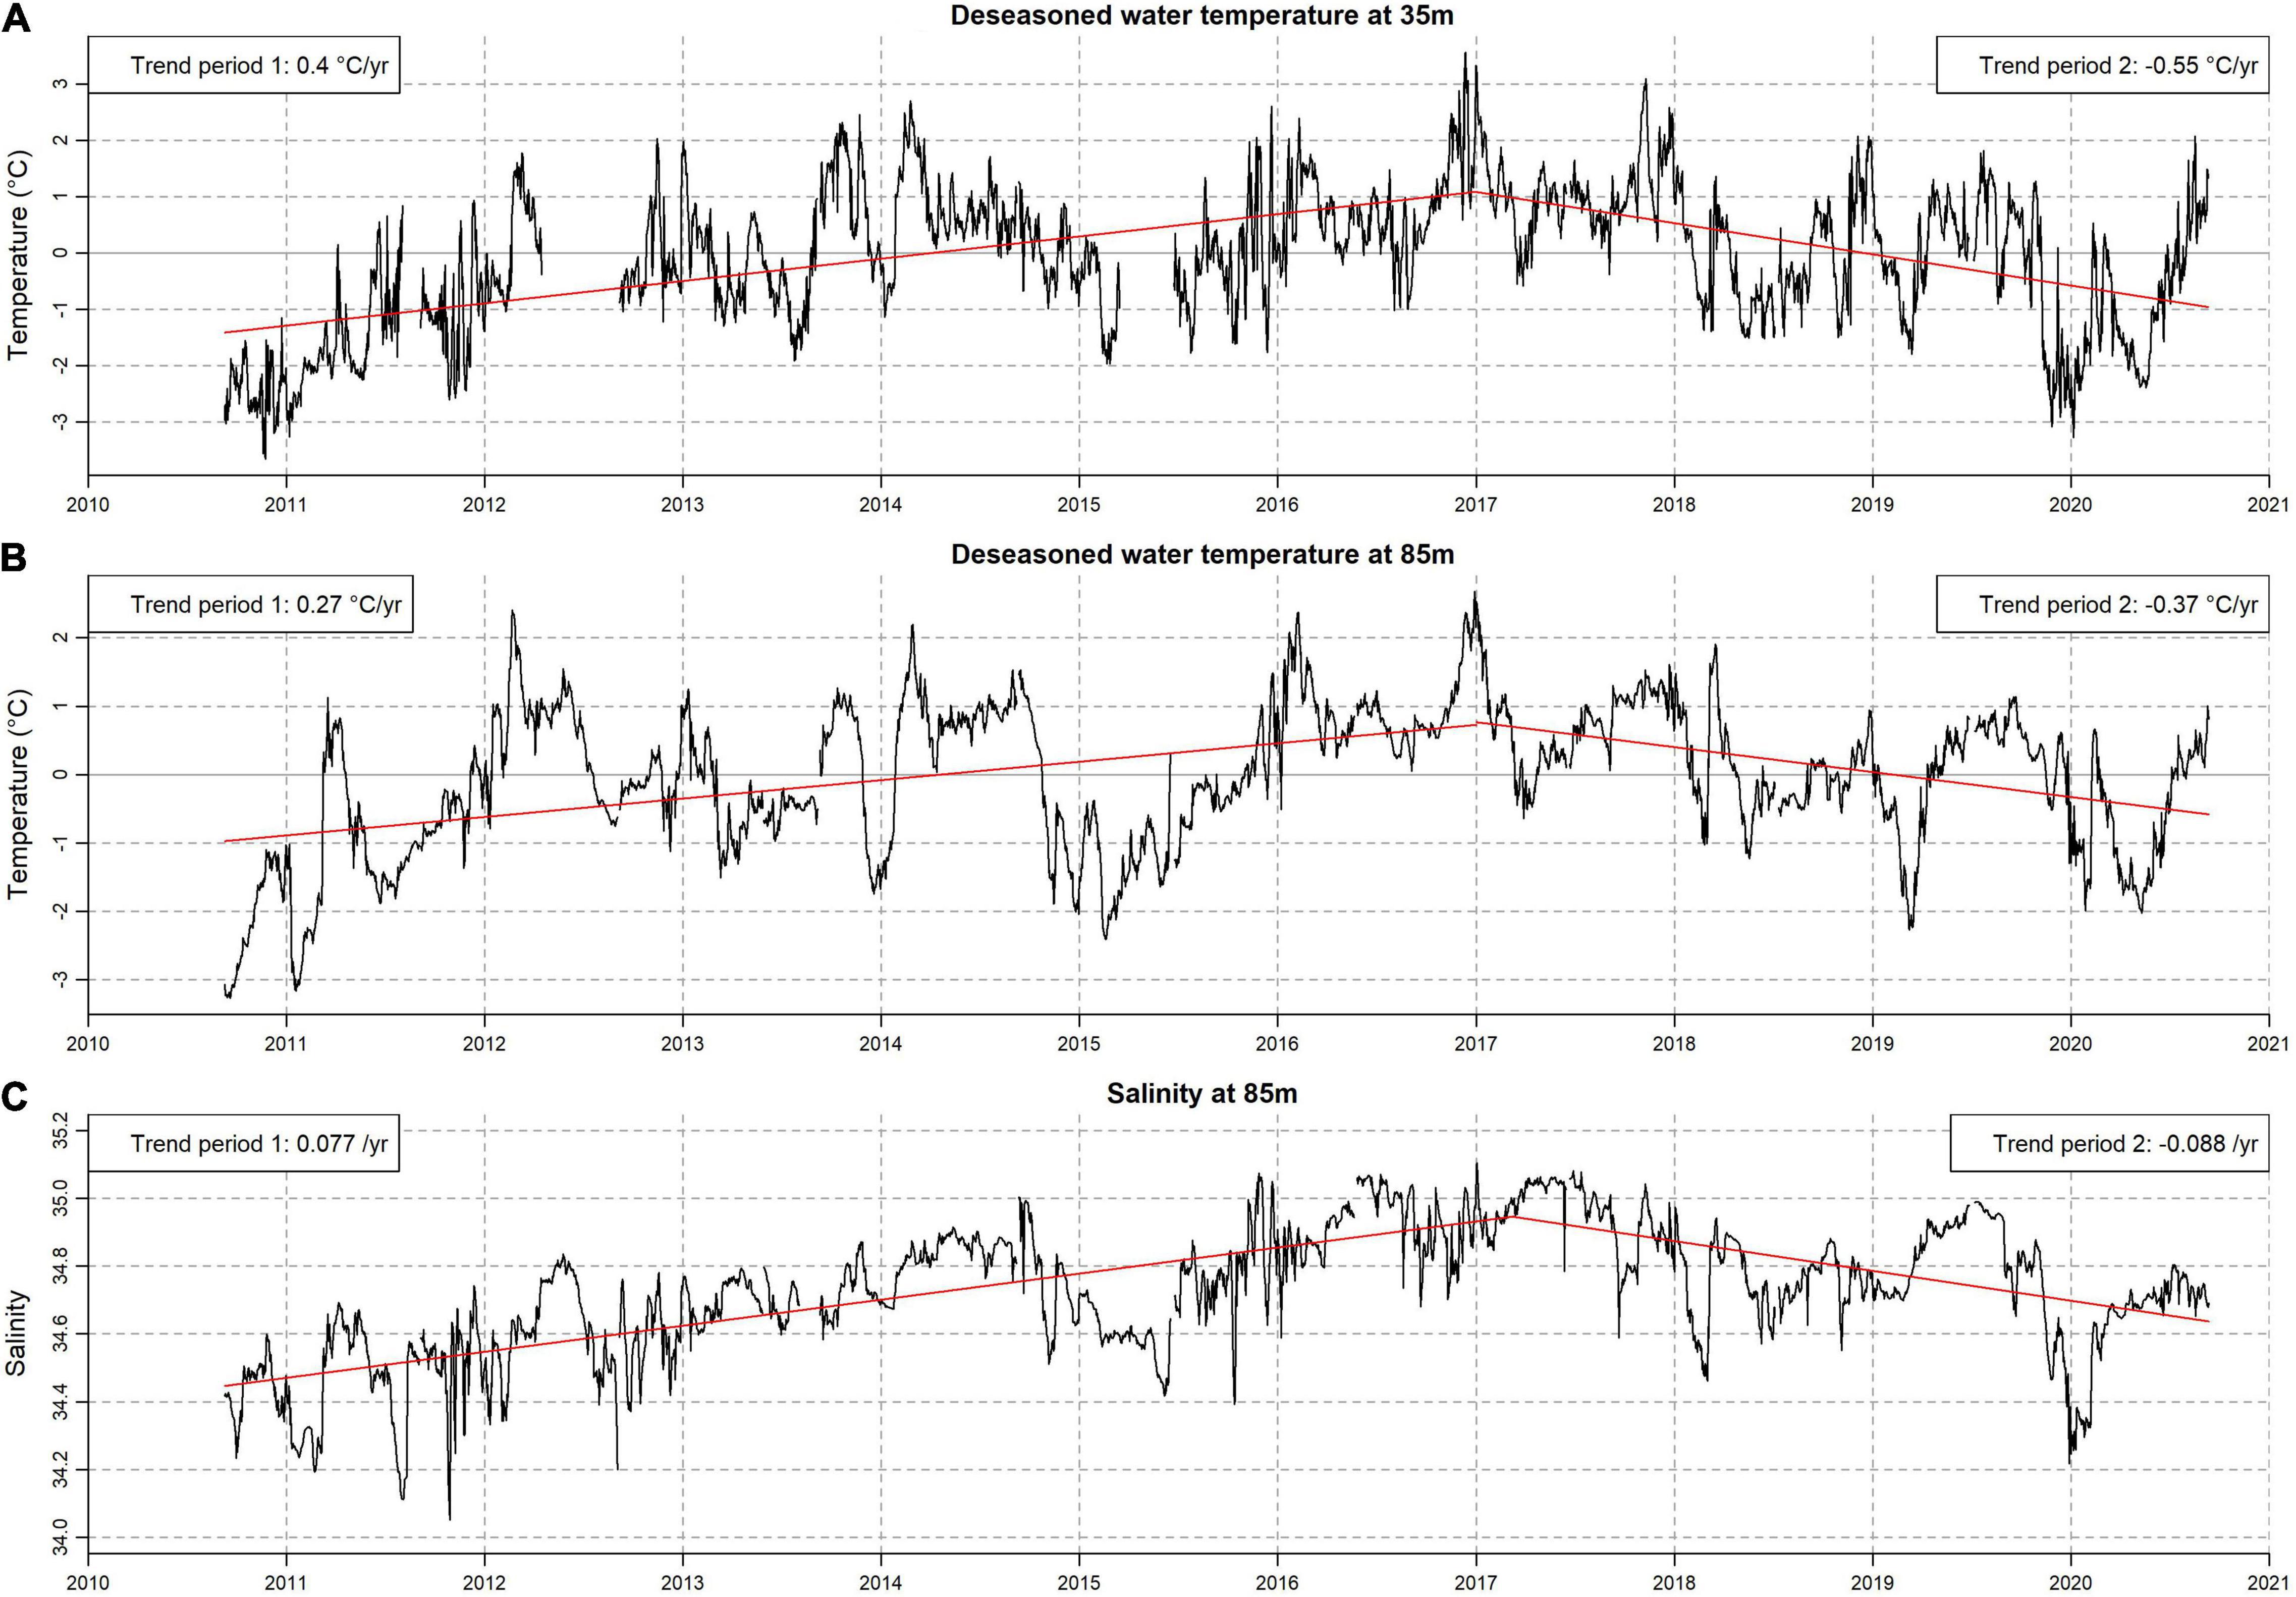
Figure 11. De-seasoned temperature daily medians at (A) 35 m and (B) 85 m. (C) Salinity daily medians at 85 m. Predicted regression values are reported with red lines. All trends are statistically significant at the 95% confidence level.
Temperature linear trends change sign at both depths in January 2017. Temperature anomalies increased from September 2010 to the end of 2016, with a pace almost one third larger at the near-surface compared to the near-bottom. From 2017 onward, temperature anomalies cool at a pace, again, one third larger at the near-surface compared to the near-bottom. Salinity at 85 m increases in the 2010–2020 decade at a rate of +0.030/yr, but a maximum is observed in winter 2017. A linear regression change point is found in March 2017, with regression coefficients measuring +0.077/yr and −0.087/yr for the first and second period, respectively. Hence, both temperature and salinity increase from September 2010 until the end of autumn 2016, when the warmest and saltiest conditions of the 2010–2020 decade are found. Since January 2017, Kongsfjorden has progressively become fresher and cooler. We argue that the extensive advection of warm and saline waters of Atlantic origin in 2016 and 2017 is the key factor explaining the observed temperature and salinity variability in the 2010–2020 decade. Our results show also that the near surface responds much more rapidly than the near bottom to changing conditions at this site.
The warmest and coldest months of the year exhibit different long-term tendencies: temperatures in SON have increased by approximately 2.1°C while MAM temperatures remain stable. These contrasting tendencies are linked to water masses variability in the inner Kongsfjord. Two of the three warmest years reported in Figure 4A (2016 and 2017) coincide with the presence of broad TAW and AW periods in the inner Kongsfjord. In contrast, the coolest SON temperatures are found in the first years of the series, when no “pure” AW is seen at MDI. Hence, TAW and AW advections played a key role in shaping such a large warming of the water column during the warmest months of the decade. As regards MAM temperatures, the apparent cooling in the latter years of the record is explained by the gradual decline in winter intrusions of Atlantic-type waters. Indeed, after the extensive AW intrusions in 2016 and 2017, a larger winter production of dense waters as LW and WCW occurred. Below 0°C depth-averaged temperatures in the coldest months reflect large fast-ice extents and thicknesses in the inner part of the fjord as in 2011, 2013, 2015, 2019, and 2020. The overall depth-averaged temperature evolution in the inner Kongsfjord thus is strictly connected with water masses variability and, especially, on intrusions of Atlantic-type waters. A comparison of depth-average temperatures in the coldest months of the year between the inner fjord (Figure 4) and the outer part (Cottier et al., 2019) reveals contrasting tendencies. What is causing this difference is an open question. A possible explanation may be that the warming of fjord’s waters is gradually enhancing the glaciers’ melting, releasing larger amounts of cold freshwaters in the inner fjord. Nonetheless, contrasting trends may also be explained by the different temporal periods considered in the two analyses. Even though the system has its own “memory” on a seasonal scale and exhibits different “scenarios” (Tverberg et al., 2019), the missing of a clear warming trend during the coldest months of the year suggests the absence of a long-term impact associated to the accumulation of warmer waters.
Intra-Seasonal Variability in Inner Kongsfjorden
Figure 5 reveals some important aspects of intra-seasonal water masses variability in inner Kongsfjorden. During years with broad AW intrusions, i.e., 2016, 2017, and 2019, AW at 85 m is always preceded by CAW by 10 weeks on average, whose arrival is nearly concomitant with the influx of TAW at 25 m. Being CAW denser than TAW, this clearly indicates the first arrival of stratified waters with Atlantic origin. In between June and July, MDI detects the arrival of pure AW at 85 m, while at 25 m TAW turns into IW revealing the first input of freshwaters into the system. Typically, AW lasts for more than a month in the lower part of the water column at depths never reaching 25 m. At shallower depths, IW is present during the whole AW period. Generally around mid-September, a sudden drop in salinity at both depths marks the transition from AW to TAW at the near-bottom and from IW to SW at the near-surface. At 25 m, salinity drops approximately by 1 unit in a few weeks reflecting the arrival of large freshwater volumes in the upper layers. TAW and SW last for the same period consistently each year. Later, alternating AW and TAW at 85 m and IW at 25 m characterise the end of both 2016 and 2017 AW intrusions, sometimes even protracting to the beginning of the following year. The arrival of SW might reflect the summer melting signal of the tidewater glaciers. Ocean temperatures had been observed to play the greatest role in ablating the front of Kongsfjorden’s tidewater glaciers through direct melting (Luckman et al., 2015; Holmes et al., 2019). Nonetheless, also air temperature strongly affects glacier drainage, which in summer begins once there is sufficient surface melt to warm the glacier snowpack to the melting point, allowing water to make its way downward to the subglacial drainage network (Lydersen et al., 2014). Establishing which of these two parameters is the principal driver of the observed variability is beyond the scope of the present work. The interesting aspect is that large volumes of SW are generally arriving at 25 m in September and typically persist for a few months, while the modelled peak in glacier meltwater discharge is occurring at the end of July (Scholzen et al., 2021). Meltwater pulses are also able to influence water characteristics close to the bottom: Figure 5 shows that AW at 85 m gives way to TAW. This indicates the mixing between AW and glacial meltwaters, appearing as a sensible decrease in salinity. However, a continuously growing temperature near the bottom confirms that AW advection has never stopped. Within some weeks, salinity rises suddenly to meet again AW requirements. The glacial meltwater influx in fjord waters is assumed to be a prerequisite for the intrusion of AW in Kongsfjorden in late summer-early autumn, as meltwaters tend to revert the density gradient between shelf and fjord waters disrupting the geostrophic control at fjord entrance (Cottier et al., 2005; Tverberg et al., 2019). However, data show that AW is present for several weeks at 85 m before the incoming of large amounts of SW at 25 m. Our hypothesis is that the small salinity reduction occurring at the beginning of each summer at both 25 m and 85 m may represent the actual first influx of meltwaters into the water column, which lowers the overall water column’s density and allows AW to enter in the fjord basin.
Figure 12 reports the vertically interpolated MDI temperatures over time, superimposed with CTD measurements conducted in the vicinity of MDI for visual comparison. Interpolated temperatures illustrate that the water column’s stratification undergoes four main phases. A first phase of substantial stratification starts in spring and summer, where the upper water column warms at a higher pace than the near bottom, probably as a result of heat gain from the atmosphere. A second phase occur at the time of AW intrusion in between summer and autumn (Sep-Oct). At the time of the most intense AW intrusions, i.e., in 2016, 2017, and 2019, AW occupies the whole observed column with fairly uniform temperatures above 4°C. The third phase began in mid to late autumn when temperatures decrease at shallower depths leaving a thermally stratified column with warmer waters at the near-bottom. Finally, a fourth phase characterises winter, when the coldest waters of the year are found, and the water column undergoes mixing through convection due to heat loss to the atmosphere. CTD profiles acquired at the time of MDI’s maintenance are in accordance with interpolated temperatures.
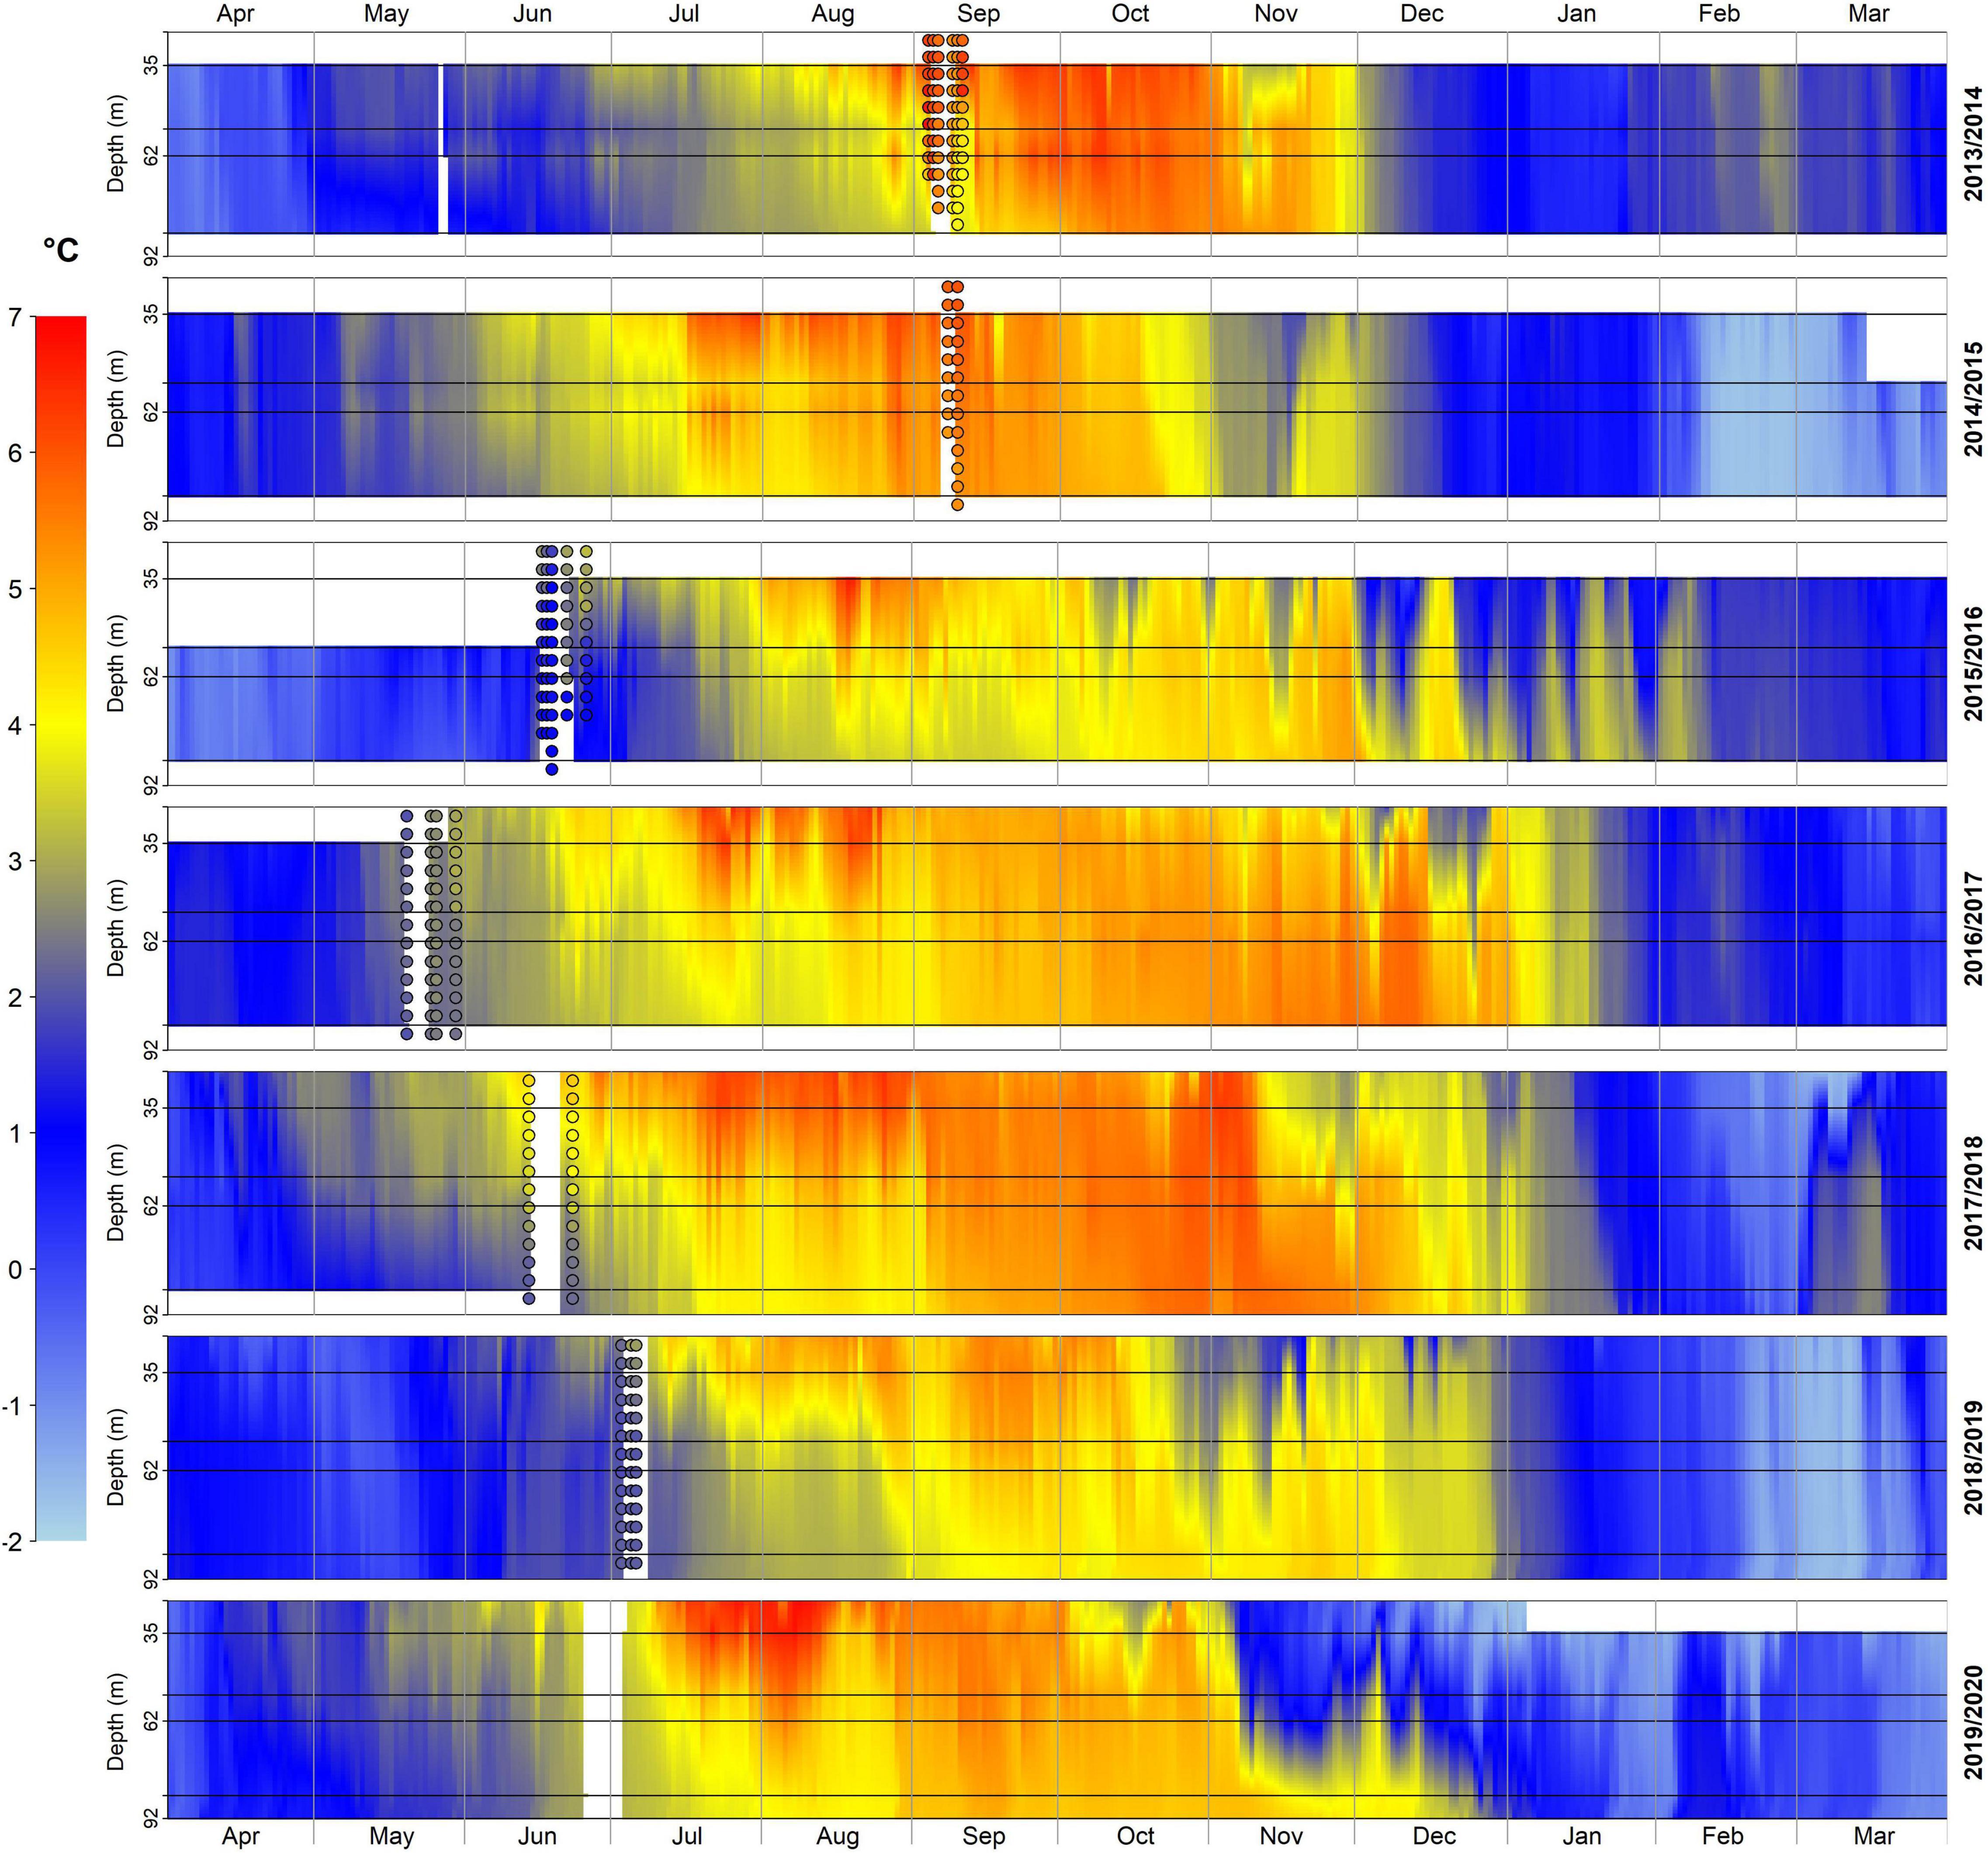
Figure 12. Vertically interpolated MDI temperatures from 25 to 92 m depth from April 2013 to March 2020. Only years with 3 or more operating sensors are considered. Horizontal black lines identify the measurements’ nominal depth. Coloured dots represent temperature data from CTD profiles conducted in the vicinity of MDI.
Characterisation of Winter Scenarios From Mooring Dirigibile Italia and Conductivity-Temperature-Depth Observations
We infer winter scenarios as defined by Tverberg et al. (2019) through MDI and summer CTD data. The specific location of MDI demands few initial considerations regarding its observing capability. Comparing the position of the mooring to the transect defined in Tverberg et al. (2019) reveals that MDI can observe AW only if it intrudes above 100 m depth. Hence, summer AW intrusions near Kongsfjordrenna’s bottom following a Winter Intermediate winter cannot be detected, while intrusions following a Winter Open and Winter Deep winter are sometimes difficult to discern. Nevertheless, MDI winter observations can help to discern between the two scenarios: Winter Open features very shallow winter AW intrusions whereas Winter Deep is associated with deep convection and a homogeneously cold water column. The same arguments are valid also for CTD data since stations are all set in inner Kongsfjorden at depths never exceeding 120 m, except in a few cases.
Tverberg et al. (2019) links summer 2010 to a Winter Intermediate scenario. CTD measurements as well as MDI observations at 85 m confirm the absence of AW in summer. Winter 2011 is classified as a Winter Deep scenario, where summer AW intrusions occur at intermediate depth. MDI reveals the occurrence of extensive periods of IW at 85 m, even though TAW is present for some days in late autumn. The absence of waters with a clear Atlantic origin indicates that the summer AW intrusion should have occurred below 100 m depth and did not reach the fjord’s interior. Winters 2012, 2013, and 2014 are categorised as Winter Open winters, where AW intrusions occur close to the surface. TAW was indeed seen in summer 2012 (for a few weeks), 2013 and 2014 in both mooring and CTD data. Winters 2015 and 2016 have been identified as a Winter Deep scenario. Mooring and CTD observations reveal the extensive presence of waters with Atlantic origin in the inner Kongsfjord, thus suggesting that summer AW intrusions at intermediate depths typical of a winter deep scenario can reach the inner basin of Kongsfjorden. However, a clear difference exists between the 2 years: winter 2015 features LW and WCW supporting the occurrence of convective phenomena, whereas winter 2016 shows the presence of TAW and CAW. Winter 2016 thus is closer to a Winter Open scenario rather than Winter Deep.
A classification is proposed for the most recent years. The 2017 mean CTD profile reveals the presence of AW above 75 m and CAW below it. MDI observations consistently show that AW persists at 85 m in summer and autumn. This summer is not resulting from a Winter Intermediate scenario as AW occupies the inner fjord. In our opinion, winter 2017 is much closer to a Winter Open than a Winter Deep scenario since CAW and TAW are recognised at very shallow depths even in winter. We propose that the years 2018, 2019 and 2020 correspond to Winter Deep scenarios, where warm waters intrude into the fjord in summer at intermediate levels and convection occurs in winter. MDI data reveals that each summer is characterised by intrusions of Atlantic-type waters (AW and TAW) at 85 m and they did not reach 25 m except in spring 2019. In addition, winters have a homogeneously cold water column featuring LW and WCW at both 25 m and 85 m.
The proposed winter scenarios in the 2010–2020 decade are put into perspective with those suggested by Tverberg et al. (2019) in the 1994–2016 time interval. Winter Intermediate and Winter Deep winters characterise years through mid 1990s to mid 2000s, while successive years show the prevalence of Winter Open and Winter Deep winters, associated with depleted sea-ice conditions in inner Kongsfjorden (Gerland et al., 2020). In line with these evidences, Tverberg et al. (2019) suggested that Kongsfjorden transitioned from an Arctic-type fjord, featuring winter sea-ice and summer intrusions of AW confined to the deeper half of the water column, to an Atlantic-type fjord, characterised by frequent extensive shallow AW intrusions in summer and autumn and occasionally also in winter. Similarly, Isfjorden, i.e., the second largest fjord in West Spitsbergen, had undergone the same transition (Skogseth et al., 2020). The massive inflow of AW in winter 2006 (Cottier et al., 2007) has been suggested to be a tipping point for both Kongsfjorden and Isfjorden. Our observations spanning the 2010–2020 decade are consistent with previous evidence. Indeed, this decade has been dominated by Winter Open and Deep winters, summer AW intrusions at 85 m depth every year since 2012 and almost biannually also in winter, as inferred by the presence of local temperature maxima in this season. Therefore, Kongsfjorden has been clearly characterised by an Atlantic regime in the 2010–2020 decade.
Long-Term Variability in Inner Kongsfjorden and Large-Scale Dynamics
The long-term variability observed in inner Kongsfjorden is put into perspective with the WSC meridional temperature transport (H), displayed in Figure 13. A linear regression change point analysis is conducted on H.
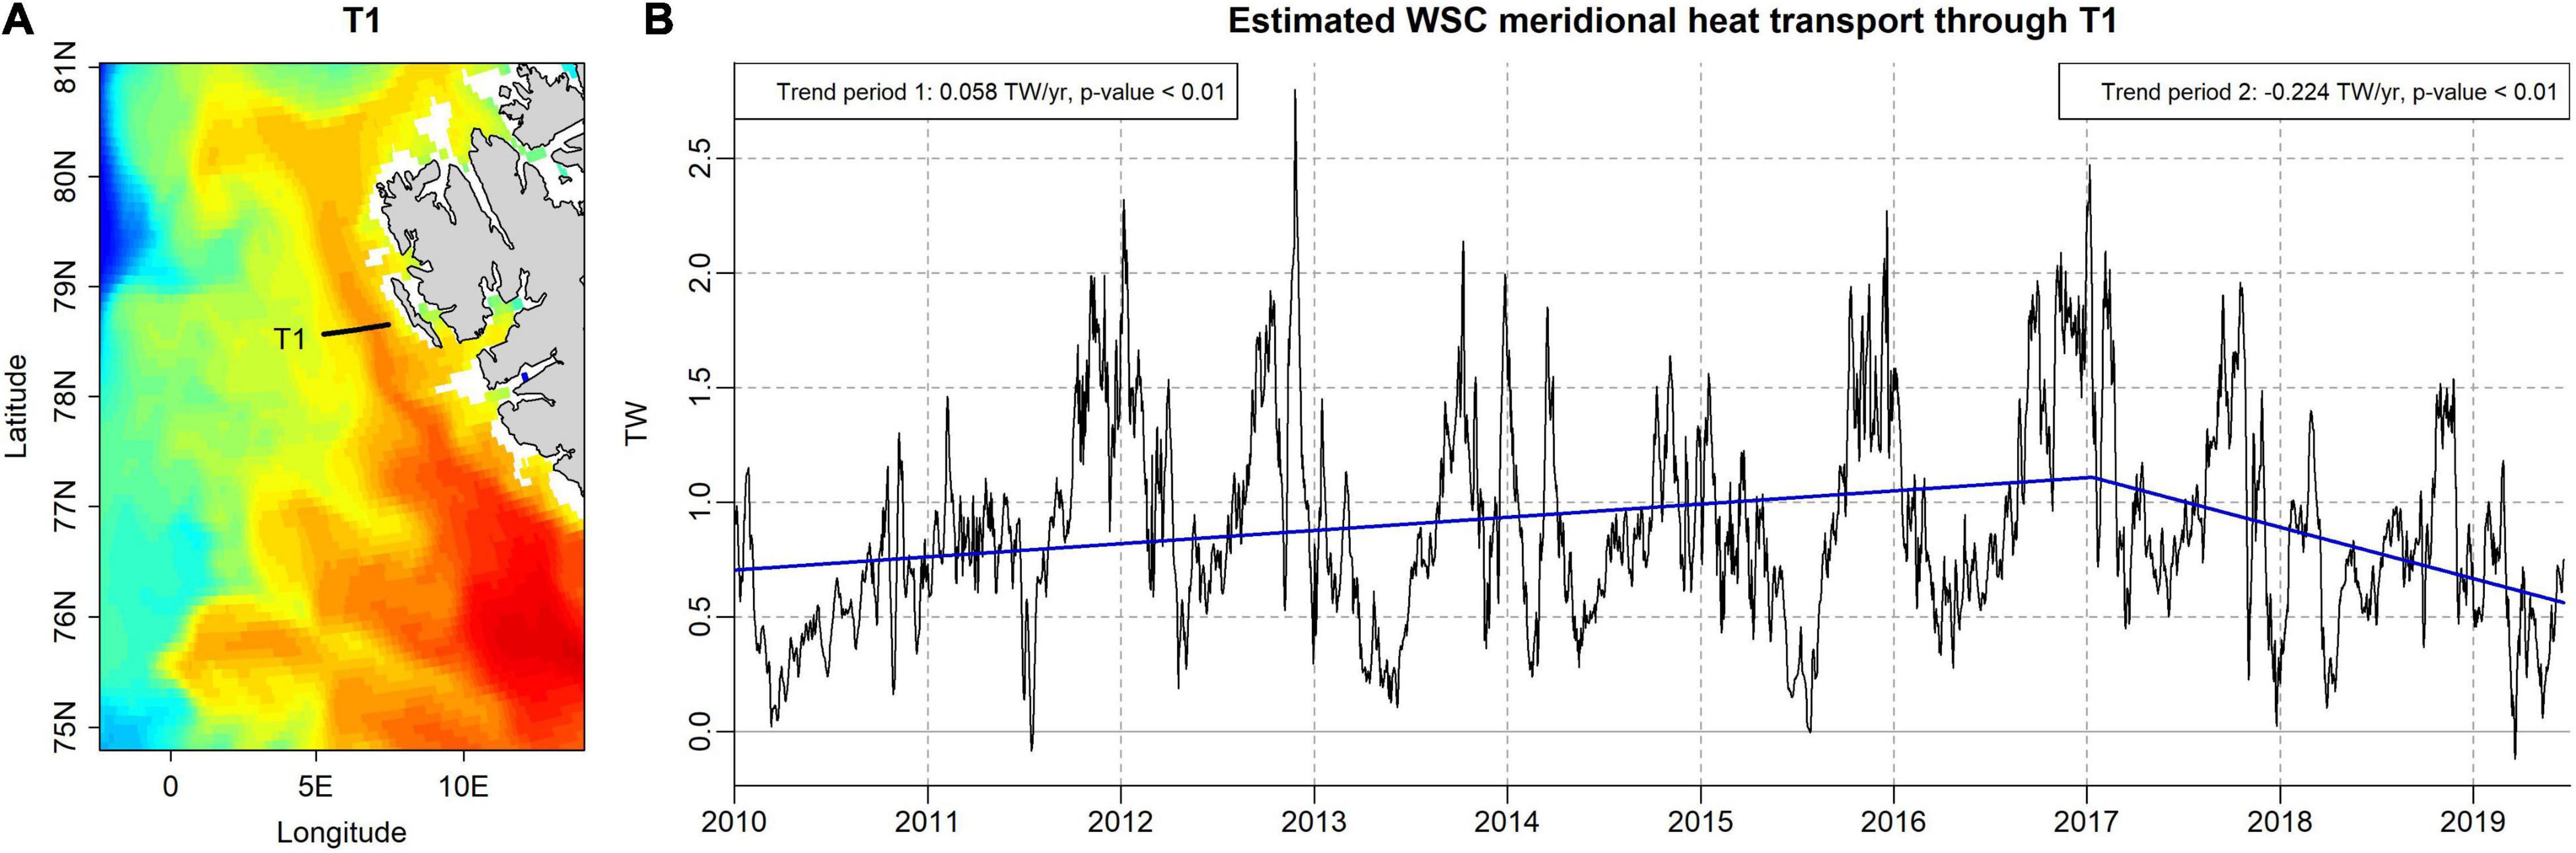
Figure 13. (A) Geographical representation of transect T1 over the average potential temperature at 92 m depth in October 2018. (B) Estimated daily WSC meridional temperature transport through T1 (black) and predicted linear regression values (blue).
H exhibits a strong seasonality, with maximum values occurring at the end of autumn. A linear regression change point is found in early January 2017. From 2010 to December 2016, H increased at a rate of +0.058 TW yr–1 whereas, starting from January 2017, it decreased faster at −0.224 TW yr–1. This result agrees with previous works. Merchel and Walczowski (2020) found that, using summer CTD profiles acquired along a transect positioned southward than T1 at 76°30′N, the surface (0–500 m depth) WSC temperature had increased in the 1997–2016 period. This warming is characterising the 2010–2016 period as well. Athanase et al. (2021) observed a warming of the AW in the WSC north of Svalbard over the 2008–2020 period and a considerable freshening in 2017–2020 using CTD and mooring data in addition to CMEMS reanalyses. They further hypothesised the extreme fresh anomalies observed in 2012–2018 in the upstream North Atlantic and Norwegian sea (Mork et al., 2019; Holliday et al., 2020) to be responsible of the WSC freshening. The variability of H is analogous to the one of water temperature anomalies at MDI represented in Figure 11, where a linear trend change point is found in early 2017 as well. Furthermore, the largest values of H are observed in 2016 and 2017, years characterised by the warmest and most saline conditions in inner Kongsfjorden resulting from extensive advection of AW and TAW. Although single intrusions of Atlantic-type waters are associated with dynamical events on the shelf, the long-lasting presence of more “pure” AW in 2016 and 2017 appears to be explained by the variability in the WSC meridional temperature transport. Thus, in a long term perspective, marine conditions in inner Kongsfjorden are likely influenced by the WSC northward temperature transport from lower latitudes.
Conclusion
We addressed the atlantification of Kongsfjorden in the 2010–2020 decade by inspecting long-term modifications in water properties and water masses variability through mooring data and summer CTD surveys. Overall, atlantification in this fjord has emerged as an increasing heat and salinity of the water column, resulting from enhanced advection of Atlantic waters from the WSC. The two longest temperature series spanning the whole decade show a positive trend during the whole observational period (0.13°C/yr and 0.06°C/yr at 35 and 85 m depth, respectively). Depth-averaged temperatures in the inner fjord have increased by 0.26°C/yr in the warmest months of the year, whereas they appear relatively stable in the coldest months. Salinity at 85 m has increased at a rate of 0.03 units per years. Despite the net increase in temperature and salinity during the observed decade, a linear regression change point is found in both parameters in January 2017, with latter years featuring decreasing values. These peculiar evolutions are coherent with the observed water masses variability. Highly diluted AW is found at the beginning of the decade, which gives way to more and more pure AW culminating in extensive intrusions in 2016 and 2017. Accordingly, the period between autumn 2016 and winter 2017 features the warmest and most saline conditions of the entire decade in inner Kongsfjorden. After 2017, the water column slightly cools and freshens and AW intrusions occur only in summer and autumn. The arrival of warm and saline waters in between June and July usually precede the discharge of large freshwater volumes close to the surface from mid-September. This evidence could represent the glaciers’ melting signal, triggered by the intrusion of warm waters, even though air temperature can also play an important role. Similarly to the case of Isfjorden, winters in this decade were dominated by Winter Open and Winter Deep scenarios with low or no sea-ice coverages and intermediate-shallow intrusions of Atlantic Waters, while years before 2006 featured more Winter Deep and Winter Intermediate winters with extended sea-ice, occasional deep AW intrusions and low temperatures. Thus, our observations confirm that Kongsfjorden has transitioned to an Atlantic-type fjord, featuring depleted sea ice conditions and rather regular shallow intrusions of AW reaching the inner fjord in summer and frequently also in winter, as previously suggested in the literature (Tverberg et al., 2019). Although single intrusions of Atlantic-type waters are generally associated to the horizontal density gradient and intense wind events on the shelf, the long-term local temperature variability is consistent with the WSC northward temperature transport evolution in the 2010–2020 decade. The WSC thus has profoundly driven local conditions in the inner fjord in this decade.
Particular attention should be drawn to understand the modifications that the AW layer undergoes once it floods the continental shelf and fjords. Indeed, still a little is known about the overall impact of AW intrusions in Kongsfjorden and West Spitsbergen fjords on the total amount of heat carried by the WSC to the central Arctic basin. Since AW and the WSC have been observed to be amongst the most important sources of heat to the Arctic, a comprehensive understanding of their modifications occurring along the Western Spitsbergen is of valuable importance to predict the future of the Arctic Ocean. Long-term oceanographic monitoring systems such as MDI are extremely valuable to this purpose, detecting current modifications in marine polar regions and supporting predictions of their future evolution. In this work, the availability of 10 years of continuous oceanographic measurements allowed the investigation of the main impacts of atlantification in the inner part of Kongsfjorden. The continuous functioning of MDI and other Arctic moorings ensures a data flow of considerable importance for examining climate change impacts on high latitude regions.
Data Availability Statement
The datasets presented in this study can be found in online repositories. The names of the repository/repositories and accession number(s) can be found below: Mooring and CTD data acquired by CNR are available at the Italian Arctic Data Center (IADC) web portal, upon request (http://iadc.cnr.it/cnr/). The field activities were based at the Arctic Station “Dirigibile Italia,” managed by the Dipartimento di Scienze del Sistema Terra e Tecnologie per l’Ambiente (DSSTTA) and by the Institute of Polar Sciences (ISP) of CNR. Sea ice data in Kongsfjorden are available at https://data.npolar.no/dataset/74c7b236-b94d-48c5-a665-ffcd54e8e1b7. CMEMS global oceanic reanalysis products are available at https://resources. marine.copernicus.eu/?option=com_csw&view=details&product _id=GLOBAL_ REANALYSIS_PHY_001_030.
Author Contributions
FD wrote the manuscript, prepared the figures, and analysed the dataset. JC and LL supervised the writing of the text. FD, JC, and LL had the initial idea of the study and carried out the preliminary data analysis. SA, FG, LL, and SM participated to the fieldwork and laboratory analyses. KS edited the text and helped with some specific aspects of the manuscript. All authors contributed to the article and approved the submitted version.
Conflict of Interest
The authors declare that the research was conducted in the absence of any commercial or financial relationships that could be construed as a potential conflict of interest.
Publisher’s Note
All claims expressed in this article are solely those of the authors and do not necessarily represent those of their affiliated organizations, or those of the publisher, the editors and the reviewers. Any product that may be evaluated in this article, or claim that may be made by its manufacturer, is not guaranteed or endorsed by the publisher.
Acknowledgments
We would like to thank the CNR Arctic Station Dirigibile Italia and Kings Bay AS for logistic support. The linear trend change point analysis is conducted using the “segmented” R package (Muggeo, 2008). Maps in Figure 1 have been created using the “PlotSvalbard” R package (Vihtakari, 2020). CTD sections are calculated through the “Ocean Data View” software (Schlitzer, 2018). All remaining figures use colorblind accessible palettes from “RColorBrewer” and “viridis” R packages.
Supplementary Material
The Supplementary Material for this article can be found online at: https://www.frontiersin.org/articles/10.3389/fmars.2022.741075/full#supplementary-material
Abbreviations
AW, Atlantic water; AMJ, April-May-June; ArW, Arctic water; CAW, Cooled Atlantic Water; CNR, National Research Council of Italy; IW, Intermediate Water; JAS, July-August-September; JFM, January-February-March; LW, Local Water; MAM, March-April-May; MDI, Mooring Dirigibile Italia; OND, October-November-December; RMSD, residual mean squared deviations; SON, September-October-November; SPC, Spitsbergen Polar Current; SW, Surface Water; TAW, Transformed Atlantic Water; WCW, Winter Cooled Water; WSC, West Spitsbergen Current; WSS, West Spitsbergen Shelf.
References
Aliani, S., Sciascia, R., Conese, I., D’Angelo, A., Del Bianco, F., Giglio, F., et al. (2016). Characterization of seawater properties and ocean heat content in Kongsfjorden, Svalbard Archipelago. Rendiconti Lincei 27, 155–162.
Andersen, J. K., Andreassen, L. M., Baker, E. H., Ballinger, T. J., Berner, L. T., Bernhard, G. H., et al. (2020). The Arctic. Bull. Am. Meteorol. Soc. 101, S239–S286.
Årthun, M., Eldevik, T., Smedsrud, L. H., Skagseth, Ø, and Ingvaldsen, R. B. (2012). Quantifying the influence of Atlantic heat on Barents Sea ice variability and retreat. J. Clim. 25, 4736–4743.
Athanase, M., Provost, C., Artana, C., Pérez-Hernández, M. D., Sennéchael, N., Bertosio, C., et al. (2021). Changes in Atlantic water circulation patterns and volume transports north of Svalbard over the last 12 years (2008–2020). J. Geophys. Res. Oceans 126:e2020JC016825.
Cantoni, C., Hopwood, M. J., Clarke, J. S., Chiggiato, J., Achterberg, E. P., and Cozzi, S. (2020). Glacial drivers of marine biogeochemistry indicate a future shift to more corrosive conditions in an Arctic fjord. J. Geophys. Res. Biogeosci. 125:e2020JG005633.
Cottier, F., Skogseth, R., David, D., and Berge, J. (2019). “Temperature time-series in Svalbard fjords. A contribution from the “Integrated Marine Observatory Partnership(iMOP)”,” in The e State of Environmental Science in Svalbard report 2018, eds E. Orr, G. Hansen, H. Lappalainen, C. Hübner, and H. Lihavainen (Longyearbyen: Svalbard Integrated Arctic Earth Observing System), 108–118.
Cottier, F., Tverberg, V., Inall, M., Svendsen, H., Nilsen, F., and Griffiths, C. (2005). Water mass modification in an Arctic fjord through cross-shelf exchange: the seasonal hydrography of Kongsfjorden, Svalbard. J. Geophys. Res. Oceans 110, C12005.
Cottier, F. R., Nilsen, F., Inall, M. E., Gerland, S., Tverberg, V., and Svendsen, H. (2007). Wintertime warming of an Arctic shelf in response to large-scale atmospheric circulation. Geophys. Res. Lett. 34:L10607.
D’Angelo, A., Giglio, F., Miserocchi, S., Sanchez-Vidal, A., Aliani, S., Tesi, T., et al. (2018). Multi-year particle fluxes in Kongsfjorden, Svalbard. Biogeosciences 15, 5343–5363.
Gerland, S., and Pavlova, O. (2020). Sea Ice Coverage in Inner Kongsfjorden, Svalbard, 2003-2019, Version 1.0 [Data set]. Tromsø: Norwegian Polar Institute. doi: 10.21334/npolar.2020.74c7b236
Gerland, S., Pavlova, O., Divine, D., Negrel, J., Dahlke, S., Johansson, A. M., et al. (2020). “Long-term monitoring of landfast sea ice extent and thickness in Kongsfjorden, and related applications (FastIce),” in SESS Report 2019, eds F. Van den Heuvel, C. Hübner, M. Błaszczyk, M. Heimann, and H. Lihavainen (Longyearbyen: Svalbard Integrated Arctic Earth Observing System), 160–167.
Global Monitoring and Forecasting Center. (2018). GLORYS12V1 - Global Ocean Physical Reanalysis Product, E.U. Copernicus Marine Service Information [Data set]. Available online at: https://resources.marine.copernicus.eu/?option=com_csw&view=details&product_id=GLOBAL_REANALYSIS_PHY_001_030 (accessed December 1, 2020).
Goszczko, I., Ingvaldsen, R. B., and Onarheim, I. H. (2018). Wind-driven cross-shelf exchange—West Spitsbergen current as a source of heat and salt for the adjacent shelf in Arctic winters. J. Geophys. Res. Oceans 123, 2668–2696.
Hall, M. M., and Bryden, H. L. (1982). Direct estimates and mechanisms of ocean heat transport. Deep Sea Res. Part A Oceanogr. Res. Papers 29, 339–359. doi: 10.1016/0198-0149(82)90099-1
Hegseth, E. N., and Tverberg, V. (2013). Effect of Atlantic water inflow on timing of the phytoplankton spring bloom in a high Arctic fjord (Kongsfjorden, Svalbard). J. Mar. Syst. 113, 94–105.
Helland-Hansen, B., and Nansen, F. (1909). The Norwegian Sea: Its Physical Oceanography Based Upon the Norwegian Researches 1900-1904. Oslo: Det Mallingske bogtrykkeri.
Holliday, N. P., Bersch, M., Berx, B., Chafik, L., Cunningham, S., Florindo-López, C., et al. (2020). Ocean circulation causes the largest freshening event for 120 years in eastern subpolar North Atlantic. Nat. Commun. 11, 1–15. doi: 10.1038/s41467-020-14474-y
Holmes, F. A., Kirchner, N., Kuttenkeuler, J., Krützfeldt, J., and Noormets, R. (2019). Relating ocean temperatures to frontal ablation rates at Svalbard tidewater glaciers: insights from glacier proximal datasets. Sci. Rep. 9, 1–11. doi: 10.1038/s41598-019-45077-3
Inall, M. E., Nilsen, F., Cottier, F. R., and Daae, R. (2015). Shelf/fjord exchange driven by coastal-trapped waves in the Arctic. J. Geophys. Res. Oceans 120, 8283–8303. doi: 10.1002/2015JC011277
Kim, B. M., Hong, J. Y., Jun, S. Y., Zhang, X., Kwon, H., Kim, S. J., et al. (2017). Major cause of unprecedented Arctic warming in January 2016: critical role of an Atlantic windstorm. Sci. Rep. 7, 1–9. doi: 10.1038/srep40051
Klinck, J. M., O’Brien, J. J., and Svendsen, H. (1981). A simple model of fjord and coastal circulation interaction. J. Phys. Oceanogr. 11, 1612–1626.
Lind, S., Ingvaldsen, R. B., and Furevik, T. (2018). Arctic warming hotspot in the northern Barents Sea linked to declining sea-ice import. Nat. Clim. Change 8, 634–639. doi: 10.1038/s41558-018-0205-y
Luckman, A., Benn, D. I., Cottier, F., Bevan, S., Nilsen, F., and Inall, M. (2015). Calving rates at tidewater glaciers vary strongly with ocean temperature. Nat. Commun. 6, 1–7. doi: 10.1038/ncomms9566
Lydersen, C., Assmy, P., Falk-Petersen, S., Kohler, J., Kovacs, K. M., Reigstad, M., et al. (2014). The importance of tidewater glaciers for marine mammals and seabirds in Svalbard, Norway. J. Mar. Syst. 129, 452–471. doi: 10.1016/j.jmarsys.2013.09.006
Mayer, M., Tietsche, S., Haimberger, L., Tsubouchi, T., Mayer, J., and Zuo, H. (2019). An improved estimate of the coupled Arctic energy budget. J. Clim. 32, 7915–7934. doi: 10.1175/jcli-d-19-0233.1
Merchel, M., and Walczowski, W. (2020). Increases in the temperature and salinity of deep and intermediate waters in the West Spitsbergen Current region in 1997–2016. Oceanologia 62, 501–510.
Mork, K. A., Skagseth, Ø, and Søiland, H. (2019). Recent warming and freshening of the Norwegian Sea observed by Argo data. J. Clim. 32, 3695–3705. doi: 10.1175/jcli-d-18-0591.1
Muggeo, V. M. (2008). Segmented: an R package to fit regression models with broken-line relationships. R News 8, 20–25.
Nilsen, F., Skogseth, R., Vaardal-Lunde, J., and Inall, M. (2016). A simple shelf circulation model: intrusion of Atlantic Water on the West spitsbergen shelf. J. Phys. Oceanogr. 46, 1209–1230.
Onarheim, I. H., Smedsrud, L. H., Ingvaldsen, R. B., and Nilsen, F. (2014). Loss of sea ice during winter north of Svalbard. Tellus 66:23933. doi: 10.3402/tellusa.v66.23933
Overland, J. E., and Wang, M. (2016). Recent extreme Arctic temperatures are due to a split polar vortex. J. Clim. 29, 5609–5616.
Pavlov, A. K., Tverberg, V., Ivanov, B. V., Nilsen, F., Falk-Petersen, S., and Granskog, M. A. (2013). Warming of Atlantic Water in two west Spitsbergen fjords over the last century (1912–2009). Polar Res. 32:11206.
Pavlova, O., Gerland, S., and Hop, H. (2019). “Changes in sea-ice extent and thickness in Kongsfjorden, Svalbard (2003–2016),” in The Ecosystem of Kongsfjorden, Svalbard, eds H. Hop and C. Wiencke (Cham: Springer), 105–136. doi: 10.1007/978-3-319-46425-1_4
Payne, C. M., and Roesler, C. S. (2019). Characterizing the influence of Atlantic water intrusion on water mass formation and phytoplankton distribution in Kongsfjorden, Svalbard. Cont. Shelf Res. 191:104005. doi: 10.1016/j.csr.2019.104005
Polyakov, I. V., Beszczynska, A., Carmack, E. C., Dmitrenko, I. A., Fahrbach, E., Frolov, I. E., et al. (2005). One more step toward a warmer Arctic. Geophys. Res. Lett. 32:L17605.
Polyakov, I. V., Pnyushkov, A. V., Alkire, M. B., Ashik, I. M., Baumann, T. M., Carmack, E. C., et al. (2017). Greater role for Atlantic inflows on sea-ice loss in the Eurasian Basin of the Arctic Ocean. Science 356, 285–291. doi: 10.1126/science.aai8204
Rodgers, J. L., and Nicewander, W. A. (1988). Thirteen ways to look at the correlation coefficient. Am. Stat. 42, 59–66. doi: 10.2307/2685263
Saloranta, T. M., and Haugan, P. M. (2004). Northward cooling and freshening of the warm core of the West Spitsbergen current. Polar Res. 23, 79–88. doi: 10.3402/polar.v23i1.6268
Saloranta, T. M., and Svendsen, H. (2001). Across the Arctic front west of Spitsbergen: high-resolution CTD sections from 1998–2000. Polar Res. 20, 177–184. doi: 10.3402/polar.v20i2.6515
Schlitzer, R. (2018). Ocean Data View. Available online at: https://odv.awi.de (accessed January 2021).
Scholzen, C., Schuler, T. V., and Gilbert, A. (2021). Sensitivity of subglacial drainage to water supply distribution at the Kongsfjord basin, Svalbard. Cryosphere 15, 2719–2738. doi: 10.5194/tc-15-2719-2021
Skogseth, R., Olivier, L. L., Nilsen, F., Falck, E., Fraser, N., Tverberg, V., et al. (2020). Variability and decadal trends in the Isfjorden (Svalbard) ocean climate and circulation–an indicator for climate change in the European Arctic. Prog. Oceanogr. 187:102394. doi: 10.1016/j.pocean.2020.102394
Sundfjord, A., Albretsen, J., Kasajima, Y., Skogseth, R., Kohler, J., Nuth, C., et al. (2017). Effects of glacier runoff and wind on surface layer dynamics and Atlantic Water exchange in Kongsfjorden, Svalbard; a model study. Estuar. Coast. Shelf Sci. 187, 260–272. doi: 10.1016/j.ecss.2017.01.015
Svendsen, H., Beszczynska-Møller, A., Hagen, J. O., Lefauconnier, B., Tverberg, V., Gerland, S., et al. (2002). The physical environment of kongsfjorden–krossfjorden, an Arctic fjord system in Svalbard. Polar Res. 21, 133–166. doi: 10.3402/polar.v21i1.6479
Tsubouchi, T., Våge, K., Hansen, B., Larsen, K. M. H., Østerhus, S., Johnson, C., et al. (2021). Increased ocean heat transport into the Nordic Seas and Arctic Ocean over the period 1993–2016. Nat. Clim. Change 11, 21–26. doi: 10.1038/s41558-020-00941-3
Tverberg, V., Skogseth, R., Cottier, F., Sundfjord, A., Walczowski, W., Inall, M. E., et al. (2019). “The Kongsfjorden transect: seasonal and inter-annual variability in hydrography,” in The Ecosystem of Kongsfjorden, Svalbard, eds H. Hop and C. Wiencke (Cham: Springer), 49–104. doi: 10.1007/978-3-319-46425-1_3
Vihtakari, M. (2020). PlotSvalbard: PlotSvalbard - Plot Research Data From Svalbard on Maps. R Package Version 0.9.2. Available online at: https://github.com/MikkoVihtakari/PlotSvalbard (accessed January 2021).
Vihtakari, M., Welcker, J., Moe, B., Chastel, O., Tartu, S., Hop, H., et al. (2018). Black-legged kittiwakes as messengers of Atlantification in the Arctic. Sci. Rep. 8, 1–11. doi: 10.1038/s41598-017-19118-8
Keywords: atlantification, Kongsfjorden, Svalbard, water masses characterisation, temperature and salinity trends, Atlantic water intrusion
Citation: De Rovere F, Langone L, Schroeder K, Miserocchi S, Giglio F, Aliani S and Chiggiato J (2022) Water Masses Variability in Inner Kongsfjorden (Svalbard) During 2010–2020. Front. Mar. Sci. 9:741075. doi: 10.3389/fmars.2022.741075
Received: 14 July 2021; Accepted: 03 January 2022;
Published: 27 January 2022.
Edited by:
Ming Li, University of Maryland Center for Environmental Science (UMCES), United StatesReviewed by:
Yun Li, University of Delaware, United StatesJian Zhao, University of Maryland Center for Environmental Science (UMCES), United States
Copyright © 2022 De Rovere, Langone, Schroeder, Miserocchi, Giglio, Aliani and Chiggiato. This is an open-access article distributed under the terms of the Creative Commons Attribution License (CC BY). The use, distribution or reproduction in other forums is permitted, provided the original author(s) and the copyright owner(s) are credited and that the original publication in this journal is cited, in accordance with accepted academic practice. No use, distribution or reproduction is permitted which does not comply with these terms.
*Correspondence: Jacopo Chiggiato, jacopo.chiggiato@cnr.it