Effect of Ecological Recovery on Macrophyte Dominance and Production in the Venice Lagoon
 Adriano Sfriso1*
  Alessandro Buosi1
  Katia Sciuto1,2
  Marion Wolf1,2
  Yari Tomio1
  Abdul-Salam Juhmani1 Andrea Augusto Sfriso2
- 1Department of Environmental Sciences, Informatics and Statistics, University Ca’ Foscari of Venice, Venice, Italy
- 2Department of Chemical, Pharmaceutical and Agricultural Sciences, University of Ferrara, Ferrara, Italy
In the last decade, the Venice Lagoon showed a significant environmental recovery that changed the assemblages of macroalgal and aquatic angiosperm dominant species and significantly increased the primary production. The decreasing of anthropogenic impacts, such as eutrophication and clam harvesting, favored a strong reduction of Ulvaceae, replaced by species with higher ecological value, and the recolonization of aquatic angiosperms. Consequently, hypo-anoxic conditions, once frequently occurring in the lagoon, have been considerably reduced and aquatic angiosperms have recolonized the area, covering 94.8 km2 in comparison to the 55.9 km2 recorded in 2003 (+70%). Cymodocea nodosa, Zostera marina, and Zostera noltei expanded by 37.5%, 44.6%, and 191%, respectively, with a significant increase in biomass and primary production. In late spring 2018, angiosperms showed a standing crop of approximately 372 ktonnes (+77%) and a net primary production of approximately 1189 ktonnes FW (+67%). In the meantime, Ruppia cirrhosa, which since the 1980s had disappeared from the lagoon areas subjected to tidal expansion, but was still present in some fishing valleys, recolonized the bottoms of the northern lagoon with meadows of over 6 km2; this accounted for a standing crop and net primary production of 8.9 and 18.0 ktonnes, respectively. Based on surveys carried out in 2021, ecological conditions are still improving, and this is increasing both the biodiversity and the production of macroalgae and aquatic angiosperms.
1 Introduction
The Venice Lagoon, with an area of 549 km2, is the largest transitional water system (TWS) in the Mediterranean Sea (Figure 1). The number of TWS in the Mediterranean is very high; there are 209 basins with an area >0.25 km2, for a total surface of approximately 2230 km2. The Venice Lagoon alone occupies approximately 25% of this area and approximately 39% of the Italian TWS surface (1398 km2) (Sfriso et al., 2017).
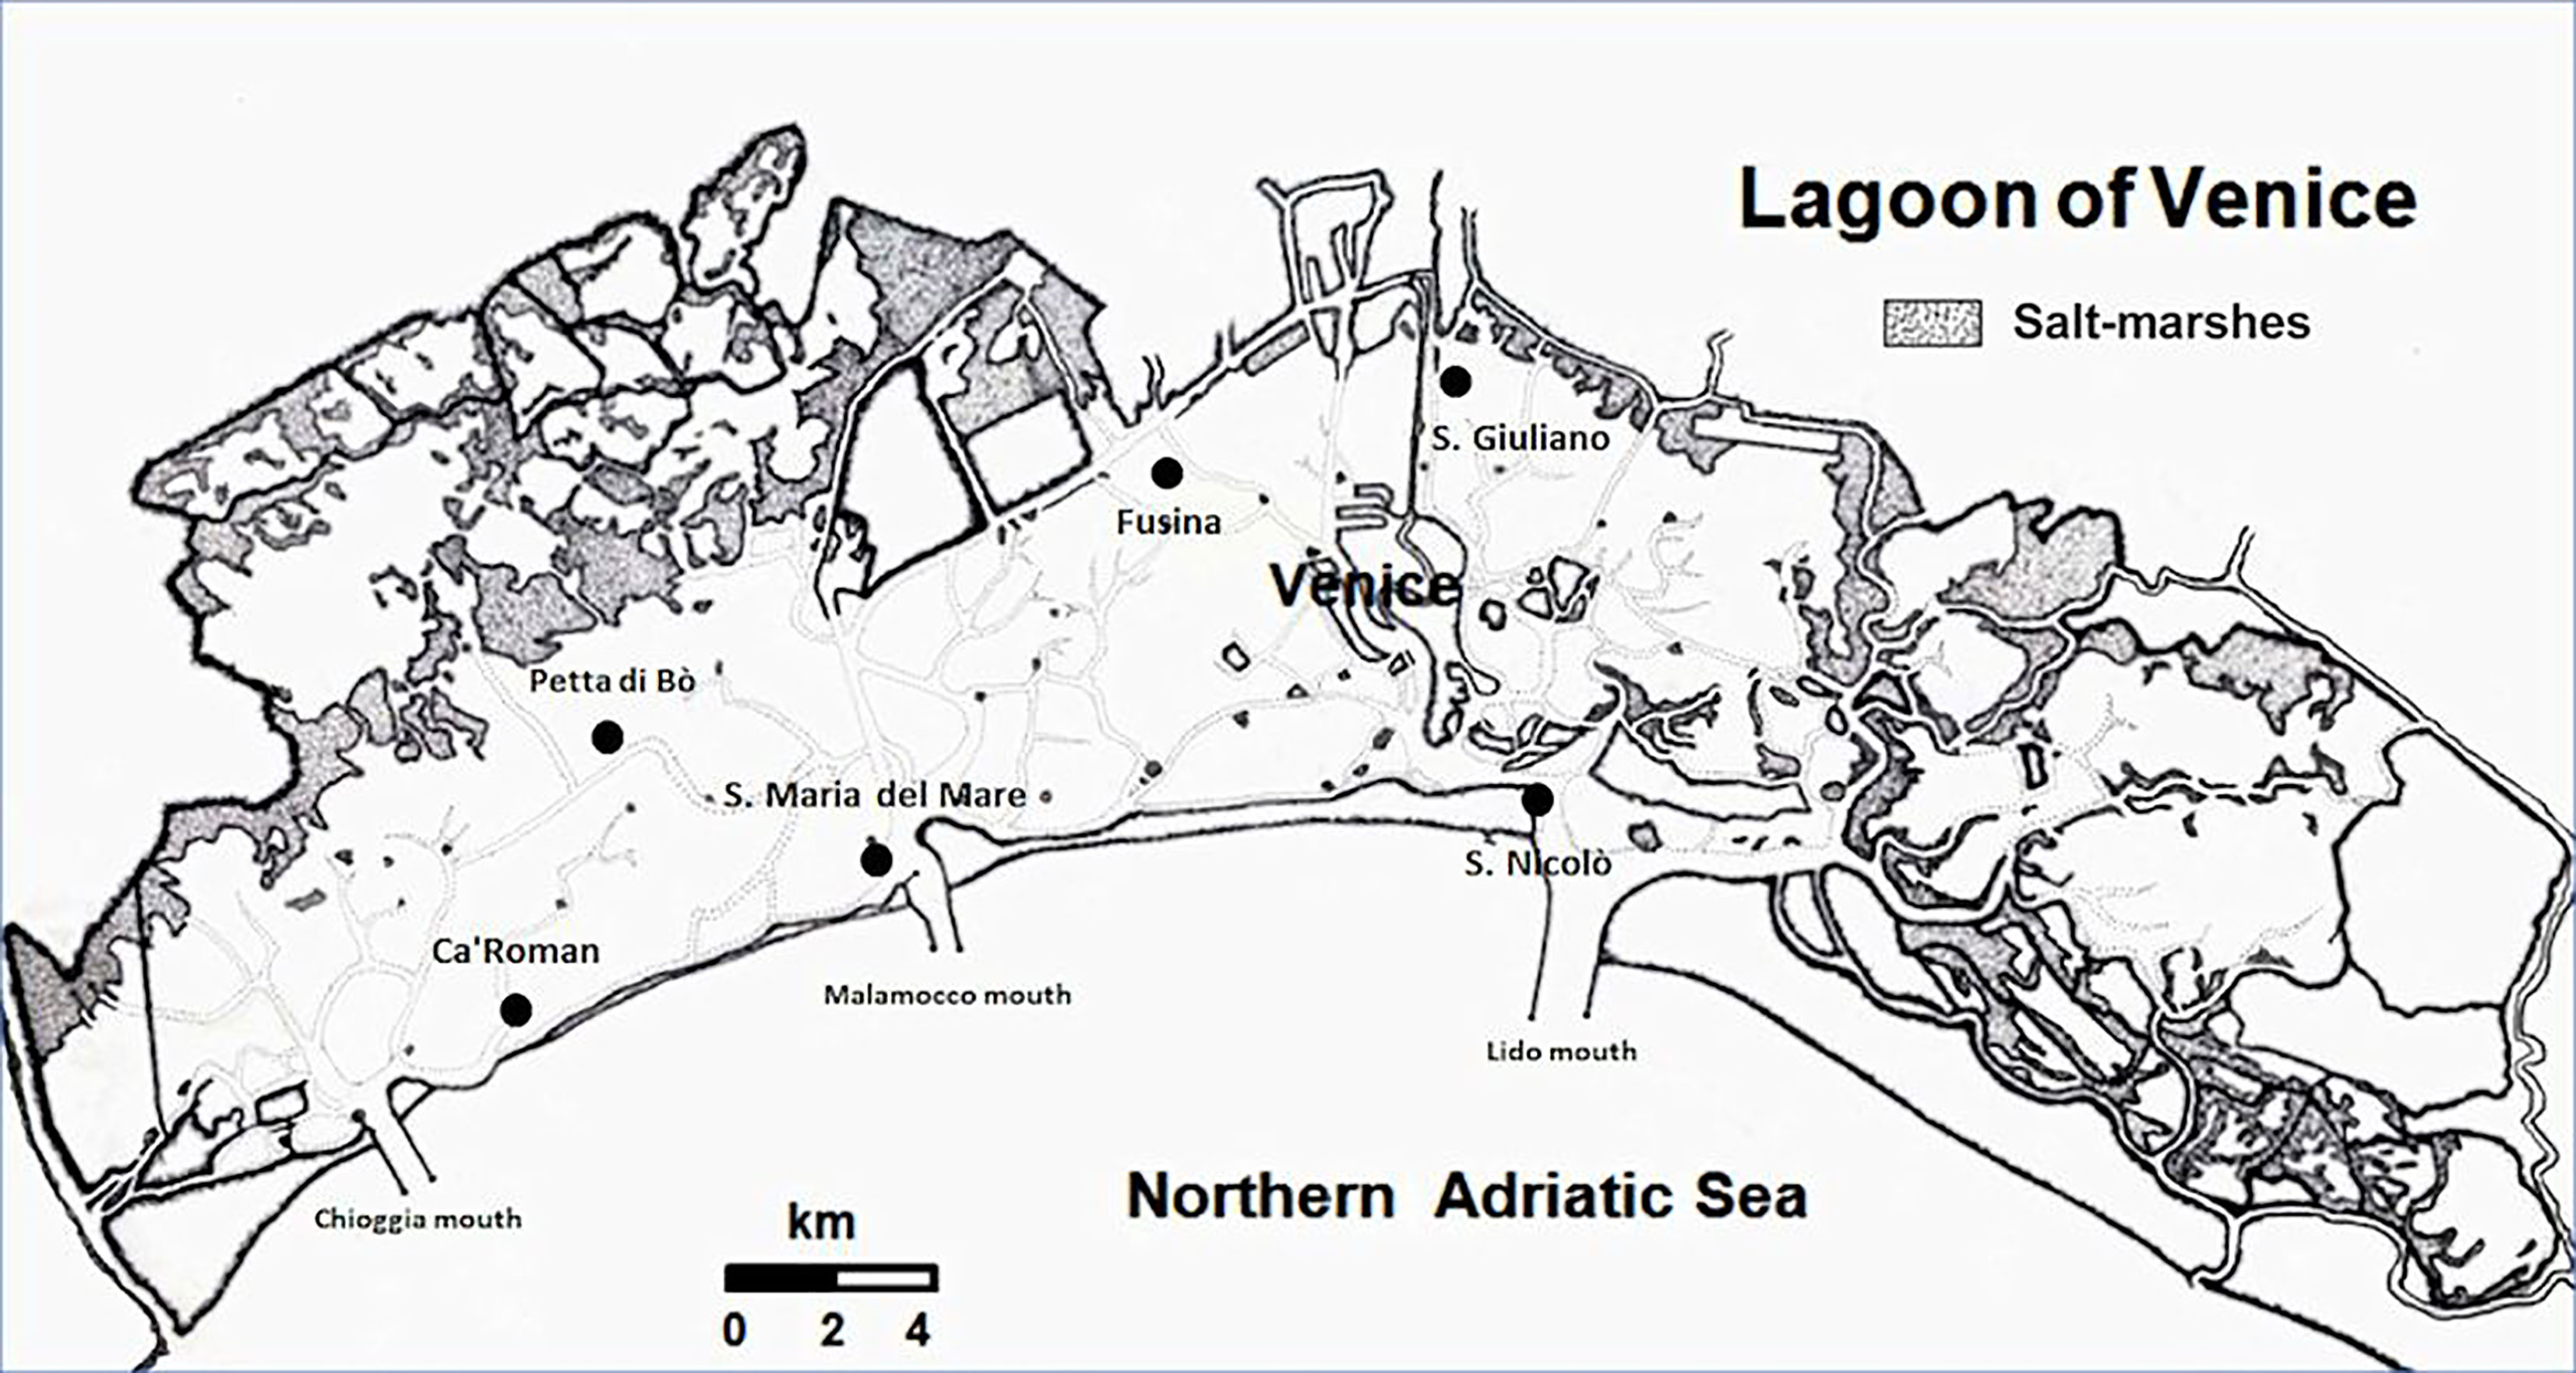
Figure 1 Map of the Venice Lagoon and the 6 stations sampled bimonthly.
For its size, the extremely variable morphology [i.e., there are areas heavily influenced by seawater exchanges and choked areas where water renewal takes up to 30-40 days (Cucco and Umgiesser, 2006)] and its more than millenary mercantile history, the Venice Lagoon is a basin characterized by a very high biodiversity. Macrophytes (aquatic angiosperms and macroalgae) are among the most studied organisms. The first studies, generally extensive monographs, date back to the 18th and 19th centuries (Olivi, 1794; Naccari, 1828; Zanardini, 1847; De Toni and Levi, 1885; De Toni and Levi, 1888b; De Toni, 1889; De Toni, 1924) and continued in the 20th century (Schiffner and Vatova, 1938; Sighel, 1938; Vatova, 1940; Pignatti, 1962). These monographs are systematic studies that report lists of species along with their areas of discovery. Subsequently, in the 1980s, an abundant production of scientific papers regarding Venice Lagoon macrophyte biodiversity started. A complete review of this literature up to 2007 was reported by Sfriso and Curiel (2007), whereas information on the biomass changes and global production of macroalgae and seagrasses are shown by Sfriso and Facca (2007). In the following years, studies of macrophytes were mainly focused on their correlation with water and sediment parameters and on the discovery of new species, many of which are alien species (Sfriso et al., 2020a).
However, from the second half of the 20th century, the lagoon experienced continuous environmental changes. After the Second World War, the lagoon was affected by a pronounced chemical and organic pollution that caused replacements in the vegetation, until that period represented by aquatic angiosperms and sensitive macroalgae (Pavoni et al., 1992; Marcomini et al., 1995). Until the end of the 1980s, the lagoon was dominated by luxuriant growth of Ulvaceae (Sfriso and Facca, 2007), whose expansion declined in the 1990s (Sfriso and Marcomini, 1996). In the following years, the basin was affected by an intense fishing of the clam Ruditapes philippinarum Adams and Reeve, which peaked in the late 2010s with approximately 40,000 tonnes per year. This activity had a serious impact on the sediment resuspension and bottom erosion (Sfriso et al., 2005), the macrofauna (Pranovi and Giovanardi, 1994), and the aquatic vegetation (Sfriso and Facca, 2007).
Since the beginning of the 2010s, clam fishing has significantly been reduced due to overfishing of the resource and the lagoon has started a rapid ecological recovery (Sfriso et al., 2019; Sfriso et al., 2021a; Sfriso et al., 2021b).
In 2018 and 2019, an extensive study on the macrophytes of the entire Venice Lagoon was carried out, with the goal of investigating macroalgal and aquatic angiosperm changes on time and spatial scales. The performed analyses allowed us to update biomass and net primary production (NPP) data for macroalgae and single aquatic angiosperms and to compare these data with those obtained in 2003, when the Venice Lagoon was affected by an intense clam overexploitation. Furthermore, the simultaneous sampling of the main physico-chemical parameters and of the nutrient concentrations in the water column and in the surface sediments allowed us to discriminate their correlation with the main variables of both aquatic angiosperm and macroalgae.
2 Materials and Methods
2.1 Study Area
The lagoon of Venice is a wide shallow basin of approximately 549 km2 (432 km2 of water surface), located in the northern Adriatic Sea (sexagesimal coordinates: 45° 35’-11’N; 12°08’-38’E) (Figure 1). The mean depth is approximately 1.2 m and tidal excursion is ±31 cm on the average tidal level, although there are seasonal tidal extremes of over 2 m. The lagoon is connected to the sea through three large (400–900 m) and deep (15–50 m) mouths (Lido, Malamocco, and Chioggia), which divide the area into three hydrological basins separated by watersheds that shift according to tides and winds.
To have well-defined boundaries, the lagoon was divided into three morphological basins (northern, central, and southern basins), which are separated at the North by Burano and Torcello tidal marshes and at the South by the deep Malamocco-Marghera artificial canal. Of the three basins, the central one (ca. 132 km2 of water surface) is the most anthropized and, in the past, was heavily affected by the impact of industrial waste, urban sewage, and other anthropogenic pressures, such as touristic and commercial activities and the illegal fishing of Manila clam (Ruditapes philippinarum Adams & Reeve) carried out by disruptive fishing gears (Pranovi and Giovanardi, 1994; Sfriso et al., 2003; Sfriso et al., 2005). In the last decade, these impacts have been greatly reduced and the lagoon has begun a progressive environmental recovery (Sfriso et al., 2019; Sfriso et al., 2021a). The southern and northern basins are less artificial but have different ecological conditions due to, respectively, a greater and lesser exchange with marine waters. Therefore, the southern basin has less trophy and is abundantly colonized by seagrasses, especially C. nodosa and Z. marina which cover a large part of the shallow bottoms. Although the anthropogenic impacts are not significant, the northern basin has conditions strongly affected by the low water turnover. It is mainly colonized by Z. noltei and R. cirrhosa while Z. marina and C. nodosa are present along the edges of the canals which have a higher water turnover. Since the 1980s all these species had almost completely disappeared due to high trophy, clam fishing, and a picocyanobacteria bloom which eliminated much of the remaining prairies in the summer of 2001 (Sorokin et al., 2004). Aquatic angiosperms were reintroduced into the choked areas with the Life SeResto Project (Life12 NAT/IT/000331) by transplanting more than 75,000 rhizomes that have now colonized extensive areas of this basin (Sfriso et al., 2021b).
The present study refers to biweekly samplings at 6 stations for one year and to late spring-early summer samplings carried out in the soft bottoms of 88 stations, spread in the whole lagoon, in 2018. Samplings were performed in the framework of the project MOVECO III (ecological monitoring of the Venice Lagoon), which aimed at assessing the ecological status of the lagoon by the determination of the biological element “Macrophytes” and the application of the Index MaQI (Macrophyte Quality Index by Sfriso et al., 2009; Sfriso et al., 2014). The 6 stations were selected to study the annual growth of aquatic angiosperms and macroalgae before and after the entry into operation of the MOSE (experimental electromechanical module) gates which took place in October 2020, to counteract the exceptional high tides that affect the Venice Lagoon. Three stations were placed near the lagoon mouth: San Nicolò (SN), Santa Maria del Mare (SMM), Ca’ Roman (Ca’R), and three in the innermost areas: San Giuliano (SG), Fusina (Fus), and Petta di Bò (PBò) (Figure 1).
2.2 Physico-Chemical Parameters
In the six stations at each sampling campaign the physico-chemical parameters of the water column [%DO, salinity, pH, Eh, Chl-a, phaeopigments, reactive phosphorus (RP), ammonium , nitrite , nitrate , silicate (Si)], and the 5-cm sediment top layer [fraction <63µm (Fines), density, moisture, porosity, total, inorganic and organic phosphorus (Ptot, Pinorg, Porg), total nitrogen (Ntot), total, inorganic and organic carbon (Ctot, Cinorg, Corg), sedimentation rates (SPM = Settled Particulate Matter)] where recorded. The analytical procedures have been reported in specific papers (Sfriso et al., 2017; Sfriso et al., 2019; Sfriso et al., 2021a).
2.3 Macrophyte Sampling
Following Sfriso et al. (1991), during each sampling campaigns the biomass of macroalgae was determined as the mean of 6 sub-samples using a frame of 50x50 cm. A selection of the different taxa was stored in 4% formaldehyde solution until taxonomic determination. When present, 6 samples of aquatic angiosperms were also collected by using a frame of 20x25 cm, to determine the biomass of shoots, rhizomes, and dead parts (blackened, no longer vital parts), the shoot density, the shoot height, and the number of leaves, according to Sfriso and Ghetti (1998). Each sample was collected manually by taking the plants inside the square. The rhizomes were cut with a blade along the edge of the square and the samples with sediments were collected up to 20-30 cm deep, placed in a 0.5-cm mesh basket and washed to remove sediments, shell fragments, and live organisms. Each sample was then collected in a bag and kept in the refrigerator at 4°C until the morphological analysis took place within 2-3 days. During the analyses, each sample was washed with tap water to remove salts and sediment residues and carefully dried with laboratory paper. Then each plant was divided into three parts (rhizomes+roots, leaf bundles, and dead parts), which were weighed separately for each sample with a technical balance (precision 0.01 g). The final value was the average weight of the 6 samples, whose values were then extrapolated to the square meter. The average measurement of the 20 longest leaf bundles provided the height of the prairie while the average of the number of leaves allowed us to have the average number of leaves. The dry weight of the samples was determined after sample lyophilization.
The study on spatial basis was carried out by sampling 88 stations, equally distributed throughout the lagoon, in late spring-early summer 2018. The sexagesimal coordinates are reported in Supplementary Table S1 together with those of the 6 stations. At each station, the cover and biomass of macroalgae and the cover of aquatic angiosperms were determined by collecting samples for the taxonomic determination.
The distribution of macroalgae throughout the whole lagoon was reported in biomass ranges (0.01-0.1, 0.1-0.5, 0.5-1.0, 1.0-5.0, 5.0-10.0 kg m-2) of fresh weight (FW) biomass, marking in a map the boundaries of the distribution ranges with a GPS when reference morphological structures were not available. Then the area of each biomass range was calculated in a map with a scale of 1:50,000 (1 cm2 = 500*500 m = 250,000 m2) by reporting the mean and maximum surface for each biomass range. The sum of the areas and biomasses of the individual ranges provides the lagoon surface covered by macroalgae and the total biomass. These calculations were made for each of the lagoon basins and then added together to obtain the total values.
The distribution of each aquatic angiosperm in the whole lagoon was obtained by drawing biomass distribution maps in the same way. For each species, the biomass was reported into 4 ranges (0-25, 25-50, 50-75, 75-100%) of cover. A biomass range was then associated with each cover range using the maximum value obtained during the annual sampling in the 6 stations studied in this paper or those previously found in other stations (Sfriso and Facca, 2007).
2.4 Primary Production Determination
2.4.1 Aquatic Angiosperms
At each station, the NPP of the aboveground part of the aquatic angiosperms (shoots) was determined by piercing the leaf bundles above the basal meristem with a needle in accordance with Dennison (1990a) and Dennison (1990b). At each campaign, approximately 20 leaf bundles were drilled and, at the subsequent sampling, the leaf growth of 10 leaf bundles was determined. The growth of each bundle was assessed bimonthly by adding the displacement of the hole from the basal meristem of the single leaves. These data were transformed into a linear leaf production for square meter considering the mean leaf bundles per square meter (sum of the leaf increase of each shoot * number of shoots m-2) and biomass production by mean fresh (FW) weight and dry weight (DW) of 10 linear meters of leaves.
The NPP of the belowground part (rhizomes+roots, hereinafter referred to as rhizomes) of the plants was obtained monthly by sampling all rhizomes with the biomass variation method within dense and uniform prairies (Sfriso and Ghetti, 1998). Indeed, the drilling of the rhizomes could only be applied to Zostera marina Linnaeus, but not to Zostera noltei Hornemann and with difficulty to Cymodocea nodosa (Ucria) Ascherson. In fact, Z. marina rhizomes can be perforated above the basal meristem, but the operation is complex and subjected to a high margin of error; Z. noltei has rhizomes that are too thin, and the drilling could compromise their growth; C. nodosa has very elongated rhizomes and only the apical bundles can be pierced. Therefore, for all three species it was preferred to apply the biomass variation method. Sfriso and Ghetti (1998) showed that 6 replicated sub-samples with a frame of 20x25 (0.05 m2) cm are sufficient to obtain an accurate biomass measurement with an error of less than 5%. The sum of the rhizome biomass increases recorded monthly for 1 year, excluding the values found not significant by one-way ANOVA, supplies the NPP of the underground part. This value added to that of shoots gives the total production of each species.
Following Sfriso and Facca (2007), the NPP of the whole lagoon was estimated based on the production/biomass ratios (P/B) (i.e., the ratios between the annual NPP and the annual maximum biomass) determined for each species, sampled during the year in the framework of different projects and characterized by different biomass intervals in accordance with the following calculation:
2.4.2 Macroalgae
In the 6 stations macroalgae were sampled twice a month determining the cover, the biomass, the total number of taxa, the number of sensitive taxa according to ISPRA (2011), and the parameters for the application of the index of ecological status MaQI (Macrophyte Quality Index of Sfriso et al., 2009, Sfriso et al., 2014). It was not possible to calculate the P/B ratios because macroalgae require a higher number of samplings, especially in the period of greatest growth of the dominant species. Therefore, the NPP of macroalgae was determined by using the P/B ratios reported in Sfriso and Facca (2007). They were calculated in stations characterized by different biomass ranges (0-2 kg FW m-2, 5-8 kg FW m-2, 8-12 kg FW m-2) because the P/B ratio increased with the decreasing biomass. Indeed, macroalgae have a higher growth rate in the presence of smaller biomass as they are not self-limited.
For macroalgae, it was also possible to determine the gross primary production (GPP) by using the GPP/NPP ratios reported in Sfriso and Facca (2007) and calculated from the balance of phosphorus, an element that completes its cycle between sediments, water, and biota, in stations placed in the lagoon watershed or without water exchanges (Sfriso and Marcomini, 1994). In brief, the ratio of all phosphorus recycled annually from macroalgae to that recycled from NPP provided the GPP/PPN ratio. For the calculation we used the average value of phosphorus in the annual macroalgal biomass, the minimum winter value of phosphorus retained by the surface sediments, and the average value of the phosphorus in the particles captured annually with sedimentation traps (SPM = settled particulate matter). The system reported below:
A = mean value of P in macroalgae
B = winter background of P in surface sediment
C = mean value of P in SPM
x = fraction of macroalgae in SPM
y = fraction of sediment in SPM
Taking into account the total amount of SPM collected by traps during the year made it possible to separate the contributions of phosphorus due to the degradation of macroalgae produced during 1 year from that contained in the resuspended surface sediments settling into the traps in the same period of time. Since phosphorus is a sedimentary element with negligible losses as phosphines, which occur only in the case of anoxic events, it was possible to calculate the total amount of this element recycled by macroalgae and released in the particulate collected by traps during their degradation.
2.5 Statistical Procedures
All the data of physico-chemical parameters of the water column, surface sediments, sedimentation rates (29 parameters), and some macrophyte variables (angiosperm cover, macroalgal biomass, macroalgal cover, total macroalgal taxa, number of sensitive taxa, number of calcareous taxa) collected in the 6 stations were analyzed together in a PCA analysis to highlight their associations and grouping. In addition, the analysis of the transposed matrix allowed us to see the associations between stations discriminating the stations characterized by good high ecological conditions from those of poor ecological conditions.
3 Results
3.1 Environmental Parameters
In Figure 2, some parameters of the water column and surface sediments highlight the main differences between the 6 stations. SG and Fus showed the highest concentrations of reactive phosphorus (RP: 1.36 and 0.96 µM, respectively) and inorganic dissolved nitrogen (DIN = sum of ammonium, nitrite, and nitrate: 19.0 and 10.1 µM, respectively) in the water column. The same stations also showed the highest values of total Chl-a (7.73 and 3.91 µg L-1, respectively) and SG the highest amount of TSS (89.2 mg L-1). Similarly, the number of fines was higher at SG (90.0%) and Fus (66.7%). Consequently, SG exhibited the highest concentrations of Porg (141 µg g-1) and Corg (15.51 mg g-1) followed by Ca’R (100 µg g-1 and 15.47 mg g-1, respectively) that also had the highest concentration of Ntot (1.49 mg g-1).
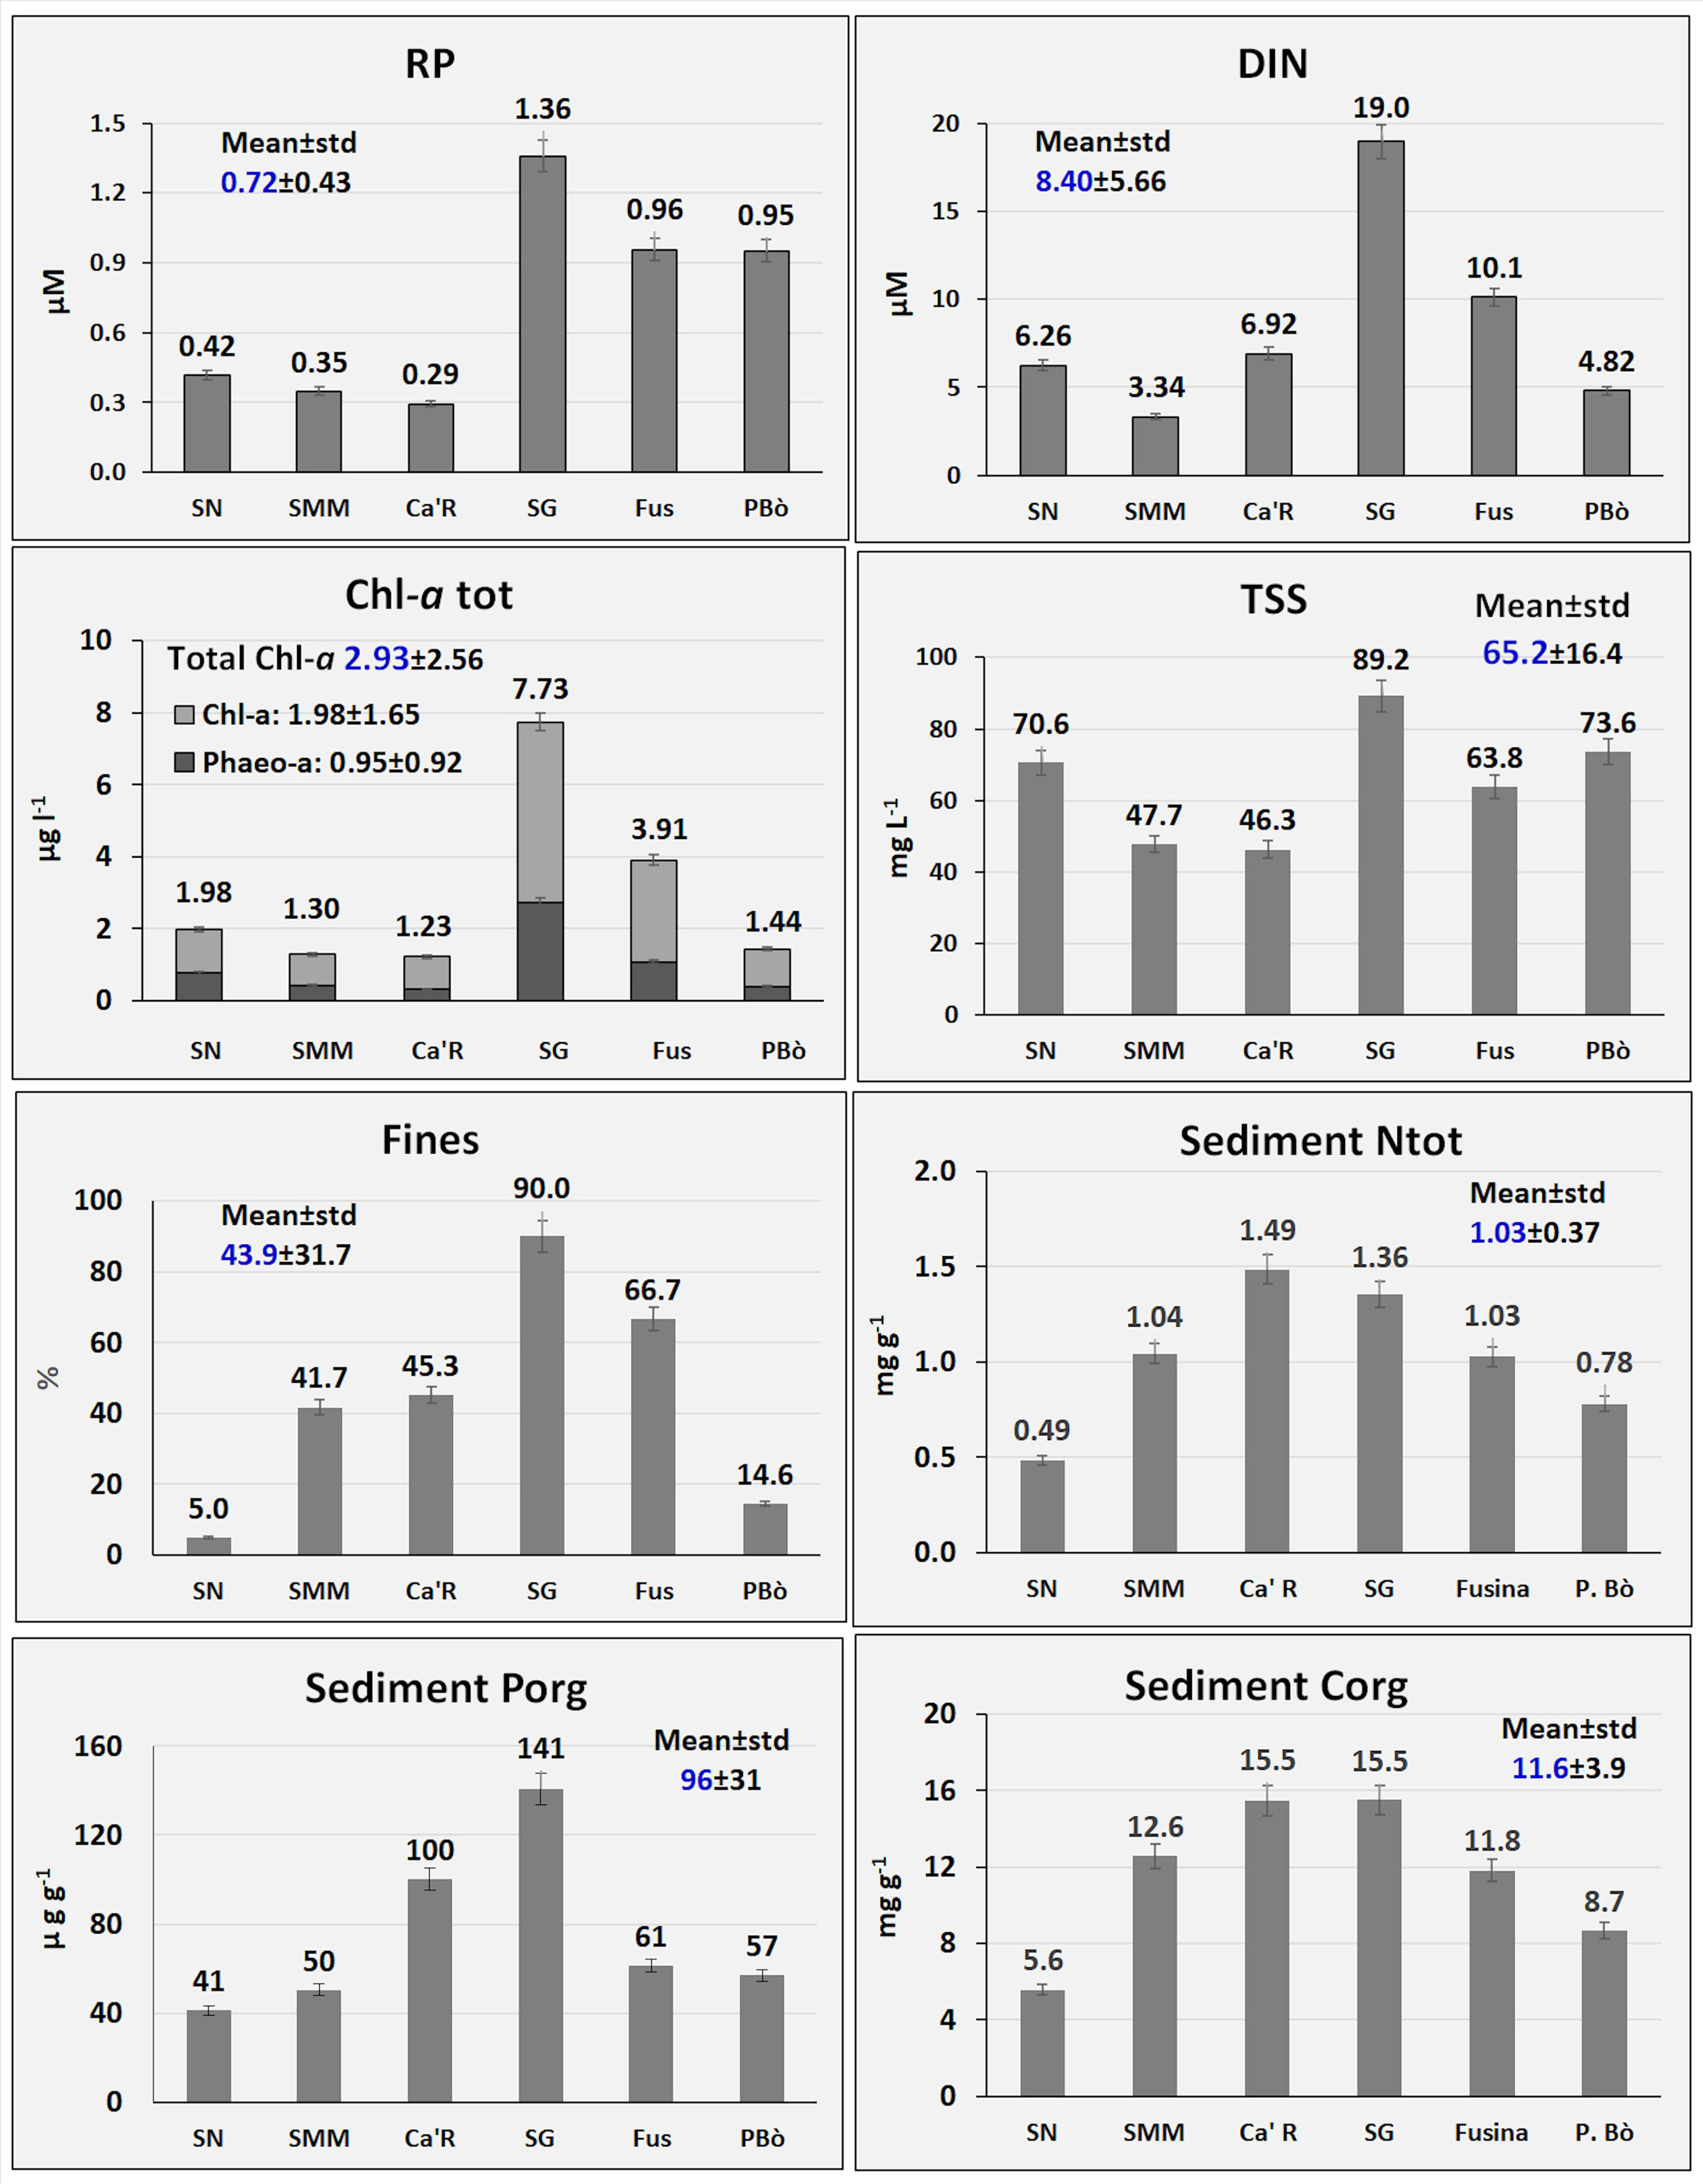
Figure 2 Main ecological parameters.
3.2 Macrophyte Variables
The macrophytes variables recorded in the 6 stations [San Nicolò (SN), Santa Maria del Mare (SMM), Ca’ Roman (Ca’R), San Giuliano (SG), Fusina (Fus), Petta di Bò (PBò)] in 2019 are reported in Table 1. The number of total taxa was 130 (44 Chlorophyceae, 67 Rhodophyceae, 19 Phaeophyceae). The highest biodiversity was recorded at SN (86 taxa) and the lowest at Fus (17). Out of them, 25 were sensitive taxa and 3 crustose calcareous taxa. The highest number of sensitive taxa was recorded at SMM (15, i.e., 21.1%) whereas at SG and at Fus sensitive taxa were missing.
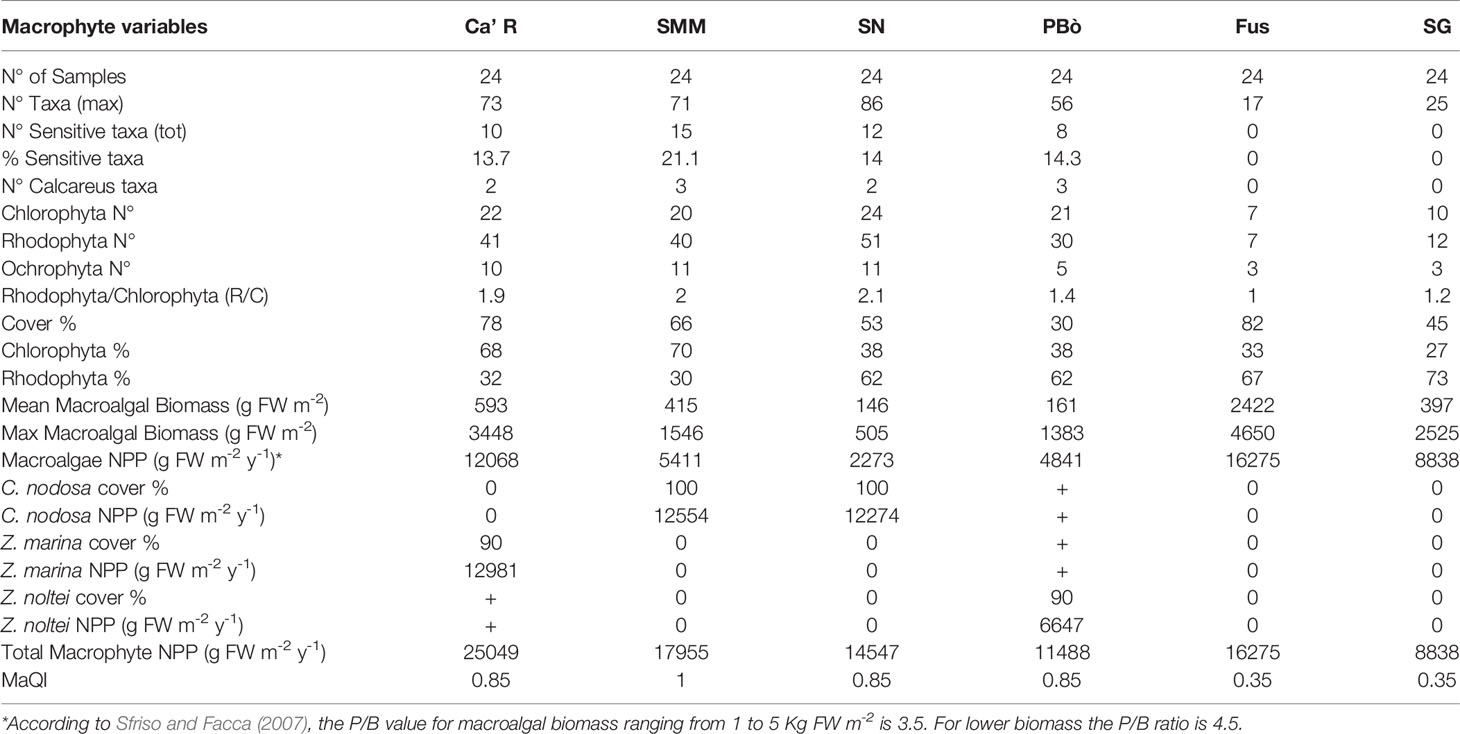
Table 1 Macrophyte variables.
The Rhodophyta/Chlorophyta (R/C) ratio ranged from 1.0 at Fus to 2.1 at SN. The mean macroalgal cover range was 30-82% with the highest value at Fus and the lowest at PBò.
The NPP recorded by applying the P/B reported by Sfriso and Facca (2007) for different levels of biomass ranged from 2273 g FW m-2 y-1 at SN to 16,275 g FW m-2 y-1 at Fus.
The mean annual macroalgal biomass was the highest at Fus (2422 g FW m-2) where no aquatic angiosperms were present. In the same station, the highest biomass (4650 g FW m-2) was also recorded.
By considering the total NPP of macroalgae and aquatic angiosperms, the highest production was recorded at Ca’R (25049 g FW m-2 y-1) where macroalgae and Z. marina contributed with a quite similar biomass (Table 1). The lowest NPP was recorded at SG (8838 g m-2 y-1) where no angiosperms were recorded. The other stations showed intermediate values with different macrophyte contributions. However, at Fus, where only macroalgae were present, the NPP was higher than at PBò colonized by the angiosperm Z. noltei.
The application of the Macrophyte Ecological Index (MaQI) assessed SMM, Ca’R, PBò, and SNN as “High” quality and Fus and SG as “Poor” quality.
Aquatic angiosperms were represented by the species Cymodocea nodosa at SMM and SN (cover 100%), Zostera marina at Ca’R (cover 90%), and Zostera noltei at PBò (cover 90%). The annual biomass variation of these plants is reported in Figure 3.
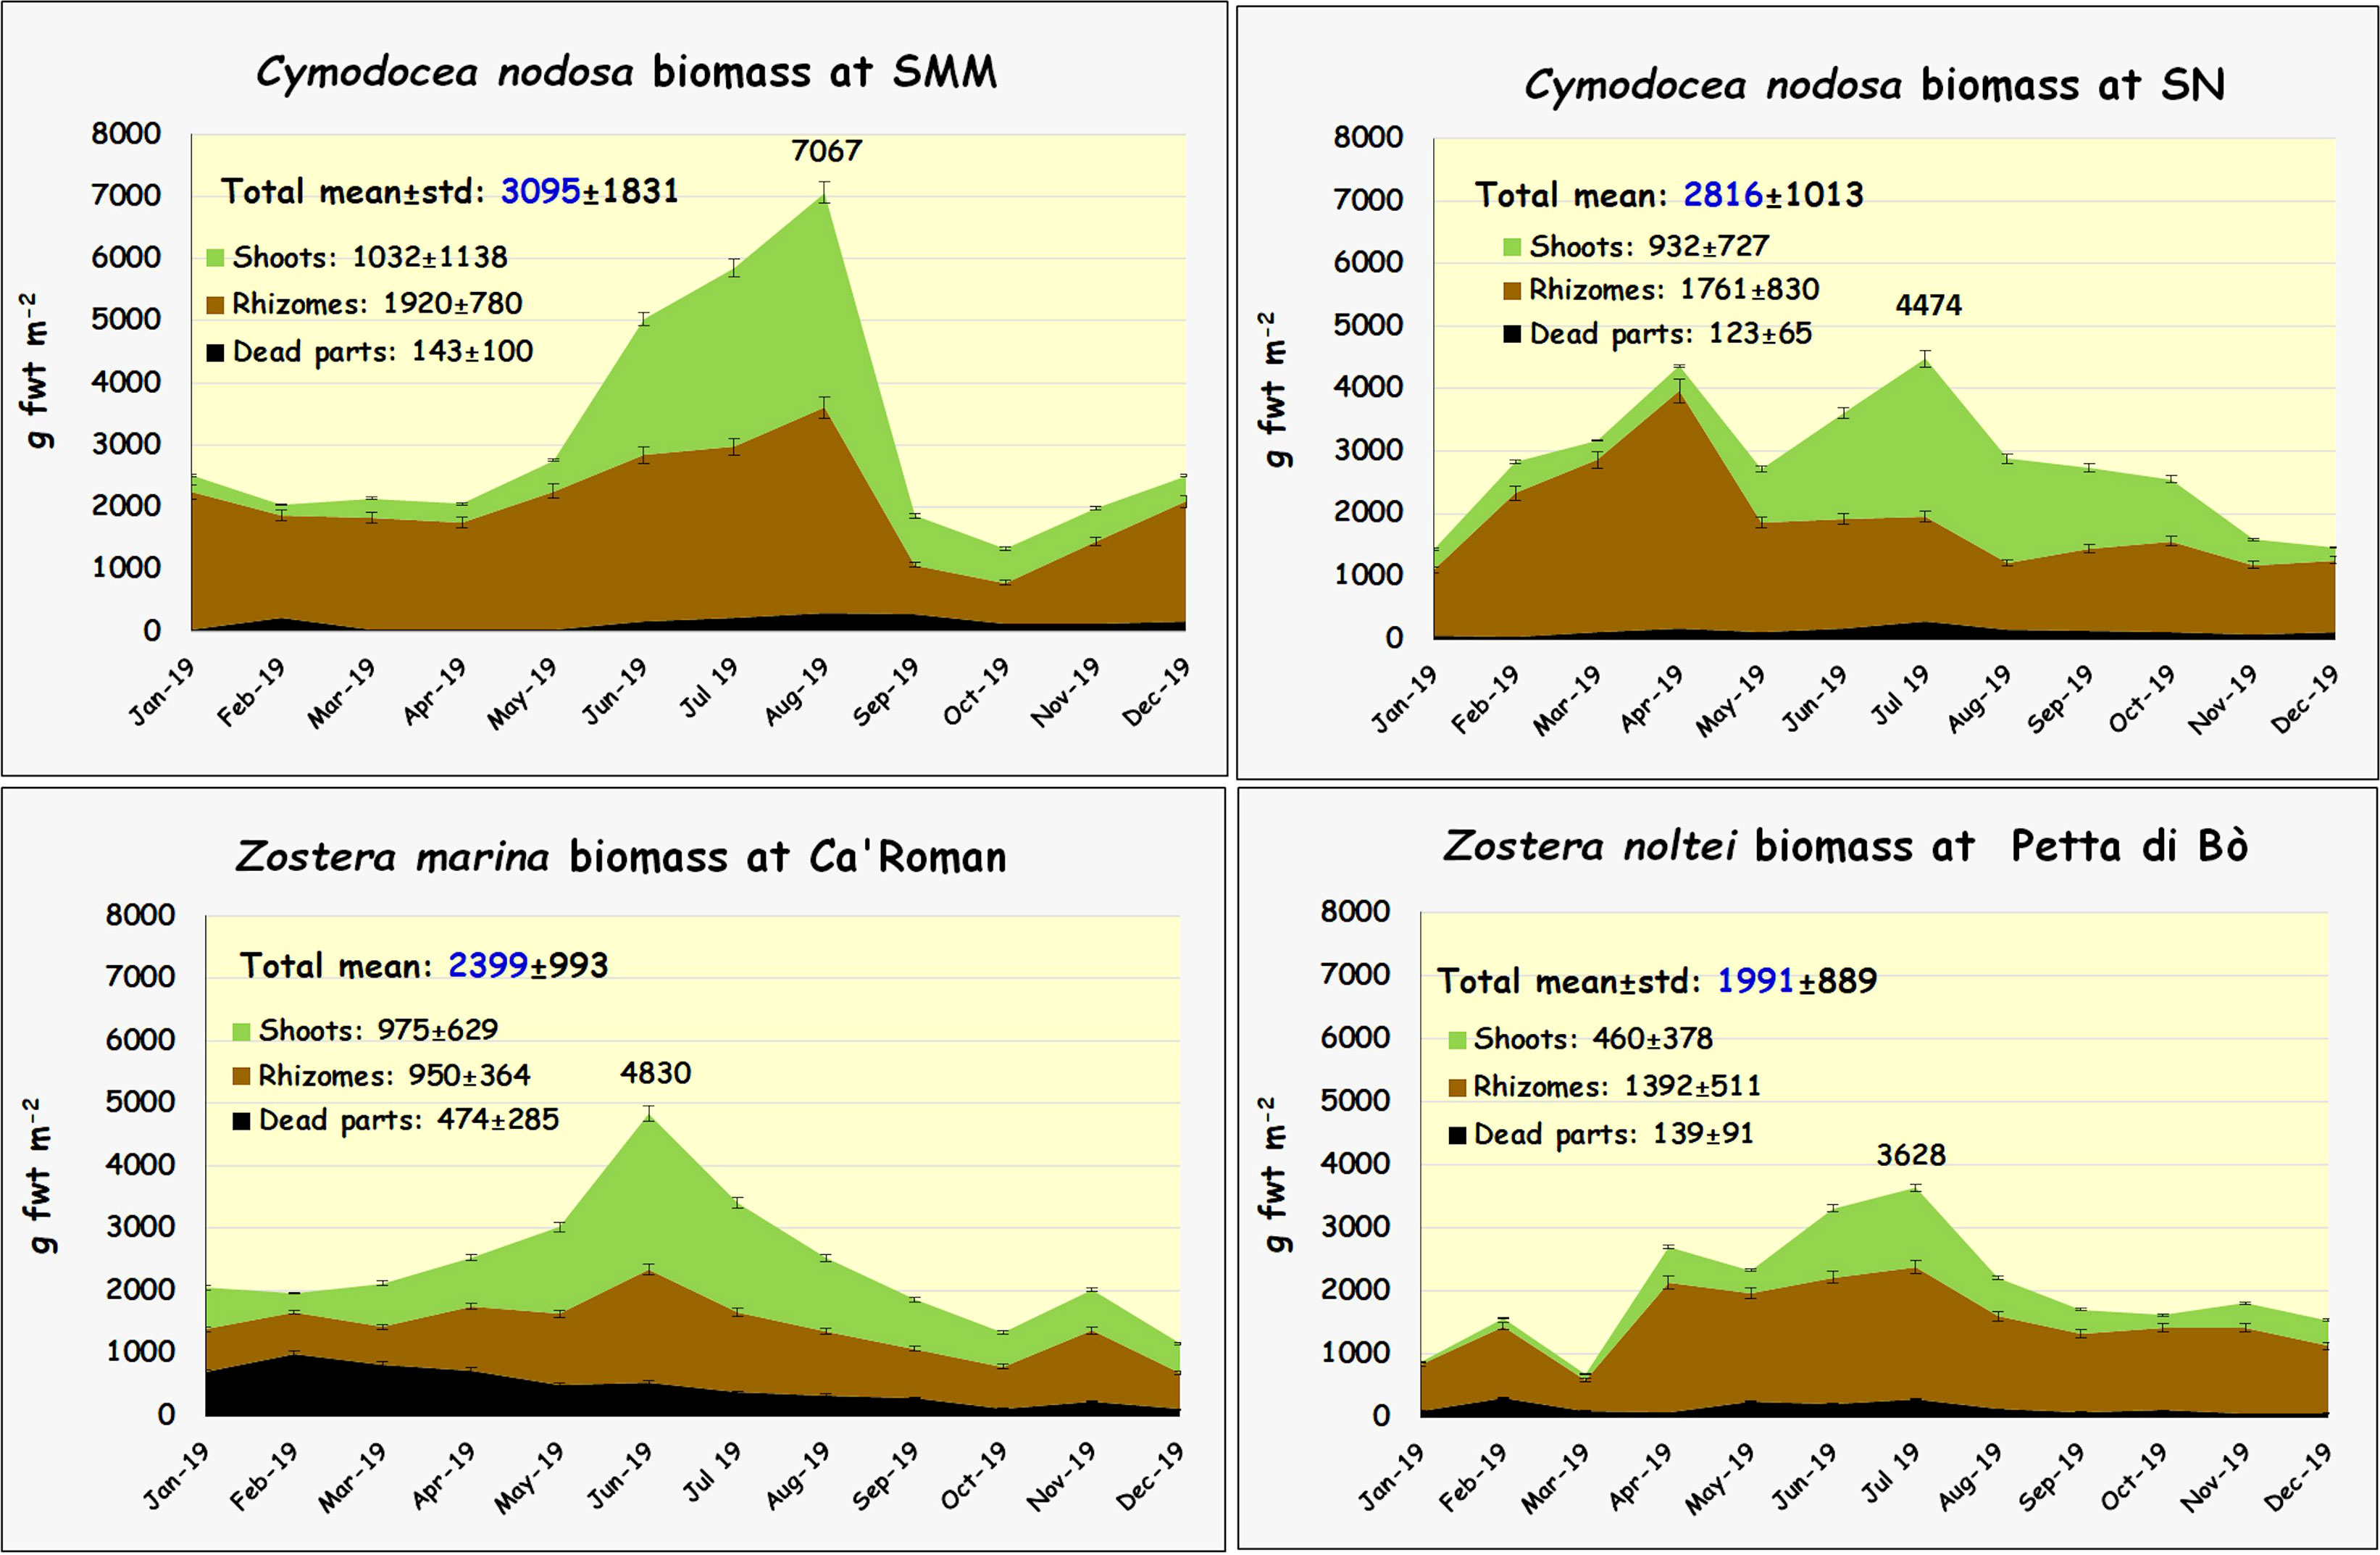
Figure 3 Biomass changes of C. nodosa, Z. marina, and Z. noltei during the year.
C. nodosa was recorded at SMM in a shallow area (ca. 0.6 m depth) and at SN near the border of Lido port entrance at the same depth. At SMM C. nodosa showed both the highest mean biomass (3095 g FW m-2) and the biomass peak (7067 g FW m-2) in July. On average, rhizomes contributed with 1920 g FW m-2 (62% of the total), whereas shoots reached 1032 g FW m-2 only. The presence of dead parts was lower than 5% 143 g FW m-2. This species started to grow in May and sharply declined in September. At SN the mean biomass was lower (2816 g FW m-2) as well as the biomass peak (4474 g FW m-2).
Z. marina showed a slightly smaller mean biomass (2399 g FW m-2) with a peak of 4830 g FW m-2 in June. This species, which grows all year round, had a minimum biomass in September. The mean biomass of shoots (975 g FW m-2) was slightly greater than that of rhizomes (950 g FW m-2) but in this species the dead parts reached almost 20% of the total biomass (474 g FW m-2).
Z. noltei biomass was significantly lower (1991 g FW m-2). The mean biomass peak value was recorded in July (3628 g FW m-2), whereas the minimum was in March. Rhizomes of this species, as for C. nodosa, showed the maximum contribution reaching even 70% of the total biomass.
The number of shoots per square meter is reported in Figure 4A. Z. noltei, the smallest species, and Z. marina showed the highest (5502 m-2) and the lowest (696 m-2) mean number of shoots, respectively. Both these species peaked in June with 13,021 and 1327 shoots m-2. C. nodosa showed almost twice as many shoots as Z. marina with a mean value ranging from 1273 m-2 at SMM to 1373 m-2 at SN. The highest values were recorded in June both at SMM and SN (2747 and 2333 shoots m-2, respectively).
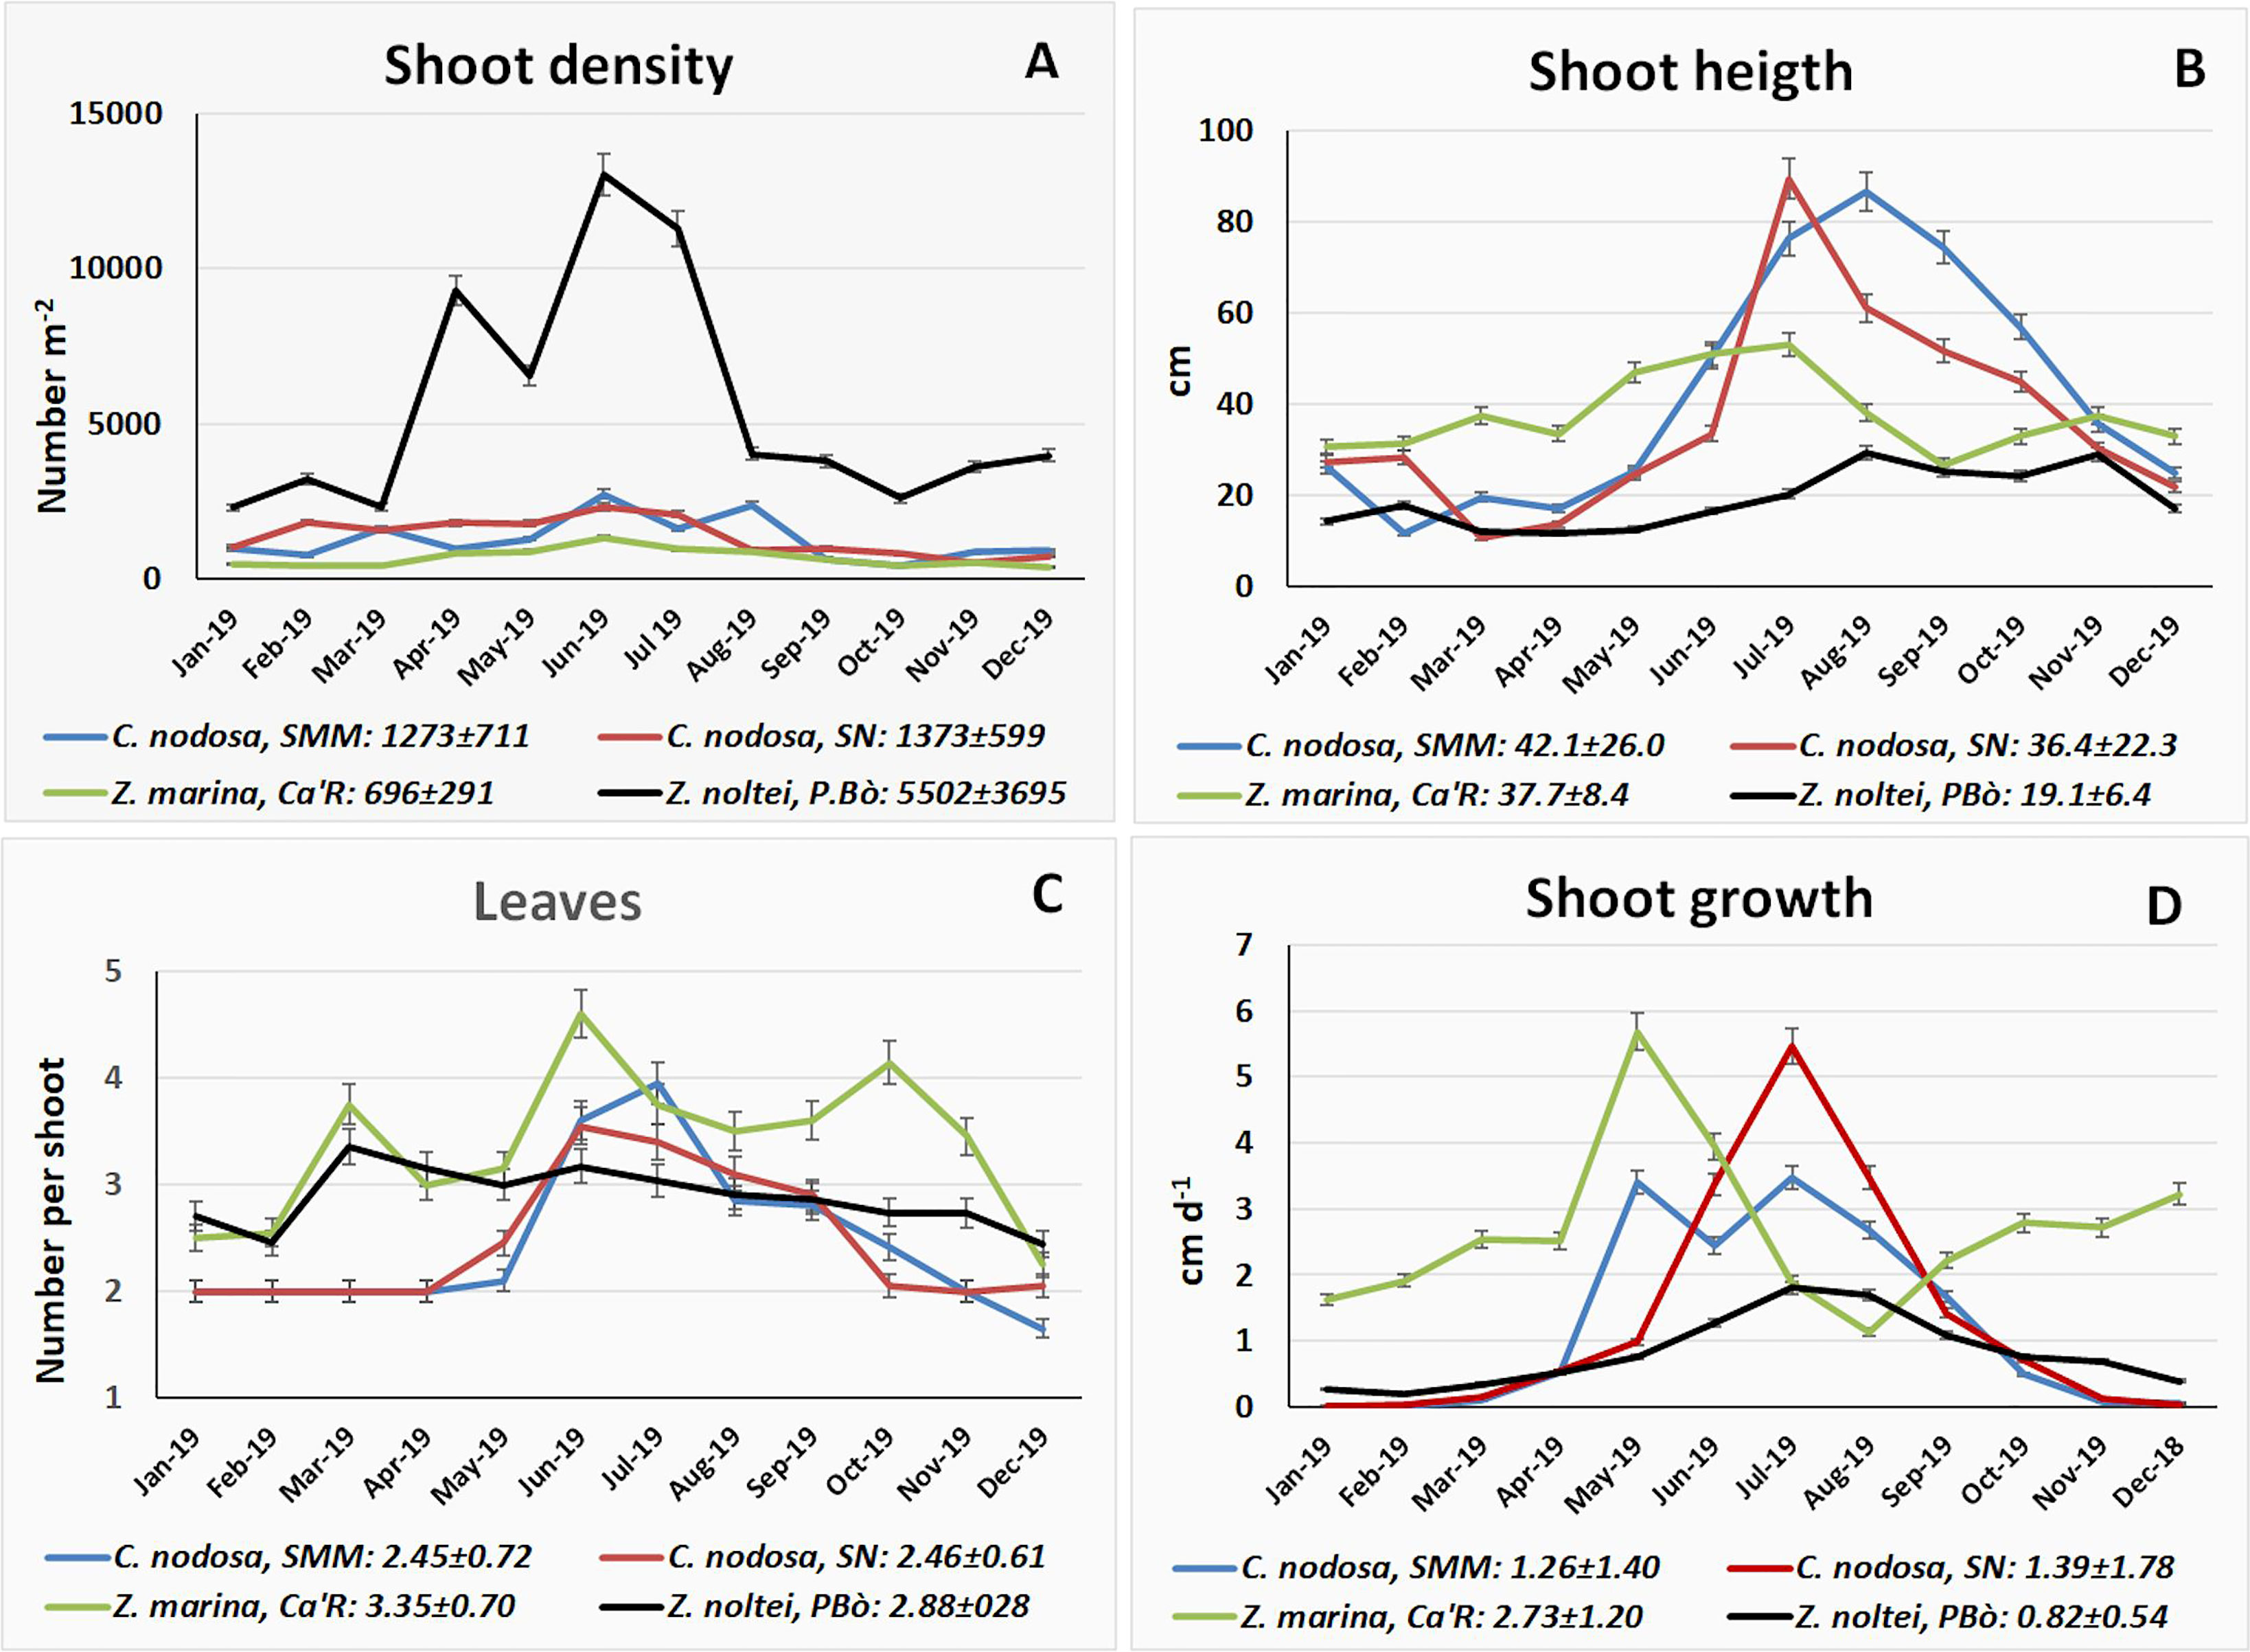
Figure 4 (A) Shoot density, (B) shoot height, (C) leaf number, and (D) shoot growth of aquatic angiosperms monthly for 1 year.
On average shoot height was the highest for C. nodosa at SMM with a peak in August (86.6 cm, Figure 4B) whereas at SN the mean value was slightly smaller (36.4 cm) but with a peak of 89.4 cm in July. Z. marina showed an intermediate mean value (37.7 cm), and the peak was 53.1 cm only. Z. noltei peaked in August (29.3 cm) with a mean value of 19.1 cm.
The number of leaves was average between 2.45 for C. nodosa at SMM and 3.35 for Z. marina at Ca’R. (Figure 4C). In autumn and winter C. nodosa showed 1-2 small sleeping leaves that started to grow only in May.
The growth of shoots was measured about twice a month and scaled monthly (Figure 4D). Z. marina showed a mean value (2.73 cm d-1) almost double than that of C. nodosa (1.26-1.39 cm d-1) and over three times higher than that of Z. noltei (0.82 cm d-1). The highest shoot increase was recorded at Ca’R for Z. marina in the last two weeks of May (6.88 cm d-1, i.e., 5.69 cm d-1 monthly) and at SN in the first week of July for C. nodosa (6.18 cm d-1, i.e., 5.47 cm d-1 monthly).
The NPP of the aquatic angiosperms in 2018 is reported in Table 2. It is sorted in the production of shoots and rhizomes. The NPP of C. nodosa and Z. marina in the three stations was very similar ranging from 12,274 to 12,981 g FW m-2 y-1, whereas that of Z. noltei was about half (6647 g FW m-2 y-1).
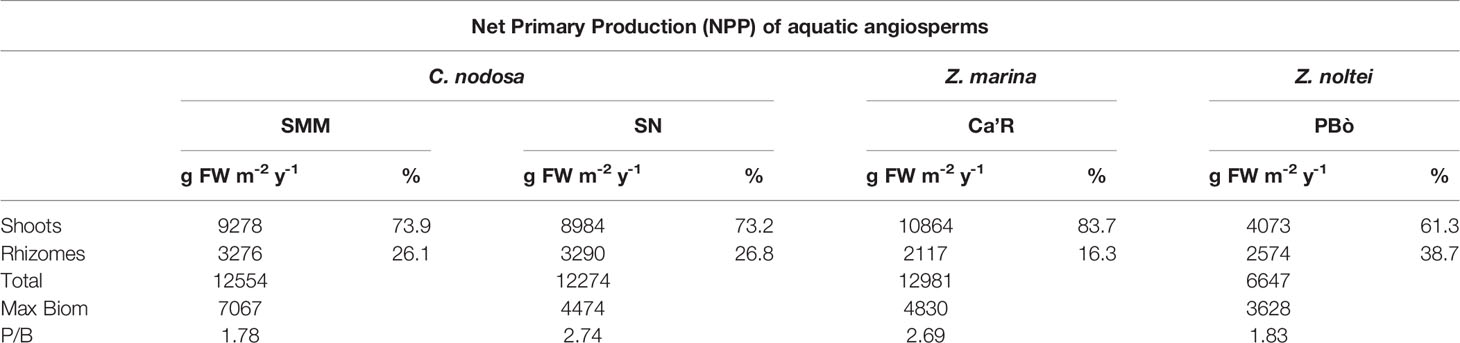
Table 2 Angiosperm production.
On average, the production of shoots was significantly higher than that of rhizomes ranging from 61.3% in Z. noltei to (83.7%) in Z. marina. The percentage of shoot production in C. nodosa in both stations was very similar ranging from 73.2 to 73.9%.
By considering these values and the highest biomass of the single species recorded during the year it was possible to calculate the P/B ratios. They were 1.78 and 2.74 for C. nodosa (mean value: 2.26), 2.69 for Z. marina, and 1.83 for Z. noltei.
3.3 Biomass Maps and Total Macrophyte NPP
3.3.1 Aquatic Angiosperms
The data of macrophyte biomass of the entire lagoon, collected as part of the MOVECO III project, allowed us to calculate the cover, standing crop (SC), and NPP throughout the lagoon and draw the biomass distribution. For macroalgae it was also possible to determine the GPP. An example of the procedure used to define these variables is shown in Supplementary Table S2. The three basins were analyzed separately and globally.
Maps report the biomass of each angiosperm species in the three Venice basins (southern, central, northern, Supplementary Figures S1 and S2) in 4 cover ranges with the corresponding biomass (Supplementary Figure S1).
Overall, the angiosperms C. nodosa, Z. marina, and Z. noltei together with the rarer species Ruppia cirrhosa that was present only in the northern basin (Supplementary Figure S2), colonized approximately 94.8 km2 (Table 3), although in many cases they overlapped. The southern basin presented the highest cover (63.5 km2) followed by the central basin (18.4 km2) and the northern basin (12.9 km2). The total standing crop (SC) was 372 ktonnes FW, of which 298 (ca. 80%) were in the southern basin.
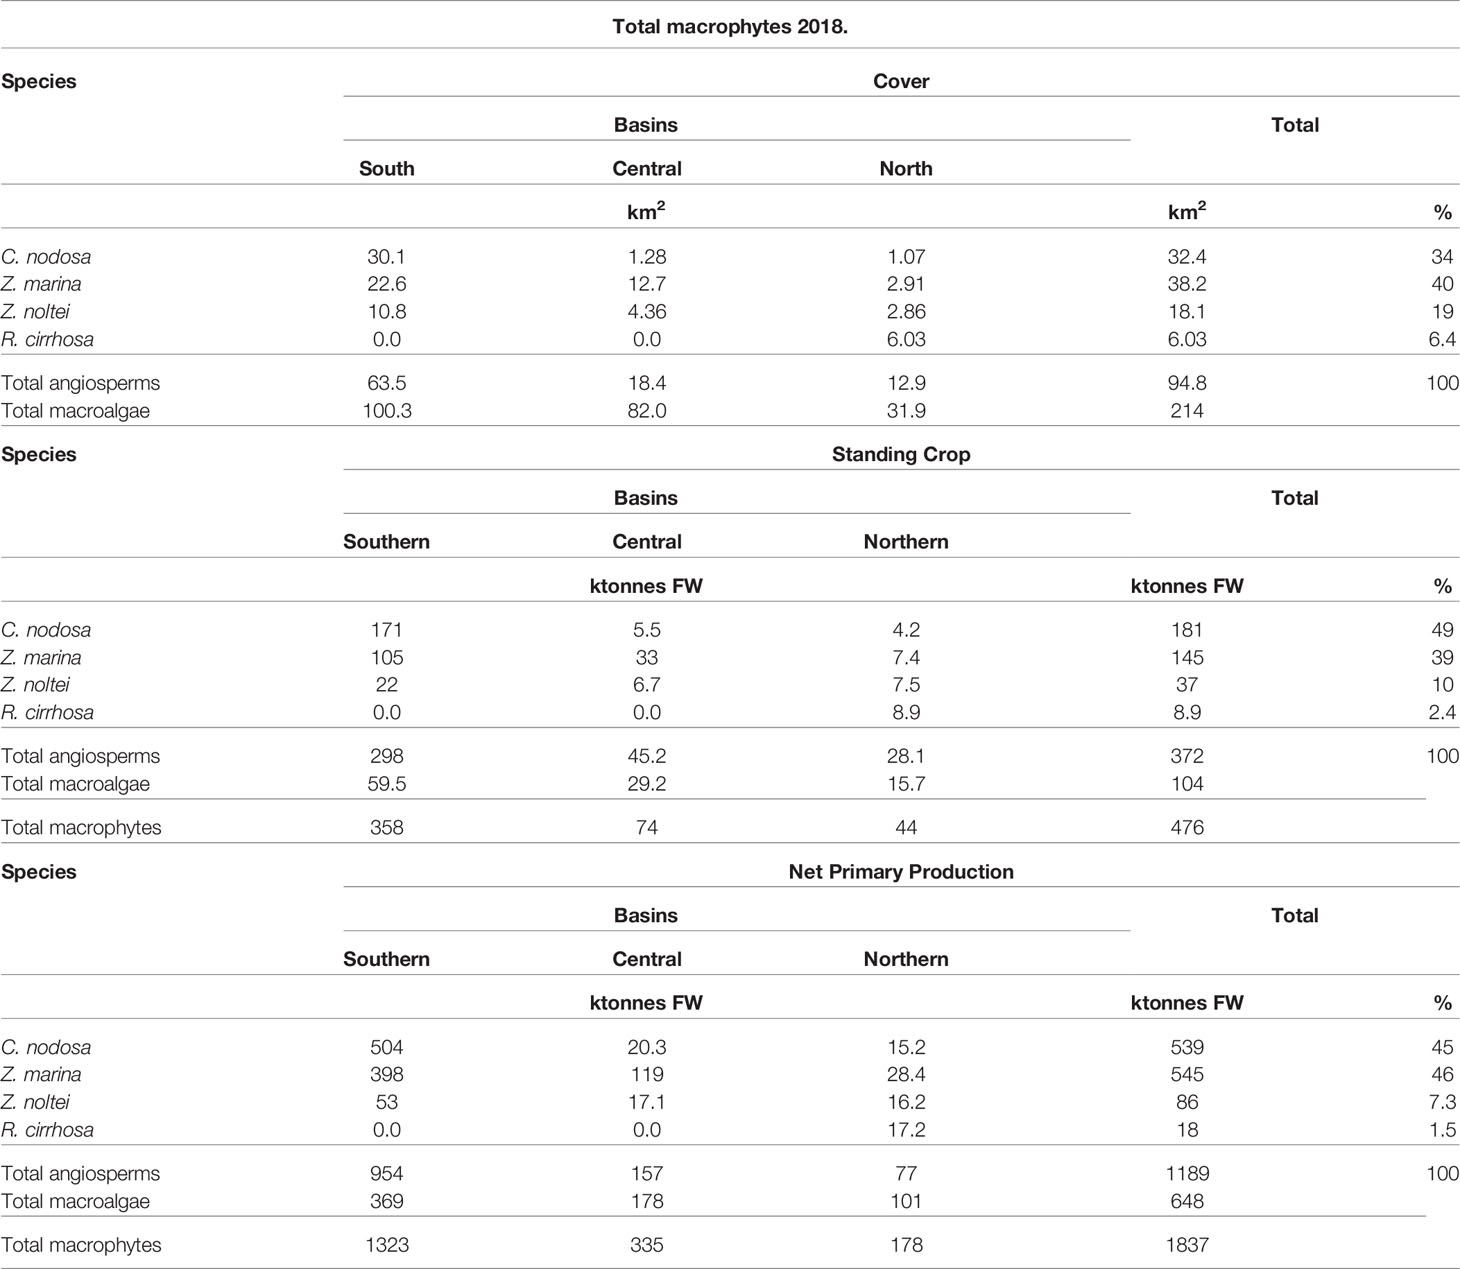
Table 3 Macrophyte cover, SC and NPP .
The NPP reached 1189 ktonnes FW with 954 ktonnes produced in the southern lagoon whereas 157 and 77 ktonnes FW were produced in the central and northern lagoons, respectively.
The highest cover was displayed by Z. marina (38.2 km2, 40%), whereas C. nodosa covered 32.4 km2 (34%). Z. noltei and R. cirrhosa covered 18.1 km2 (19%) and 6.0 km2 (6.4%), respectively.
Conversely, the highest SC was that of C. nodosa (181 ktonnes, 49%) followed by Z. marina (145 ktonnes, 39%), and Z. noltei and R. cirrhosa showed 37 ktonnes (10%) and 8.9 ktonnes (2.4%), respectively.
The NPP of C. nodosa and Z. marina were quite similar: 539 and 545 ktonnes, respectively, accounting for 45% and 46% of the total. Z. noltei and R. cirrhosa contributed with 86 ktonnes (7.3%) and 18 ktonnes (1.5%), respectively.
3.3.2 Macroalgae
Total macroalgal species covered approximately 133 km2 with a biomass ranging from 0.01 to 10.0 kg FW m-2 and 214 km2 with a biomass >0.001 kg FW m-2. The highest cover (ca. 100.3 km2) was recorded in the southern lagoon where the SC reached 59.5 ktonnes FW, that is, approximately 57% of the biomass recorded in the whole lagoon (104 ktonnes FW) (Table 3; Supplementary Figure S3).
However, in the southern basin the SC reached a maximum of 5 kg FW m-2 (Supplementary Figure S3), whereas in the central lagoon SC up to 10 kg FW m-2, composed mainly by Gracilariaceae, was also recorded.
The macroalgal NPP reached 648 ktonnes FW and 369 (57%) of them were produced in the southern lagoon. The total GPP reached approximately 3014 ktonnes FW of which 1705 ktonnes were produced in the southern lagoon (Supplementary Table S2).
3.4 Statistical Analyses
The PCA (principal component analysis) between the main environmental parameters and macrophyte variables (36 in total) is plotted in Figure 5. The first two components explain 76.5% of the total variance. This value increases to 87.9% and 96.9% by considering three and four components, respectively. All parameters/variables are mainly plotted in two main groups associated to bad or high ecological conditions. The ecological value of each parameter/variable is shown by the orthogonal projection on the line that connects the extreme conditions. By Figure 5A, the parameters/variables associated with the highest ecological conditions are the pH of the water column (pHw) and the index MaQI followed by the number of sensitive taxa (Sens), the angiosperm cover (AngCOV), the total number of taxa (Taxa), water transparency (Trans), the water redox potential (Ehw), and the number of calcareous macroalgae. On the other side, the parameters/variables associated with the worst conditions are silicates (Si) and nitrites followed by all the nutrients in the water column, total suspended solids (TSS), Chl-a, and phaeopigments (Phaeo-a). All the other parameters/variables are placed in intermediate positions.
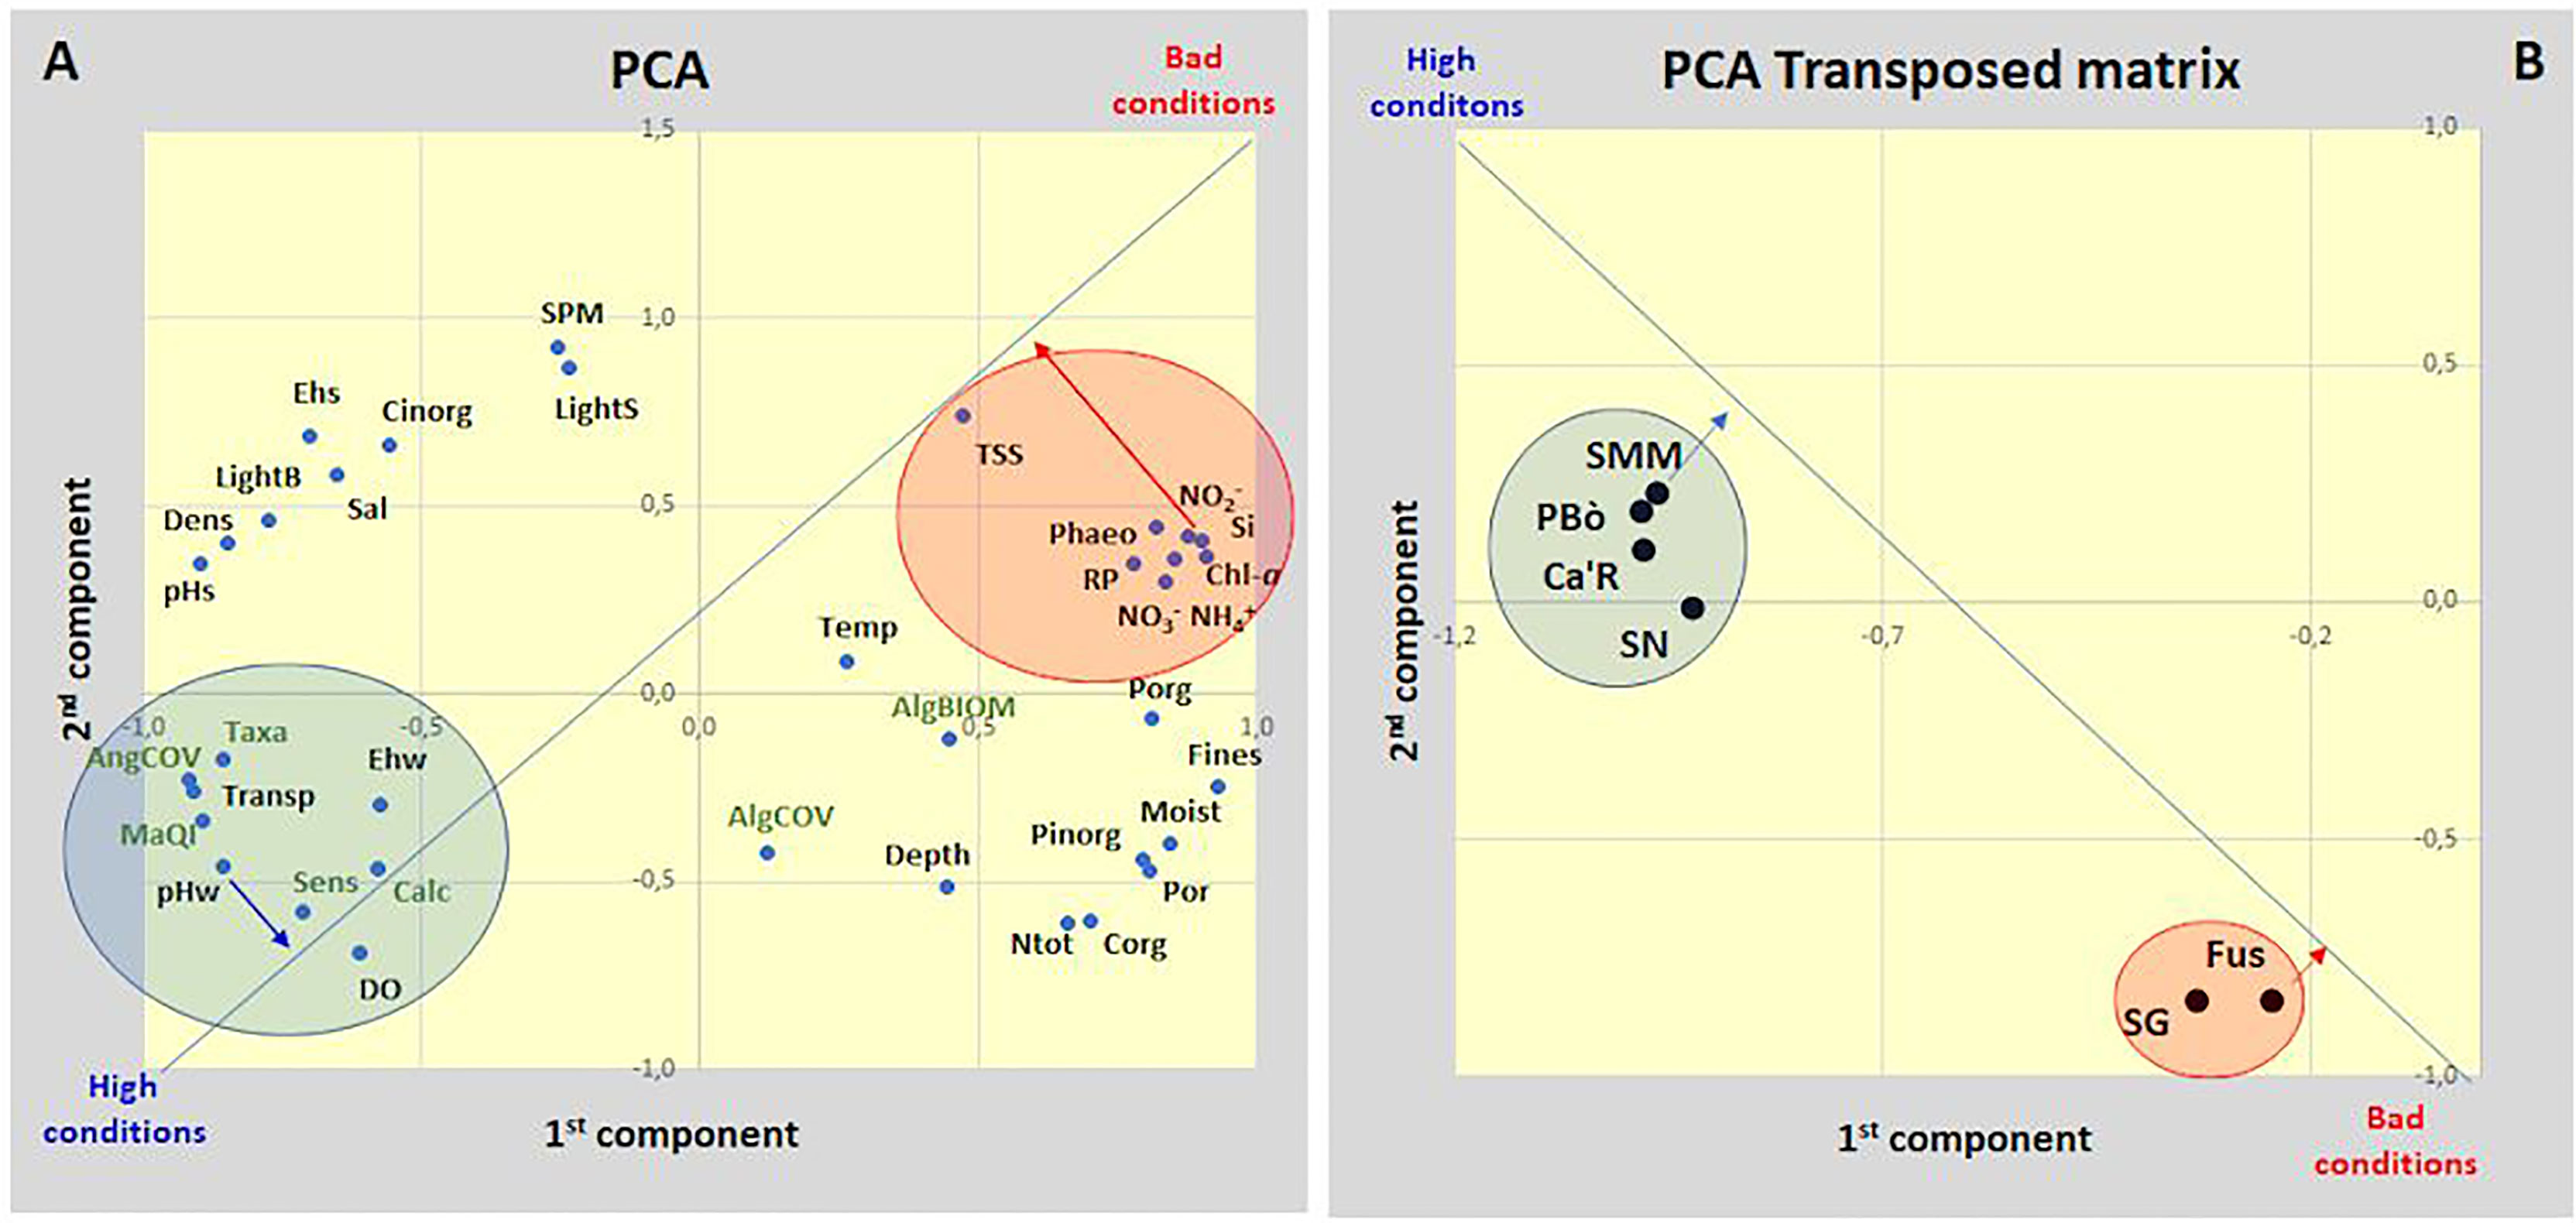
Figure 5 PCA analysis of (A) plot of environmental parameters and macrophyte variables; (B) plot of the 6 stations in the transposed matrix.
The transposed matrix (Figure 5B) with two components explains 86.6% of the total variance highlighting two groups of stations, associated to high (SMM, PBò, Ca’R, SN) or bad (Fus, SG) ecological conditions, respectively. The first group groups the stations colonized by seagrasses. Out of them, SMM showed the highest conditions. The second group had no seagrasses or sensitive macroalgae and Fus showed the worst conditions.
4 Discussion
There is a conspicuous literature on the degradation of transitional environments both from the point of view of pollution and of the trophic status (Smith, 2003; Viaroli and Christian, 2003; Gamito et al., 2005; Howarth et al., 2011; Pérez-Ruzafa et al., 2012; Vybernaite-Lubiene et al., 2017; Hsieh et al., 2021) but relatively fewer articles are about the possibility of a reversal of this trend and on the consequent environmental recovery (Carstensen et al., 2006; Rodrigo et al., 2013; Kralj et al., 2016; McCrackin et al., 2016). Recent studies reported that the Venice Lagoon can be taken as an example of quick environmental recovery due to a marked nutrient decrease (Sfriso et al., 2019; Sfriso et al., 2021a; Sfriso et al., 2021b) with a significant impact on the aquatic vegetation. Indeed, the decrease of the macroalgal biomass and production which occurred in the 1980s allowed the recovery of aquatic angiosperms whose biomasses increased markedly. This was the effect of several policies that were adopted in the framework of EU legislation to prevent or attenuate the impacts of nutrient pollution and its consequences on the aquatic ecosystems. Among them, the Nitrates Directive (ND, 91/676/EEC), dealing with diffuse pollution of nitrogen from agriculture, the Urban Wastewater Treatment Directive (UWWT, 91/271/EEC), addressed to the major point sources, and the Water Framework Directive (2000/60/EC) (European Commission, 2000) that prompted Member States of the European Union to enact new laws to reduce major pollutant resources because the impacts on the biota were of particular importance.
The result of these new policies on the vegetation of the Venice Lagoon was relevant. Data comparison of the cover, SC, and NPP values recorded in 2018 with those found in 2003 for macroalgae and aquatic angiosperms is reported in Table 4 (macroalgae data from 1980 are also available).
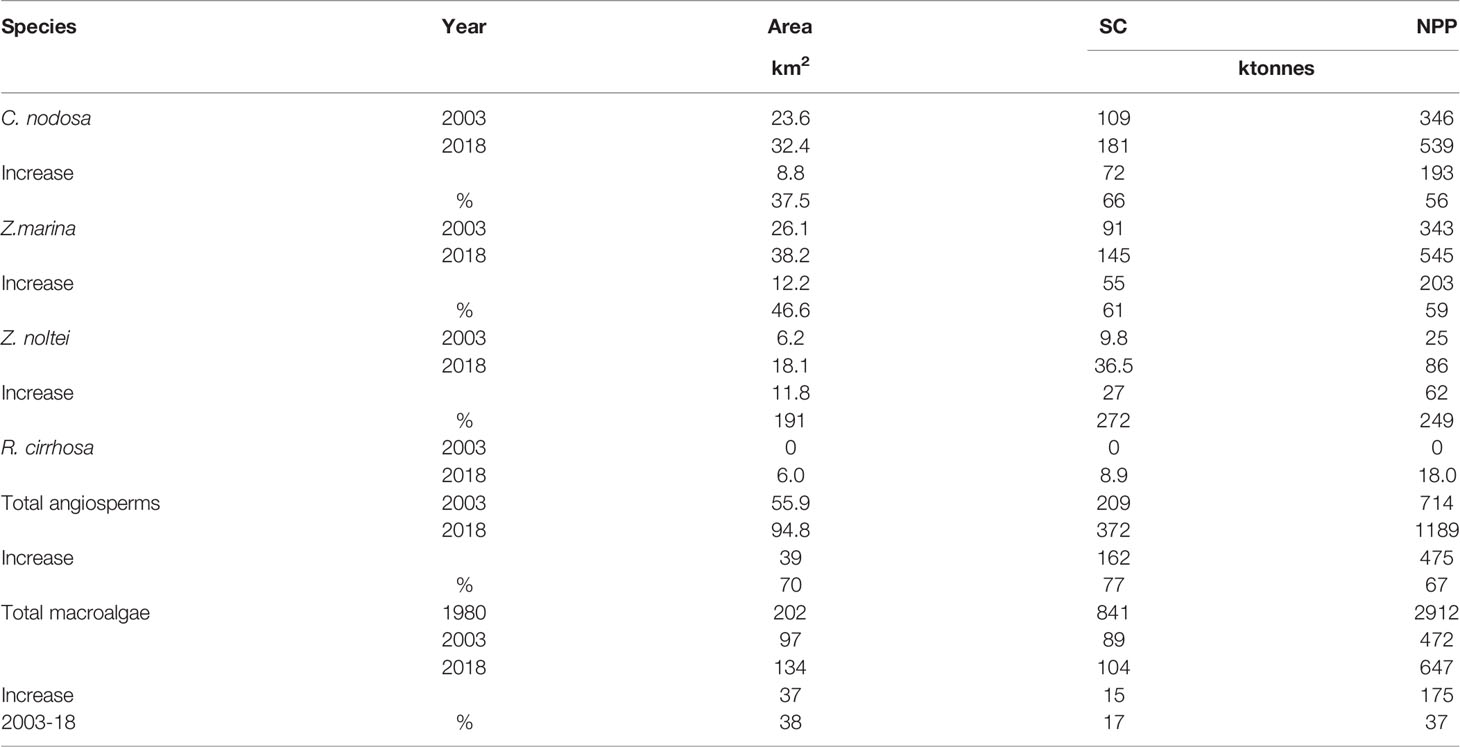
Table 4 Macrophyte comparison in different years.
In 1980 macroalgae, mainly represented by Ulva rigida C. Agardh and Ulva australis Areschoug ex U. laetevirens Areschoug (>90%) showed a luxuriant growth colonizing 202 km2 with an SC and an NPP of approximately 841 and 2912 ktonnes FW, respectively (Table 4). Macroalgae reduced significantly in 2003 (Sfriso and Facca, 2007) due to the synergistic effect of many factors including climatic changes (Sfriso and Marcomini, 1996). Indeed, in this period the total SC and NPP were approximately 10 and 6 times lower than in 1980, respectively. Moreover, the dominant species changed from Ulvaceae to Gracilariaceae or other Rhodophyceae. At present Ulvaceae, mainly U. rigida and U. australis Areschoug, are frequent but usually have a negligible biomass whereas Gracilaria gracilis (Stackhouse) Steentoft et al., Gracilaria bursa-pastoris (S.G. Gmelin) P.C. Silva, Gracilariopsis longissimima (S. G. Gmelin) Steentoft et al., Gracilariopsis vermiculophylla Ohmi, Hypnea cervicornis J. Agardh are absolutely dominant.
The result of the decrease of macroalgal biomass and production was significant growth of all aquatic angiosperms. In fact, their cover increased from 55.9 to 94.8 km2, the SC from 209 to 372 ktonnes FW and NPP from 714 to 1189 ktonnes FW. Ruppia cirrhosa was the species that in the past suffered most the effects of eutrophication and anthropogenic impacts, such as clam fishing (Pranovi and Giovanardi, 1994; Sfriso et al., 2005). However, after its disappearance in the 1980s (Mannino et al., 2015) the species recolonized the northern lagoon covering 6.0 km2 with a SC of 8.9 ktonnes FW and an NPP of 18 ktonnes FW. Zostera noltei, that in 2003 covered about 6.2 km2 with an SC of 9.8 ktonnes FW and an NPP of 25 ktonnes FW, in 2018 increased its growing values even by 191% (cover), 272% (SC), and 249% (NPP) (Table 4). Zostera marina cover increased by 12.2 km2 (+46.6%) from 26.1 to 38.2 km2 whereas the SC and NPP increased by 61 and 59%, respectively. Finally, C. nodosa from 2003 to 2018 increased its cover from 23.6 to 32.4 km2 (+37.5%).
With exception of C. nodosa, a significant growth of the angiosperm species was also favored by transplant activities carried out in the northern basin of the Venice Lagoon in the framework of the project Life SERESTO (LIFE12 NAT/IT/000331) (Project LIFE12 NAT/IT/000331, 2012; Sfriso et al., 2021b). Indeed, between 2014 and 2018 more than 75,000 rhizomes were transplanted forming wide meadows of Z. noltei, Z. marina, and R. cirrhosa that colonized approximately 15 km2 of lagoon bottoms with a mean density of 40%. This contributed significantly to explain the increase of these species in the northern basin where they had almost completely disappeared. But a strong natural recruitment was also recorded in the central and southern lagoon, mainly due to the almost total disappearance of clam fishing activities caused by overexploitation. Therefore, transplantation activities in areas where the nutrient reduction hinders the bloom of thionitrophilic macroalgae or phytoplankton and there are no other significant anthropogenic impacts are an excellent tool to accelerate a quick recovery of ecological conditions. Widespread manual transplants of small sods or single rhizomes of aquatic angiosperms are the simplest, rapid, and least expensive tool to favor the formation of prairies and the recolonization of sensitive macroalgae with a strong reduction of Ulvaceae. Indeed, at present the Venice Lagoon is dominated by angiosperms and macroalgae less dangerous than Ulvaceae for the environment because they withstand higher water temperatures and are unlikely to trigger hypo-anoxic conditions (Sfriso and Sfriso, 2017).
The strong inverse relationships between nutrient concentrations and aquatic angiosperms and sensitive macroalgae is well highlighted by the results recorded in the 6 stations sampled in the lagoon in 2019 on an annual basis. The stations characterized by a higher trophic level (SG and FUS) were only colonized by macroalgae of low ecological value and no sensitive species or aquatic angiosperm were present. Conversely, the areas characterized by a lower concentration of nutrients both in the water column and in the surface sediments (SMM, PBò, Ca’R, SN) had dense seagrass meadows and many sensitive macroalgae, especially the small calcareous macroalgae of the genus Hydrolithon, Pneophyllum, and Melobesia (Sfriso et al., 2020b). The latter are more sensitive than seagrasses to respond to an improvement in ecological conditions and their discovery is an excellent indicator to predict the possibility of a recolonization of angiosperms or the success of transplant activities.
Extensive literature is available on the biomass and production of the angiosperms treated in this paper, but an exhaustive summary has been made by Duarte and Chiscano (1999) who reported information on the highest biomass and production of 30 different species of seagrasses (Table 5). On average, the mean values of the above- and belowground highest biomass and production were 224 ± 18 and 237 ± 28 g DW m-2, respectively. In addition, these authors also reported the values of C. nodosa, Z. marina, and Z. noltei. In general, the highest biomass and the production recorded in the Venice Lagoon were higher both for the above- and belowground of all three species. Shoots and rhizomes were 2-4 times higher for C. nodosa and Z. noltei, and 2 times for Z. marina. The production was 3-4 times higher for shoots of C. nodosa, 2 times for Z. noltei, and very similar for Z. marina. The production of rhizomes was markedly higher for C. nodosa whereas for Z. marina it was almost half. No information for the rhizomes of Z. noltei is available. The greater biomass recorded in the Venice Lagoon probably depends on the choice to study compact prairies to obtain information under optimal growth conditions. However, higher biomass and production data were also recorded by Sfriso and Ghetti (1998) who studied the annual growth of the same species in different areas of the Venice Lagoon. In addition, studies in progress show that in 2021 angiosperm biomass and production increased further.
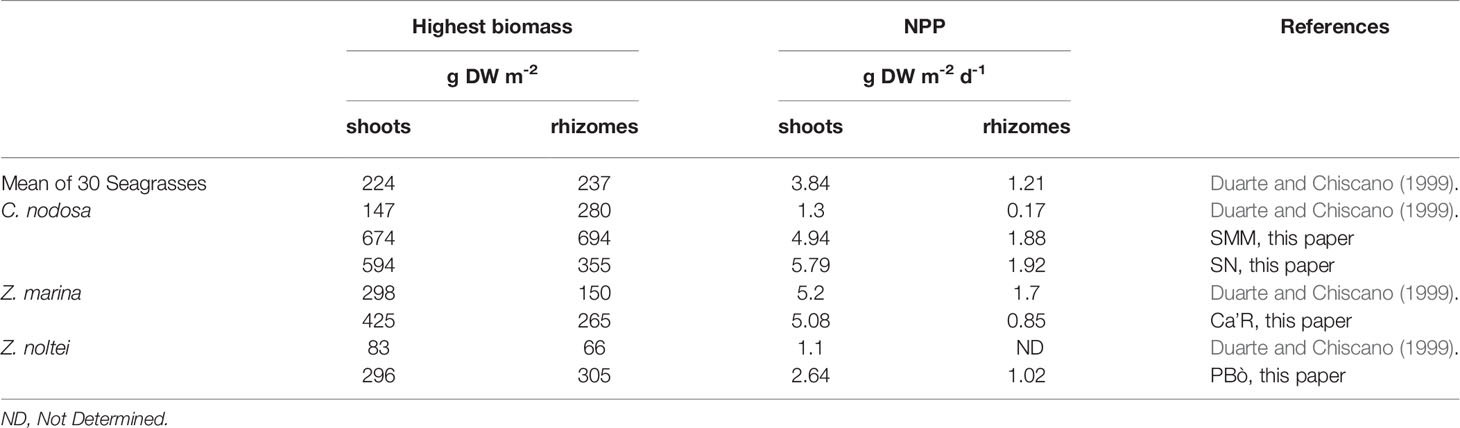
Table 5 Comparison of angiosperm biomass and Net Primary Production (NPP).
Moreover, the recovery of angiosperm meadows contributed to a further environmental recovery accelerating the recolonization of fish species both of commercial and conservation interest (Jackson et al., 2001; Blandon and Zu Ermgassen, 2014; Bonometto et al., 2018; Scapin et al., 2018; Scapin et al., 2019) and is changing the composition of the benthic macrofauna (Orth et al., 1984; Sfriso et al., 2001; Leopardas et al., 2014; Lin et al., 2018; Mariño et al., 2018) living in these underwater forests.
These results confirm that the recovery of highly degraded TWS, such as the Venice Lagoon was up to the early 2000s, is easily achievable provided there is low trophy and clear waters. Indeed, even small reductions in anthropogenic impacts, especially in basins with high tidal exchange, can favor a rapid or progressive environmental recovery thanks to the high resilience of these environments.
Data Availability Statement
The raw data supporting the conclusions of this article will be made available by the authors, without undue reservation.
Author Contributions
AS: funding acquisition, conceptualization, methodology, formal analysis, writing–original draft; AB, AAS: methodology, formal analysis, writing–review and editing; KS, MW, YT, A-SJ: formal analysis, writing–review and editing. All authors contributed to the article and approved the submitted version.
Conflict of Interest
The authors declare that the research was conducted in the absence of any commercial or financial relationships that could be construed as a potential conflict of interest.
Publisher’s Note
All claims expressed in this article are solely those of the authors and do not necessarily represent those of their affiliated organizations, or those of the publisher, the editors and the reviewers. Any product that may be evaluated in this article, or claim that may be made by its manufacturer, is not guaranteed or endorsed by the publisher.
Acknowledgments
Scientific activity was performed in the following research programs: Venezia2021, coordinated by CORILA (consortium for coordination of research activities concerning the Venice Lagoon system), with the contribution of the Provveditorato for the Public Works of Veneto, Trentino Alto Adige and Friuli Venezia Giulia and MoVEco III (ecological monitoring of the Venice Lagoon), between ARPA (Regional Agency for Environmental Protection) Veneto and Ca’ Foscari University of Venice - Department of Environmental Sciences, Informatics and Statistics.
Supplementary Material
The Supplementary Material for this article can be found online at: https://www.frontiersin.org/articles/10.3389/fmars.2022.882463/full#supplementary-material
References
Blandon A., Zu Ermgassen P. S. E. (2014). Quantitative Estimate of Commercial Fish Enhancement by Seagrass Habitat in Southern Australia. Estuar. Coast. Shelf. Sci. 141, 1–8. doi: 10.1016/j.ecss.2014.01.009
Bonometto A., Sfriso A., Oselladore F., Ponis E., Cornello M., Facca C. (2018). “Il Trapianto Di Fanerogame Acquatiche Come Misura Per Il Ripristino Delle Lagune Costiere,” in Quaderni – Ricerca Marina, vol. 12/2018. (Roma: ISPRA), 1–52.
Carstensen J., Conley D., Andersen J., Aertebjerg G. (2006). Coastal Eutrophication and Trend Reversal: A Danish Case Study. Limnol. Oceanogr. 1 (2), 398–408. doi: 10.4319/lo.2006.51.1_part_2.0398
Cucco A., Umgiesser G. (2006). Modeling the Venice Lagoon Residence Time. Ecol. Model. 193, 34–51. doi: 10.1016/j.ecolmodel.2005.07.043
Dennison W. C. (1990a). “Leaf Production,” in Seagrass Research Methods. Eds. Phillips R. C., McRoy C. P. (Mayenne, France: UNESCO, Imprimerie de la Manutention), 77–79.
Dennison W. C. (1990b). “Rhizome-Root Production,” in Seagrass Research Methods. Eds. Phillips R. C., McRoy C. P. (Mayenne, France: UNESCO, Imprimerie de la Manutention), 81–82.
De Toni G. B. (1889). “Sylloge Algarum Omnium Hucusque Cognitarum,” in Chlorophyceae. Sectio I–II, Vol I. (Patavii: Patavii, Padua), CXXXIX + 1315.
De Toni G. B. (1895). “Sylloge Algarum Omnium Hucusque Cognitarum,” in Fucoideae. Sectio III, Vol. III. (Patavii: Patavii, Padua), XVI + 638.
De Toni G. B. (1897). “Sylloge Algarum Omnium Hucusque Cognitarum,” in Florideae, Sectio I, Vol. IV. (Patavii: Patavii, Padua), ILXI + 338.
De Toni G. B. (1900). “Sylloge Algarum Omnium Hucusque Cognitarum,” in Florideae, Sectio Ii, Vol. IV. (Patavii: Patavii, Padua), 387–776.
De Toni G. B. (1903). “Sylloge Algarum Omnium Hucusque Cognitarum,” in Florideae, Sectio III, Vol. IV. (Patavii: Patavii, Padua), 775–1525.
De Toni G. B. (1905). “Sylloge Algarum Omnium Hucusque Cognitarum,” in Florideae, Sectio Iv, Vol. IV. (Patavii: Patavii, Padua), 1523–1973.
De Toni G. B. (1907). Sopra Alcune Polysiphonia Inedite O Rare. Nuova. Notarisia. (Patavii: Patavii, Padua) 18, 153–168.
De Toni G. B. (1924). “Sylloge Algarum Omnium Hucusque Cognitarum,” in Florideae, Sectio V, Vol. IV. (Patavini: Patavii, Padua), XI + 767.
De Toni G. B., Levi D. (1885). “Flora Algologia Della Venezia,” in Le Floridee (Venezia: Tip. Antonelli), 182.
De Toni G. B., Levi D. (1886). “Flora Algologia Della Venezia,” in Le Melanoficee (Venezia: Tip. Antonelli), 107.
De Toni G. B., Levi D. (1888a). “Flora Algologia Della Venezia,” in Le Cloroficee (Venezia: Tip. Antonelli), 206.
De Toni G. B., Levi D. (1888b). Collezioni Botaniche, L’algarium Zanardini. Catalogo Alfabetico-Geografico Dell’algarium Del Civico Museo E Raccolta Correr in Venezia (Venezia: Tip. Fontana), 144.
Duarte C., Chiscano C. L. (1999). Seagrass Biomass and Production: A Reassessment. Aquat. Bot. 65, 159–174. doi: 10.1016/S0304-3770(99)00038-8
European Commission. (2000). Directive 2000/60/EC of the European Parliament and of the Council of 23 October 2000 Establishing a Framework for Community Action in the Field of Water Policy. Off. J. Eur. Communities. 327, 1–72.
Gamito S., Gilabert J., Marcos C., Pérez-Ruzafa A. (2005). “Effects of Changing Environmental Conditions on Lagoon Ecology,” in Coastal Lagoons: Ecosystem Processes and Modeling for Sustainable Use and Development. Eds. Gönenç I. E., Wolflin J. P. (Boca Ratón, FL: CRC Press), 193–229.
Howarth R., Chan F., Conley D. J., Garnier J., Doney S. C., Marino R., et al. (2011). Coupled Biogeochemical Cycles: Eutrophication and Hypoxia in Temperate Estuaries and Coastal Marine Ecosystems. Front. Ecol. Environ. 9, 18–26. doi: 10.1890/100008
Hsieh H.-H., Chuang M.-H., Shih Y.-Y., Weerakkody W. S., Huang W.-J., Hung C. C., et al. (2021). Eutrophication and Hypoxia in Tropical Negombo Lagoon, Sri Lanka. Front. Mar. Sci. 8 (1-13), 678832. doi: 10.3389/fmars.2021.678832
ISPRA. (2011). Protocolli Per Il Campionamento E La Determinazione Degli Elementi Di Qualità Biologica E Fisico-Chimica Nell’ambito Dei Programmi Di Monitoraggio Ex 2000/60/CE Delle Acque Di Transizione. El-Pr-TW-Protocolli Monitoraggio- 03.06 (Roma: ISPRA).
Jackson E. L., Rowden A. A., Attrill M. J., Bossey S. J., Jones M. B. (2001). The Importance of Seagrass Beds as a Habitat for Fishery Species. Oceanogr. Mar. Biol. Annu. Rev. 39, 269–303. doi: 10.4236/ns.2012.48069
Kralj M., De Vittor C., Comici C., Relitti F., Auriemma R., Alabiso G., et al. (2016). Recent Evolution of the Physical-Chemical Characteristics of a Site of National Interest – The Mar Piccolo of Taranto (Ionian Sea) – and Changes Over the Last 20 Years. Environ. Sci. Pollut. Res. 23, 12675–12690. doi: 10.1007/s11356-015-5198-8
Leopardas V., Uy W., Nakaoka M. (2014). Benthic Macrofaunal Assemblages in Multispecific Seagrass Meadows of the Southern Philippines: Variation Among Vegetation Dominated by Different Seagrass Species. J. Exp. Mar. Biol. Ecol. 457, 71–80. doi: 10.1016/j.jembe.2014.04.006
Lin J., Huang Y., Arbi U. Y., Lin H., Azkab M. H., Wang J., et al. (2018). An Ecological Survey of the Abundance and Diversity of Benthic Macrofauna in Indonesian Multispecific Seagrass Beds. Acta Oceanol. Sin. 37, 82–89. doi: 10.1007/s13131-018-1181-9
Mannino A. M., Menéndez M., Obrador B., Sfriso A., Triest L. (2015). The Genus Ruppia L. (Ruppiaceae) in the Mediterranean Region: An Overview. Aquat. Bot. 124, 1–9. doi: 10.1016/j.aquabot.2015.02.005
Marcomini A., Sfriso A., Pavoni B., Orio A. A. (1995). “Eutrophication of the Lagoon of Venice: Nutrient Loads and Exchanges,” in Eutrophic Shallow Estuaries and Lagoons. Ed. Comb A. JMc (Boca Raton, FL., U.S.A: CRC Press), 59–80.
Mariño J., Mendoza M. D., Sánchez B. L. (2018). Composition and Abundance of Decapod Crustaceans in Mixed Seagrass Meadows in the Paraguaná Peninsula, Venezuela. Iheringia. Série. Zool. 108, 2018004. doi: 10.1590/1678.4766e2018004
McCrackin M. L., Jones H. P., Jones P. C., Moreno-Mateos D. (2016). Recovery of Lakes and Coastal Marine Ecosystems From Eutrophication: A Global Meta-Analysis. Limnol. Oceanogr. 62, 507–518. doi: 10.1002/lno.10441
Naccari F. L. (1828). Algologia Adriatica. Stamperia Cardinali E. frulli: Bologna 157. doi: 10.5962/bhl.title.68746
Olivi G. (1794). Sopra Una Nuova Specie Di Ulva Delle Lagune Venete. Saggi Scientifici E Letterari Dell’Accademia Di Padova. Padova 3, 1.
Orth R., Heck K. L., Van Montfrans J. (1984). Faunal Communities in Seagrass Beds. A Review of the Influence of Plant Structure and Prey Characteristics on Predator Prey Relationships. Estuaries 7 (4), 339–350.
Pavoni B., Marcomini A., Sfriso A., Donazzolo R., Orio A. A. (1992). “Changes in an Estuarine Ecosystem. The Lagoon of Venice as a Case Study,” in The Science of Global Change. Eds. Dunnette D. A., O'Brien R. J. (Washington, D.C., U.S.A: American Chemical Society), 287–305.
Pérez-Ruzafa A., Marcos C., Bernal C. M., Quintino V., Freitas R., Rodrigues A. M., et al. (2012). Cymodocea Nodosa vs. Caulerpa Prolifera: Causes and Consequences of a Long-Term History of Interaction in Macrophyte Meadows in the Mar Menor Coastal Lagoon (Spain, Southwestern Mediterranean). Estuar. Coast. Shelf. Sci. 110, 101–115. doi: 10.1016/j.ecss.2012.04.004
Pignatti S. (1962). “Associazioni Di Alghe Marine Sulla Costa Veneziana. Mem,” vol. 32, Fasc. 3. (Ist. Veneto Sci, Lett. Arti, Cl. Sci. Mat. Nat), 1–134.
Pranovi F., Giovanardi O. (1994). The Impact of Hydraulic Dredging for Shortnecked Clams, Tapes Spp, on an Infaunal Community in the Lagoon of Venice. Sci. Mar. 58, 345–53.
Project LIFE12 NAT/IT/000331. (2012). Habitat 1150* (Coastal lagoon) recovery by SEagrass RESTOration. A New Strategic Approach to Meet HD & WFD Objectives. Available at: http://www.lifeseresto.eu.
Rodrigo M. A., Martin M., Rojo C., Gargallo S., Matilde Segura M., Oliver N. (2013). The Role of Eutrophication Reduction of Two Small Man-Made Mediterranean Lagoons in the Context of a Broader Remediation System: Effects on Water Quality and Plankton Contribution. Ecol. Eng. 61, 371–382. doi: 10.1016/j.ecoleng.2013.09.038
Scapin L., Zucchetta M., Sfriso A., Franzoi P. (2018). Local Habitat and Seascape Structure Influence Seagrass Fish Assemblages in the Venice Lagoon: The Value of Conservation at Multiple Spatial Scales. Estuar. Coast. 41, 2410–2425. doi: 10.1007/s12237-018-0434-3
Scapin L., Zucchetta M., Sfriso A., Franzoi P. (2019). Predicting the Response of Nekton Assemblages to Seagrass Transplantations in the Venice Lagoon: An Approach to Assess Ecological Restoration. Aquat. Conserv.: Mar. Freshw. Ecosyst. 29, 849–864. doi: 10.1002/aqc.3071
Schiffner C., Vatova A. (1938). “Le Alghe Della Laguna: Chlorophyceae, Phaeophyceae, Rhodophyceae, Myxophyceae,” in La Laguna Di Venezia, Vol. 3. Ed. Minio M. (Venezia: Ferrari) 250.
Sfriso A., Birkemeyer T., Ghetti P. F. (2001). Benthic Macrofauna Changes in Areas of Venice Lagoon Populated by Seagrasses or Seaweeds. Mar. Environ. Res. 52, 323–349. doi: 10.1016/S0141-1136(01)00089-7
Sfriso A., Buosi A., Facca C., Sfriso A. A. (2017). Role of Environmental Factors in Affecting Macrophyte Dominance in Transitional Environments: The Italian Lagoons as a Study Case. Mar. Ecol. 38 (2), e12414. doi: 10.1111/maec.12414
Sfriso A., Buosi A., Mistri M., Munari C., Franzoi P., Sfriso A. A. (2019). “Long-Term Changes of the Trophic Status in Transitional Ecosystems of the Northern Adriatic Sea, Key Parameters and Future Expectations: The Lagoon of Venice as a Study Case,” in Italian Long-Term Ecological Research for Understanding Ecosystem Diversity and Functioning. Case Studies From Aquatic, Terrestrial and Transitional Domains, vol. 34. Eds. Mazzocchi M. G., Capotondi L., Freppaz M., Lugliè A., Campanaro A., 193–215.
Sfriso A., Buosi A., Tomio Y., Juhmani A.-S., Facca C., Wolf M., et al. (2021b). Environmental Restoration by Aquatic Angiosperm Transplants in Transitional Water Systems: The Venice Lagoon as a Case Study. Sci. Tot. Environ. 795, 148859. doi: 10.1016/j.scitotenv.2021.148859
Sfriso A., Buosi A., Tomio Y., Juhmani A.-S., Mistri M., Munari C., et al. (2021a). Nitrogen and Phosphorus Trends in Surface Sediments, a Litmus Paper of Anthropogenic Impacts. The Lagoons of the Northern Northern Adriatic Sea as a Study Case. Water 13, 2914. doi: 10.3390/w13202914
Sfriso A., Buosi A., Wolf M. A., Sciuto K., Molinaroli E., Mistri M., et al. (2020b). Microcalcareus Seaweeds a Sentinel of Trophic Changes and CO2 Trapping in Transitional Waters. Ecol. Indic. 118, 1–10. doi: 10.1016/j.ecolind.2020.106692
Sfriso A., Buosi A., Wolf M. A., Sfriso A. A. (2020a). Invasion of Alien Macroalgae in the Venice Lagoon, a Pest or a Resource? Aquat. Invasion. 15 (2), 245–270. doi: 10.3391/ai.2020.15.2.03
Sfriso A., Curiel D. (2007). Check-List of Marine Seaweeds Recorded in the Last 20 Years in Venice Lagoon and a Comparison With the Previous Records. Bot. Mar. 50, 22–58. doi: 10.1515/BOT.2007.004
Sfriso A., Facca C. (2007). Distribution and Production of Macrophytes in the Lagoon of Venice. Comparison of Actual and Past Abundance. Hydrobiologia 577, 71–85. doi: 10.1007/s10750-006-0418-3
Sfriso A., Facca C., Bonometto A., Boscolo R. (2014). Compliance of the Macrophyte Quality Index (MaQI) With the WF/60/EC) and Ecological Status Assessment in Transitional Areas: The Venice Lagoon as Study Case. Ecol. Indic. 46, 536–547. doi: 10.1016/j.ecolind.2014.07.012
Sfriso A., Facca C., Ceoldo S., Silvestri S., Ghetti P. F. (2003). Role of Macroalgal Biomass and Clam Fishing on Spatial and Temporal Changes in N and P Sedimentary Pools in the Central Part of the Venice Lagoon. Oceanol. Acta 26 (1), 3–13. doi: 10.1016/S0399-1784(02)00008-7
Sfriso A., Facca C., Ghetti P. F. (2009). Validation of the Macrophyte Quality Index (MaQI) Set Up To Assess the Ecological Status of Italian Marine Transitional Environments. Hydrobiologia 617, 117–141. doi: 10.1007/s10750-008-9540-8
Sfriso A., Facca C., Marcomini A. (2005). Sedimentation Rates and Erosion Processes in the Lagoon of Venice. Environ. Int. 31 (7), 983–992. doi: 10.1016/j.envint.2005.05.008
Sfriso A., Ghetti P. F. (1998). Seasonal Variation in the Biomass, Morphometric Parameters and Production of Rhizophytes in the Lagoon of Venice. Aquat. Bot. 61, 207–223. doi: 10.1016/S0304-3770(98)00064-3
Sfriso A., Marcomini A. (1994). Gross Primary Production and Nutrient Behaviours in Shallow Lagoon Waters. Bioresour. Technol. 47, 59–66. doi: 10.1016/0960-8524(94)90029-9
Sfriso A., Marcomini A. (1996). Decline of Ulva Growth in the Lagoon of Venice. Bioresour. Technol. 58, 299–307. doi: 10.1016/S0960-8524(96)00120-4
Sfriso A., Raccanelli S., Pavoni B., Marcomini A. (1991). Sampling Strategies for Measuring Macroalgal Biomass in the Shallow Waters of the Venice Lagoon. Environ. Technol. 12, 263–269. doi: 10.1080/09593339109385004
Sfriso A. A., Sfriso A. (2017). In Situ Biomass Production of Gracilariaceae and Ulva Rigida: The Venice Lagoon as Study Case. Bot. Mar. 60 (3), 271–283. doi: 10.1515/bot-2016-0061
Sighel A. (1938). La Distribuzione Stazionale E Stagionale Delle Alghe Nella Laguna Di Venezia. Mem. Comit. Talass. Ital. Officine Grafiche Ferrari. Memoria. CCL., 123.
Smith V. H. (2003). Eutrophication of Freshwater and Coastal Marine Ecosystems a Global Problem. Environ. Sci. Pollut. Res. 10, 126–139. doi: 10.1065/espr2002.12.142
Sorokin P., Yu S. 1., Yu I., Boscolo R., Giovanardi O. (2004). Bloom of Picocyanobacteria in the Venice Lagoon During Summer–Autumn 2001: Ecological Sequences. Hydrobiologia 523, 71–85. doi: 10.1023/B:HYDR.0000033096.14267.43
Vatova A. (1940). Distribuzione Geografica Delle Alghe Nella Laguna Veneta E Fattori Che La Determinano. Thalassia 4, 1–36.
Viaroli P., Christian R. R. (2003). Description of Trophic Status, Hyperautotrophy and Dystrophy of a Coastal Lagoon Through a Potential Oxygen Production and Consumption Index - TOSI: Trophic Oxygen Status Index. Ecol. Indic. 3, 237–250. doi: 10.1016/j.ecolind.2003.11.001
Vybernaite-Lubiene I., Zilius M., Giordani G., Petkuviene J., Vaiciute D., Bukaveckas P. A., et al. (2017). Effect of Algal Blooms on Retention of N, Si and P in Europe’s Largest Coastal Lagoon. Estuar. Coast. Shelf. Sci. 194, 217–228. doi: 10.1016/j.ecss.2017.06.020
Keywords: aquatic angiosperms, biomass, environmental recovery, macroalgae, primary production, Venice Lagoon
Citation: Sfriso A, Buosi A, Sciuto K, Wolf M, Tomio Y, Juhmani A-S and Sfriso AA (2022) Effect of Ecological Recovery on Macrophyte Dominance and Production in the Venice Lagoon. Front. Mar. Sci. 9:882463. doi: 10.3389/fmars.2022.882463
Received: 23 February 2022; Accepted: 11 April 2022;
Published: 31 May 2022.
Edited by:
Martina Orlando-Bonaca, National Institute of Biology (Slovenia), SloveniaReviewed by:
Vasillis Papathanasiou, Hellenic Agricultural Organization – ELGO, GreeceSotiris Orfanidis, Institute of Fisheries Research, Greece
Copyright © 2022 Sfriso, Buosi, Sciuto, Wolf, Tomio, Juhmani and Sfriso. This is an open-access article distributed under the terms of the Creative Commons Attribution License (CC BY). The use, distribution or reproduction in other forums is permitted, provided the original author(s) and the copyright owner(s) are credited and that the original publication in this journal is cited, in accordance with accepted academic practice. No use, distribution or reproduction is permitted which does not comply with these terms.
*Correspondence: Adriano Sfriso, sfrisoad@unive.it