The Urban Metabolism of Lima: Perspectives and Policy Indications for GHG Emission Reductions
 Angelo Facchini
 R. Mele3
  Guido Caldarelli
- 1IMT School for Advanced Studies Lucca, Lucca, Italy
- 2National Research Council – Institute for Complex Systems, Rome, Italy
- 3Enel X, Rome, Italy
- 4DSMN and ECLT, Universitá Ca' Foscari, Venice, Italy
The urban metabolism of Metropolitan Lima, the largest urban agglomeration in Peru, which has recently surpassed 10 million inhabitants, was analyzed in this study. This coastal megacity, located within the Rimac, Chillón, and Lurin watersheds constitutes the socioeconomic center of the country and is the hub of the main import and export routes. A multi-layer approach was used to explore material and energy flows in the Peruvian capital for a 10-year timeframe. Results show that in 2006 the GDP of the 49 districts that shape the metropolitan area of Lima was 105.2 billion USD-PPP, while in 2014 it reached about 200 billion USD-PPP. Based on this growth, we highlight that energy, electricity and water flows experienced a linear increase with respect to GDP, being the electricity consumption in years 2006, 2011 and 2014, 7295, 10,112, and 11,465 GWh, respectively. Regarding demographics, population growth ratios of GDP (650%), electricity consumption (400%), solid waste production (250%), and water (100%) confirm the results of super linear scaling found by Kennedy et al. (2015) for the other megacities. Finally, the increase in greenhouse gas (GHG) emissions was computed following an important shift in the primary energy sources to produce electricity. The most important change was linked to the shift from hydropower to natural gas, a trend that initiated in 2006. For instance, in 2001 79% of the total electricity production came from hydropower, whereas in 2014 69% was linked to natural gas. This shift produced an increase of GHG emissions of more than 200% in 2014 when compared to the electricity generation mix of 2001. Following these results, we strongly encourage policies for the decarbonization of the electricity production sector, as well as for mobility infrastructures, e.g., electric public and transport sector, with a progressive shift toward electric mobility.
Introduction
More than 54% of the world's population currently lives in cities. Hence, major material, water and energy flows are connected to these systems (Hodson et al., 2012) and resource use is expected to increase in the future, as the urban population is projected to increase to 70% in 2050. While these resources are essential to carry out the diverse array of activities performed in urban systems, their unprecedented consumption and the associated unsustainable waste generation cause important environmental impacts that affect society and biodiversity. Thus, it is critical to expand our understanding on urban systems and related socio-technical processes and outcomes. Such a complex scenario triggers the need to use a method with a holistic approach that can assess the sustainability of a city as a whole system, where all the parameters considered are deeply interconnected and influence one another (Böhringer and Jochem, 2007; Maranghi et al., 2020). The multiple interactions and interconnections that a complex city system shows should be managed considering the framework of urban thermodynamics. This deals with the application of the thermodynamic laws and concepts to identify and support the quantification of city dimensions and subdimension, flows, links and correlations that are present in a complex system like a city (Filchakova et al., 2012).
A methodological approach capable of assessing the material and energy flows of urban system is Urban Metabolism – UM (Kennedy C. et al., 2007; Pincetl et al., 2012). In recent years, there was also a particular interest in expanding the UM framework beyond biophysical parameters to include measures of social wellbeing. This has previously been explored in a study of Sydney's UM performed by Newman (1999), who proposed an extended metabolism model including livability measures of health, employment, income, education, housing, leisure and community activities. Under Newman's approach, however, these social indicators were simply added to the biophysical parameters. A more integrative approach would recognize that social, health and economic impacts are inherently related to UM. In this line of thinking, Kennedy (2014) developed a multi-layered survey for UM studies involving socio-economic aspects and the role of policy makers and utilities.
Indeed, the concept of urban metabolism provides a means of understanding the sustainable development of cities by drawing an analogy with the metabolic processes of organisms. The parallels are strong: “Cities transform raw materials, fuel, and water into the built environment, human biomass and waste” (Decker et al., 2000). In practice, the study of urban metabolism (in urban ecology) requires quantification of the inputs, outputs, and storage of energy, water, nutrients, materials, and wastes. In other words, UM is a metaphorical framework that can be used to evaluate the interactions (i.e., flows) between natural and urban ecosystems. The metabolism provides measures of resource efficiency and the degree of circularity of resource streams and may be helpful in identifying opportunities to improve these measures. UM also provides a mean to understand processes such as rising or falling groundwater levels, urban heat islands, accumulation of nutrients, and the long-terms impacts of hazardous materials stored in the building stock (Kennedy C. et al., 2007; Kennedy et al., 2015). In addition, there is a variety of practical reasons for applying the UM approach. First, the metabolism parameters provide suitable measures of the magnitude of resource exploitation and waste generation for use as sustainability indicators. The metabolism provides measures of resource efficiency and the degree of circularity of resource streams, and may be helpful in identifying opportunities to improve these measures. As well as enabling comprehensive accounting of the stocks and flows through cities, UM also provides a context to understand critical processes such as rising or falling groundwater levels, urban heat islands, accumulation of nutrients, and the long-terms impacts of hazardous materials stored in the building stock. It is pertinent for urban policy makers to understand the metabolism of their cities, to consider to what extent their nearest resources are close to exhaustion and, where necessary, to develop appropriate strategies to slow exploitation.
In this paper we study the Metropolitan Lima, Peru's capital city, by assessing its UM to understand the technical and socioeconomic processes and to quantify its material and energy flows in the past decade. Recently, Metropolitan Lima, the largest urban agglomeration in Peru, has surpassed 10 million inhabitants. This coastal megacity, located within the Rimac, Chillón, and Lurin watersheds, is the socio-economic center of the country and is the hub of the principal import and export routes. To assess its UM the methodological approach proposed by Kennedy and colleagues was used (Kennedy, 2014), who developed a survey according to a multi-layered model of the city.
This paper is organized as follows: in section Materials and Methods the data and the methods used are described; section Results focuses on the results linked to energy and material flows in Lima from a temporal perspective, focusing on the period 2001–2014. Finally, conclusions are stated in section Discussion and conclusions.
Materials and Methods
Urban Metabolism
Urban metabolism (UM) is defined as “the sum total of the technical and socio-economic processes that occur in cities, resulting in growth, production of energy, and elimination of waste” (Kennedy C. et al., 2007). An analysis of UM involves quantification of a city's inputs, outputs and storage of energy, materials, nutrients, water, and wastes. The advantages of using UM as a unifying framework to study sustainable urban development are well described by Kennedy et al. (2011), since it: (i) explicitly identifies the system's boundaries; (ii) accounts for inputs and outputs to the system; (iii) includes decomposable elements for targeted, sectoral research; (iv) is an adaptive approach to solutions and their consequences; and (v) integrates social science and biophysical science/technology. Analysis of UM is becoming recognized as a standard and necessary step toward sustainable urban development (Kennedy and Hoornweg, 2012), and is usually studied or measured by aggregate parameters, although this does not preclude finer scale analysis, but at a first level of engagement, UM is usually quantified by bulk measures such as total annual energy and mass flows. This parallels the way in which human metabolism is measured by aggregated measures such as total energy or oxygen input per day.
Data
Data have been collected by the authors by means of a survey developed according to the multi-layered method proposed by Kennedy (2014). Data have been collected for years 2001, 2006, and 2011–2014, and refer to the metropolitan area of Lima, including the provinces of Lima and Callao, an urban agglomeration of 9.7 million inhabitants as of 2014. In a further step, the database integrity has been checked and data have been validated, filtered and out layered values have been corrected.
Results
On a general view, regarding the biophysical characteristics, the total land area of Lima is around 2,670 km2, out of which 930 km2 were classified as urbanized area in 2011. Moreover, the building gross floor area was calculated to be 428 km2 in 2014, while the residential area is around 190 km2. Electricity consumption for years 2006, 2011, and 2014, was 7295, 10,112, and 11,465 GWh, respectively. In addition, between the studied years (2001–2014) there has been an important shift in the primary energy sources to produce electricity. For example, in 2001, 79% of the total production came from hydropower, while in 2014, 69% came from natural gas. This shift is caused by the exploitation of the large natural gas deposit present in Peru, triggered by the construction of Peru LNG, the first natural gas liquefaction plant in South America, and by the political decision to use the resources to produce electricity and to fuel private and public mobility. Moreover, there has been a drastic reduction of kerosene consumption in the Peruvian capital: from 11,984 TJ in 2001 to zero in 2014. Similarly, the consumption of water in year 2001 was 379 million m3, by 2006 it had increased to 450 million m3, it reached 503 million m3 in 2011, and was 536 million m3 in 2014. Under the economic point of view, in 2014 the GDP of the 49 districts that shape Metropolitan Lima was, approximately, 311 billion soles1 (i.e., 200 billion USD-PPP). Moreover, 12 years earlier, in 2006, this value was 148 billion soles (i.e., 105.2 billion USD-PPP).
Going in deeper detail, our analysis of the metabolic flows starts by considering the impact of the population growth in the last decade. As one of the main drivers of UM, a super linear scaling has been found for megacities by Kennedy et al. (2015). For each flow we have computed the growth rate GR (i.e., the percent growth in time), and Figure 1 shows that in the period 2001–2014 the growth rates of GDP, electricity consumption, total energy consumption, and water consumption grew faster with respect to the population. In particular, following a population increase of ca. 20% in the period 2001–2011, the most relevant increase has been observed for GDP (>180%) and electricity (~120%). This result is also consistent with previous findings in other Latin American megacities evaluated (Kennedy et al., 2015; Facchini et al., 2017).
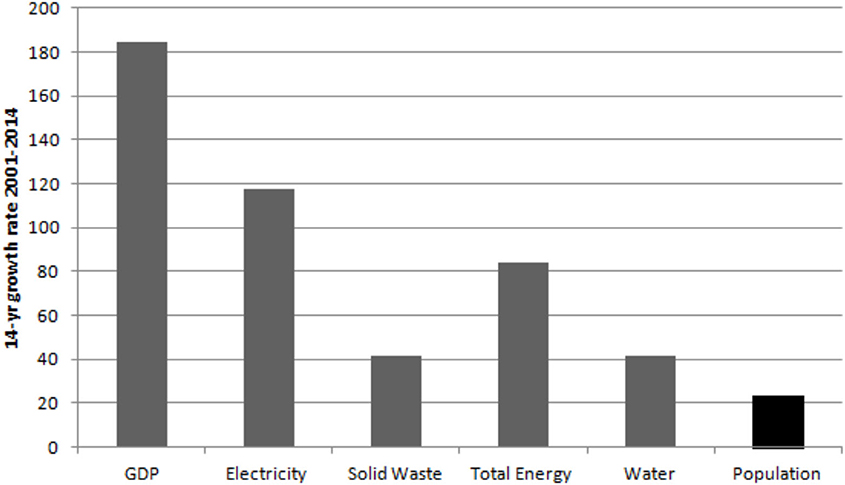
Figure 1. Percent growth of metabolic flows in the period 2001–2014.
A further information about the impact of population growth on the urban flows can be extracted by considering the ratio between the 14-year growth rates of the flows with respect to population, i.e., we look at the elasticity values of the flows with respect to the population. Table 1 shows that both GDP and electricity experienced a relevant increase, while solid waste consumption and water consumption are slightly below 1.
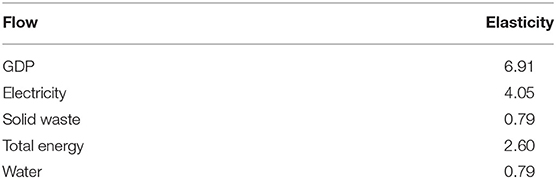
Table 1. Elasticity of the metabolic flows with respect to population.
Observing elasticity values over 1, and in general well above 5 and 6 (when considering other megacities) is of particular interest under the point of view of sustainability and efficient use of resources. In general, according to the recent findings on megacities research (Kennedy et al., 2015; Facchini et al., 2017) the super linear scaling of the flows with respect to the population increase should not be surprising: cities are powerful engines of economic growth, and especially in the emerging and developing countries are spatial accumulation regions that attracts a consistent amount of people. In addition, especially in megacities of fast-growing economies, as for the case of Latin America, people are rapidly exiting from the low-income bracket joining the middle class, yielding an increase of GDP and electricity consumption. This also means that they climb the energy ladder by shifting to more efficient energy sources, being at the top of the ladder electricity. Furthermore, Liddle and Lung (2014) show a direct link between electricity and GDP, while a further relationship between GDP and access to electricity share has been provided by Stewart et al. (2018). In addition, switching to more efficient fuels for a significative part of the population may lead to the emergence of rebound effect (Greening et al., 2000; Hertwich, 2005). In particular, values over 70% have been observed in households of selected Chinese cities, while a rebound effect over 100% in Chinese megacities economies has been recently observed by Shao et al. (2019). Therefore, as a first hypothesis we could argue that the high elasticity values observed may be caused by a mix of socio-economic factors, infrastructure improvement, and citizens' behavior. On the contrary, other metabolic flows are found to be rigid with respect to the population: water consumption and waste collection have both values around 0.79. Water consumption may be rigid because Lima lays in a water-scarce area, and effective policies have been implemented with the aim to reduce water consumption. Furthermore, water and waste collection infrastructures are basically different from energy infrastructure, especially when considering the electricity distribution network. In fact, while over 99% of the households are connected to the electricity grid, household with water connections are 86%, while public waste collection is estimated to be around 70%. Therefore, while electricity is available for the news urban people (including those living in slums), water and waste collection is not ubiquitous and do not suffer from high elasticity values.
The close relation between GDP and electricity consumption is made more evident when looking at the temporal evolution of metabolic flows in relation to GDP, where a significant linear correlation was identified for the different flows (i.e., energy, water, and waste). For instance, Figures 2, 3, respectively, show the values of total energy consumption and electricity consumption as compared to GDP. Both follow with great accuracy a linear model, showing that energy and electricity consumption continuously increased in the period 2001–2014. Material flows, namely water consumption and waste collection also follow with a similar degree of accuracy this linear model when compared to GDP. This confirms the connection of urban flows with GDP as also observed by Liddle and Lung (2014) and literature cited therein. Table 2 reports the values of the correlation coefficients and of R2 for the linear models considered.
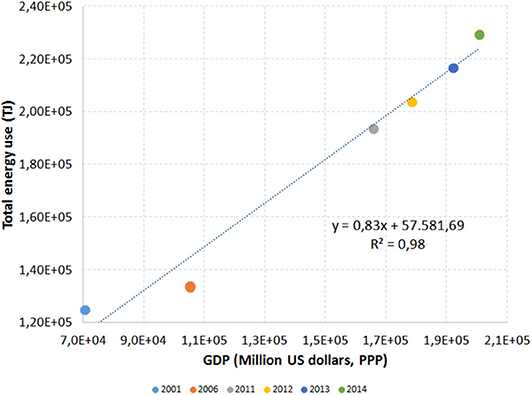
Figure 2. Evolution of total energy use vs. GDP.
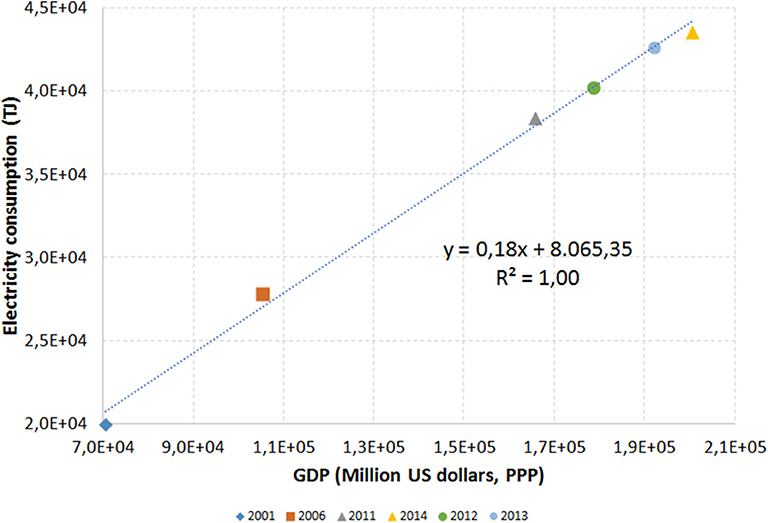
Figure 3. Temporal evolution of electricity consumption vs GDP.
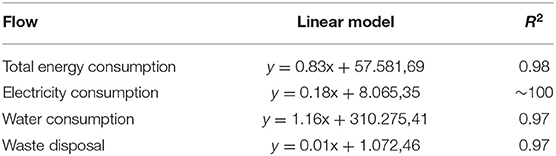
Table 2. Linear models of metabolic flows with respect to GDP.
Focusing on energy, the total consumption patterns have been analyzed. Total energy is the energy consumed both for mobile and stationary end use, while for stationary energy we mean those energy forms that do not involve mobility, e.g., end-use electricity consumption, heating and cooling fuels. Further, mobile energy includes the energy sources used for public and private transportation, such as gasoline, diesel, jet and marine fuels. As shown in Figure 4, consistent differences are presented within the years 2006–2011, both under the point of view of total values (from ~133.000 to ~193.000 TJ) and under the point of view of the disaggregated types of fuel used. In particular, for years 2001–2006 while the use of diesel, jet fuel, gasoline, and coal remains substantially unchanged, in 2006 the city began to rely on gas for its energy needs, in particular CNG, LPG and natural gas. Indeed, natural gas is the energy source that experienced the more significant change in the last decade. This change is observed both in the transportation sector and in the electricity generation sector.
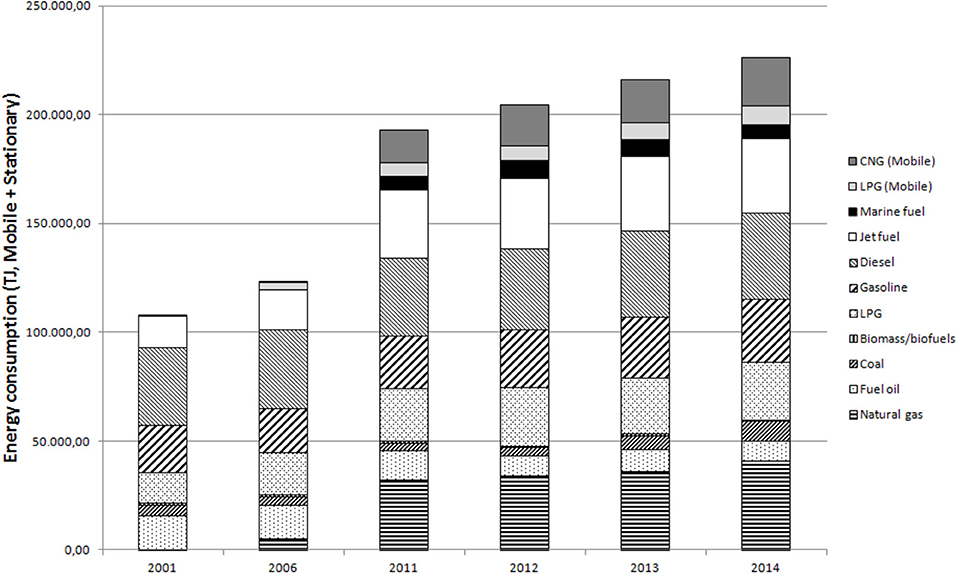
Figure 4. Temporal evolution of total energy consumption showing different fuels.
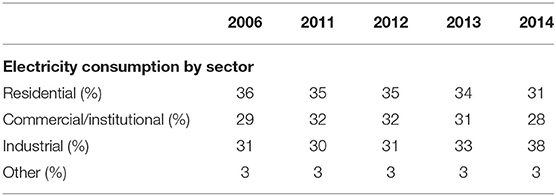
With regards to transportation, in 2001 natural gas was not the major energy carrier, while in 2006 and 2011 the consumption was 278 and 15162 TJ, respectively. Furthermore, in 2014, the consumption was 22366 TJ. After the arrival of natural gas to Lima and due to the big push from the government to stimulate the use of natural gas as an alternative to gasoline, the consumption of natural gas increased rapidly in the period 2004–2011. The consumption of CNG is related mainly to passenger cars. In this sense, the automotive fleet has experienced a sharp increase in CNG vehicles, from 5,433 vehicles in 2006, to 127265 in 2011 and 197151 in 2014 (OSINERGMIN, 2015). Electricity consumption patterns by sectors did not change significantly in the examined period, as depicted the following table:
Electricity generation patterns experienced the most notable change in the UM of Lima. Figure 5 shows the evolution of electricity generation mix in the period considered. The sources of primary energy to produce electricity have changed significantly in the past 15 years. In 2001, Lima's electricity demand was covered mainly with hydroelectric power, with 79% of the total consumption from hydroelectric and 21% from oil and natural gas. At that time, hydropower was dominating the whole electricity market. The extraction of domestic natural gas, which started in 2004, changed the power generation market. Indeed, the percentages have varied ever since, with a tendency of natural gas to become more relevant in the electricity grid. Hence, while in 2006 hydroelectric power was still highly dominant (77%) as compared to natural gas (15%), it has slowly commenced to dwindle. By 2011 it has reduced to a 45% hydro and 51% natural gas, and finally to 30% hydro, 69% natural gas in 2014.
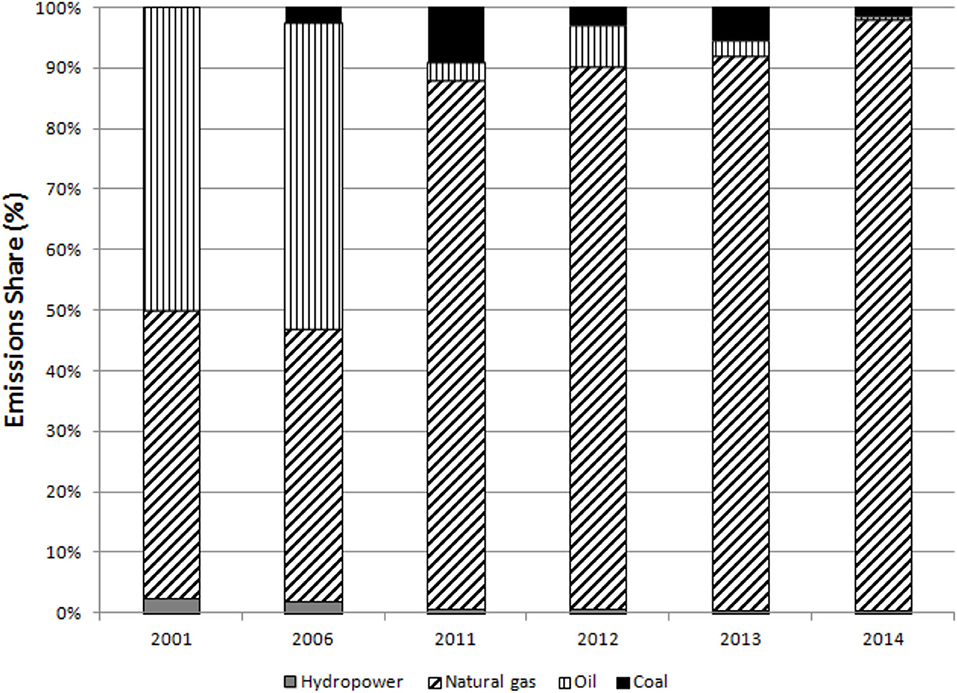
Figure 5. Evolution of the energy generation mix for years 2001–2014.
This radical change has mainly impacted the greenhouse gas (GHG) emissions linked to electricity production, as reported by Vázquz-Rowe et al. (2015). To highlight this, we compute the carbon emissions according to two conditions: the first one considers the actual evolution of the electricity generation mix, while the second one ignores the shift toward the GNG and assumes an electricity mix based on hydropower. Figure 6 shows the CO2eq emissions according to the two above-mentioned conditions, clearly pointing out that the switch to natural gas caused an increase of emissions about two times larger in the period 2011–2014. In particular, referring to 2014, the current emissions are about 6.5 × 10³kt, against the 2.5 × 10³kt computed according to the 2001 generation mix.
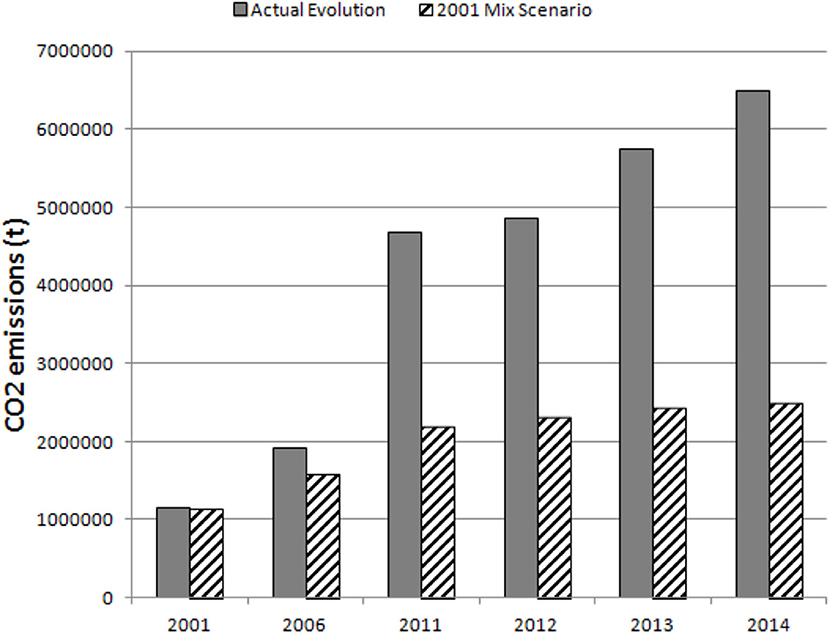
Figure 6. Comparison of CO2 equivalent emissions considering different electricity generation mix.
Discussion and Conclusions
In this paper the temporal evolution of the energy and material flows of Metropolitan Lima were assessed. A direct relation of the metabolic flows with GDP was demonstrated, finding that linear models able to describe with greater accuracy the temporal evolution of electricity, energy, and water consumption, as well as solid waste disposal. In addition, population is a relevant factor, as we find that the increase of flows with time is in line with the other megacities of the area, and further confirms that metabolic flows and GDP are significantly triggered by small increments of the population, also confirming the super linear scaling found for other megacities (Kennedy et al., 2015). By entering in better detail in the energy consumption mix of Lima, we point out that since 2006 Lima started relying on natural gas for its energy needs both for stationary and mobile energy use, resulted in a deep shift in the GHG emission of the megacity. This produced a relevant impact in terms of CO2 emissions, in particular those concerning the electricity generation mix, which has doubled its carbon footprint in the last decade. According to these results, we strongly encourage policies for the decarbonization of the electricity production sector, as well as for mobility infrastructures, e.g., electric public and transport sector, with a progressive shift toward electric mobility relying on renewable energy sources.
Future directions will be devoted to a more detailed analysis of sustainable energy use patterns, with a particular interest in the household sector and in sustainable mobility solutions, with a focus on electric vs. LNG fueled public mobility. Under the point of view of urban metabolic flows in a circular economy perspective, elasticity values over 1 are likely to be considered a symptom of scarce circularity and low efficiency in the use of resources. Indeed, a more rigid behavior of the metabolic flows with respect to population are likely to be attained by introducing efficiency and circularity policies for flows. Efficiency policies are more suitable for energy consumption, while circularity policies are more indicated for material flows, like water, wastewater and solid waste. This division should not be considered hard. By example degraded energy can be used for heating and waste can be incinerated entering again the energy recycling process. Furthermore, circularity accounting with urban metabolism may be considered a simple and efficient way to avoid pitfalls like energy or material losses in recycling processes, an issue that has been pointed out by Cullen (2017). Finally, to evaluate the performance of circularity policies we think that a material flow accounting approach may give important insights to policy/decision makers both under the qualitative and quantitative point of view.
Data Availability Statement
The datasets generated for this study are available on request to the corresponding author.
Author Contributions
AF analyzed data and wrote the paper. AF, RM, and GC designed the research. All authors contributed to the article and approved the submitted version.
Funding
This research has been supported and financed by the Enel Foundation. AF and GC are supported by the project SoBigData (EC grant no. 654024) and SoBigData++ (EC grant no. 871042). A preliminary version of this paper has been published in the proceedings of the BIWAES conference, Naples, 2017.
Conflict of Interest
The authors declare that the research was conducted in the absence of any commercial or financial relationships that could be construed as a potential conflict of interest.
Acknowledgments
The authors are grateful to Profs. R. Kahat, I. Vásquez-Rowe, Drs. U. Cardenas, and S. Gárcia-Torres for their support and useful discussion.
Footnote
1. ^Sol is the currency used in Peru ever since December 15th 2015. Prior to this date, the currency was named Nuevo Sol.
References
Böhringer, C., and Jochem, P. E. P. (2007). Measuring the immeasurable—a survey of sustainability indices. Ecol. Econ. 63, 1–8. doi: 10.1016/j.ecolecon.2007.03.008
Cullen, J. M. (2017). Circular economy: theoretical benchmark or perpetual motion machine? J. Ind. Ecol. 21, 483–486. doi: 10.1111/jiec.12599
Decker, H., Elliott, S., Smith, F. A., Blake, D. R., and Sherwood Rowland, F. (2000). Energy and material flow through the urban ecosystem. Ann. Rev. Energy Environm. 25, 685–740. doi: 10.1146/annurev.energy.25.1.685
Facchini, A., Kennedy, C., Steward, I. D., and Mele, R. (2017). The energy metabolism of megacities. Appl. Energy 186, 86–95. doi: 10.1016/j.apenergy.2016.09.025
Filchakova, N., Robinson, D., and Scartezzini, J. L. (2012). Quo vadis thermodynamics and the city: a critical review of applications of thermodynamic methods to urban systems,” in Ecodynamics, the Prigogine legacy, ed C. A. Brebbia (Wessex Institute of Technology, WIT Press). doi: 10.2495/978-1-84564-654-7/20
Greening, L. A., Greene, D. L., and Difiglio, C. (2000). Energy efficiency and consumption - the rebound effect - a survey. Energy Policy. 28, 389–401. doi: 10.1016/S0301-4215(00)00021-5
Hertwich, E. G. (2005). Consumption and the rebound effect: an industrial ecology perspective. J. Ind. Ecol. 9, 85–98. doi: 10.1162/1088198054084635
Hodson, M., Marvin, S., Robinson, B., and Swilling, M. (2012). Reshaping urban infrastructure. J. Ind. Ecol. 16, 789–800. doi: 10.1111/j.1530-9290.2012.00559.x
Kennedy, C. (2014). Developing a multi-layered indicator set for urban metabolism studies in megacities. Ecol. Indic. 47, 7–15. doi: 10.1016/j.ecolind.2014.07.039
Kennedy, C., Cuddihy, J., and Engel-Yan, J. (2007). The changing metabolism of cities. J. Ind. Ecol. 11, 43–59. doi: 10.1162/jie.2007.1107
Kennedy, C., and Hoornweg, D. (2012). Mainstreaming urban metabolism. J. Ind. Ecol. 16, 780–782. doi: 10.1111/j.1530-9290.2012.00548.x
Kennedy, C., Pincetl, S., and Bunje, P. (2011). The study of urban metabolism and its applications to urban planning and design. Environ. Polluti. 159, 1965–1973. doi: 10.1016/j.envpol.2010.10.022
Kennedy, C. A., Stewart, I., Facchini, A., Cersosimo, I., Mele, R., Chen, B., et al. (2015). Energy and material flows of megacities. Proc. Natl. Acad. Sci. U.S.A. 112, 5985–5990. doi: 10.1073/pnas.1504315112
Liddle, B., and Lung, S. (2014). Might electricity consumption cause urbanization instead? Evidence from heterogeneous panel long-run causality tests. Glob. Environ. Change 24, 42–51. doi: 10.1016/j.gloenvcha.2013.11.013
Maranghi, S., Parisi, M. L., Facchini, A., Rubino, A., Kordas, O., and Basosi, R. (2020). Integrating urban metabolism and life cycle assessment to analyse urban sustainability. Ecol. Indic. 112:106074. doi: 10.1016/j.ecolind.2020.106074
Newman, P. W. G. (1999). Sustainability and cities: extending the metabolism model. Landsc. Urban Plan. 44, 219–226. doi: 10.1016/S0169-2046(99)00009-2
OSINERGMIN (2015). Plan Quinquenal de Inversiones 2014-2018, Available online at: https://www.google.it/url?sa=t&rct=j&q=&esrc=s&source=web&cd=1&cad=rja&uact=8&ved=0ahUKEwjanIWGrqHVAhXGvxQKHWO_CoIQFggnMAA&url=http%3A%2F%2Fwww2.osinerg.gob.pe%2FResoluciones%2Fpdf%2F2014%2FInforme-No.0131-2014-GART.pdf&usg=AFQjCNEsEoAmvc5sb3W7X0Kpy0KpdAi6EQ (accessed Augest 11, 2020).
Pincetl, S., Bunje, P., and Holmes, T. (2012). An expanded urban metabolism method: toward a systems approach for assessing urban energy processes and causes. Landsc. Urban Plan. 107, 193–202. doi: 10.1016/j.landurbplan.2012.06.006
Shao, S., Guo, L., Yu, M., Yang, L., and Guan, D. (2019). Does the rebound effect matter in energy import-dependent mega-cities? Evidence from Shanghai (China). Appl. Energy 24, 212–228. doi: 10.1016/j.apenergy.2019.03.007
Stewart, I. D., Kennedy, C. A., Facchini, A., and Mele, R. (2018). The electric city as a solution to sustainable urban development. J. Urb. Technol. 25, 3–20. doi: 10.1080/10630732.2017.1386940
Keywords: urban metabolism, megacities, climate policy, energy efficiency, energy policy
Citation: Facchini A, Mele R and Caldarelli G (2021) The Urban Metabolism of Lima: Perspectives and Policy Indications for GHG Emission Reductions. Front. Sustain. Cities 2:40. doi: 10.3389/frsc.2020.00040
Received: 31 October 2019; Accepted: 29 June 2020;
Published: 25 February 2021.
Edited by:
Sergio Ulgiati, University of Naples Parthenope, ItalyReviewed by:
Theodore Endreny, SUNY College of Environmental Science and Forestry, United StatesSimone Bastianoni, University of Siena, Italy
Copyright © 2021 Facchini, Mele and Caldarelli. This is an open-access article distributed under the terms of the Creative Commons Attribution License (CC BY). The use, distribution or reproduction in other forums is permitted, provided the original author(s) and the copyright owner(s) are credited and that the original publication in this journal is cited, in accordance with accepted academic practice. No use, distribution or reproduction is permitted which does not comply with these terms.
*Correspondence: Angelo Facchini, 4.facchini@gmail.com