 Soohyun Yang
 Enrico Bertuzzo
 Dietrich Borchardt
 P. Suresh C. Rao
- 1Department of Aquatic Ecosystem Analysis and Management, Helmholtz Centre for Environmental Research-UFZ, Magdeburg, Germany
- 2Dipartimento di Scienze Ambientali, Informatica e Statistica, Università Ca' Foscari Venezia, Venice, Italy
- 3Lyles School of Civil Engineering, Purdue University, West Lafayette, IN, United States
- 4Agronomy Department, Purdue University, West Lafayette, IN, United States
Structural and functional attributes across fractal river networks have been characterized by well-established and consistent hierarchical, Hortonian scaling patterns. In most of the global river basins, spatial patterns of human settlements also conform to similar hierarchical scaling. However, emergent spatial hierarchical patterns and scaling of heterogeneous anthropogenic nutrient loads over a river basin are less known. As a case study, we examined here a large intensely managed river basin in Germany (Weser River; 46K km2; 8M population). Archived data for point-/diffuse-sources of total Phosphorus (Ptot) input loads were combined with numerical and analytical model simulations of coupled hydrological and biogeochemical processes for in-stream Ptot removal at the network scale. We find that Ptot input loads scale exponentially over stream-orders, with the larger scaling constant for point-source loads from urban agglomerations compared to those for diffuse-source contributions from agricultural and forested areas. These differences in scaling patterns result from hierarchical self-organization of human settlements, and the associated clustering of large-scale, altered land-cover. Fraction of Ptot loads removed through in-stream biogeochemical processes also manifests Hortonian scaling, consistent with predictions of an analytical model. Our analyses show that while smaller streams are more efficient in Ptot removal, in larger streams the magnitude of Ptot loads removed is higher. These trends are consistent with inverse scaling of nutrient removal rate constant with mean discharge, and downstream clustering of larger cumulative input loads. Analyses of six nested sub-basins within the Weser River Basin also reveal similar scaling patterns. Our findings are useful for projecting likely water-quality spatial patterns in similar river basins in Germany, and Central Europe. Extensions and generalizations require further examination of diverse basins with archetype spatial heterogeneities in anthropogenic pressures and hydroclimatic settings.
Introduction
Rivers are dendritic and directed drainage networks, where flows from all upstream contributing areas converge to the river basin outlet. Rivers draining heterogeneous landscapes exhibit universal fractal topography of self-organized, bifurcating networks (Rodríguez-Iturbe and Rinaldo, 2001; Paik and Kumar, 2008). Self-similar structures of river networks have been characterized mainly using two approaches. One is a consistent hierarchical scaling over Horton-Strahler stream-orders (Horton, 1945; Strahler, 1957). The hierarchical (Hortonian) scaling is embedded in the mean values of geomorphological or topologic metrics in drainage networks (Schumm, 1956; Peckham, 1995; Yang and Paik, 2017). The other is a power-law scaling between two geomorphological or geometric attributes in river basins or between one variable and its exceedance probability (Hack, 1957; Rodríguez-Iturbe et al., 1992; Dodds and Rothman, 2000).
Hortonian scaling relationships have been extensively found for diverse descriptors in complex river basin systems, by taking the advantages of simple but systematic and quantitative framework of stream-ordering. The discovery of the Hortonian scaling laws for hydrologic and channel hydraulic geometry variables in river networks allowed to model flow dynamics in streams of which practical datasets were not available (Mantilla et al., 2006; Gupta and Mesa, 2014; Gupta et al., 2015). In addition, spatial patterns of human-related attributes embedded in river basins were characterized through ordering scheme across diverse scales. Fang et al. (2018) presented preferential downward clustering pattern for self-organized human settlements in ~70% large global river basins. Miyamoto et al. (2011) examined scaling of distinct human-managed land use over 109 large river basins in Japan. Yang et al. (2019a) analyzed archived data for urban settlements and the associated wastewater treatment plants (WWTPs) to examine spatial scaling in three large river basins in Germany. Such findings of self-organized, scale-invariant patterns in human-related activities imply that the associated scaling signatures in spatial patterns are likely to occur for nutrient loads generated from urban agglomerations as well as less populated areas (e.g., agricultural and semi-natural/forested areas).
Nonetheless, modeling biogeochemical dynamics coupled with functional indicators of hydrological conditions (e.g., discharge and stage) in river network pathways, to date, relies on the key assumption that nutrient inputs are spatially homogeneous or unstructured, i.e., loads per unit-area are spatially invariant (e.g., Bertuzzo et al., 2017; Helton et al., 2018). Our primary focus here is to investigate in heterogeneous drainage basins: (1) how the linkages between hydrological and biogeochemical filtering of input anthropogenic nutrient loadings contribute to scaling of corresponding response variables; and (2) if scaling patterns at the entire basin-scale are also evident at sub-basin scales. Given the observed stream-order scaling of hydrological conditions and urban settlements, we hypothesized that anthropogenic nutrient loads, as well as outcomes of biogeochemical processes would also scale across stream-order hierarchies. For the coupled processes, we hypothesized that non-linear biogeochemical buffering would dampen the Hortonian scaling patterns. To test these hypotheses, we simulated in-stream nutrient removal, using broadly-applied structural and functional scaling features over an entire river network, for total phosphorus (Ptot) which is the nutrient of our interest here. We explicitly included the effect of spatially structured point-source nutrient loads from WWTPs, and diffuse-source nutrient loads from distinct land covers. The largest national river basin in Germany (Weser River Basin, ~46K km2; 8M population) served as the case study of a human-dominated river basin, with available archived data needed for model simulations of outcomes of the coupled hydrological and biogeochemical processes.
Methods and Materials
Study Area: Weser River
General Information
The Weser River Basin, the largest national river basin, is enclosed entirely within Germany (~46K km2, ~10% of total area). The basin is located in the humid-temperate climatic zone, with mean precipitation of ~780 mm/yr (600~1,100 mm/yr) in excess of mean evapotranspiration of ~505 mm/yr (400~600 mm/yr), yielding a mean aridity index of ~0.9 (IWRM-net, 2010; Hirt et al., 2012; Zink et al., 2017). According to the long-term (70 years : 1950–2019) daily monitoring records at the Intchede gauging station (BfG, 2019), located at the most downstream without tidal effect, annual mean volumetric discharge (Q), specific river discharge (q), and the coefficient of variation (CV) for both Q and q were: 317 m3/s, 265 mm/yr, and 0.73, respectively. Assuming spatially homogeneous hydroclimatic forcing, steady-state mean river discharge is estimated as the product between the given q and drainage area for each river streams and summed over the entire river network. Transient river flow conditions are outside of the scope of this paper. The nutrient uptake velocity (vf) for Ptot was estimated as 0.17 m/day at the whole basin-scale (Yang et al., 2019b).
The Weser River Basin was delineated using 100 m x 100 m grid DEMs (Zink et al., 2017) with a source area of 10 km2 to form channels. The extracted river network consists of ~1,700 stream segments with a total length of ~12,000 km (here, a segment means a channel portion between two successive confluences). The mainstem (~700-km) stretches from a small tributary in south-eastern part to the basin outlet with the final 7th order Horton-Strahler stream (Figure 1A) (Horton, 1945; Strahler, 1957). Structure of the network manifests fractal geometry as commonly found for diverse rivers in the world (Yang et al., 2019a).
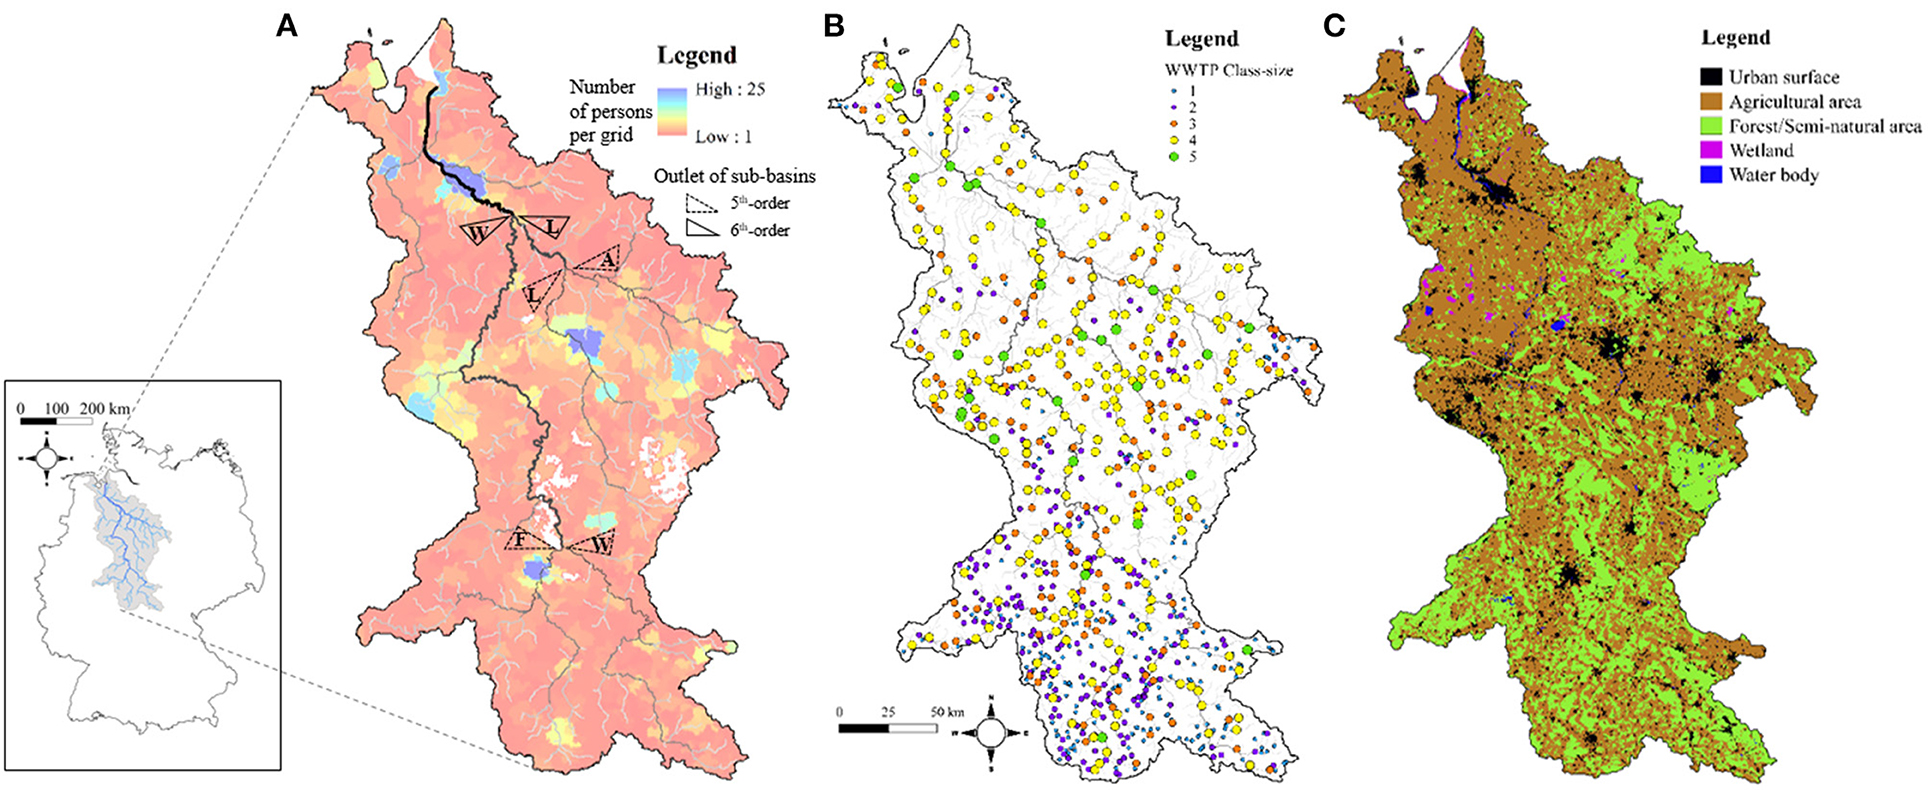
Figure 1. Maps of human-related attributes distributed over the Weser River Basin of which location within Germany is shown in the most left figure. (A) Distribution of ~8.4 million people as the number of persons per grid with a range from 1 to 25. River network with the final 7th order is overlaid with black lines of which thickness and brightness are proportional to stream-orders. Dashed and solid triangles indicate the outlets of four sub-basins with 5th-order (F, W, L, and A for Fulda, Werra, Leine, and Aller) and two sub-basins with 6th-order (W and L for Weser and Leine), respectively. (B) Distribution of ~845 WWTPs categorized as five class-sizes of which color-codes are given in the legend. (C) Distribution of five types of land-cover of which areas are visualized with different colors [(B,C) were adapted from Yang et al. Copyright (2021), with permission from Elsevier].
Anthropogenic Nutrient Loads
About 8.4 million people (~10.2% of Germany's population) reside in the Weser River Basin (Figure 1A), with different sizes of urban agglomerations, with ~97% connection to WWTPs (EEA, 2017). Out of total ~8,900 WWTPs in Germany (Büttner, 2020), ~845 WWTPs are located in the Weser River Basin (Figure 1B). Five class-sizes k are assigned to WWTPs based on the population equivalent (PE) served (https://www.gesetze-iminternet.de/abwv/anhang_1.html) (EEC, 1991). Smaller WWTPs (k ≤ 3) are clustered toward upstream locations serving small communities, while larger WWTPs (k ≥ 4) are located downstream serving larger cities clustered near the river basin outlet (Yang et al., 2019a). Tertiary treatment technology is mandatory in the two largest class-sizes (k ≥ 4) to meet stringent environmental regulations for nutrient loads discharged to the river network, while a suite of primary and secondary treatment is deployed at the smaller WWTPs (k ≤ 3). Sum of Ptot loads discharged from ~845 WWTPs to the Weser River is ~957 tons P/yr loads (for the period 2012–2016). Around 71% of the Ptot loads from point-sources (~680 tons P/yr) are generated by ~260 large WWTPs (k ≥ 4), representing about a third of the total WWTPs located in the Weser River Basin.
Ptot loads from diffuse-sources to river streams are categorized based on distinct land-covers delineated from the CORINE Land Cover (CLC) 100-m grid data for the year 2012 (https://land.copernicus.eu/pan-european/corine-land-cover). Five main classes in the Level 1 of the CLC data are used to characterize different land-covers. In the Weser River Basin (Figure 1C), agricultural areas account for the largest area (CLC-class-2, ~59%), followed by forested/semi-natural areas (CLC-class-3, ~31%), and urban surface areas (CLC-class-1, ~9%). These three CLC-classes covering ~99% of total area were considered in estimating total Ptot loads from diffuse-sources to streams. Respective total Ptot input loads contributions from CLC-classes for the year 2010 were calculated as: 419 tons P/yr for CLC-class-1, 1,576 tons P/yr for CLC-class-2, and 485 tons P/yr for CLC-class-3 (UBA, 2010, 2017). In turn, Ptot input loads per unit-area Ψ [kg P/yr/km2] are given as ΨUB = 101, ΨAG = 58, and ΨFO = 34 for CLC-class-1 to 3, respectively. The estimated total Ptot loads from all diffuse-sources is 2,481 tons P/yr, which is 2.6 times larger than those provided by point-sources WWTPs. Table 1 summarizes information on anthropogenic Ptot input loads for the entire Weser River Basin, and for two 6th-order sub-basins and four 5th-order sub-basins along with corresponding drainage areas and basin shape factors.
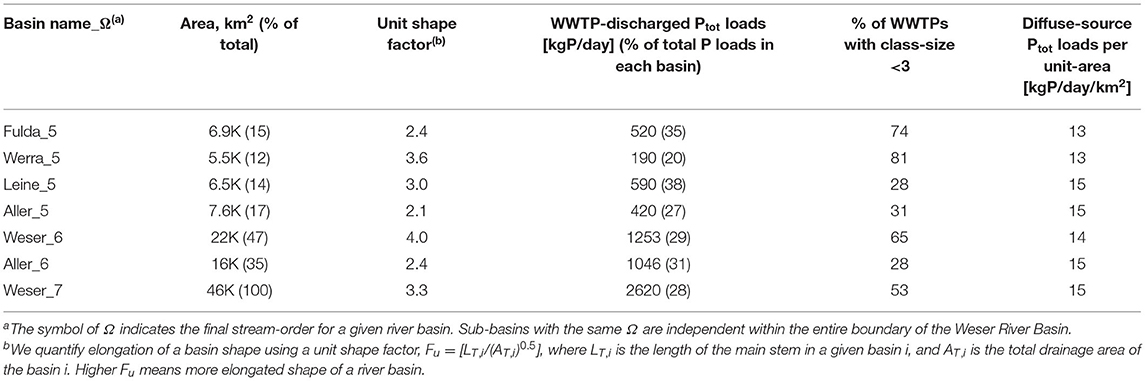
Table 1. Information for the Weser River Basin and six sub-basins.
Modeling Elemental Removal at the Network Scale
Models for element removal at the scale of a whole river network have gained attraction in the recent literature (Basu et al., 2011; Wollheim et al., 2015; Bertuzzo et al., 2017). In particular, Bertuzzo et al. (2017) investigated scaling patterns in the dynamics of terrestrial dissolved organic carbon removal assuming a first-order losses in each stream segment. The generic model framework considers spatially invariant nutrient loads (mass/area) from only diffuse-sources to river reaches. Here, we additionally included spatially heterogeneous point- and diffuse-source nutrient loads, and implemented the model for the Weser River Basin, by relying on available datasets for parameter estimation. With the relevant modification of the original model, core governing equations and their underlying processes are described below.
For a given reach i in a river network, incoming Ptot loads, Lin,i, to the receiving reach are a summation of three parts: (1) point-source Ptot loads, LPS,i, discharged from WWTPs; (2) diffuse-source Ptot loads, LDS,i, delivered by directly drained areas of different land-covers; and (3) Ptot loads transported from direct upstream reaches j, Lout,j (i.e., Lout,j = 0 for headwaters):
We assume temporally constant Ptot loads from both point- and diffuse-sources to receiving river reaches, to be compatible with available dataset for mean annual loads. We acknowledge that intra-annual variabilities of nutrient loads are neglected in such an analysis.
Outflowing Ptot loads at the most downstream point of each reach i Lout,i is estimated as the residual Ptot loads after in-stream natural attenuation, described as a first-order decay processes during residence time τi:
The net uptake rate scales inversely with the water depth di as vf,i/di, where vf,i is the uptake velocity for nutrient loss in the hyporheic and benthic zone (Wollheim et al., 2006; Botter et al., 2010; Basu et al., 2011; Yang et al., 2019b). The reach-scale residence time τi is straightforwardly estimated through the geomorphological and hydrological conditions at the reach i :
where wi and li indicate the width and length of the reach, respectively. Here, spatially homogeneous vf,i is assumed over the entire river network; compared to order of magnitude changes in discharge across stream-orders, biogeochemical and bathymetry variations exert minor influence (e.g., Basu et al., 2011).
The fraction of Ptot loads removed in each reach fR,i represents the nutrient removal efficiency, as:
where the Ptot loads removed in each reach, Lr,i, is equivalent to (Lin,i – Lout,i).
For spatially homogeneous hydroclimatic conditions over the entire river network, represented by mean precipitation and evapotranspiration, the steady-state river discharge, Qi, at a reach is proportional to the contributing drainage area Ai:
where q is the specific river discharge [L/T] indicating net precipitation.
Based on well-known scaling relationships of channel geometry (Leopold and Maddock, 1953), we calculate the width wi and water depth di for each reach as a power-law scaling of Qi for the same frequency of occurrence, as:
where the power-law exponents αw = 0.5 and αd = 0.4 are suitable representatives across many rivers and so are the coefficients and Kd = 0.25 [ sαd] (Leopold and Maddock, 1953; Knighton, 1998). Anthropogenic alterations to channels and flow diversions are neglected in this analysis (see later discussion in section Limitations and Extensions).
Scaling Analyses
Hortonian scaling was used to identify spatial patterns for several coupled processes and responses across hydrological, biogeochemical, and anthropogenic domains over a river basin. Specific attributes examined in this study are: (1) Diffuse-sources Ptot loads from three land-cover types to rivers, i.e., urban surface areas [LUR(P)], agricultural areas [LAG(P)], and forested/semi-natural areas [LFO(P)]; (2) Summed Ptot loads from both point- and diffuse-sources [LTotal(P)]; and (3) Fraction and magnitude of Ptot loads removed (fR and Lr, respectively) through in-stream biogeochemical processes.
The Hortonian scaling in river networks represents the scale-invariance in spatial hierarchy of averaged attributes over stream-orders (Horton, 1945; Strahler, 1957). For a given attribute Z, the Hortonian scaling is demonstrated when its mean <Z> varies exponentially over stream-order ω with an exponent h:
where h > 0 indicates a scale-free increase over ω, such as for drainage area (Schumm, 1956) and human settlements (Fang et al., 2018; Yang et al., 2019a), while h < 0 denotes a scale-invariant decrease over ω, as for the number of streams (Horton, 1945). The consistent rate of change for <Z> over increasing ω is quantified as a Hortonian scaling ratio (HSR) for the attribute Z, RZ > 0, as:
Stream-Order Model
Given the Hortonian scaling in each source of Ptot loads, we adopted the stream-order model of Miyamoto et al. (2011) to estimate the HSR for total Ptot input loads as a multiplicative function:
where Σδx = 1 (x = PS, UR, AG, and FO). Each power-law exponent δ represents the relative contribution to the Hortonian scaling of total Ptot input loads from a specific source. That is, δx > 0 indicates clustering toward downstream, while δx < 0 suggests upstream clustering.
Results
Hortonian Scaling for Anthropogenic Ptot Loads
Total of Ptot loads, from both point- and diffuse-sources in the Weser River Basin, followed structural hierarchical scaling over stream-orders ω, with RL_TOT = 2 (R2 > 0.9, p < 0.05) (Figure 2A). Ptot loads from each of point- and diffuse-sources also scaled with ω, but each with distinct rate of change (Figures 2B–E). The largest HSR value was for point-source (RL_PS = 2.6; R2 > 0.9, p < 0.05) followed by diffuse-sources from urban surface areas (RL_UR = 1.9; R2 > 0.9, p < 0.05), agricultural areas (RL_AG = 1.6; R2 ≈ 0.7, p < 0.05), and forested/semi-natural areas (RL_FO = 1.4; R2 ≈ 0.2, p < 0.2). The decreasing trend for HSRs from more human-dense to less habitable areas was consistent in six sub-basins embedded in the Weser River Basin (Table 2). The values of HSR for a given source of Ptot loads were within a narrow range among independent sub-basins. For example, four 5th-order sub-basins had RL_PS = 3.1 ± 0.7, RL_UR = 2.4 ± 0.3, RL_AG = 1.9 ± 0.2, and RL_FO = 1.7 ± 0.3 (mean ± std.; where std. denotes the standard deviation), highlighting consistency in the scaling patterns despite geographical and environmental differences among the sub-basins.
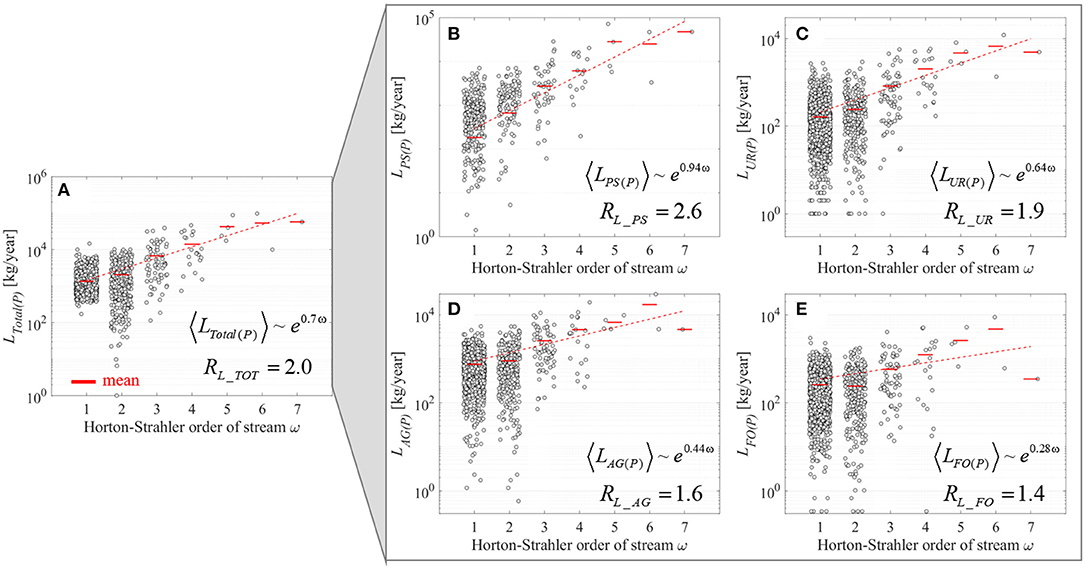
Figure 2. Stream-order based distributions of Ptot loads for the Weser River Basin. (A) Total Ptot loads from both point- and diffuse-sources LTotal(P). (B) Reported Ptot loads discharged from WWTPs LPS(P). (C–E) Estimated Ptot loads delivered from urban surfaces LUR(P), agricultural areas LAG(P), and forested/semi-natural areas LFO(P), respectively. For a given stream-order ω, each gray dot indicates the estimated Ptot loads from directly draining areas into a stream of the ω-th order. Mean of gray dots within the same ω are depicted as red bars, and their linear trends over ω are fitted on the semi-log plot. Hortonian scaling equations with exponent h, and the resultant Hortonian scaling ratios are embedded in each plot.
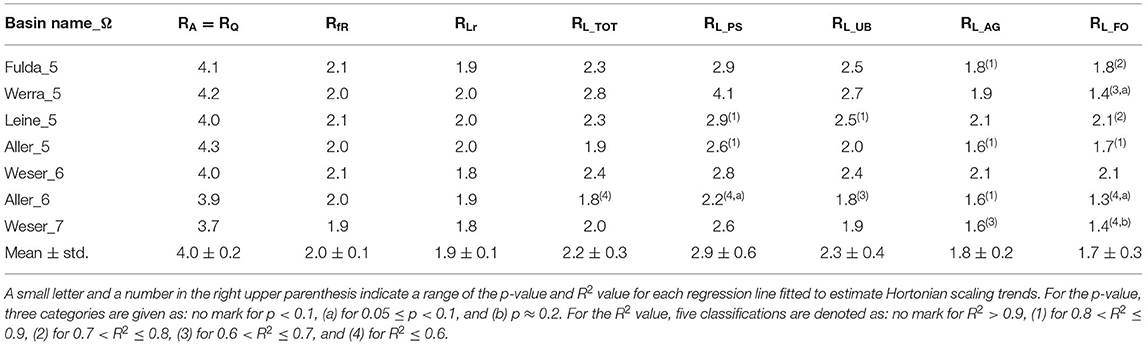
Table 2. Hortonian scaling ratios for the Weser River Basin and six sub-basins.
Employing the stream-order model, unknown values for four δx were estimated based on the empirical data for Ptot input loads over six sub-basins and the Weser River Basin (Table 2). The resultant δx set was given as [δPS, δUR, δAG, δFO] = [0.24, 0.60, 0.27, −0.20], which yielded accurate predictions of RL_TOT compared to empirically derived RL_TOT (difference < 3%) (Figure 3). The estimated values of δx were aligned with the distinct patterns in the spatial clustering of different land covers over the river basin. The value of δx < 0 for the Ptot loads from forested/semi-natural areas reflected their upstream clustering patterns, whereas that of δx > 0 for urban and agricultural Ptot loads mirrored their downstream-skewed distributions (see Figure 1C).
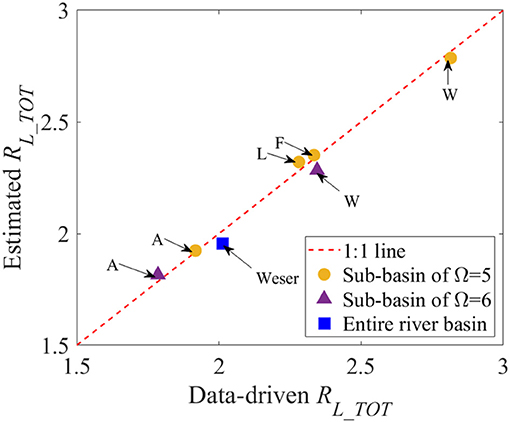
Figure 3. Comparison of the Hortonian scaling ratio for total Ptot loads input from point- and diffuse-sources, RL_TOT. Data-driven RL_TOT on the x-axis was originated from the data analyses, as presented in Figure 2A. Estimated RL_TOT on the y-axis was the result of the multiplicative model for RL_TOT as a power function of four Hortonian scaling ratios for Ptot input loads from individual point- and diffuse-sources. In addition to the Weser River Basin (blue square), its six sub-basins with its corresponding final stream-order Ω = 5 or 6 (orange circle; purple triangle, respectively) are marked with the acronym of each name, as shown in Figure 1A.
Hortonian Scaling of Biogeochemical Processes
Fraction of Ptot Loads Removed
The fraction of removed Ptot loads (fR) within a reach, compared to incoming loads, reflected the inverse relation of the in-stream nutrient uptake rate and river discharge (Figure 4A). Across the river basin, fR ranged over two orders of magnitude, representing ~56% in-stream loss of total Ptot input loads over the entire river network under the annual mean river discharge condition. Spatial distribution of fR was structured by stream-orders (Figure 4B), decreasing with higher ω, with RfR = 1.9 (R2 > 0.9, p < 0.05).
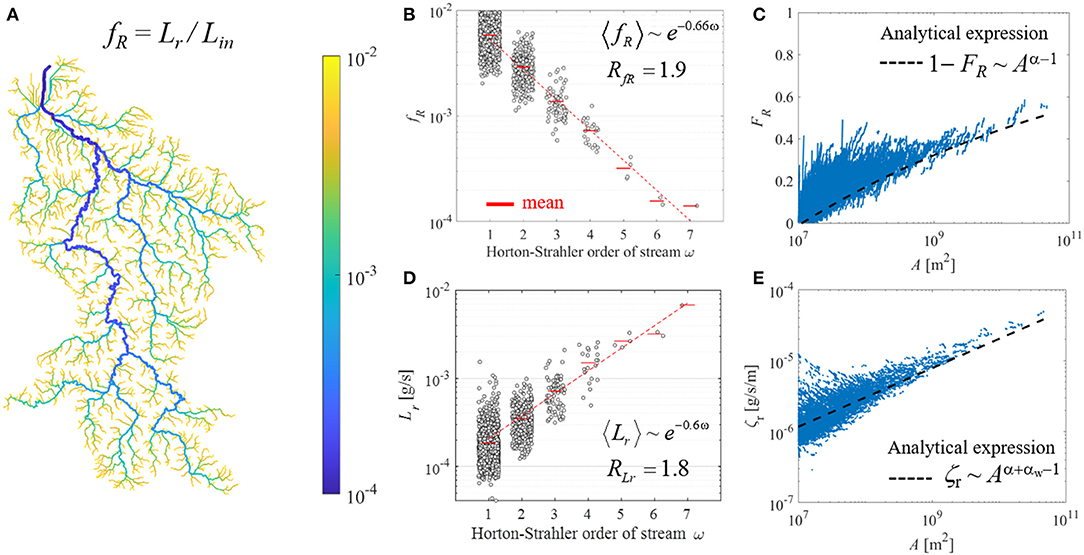
Figure 4. Distributions of the removed Ptot loads along the Weser River network under the mean river discharge. (A) Entire basin-scale distribution for the fraction fR of Ptot loads removed in each reach (Lr) to input mass flux to the same reach (Lin). (B) Stream-order ω based distribution for fR. (C) Distribution of the fraction of total Ptot loads removed by upstream catchment FR at a given drainage area A. (D) The ω-based distribution for Lr. (E) Distribution of removed Ptot loads per unit length in each reach, ζr, over A. For visual efficiency, values of gray dots in (B,D) were extracted from the most downstream point of each stream for a given ω. Hortonian scaling equation and the corresponding scaling ratio are in (B,D). Blue dots in (C,E) indicated the model results for each stream reach of the Weser River network. Dashed black line in (C) and (E) was plotted by following the analytical scaling of Equations (12) and (10) derived in Bertuzzo et al. (2017), respectively. Following the original framework, the exponent α = 0.91 was fitted from scaling of input mass flux only from diffuse-sources over drainage areas. The other exponent αw = 0.5 came from the hydraulic geometry scaling between width and river discharge.
We also analytically examined the Hortonian scaling of fR, since the term of fR is expressed indeed as a power function of Q for suitably short reach-unit (see Appendix A). The analytical expression in Equation (A5) presents that Hortonian scaling of fR can be estimated with the exponent of hfR = (αw – 1)hQ, if hierarchical scaling of Q, hQ, and hydraulic geometry scaling of stream width, αw, are given for a river basin of interest. We expect RfR values to range between 1.1 and 4.2, estimated using extensively-found literature values for hQ= 1.1 ~ 1.8 (Schumm, 1956; Rodríguez-Iturbe and Rinaldo, 2001) and αw = 0.2 ~ 0.9 (Klein, 1981; Knighton, 1998). Analytically derived RfR ~1.9 for the entire river basin was almost identical with statistically estimated RfR based on simulation results (difference = 0.8%). For the six sub-basins, there were no discrepancies between the RfR results from analytical and statistical approaches (difference < 5%). The RfR values were within its feasible range based on the literature. Compared to the Hortonian scaling for hydrologic condition RQ, the values of RfR declined incrementally for the entire basin and its sub-basins (Table 2).
In addition to the reach-scale analysis, the fraction of Ptot loads removal estimated at the entire river network revealed a scaling pattern over the Weser River Basin. The fraction of total Ptot loads removed in streams (FR) with the drainage areas smaller than a threshold of interest A increased non-linearly with increasing A, reaching ~56% removal at the basin outlet with maximum A (Figure 4C). The general pattern of FR over A from our simulation results agreed well with the analytical equation derived by Bertuzzo et al. (2017) (i.e., , where α is a scaling exponent of the power-law relation between nutrient input loads and contributing area for each reach, and AT is a source area to define channel initiation). Note that, by following the original framework, we estimated the values of the scaling exponent α from only diffuse-sources Ptot loads, resulting in α = 0.91. Underestimation from using the original analytical equation was attributed to not-including point-sources Ptot loads.
Magnitude of Ptot Loads Removed
The removed Ptot loads in each reach (Lr) increased over stream-orders (ω) (Figure 4D). The distribution of Lr for the entire river basin was hierarchically structured on average, resulting RLr = 1.8 (R2 > 0.9, p < 0.05). The Hortonian scaling of Lr was also found for the six sub-basins with a narrow range of 1.9 ± 0.1 (mean ± std.; Table 2). The increasing trend of Lr over ω in the Weser River Basin reflected the spatial distribution of Ptot input loads from both point- and diffuse-sources, and their downstream aggregation with converging flows. Hence, despite a much less efficient removal of Ptot loads (i.e., lower fR) in larger streams, the greater magnitude of Ptot input loads yielded the positive relation between Lr and ω.
Length-normalized Lr, i.e., the removed Ptot loads per unit length ζR, was lower in smaller drainage areas A and increased for larger A (Figure 4E). The overall trend of our model simulation was aligned with the analytical expression derived by Bertuzzo et al. (2017) (i.e., , where KY is the nutrient input loads per unit area, and each of Kw and αw are the coefficient and exponent in the power-law function of the hydraulic geometry for river width). As presented in Figure 4C, the analytical scaling here also showed underestimation for the simulated results, which is consistent with the original model assumption that neglected point-sources. Nevertheless, for the first time our study corroborated that the analytical scaling derived from model simulations reproduces the scaling of nutrient load removal in a large river basin characterized by strong spatial heterogeneity.
Discussion
Hydrological and Biogeochemical Filtering
Our model framework can be described using the concept of filtering for hydrological and biogeochemical processes. Hydrological responses observed in river networks can be interpreted as the outcomes of sequential functioning of drainage area acting as a “filter” of external forcing (Gall et al., 2013; Kim et al., 2016; Kumar et al., 2020). Following the underlying mass balance principle, hydroclimatic forcing (precipitation, PR) filtered by evapotranspiration (ET) losses generates mean river discharge (Q) through linear filtering of contributing drainage area (A), resulting Q = A(PR-ET). If both PR and ET are assumed spatially homogeneous over a river basin, as assumed in this study, Q linearly varies with A which is known to scale exponentially with stream-orders, i.e., Hortonian scaling (Schumm, 1956). Hence, spatial heterogeneity of Q is dependent only on heterogeneity of A across stream orders in the river basin. Furthermore, well-known scaling relations of mean Q with water depth, width, and flow velocity along downstream channels indicate the hierarchical patterns in spatial heterogeneity of the hydraulic geometry variables (Leopold and Maddock, 1953; Paik and Kumar, 2004; Gupta and Mesa, 2014).
Biogeochemical responses in river networks can also be interpreted using the “filter” concept just discussed for hydrological responses. The filters might be either natural or engineered attenuation processes, or often both (Jawitz et al., 2020). Nutrient loads applied to the landscape are buffered by crop/tree uptake, and further attenuated by biogeochemical filtering in the vadose and saturated zones, before entering the stream networks as diffuse-sources (Mockler et al., 2017; Liu et al., 2018). Similarly, nutrient loads from urban agglomerations are aggregated and treated at the WWTPs and discharged to river networks as point-sources (Aissa-Grouz et al., 2018; Yang et al., 2019a). Note that the multiple steps of filtering from original sources, such as landscape surface or households, to receiving streams can be flexibly implemented in a simulation model depending on data availability of nutrient loads input and temporal scale of interests for a given study. For example, our model did not need to consider transport pathways of nutrient loads from original sources to streams because of reliable estimated data on nutrient loads directly reaching streams (see section Anthropogenic Nutrient Loads). Once nutrient loads arrive in rivers and are transported along channel flow paths, they are removed through in-stream processing represented as a first-order nutrient uptake process, which scales inversely with stream water depth, which in turn scales with Q (Wollheim et al., 2006; Botter et al., 2010; Basu et al., 2011). Theoretical analysis of Bertuzzo et al. (2017) presents that, at the scale of an entire river network, the cumulative in-stream losses of dissolved organic carbon through the nonlinear in-stream filtering scale with contributing area, A (note: Q scales with A). This suggests that our model framework for phosphorus can be directly extended to nitrogen and carbon attenuation, assuming the first-order rate processes for in-stream removal (Wollheim et al., 2015; Bertuzzo et al., 2017; Helton et al., 2018).
Indeed, our finding of consistent RfR < RQ in the Weser Basin represents that additional non-linear filtering by biogeochemical (in-stream nutrient loss) processes at the scale of river network dampens the variation based on the “mean” values for a given attribute across stream-orders. Our analytical derivation for RfR demonstrates that the damping effect from the coupling complex dynamics is indicated as the multiplication of (αw – 1) in the Hortonian scaling exponent of fR. Given the universal features for the Hortonian scaling of Q and the hydraulic geometry relations, the analytical estimation for RfR should be applicable to other river basins, which needs to be examined in future research. A more detailed discussion on RfR is reported below (section Scaling of Input Loads and In-stream Removal).
Scaling of Input Loads and In-stream Removal
Our analyses show that the mean values of nutrient Ptot input loads exhibit consistent Hortonian scaling, with larger scaling constant for point-source loads delivered from WWTPs, relative to that for diffuse-sources contribution from agricultural and forested/semi-natural areas (RL_PS ~ 2.6 vs. RL_AG ~ 1.6; RL_FO ~ 1.4). This trend is also noted in the six sub-basins: two 6th-order and four 5th-order, of the Weser River. The clustered spatial patterns result from self-organized hierarchy of human settlements and the associated different sizes of WWTPs, and human-altered land-covers. These results are consistent with more downstream clustered spatial organization of larger class-sizes of WWTPs which discharge Ptot loads from larger urban aggregations of populations (Yang et al., 2019a,b). These urban settlements account only for <10% of the basin area, and are embedded largely within agricultural areas (~59%), while the forested/semi-natural areas (~31%) are clustered upstream.
Our findings indicate how scalings of these Ptot input loads are filtered by coupled hydrological (river discharge) conditions and biogeochemical (in-stream nutrient loss) processes along converging flows in the river network. We identify that the fraction of Ptot loads removed (fR = 1 – Lout/Lin) scales inversely with stream-orders, with a scaling constant of ~0.66, reflecting the inverse relationship of removal rate constant and stream discharge (or stage). We also demonstrate close agreement between empirical and analytical estimation of the Hortonian scaling for fR (RfR). However, the magnitude of Ptot loads removed (LR) increases over stream-orders with a scaling exponent of ~0.6, mirroring the trend of greater Ptot input loads toward downstream over the Weser River Basin.
Our analyses show that while smaller streams (ω ≤ 3) are more efficient in nutrient removal, larger total Ptot loads are removed in the reaches of higher-order streams (ω ≥ 5). Our numerical simulation results show that scaling patterns over drainage area for the cumulative fraction of Ptot loads removed (FR) and the Ptot loads removed per unit stream length (ζr) are well-approximated by the analytical expressions, originally derived by Bertuzzo et al. (2017), for spatially homogeneous, diffuse-source loads proportional only to contribution areas. Thus, the analytical expressions for RfR and ζr are useful for estimating the hierarchical gradient in the fraction of in-stream nutrient removed and the magnitude of in-stream nutrient losses, respectively, without exact simulation of biogeochemical processes for other catchments.
While the Hortonian scaling based on mean values is indeed interesting, we also recognize an important signature for greater variability manifested in lower-order streams draining highly diverse and small sub-catchments. The low-order streams with small contributing areas are biogeochemically most-reactive and are also critically important for preserving aquatic ecological diversity (Wohl, 2017; Richardson, 2019). Hence, they require greater attention in catchment monitoring and management efforts (Biggs et al., 2017; Jensen et al., 2019). With converging flows within the dendritic drainage network, hydrological and biogeochemical attributes in larger streams represent flow-weighted spatial averaging, thereby contributing to decreased variability. A future study on the variability trends is expected to provide constructive insights on how to synthetically interpret the Hortonian scaling and its corresponding variabilities over the entire river networks.
Comparison to Monitored P Concentration
We examined the scaling of modeled Ptot and monitored soluble reactive phosphorus concentrations (Supplementary Figures 1, 2). Although the median values of the modeled and monitored concentrations were different in smaller streams (ω ≤ 3) [at the 1% significance level (Kruskal- Wallis test)], both datasets exhibited weak scaling over ω as supported by larger streams (ω ≥ 4) without significant differences in their distributions. The weak scaling patterns reflect an increased filtering (i.e., signal dampening) from the combined influence of local and cumulative hydrological processes (e.g., dilution and flow aggregation) and in-stream biogeochemical attenuation resulting the residual nutrient loads in a given reach (Supplementary Data).
Limitations and Extensions
Our analyses here are based on mean-annual discharge, and constant mean-annual input Ptot loads from diverse sources for one study river basin; as such, they are most useful for long-term projections. We acknowledge that inter- and intra-annual dynamics in discharge (and stage) and Ptot loads will need to be considered to examine how temporal variability modifies the scaling patterns of mean values we presented herein. Probability density function of Q and its statistical moments (e.g., mean, median, mode, variance, etc.) are useful for characterizing stochastic temporal variabilities in Q. Botter et al. (2013) suggested that hydrological regimes of rivers can be divided into two broad groups: persistent, with low variability in discharge (CVQ < 1), and erratic, with high variability (CVQ > 1). Doyle (2005) proposed the use of a “functionally equivalent” river discharge (Qfed) for reproducing the effect of in-stream nutrient removal over the full spectrum of temporal variability in Q. His analysis showed that Qfed was equivalent to Qmode for low variability in Q (i.e., persistent hydrological regimes), while their similarity became weaker as the Q-variability increased. Other fixed values of constant Q are also useful for bracketing likely range in hydrological conditions. For example, the 10th and 90th percentile Q can represent, respectively, the low-flow conditions during droughts, and high-flow conditions during floods (Rice and Westerhoff, 2017; Thober et al., 2018). We note that the scaling constant for the fraction Ptot loads removed (fR) will be identical for any temporally constant Q at the same frequency of occurrence; only the intercept will increase (decrease) with decreasing (increasing) mean values of Q over stream-orders. This topic on temporal variabilities in Q and Ptot loads over a wide range of climate and land cover characters should be addressed in a future study.
We used the fixed values for the coefficients and exponents of power-law scaling in the hydraulic geometry relations (αw and αd in Equations 6, 7) based on global-scale findings from established literature. Our model framework neglected possibly modified hydrological flow regimes due to anthropogenic alterations to the river network, to focus on our primary aim at identifying the hierarchical scaling characters in biogeochemical responses over heterogeneous landscapes. We do acknowledge that hydraulic structures, such as dams and their operations, do alter river flow regimes (e.g., Williams and Wolman, 1984; Ferrazzi and Botter, 2019). In addition, over the long term, channel modifications also change hydraulic geometry variables (e.g., Shin and Julien, 2010; Ran et al., 2012) over a wide range depending on a river and its floodplain (e.g., Knighton, 1998). In the Weser River Basin, primarily flood-control dams are located at higher altitudes in upstream locations (Speckhann et al., 2021), and their effect is indeed captured in the mean discharge we used on the basis of measured discharge at the basin outlet (Supplementary Data; Supplementary Figure 1). Site specific studies in river basins with significant alterations of river flow regimes and modifications of channels should be conducted in the future, to better understand how the Hortonian scaling patterns found here would be different for the human-altered hydrological and geomorphological attributes.
Despite the limitations mentioned above, our findings can be used to predict water-quality impairments in two other large basins in Germany (Rhine and Elbe), which have similar spatial patterns and scaling features (Yang et al., 2019a). Extensions to other basins would require characterizing the spatial patterns of urban agglomerations with high connectivity to WWTPs, and changes of land-cover and land-use. Spatial patterns for nutrient loads from point-sources WWTPs reflect aggregated wastewater from households served by each WWTP, and centralized treatment which reduces significant nutrient loads before discharging them to streams, in order to comply with environmental regulations. Thus, spatial patterns of urban agglomerations, connectivity to centralized WWTPs, variations in treatment technologies adopted, and enforcement of regulations also influence the scaling patterns of point-sources loads in other river basins. Compared to German basins with multiple small/medium size cities, river basins with mega-cities near the outlet may be characterized by a larger Hortonian scaling exponent. In such basins, agricultural or forested landscapes, and diffuse-sources nutrient loads, might inversely mirror human settlement areas, thus exhibiting weaker scaling than suggested by our analyses here. Extending our analyses to explore scaling patterns in diverse managed river basins, however, remains a future challenge for developing a generalized understanding of the scaling for nutrient input loads and biogeochemical responses in large river networks across wider climate and hydrological regimes.
Conclusions
The Hortonian scaling is a classical signature representing the consistent hierarchical distribution of natural or anthropogenic attributes over a whole river network. In this study, we examined whether the Hortonian scaling is embedded in the spatially heterogeneous distribution of human-induced nutrient loads (total phosphorus, Ptot) reaching streams, and the biogeochemical processes and responses coupled with hydrological conditions. Our analyses on the Weser River and its six sub-catchments exhibited the existence of the Hortonian scaling patterns in the Ptot input loads to receiving streams, and further their distinctions by source-types and land covers. This suggests additional evidences for self-organized distributions of human settlements and the relevant managed landscapes, as previous studies demonstrate. To investigate hierarchical structures in biogeochemical processes and responses over the river network, we used the model framework for element nutrient removal at the scale of an entire river network which consisted of well-established scaling features in hydrological responses, hydraulic geometry variables, and in-stream nutrient attenuation processes. Both the fraction and magnitude of Ptot loads removed in each reach showed the Hortonian scaling features, but with opposite changing trends. As stream-order increased, the former decreased while the latter increased, under a given steady-state river discharge. This demonstrated higher efficiency of in-stream nutrient uptake in smaller streams, and greater nutrient input loads toward downstream induced by land cover patterns and aggregation through river flows. The results from the numerical model simulations were in agreement with analytical expressions presented in the current and previous studies. We acknowledge that the typical values of parameters in the hydraulic geometry functions should be carefully evaluated for other study areas, especially where river flow regimes and the associated channel geometry were significantly altered by human-built hydraulic structures. Nonetheless, the scientific significance analytically and numerically found from the large river basin warrants further investigation for generalization of the presented Hortonian scaling features in coupled hydrological and biogeochemical processes over spatially heterogeneous landscapes.
Data Availability Statement
Publicly available datasets were analyzed in this study. This data can be found at: The German WWTPs data for 2,000 PE were obtained from a public source provided by European Environment Agency (https://www.eea.europa.eu/data-and-maps/data/waterbase-uwwtdurban-waste-water-treatment-directive-5#tab-european-data). The population data was from the Gridded Population of the World, version 4 Adjusted Population Count.
Author Contributions
SY and PSCR conceived the study and led the manuscript writing process. SY and EB developed the model and performed the analyses. All authors contributed to discussing the results, identifying the scope of investigations, revising the manuscript, and finalizing the submitted version.
Funding
This study was funded by Helmholtz Centre for Environmental Research-UFZ, and by Purdue University through the Lee A. Rieth Endowment in Lyles School of Civil Engineering and the NSF-RIPS project: Resilience simulation for water, power and road networks (Award no. 1441188).
Conflict of Interest
The authors declare that the research was conducted in the absence of any commercial or financial relationships that could be construed as a potential conflict of interest.
Publisher's Note
All claims expressed in this article are solely those of the authors and do not necessarily represent those of their affiliated organizations, or those of the publisher, the editors and the reviewers. Any product that may be evaluated in this article, or claim that may be made by its manufacturer, is not guaranteed or endorsed by the publisher.
Acknowledgments
SY and DB acknowledge the support of the Helmholtz Climate Initiative Project funded by the Helmholtz Association. PSCR acknowledges the financial support of the Lee A. Rieth Endowment in Lyles School of Civil Engineering at Purdue University. EB acknowledges the support of the Ca' Foscari University of Venice, Italy. We would also like to thank the reviewers for their constructive comments and suggestions.
Supplementary Material
The Supplementary Material for this article can be found online at: https://www.frontiersin.org/articles/10.3389/frwa.2021.693056/full#supplementary-material
References
Aissa-Grouz, N., Garnier, J., and Billen, G. (2018). Long trend reduction of phosphorus wastewater loading in the Seine: determination of phosphorus speciation and sorption for modeling algal growth. Environ. Sci. Pollut. R. 25, 23515–23528. doi: 10.1007/s11356-016-7555-7
Basu, N. B., Rao, P. S. C., Thompson, S. E., Loukinova, N. V., Donner, S. D., Ye, S., et al. (2011). Spatiotemporal averaging of in-stream solute removal dynamics. Water Resour. Res. 47:W00J06. doi: 10.1029/2010WR010196
Bertuzzo, E., Helton, A. M., Hall, R. O., and Battin, T. J. (2017). Scaling of dissolved organic carbon removal in river networks. Adv. Water Resour. 110, 136–146. doi: 10.1016/j.advwatres.2017.10.009
BfG (2019). Water Levels–Data From Selected Gauging statIons on German Federal Waterways and Shipping Administration (WSV). Koblenz: German Federal Institute of Hydrology (Bundesanstalt für Gewässerkunde). Available online at: https://www.bafg.de/EN/06_Info_Service/01_WaterLevels/waterlevels.html (accessed December 2020).
Biggs, J., von Fumetti, S., and Kelly-Quinn, M. (2017). The importance of small waterbodies for biodiversity and ecosystem services: implications for policy makers. Hydrobiologia 793, 3–39. doi: 10.1007/s10750-016-3007-0
Botter, G., Basso, S., Rodriguez-Iturbe, I., and Rinaldo, A. (2013). Resilience of river flow regimes. Proc. Natl. Acad. Sci. U.S.A. 110, 12925–12930. doi: 10.1073/pnas.1311920110
Botter, G., Basu, N. B., Zanardo, S., Rao, P. S. C., and Rinaldo, A. (2010). Stochastic modeling of nutrient losses in streams: interactions of climatic, hydrologic, and biogeochemical controls. Water Resour. Res. 46:WR008758. doi: 10.1029/2009WR008758
Büttner, O. (2020). DE-WWTP-Data Collection of Wastewater Treatment Plants of Germany (Status 2015, Metadata). HydroShare.
Dodds, P. S., and Rothman, D. H. (2000). Geometry of river networks. I. Scaling, fluctuations, and deviations. Phys. Rev. E 63:016115. doi: 10.1103/PhysRevE.63.016115
Doyle, M. W. (2005). Incorporating hydrologic variability into nutrient spiraling. J. Geophys. Res. Biogeosci. 110:G01003. doi: 10.1029/2005JG000015
EEA (2017). Urban wast water treatment. Copenhagen: European Environment Agency. Available online at: https://www.eea.europa.eu/data-and-maps/indicators/urban-waste-water-treatment/urban-waste-water-treatment-assessment-4 (accessed December 2020).
EEC (1991). Council Directive of 21 May 1991 Concerning Urban Waste Water Treatment (91/271/EEC). Official Journal of the European Communities. Available online at: http://ec.europa.eu/environment/water/water-urbanwaste/index_en.html (accessed December 2020).
Ensign, S. H., and Doyle, M. W. (2005). In-channel transient storage and associated nutrient retention: evidence from experimental manipulations. Limnol. Oceanogr. 50, 1740–1751. doi: 10.4319/lo.2005.50.6.1740
Fang, Y., Ceola, S., Paik, K., McGrath, G. S., Rao, P. S. C., Montanari, A., et al. (2018). Globally universal fractal pattern of human settlements in river networks. Earth's Future 6, 1134–1145. doi: 10.1029/2017EF000746
Ferrazzi, M., and Botter, G. (2019). Contrasting signatures of distinct human water uses in regulated flow regimes. Environ. Res. Commun. 1:071003. doi: 10.1088/2515-7620/ab3324
Gall, H. E., Park, J., Harman, C. J., Jawitz, J. W., and Rao, P. S. C. (2013). Landscape filtering of hydrologic and biogeochemical responses in managed catchments. Landsc. Ecol. 28, 651–664. doi: 10.1007/s10980-012-9829-x
Gupta, V. K., Ayalew, T. B., Mantilla, R., and Krajewski, W. F. (2015). Classical and generalized Horton laws for peak flows in rainfall-runoff events. Chaos Interdiscip. J. Nonlinear Sci. 25:075408. doi: 10.1063/1.4922177
Gupta, V. K., and Mesa, O. J. (2014). Horton laws for hydraulic–geometric variables and their scaling exponents in self-similar Tokunaga river networks. Nonlinear Process. Geophys. 21, 1007–1025. doi: 10.5194/npg-21-1007-2014
Hack, J. T. (1957). Studies of longitudinal stream profiles in Virginia and Maryland. United States Geol. Surv. Prof. Pap. 294-B, 45–97. doi: 10.3133/pp294B
Helton, A. M., Hall Jr, R. O., and Bertuzzo, E. (2018). How network structure can affect nitrogen removal by streams. Freshw. Biol., 63, 128–140. doi: 10.1111/fwb.12990
Hirt, U., Kreins, P., Kuhn, U., Mahnkopf, J., Venohr, M., and Wendland, F. (2012). Management options to reduce future nitrogen emissions into rivers: a case study of the Weser river basin, Germany. Agric. Water Manag. 115, 118–131. doi: 10.1016/j.agwat.2012.08.005
Horton, R. E. (1945). Erosional development of streams and their drainage basins; hydrophysical approach to quantitative morphology. Geol. Soc. Am. Bull. 56, 275–370. doi: 10.1130/0016-7606(1945)56[275:EDOSAT]2.0.CO;2
IWRM-net (2010). Innovative Instruments and Institutions in Implementing the Water Framework Directive: The German Case Study. Research Report of Integrated Water Resource Management (IWRM), No. 2.2. IWRM.
Jawitz, J. W., Desormeaux, A. M., Annable, M. D., Borchardt, D., and Dobberfuhl, D. (2020). Disaggregating landscape-scale nitrogen attenuation along hydrological flow paths. J. Geophys. Res. Biogeosci. 125:e2019JG005229. doi: 10.1029/2019JG005229
Jensen, C. K., McGuire, K. J., McLaughlin, D. L., and Scott, D. T. (2019). Quantifying spatiotemporal variation in headwater stream length using flow intermittency sensors. Environ. Monit. Assess. 191:226. doi: 10.1007/s10661-019-7373-8
Kim, D. H., Rao, P. S. C., Kim, D., and Park, J. (2016). 1/f noise analyses of urbanization effects on streamflow characteristics. Hydrol. Process. 30, 1651–1664. doi: 10.1002/hyp.10727
Klein, M. (1981). Drainage area and the variation of channel geometry downstream. Earth Surf. Process. Landf. 6, 589–593. doi: 10.1002/esp.3290060608
Kumar, R., Heße, F., Rao, P. S. C., Musolff, A., Jawitz, J. W., Sarrazin, F., et al. (2020). Strong hydroclimatic controls on vulnerability to subsurface nitrate contamination across Europe. Nat. Commun. 11:6302. doi: 10.1038/s41467-020-19955-8
Leopold, L. B., and Maddock, T. J. (1953). The Hydraulic Geometry of Stream Channels and Some Physiographic Implications. United States Geological Survey Professional Paper 252. Washington, DC: U.S. Government Printing Office.
Liu, X., Beusen, A. H. W., Van Beek, L. P. H., Mogollón, J. M., Ran, X., and Bouwman, A. F. (2018). Exploring spatiotemporal changes of the Yangtze River (Changjiang) nitrogen and phosphorus sources, retention and export to the East China Sea and Yellow Sea. Water Res. 142, 246–255. doi: 10.1016/j.watres.2018.06.006
Mantilla, R., Gupta, V. K., and Mesa, O. J. (2006). Role of coupled flow dynamics and real network structures on Hortonian scaling of peak flows. J. Hydrol. 322, 155–167. doi: 10.1016/j.jhydrol.2005.03.022
Miyamoto, H., Hashimoto, T., and Michioku, K. (2011). Basin-wide distribution of land use and human population: stream order modeling and river basin classification in Japan. Environ. Manage. 47, 885–898. doi: 10.1007/s00267-011-9653-0
Mockler, E. M., Deakin, J., Archbold, M., Gill, L., Daly, D., and Bruen, M. (2017). Sources of nitrogen and phosphorus emissions to Irish rivers and coastal waters: estimates from a nutrient load apportionment framework. Sci. Total Environ. 601–602, 326–339. doi: 10.1016/j.scitotenv.2017.05.186
Paik, K., and Kumar, P. (2004). Hydraulic geometry and the nonlinearity of the network instantaneous response. Water Resour. Res. 40:WR002821. doi: 10.1029/2003WR002821
Paik, K., and Kumar, P. (2008). Emergence of self-similar tree network organization. Complexity 13, 30–37. doi: 10.1002/cplx.20214
Peckham, S. D. (1995). New results for self-similar trees with applications to river networks. Water Resour. Res. 31, 1023–1029. doi: 10.1029/94WR03155
Ran, L., Wang, S., and Lu, X. X. (2012). Hydraulic geometry change of a large river: a case study of the upper Yellow River. Environ. Earth Sci. 66, 1247–1257. doi: 10.1007/s12665-011-1336-x
Rice, J., and Westerhoff, P. (2017). High levels of endocrine pollutants in US streams during low flow due to insufficient wastewater dilution. Nat. Geosci. 10:587. doi: 10.1038/ngeo2984
Richardson, J. S. (2019). Biological diversity in headwater streams. Water 11:366. doi: 10.3390/w11020366
Rodríguez-Iturbe, I., Ijjász-Vásquez, E. J., Bras, R. L., and Tarboton, D. G. (1992). Power law distributions of discharge mass and energy in river basins. Water Resour. Res. 28, 1089–1093. doi: 10.1029/91WR03033
Rodríguez-Iturbe, I., and Rinaldo, A. (2001). Fractal River Basins: Chance and Self-Organization. Cambridge: Cambridge University Press.
Schumm, S. A. (1956). Evolution of drainage systems and slopes in badlands at Perth Amboy, New Jersey. Geol. Soc. Am. Bull. 67, 597–646 doi: 10.1130/0016-7606(1956)67[597:EODSAS]2.0.CO;2
Shin, Y. H., and Julien, P. Y. (2010). Changes in hydraulic geometry of the Hwang River below the Hapcheon Re-regulation Dam, South Korea. Int. J. River Basin Manag. 8, 139–150. doi: 10.1080/15715121003651252
Speckhann, G. A., Kreibich, H., and Merz, B. (2021). Inventory of dams in Germany. Earth Syst. Sci. Data 13, 731–740. doi: 10.5194/essd-13-731-2021
Strahler, A. N. (1957). Quantitative analysis of watershed geomorphology. EOS Trans. AGU 38, 913–920. doi: 10.1029/TR038i006p00913
Thober, S., Kumar, R., Wanders, N., Marx, A., Pan, M., Rakovec, O., et al. (2018). Multi-model ensemble projections of European river floods and high flows at 1.5, 2, and 3 degrees global warming. Environ. Res. Lett. 13:014003. doi: 10.1088/1748-9326/aa9e35
UBA (2010). Calculation of Emissions into Rivers in Germany Using the MONERIS Model-Nutrients, Heavy Metals, and Polycyclic Aromatic Hydrocarbons. The German Federal Environmental Agency (UBA). Available online at: https://www.umweltbundesamt.de/en/publikationen/calculation-of-emissions-into-rivers-in-germany (accessed December 2020).
UBA (2017). Waters in Germany: Status and Assessment. The German Federal Environmental Agency (UBA). Available online at: https://www.umweltbundesamt.de/en/publikationen/waters-in-germany (accessed December 2020).
Williams, G. P., and Wolman, M. G. (1984). Downstream Effects of Dams on Alluvial Rivers. Geological Survey Professional Paper. Washington, DC: U.S. Government Printing Office.
Wohl, E. (2017). The significance of small streams. Front. Earth Sci. 11, 447–456. doi: 10.1007/s11707-017-0647-y
Wollheim, W. M., Stewart, R. J., Aiken, G. R., Butler, K. D., Morse, N. B., and Salisbury, J. (2015). Removal of terrestrial DOC in aquatic ecosystems of a temperate river network. Geophys. Res. Lett. 42, 6671–6679. doi: 10.1002/2015GL064647
Wollheim, W. M., Vörösmarty, C. J., Peterson, B. J., Seitzinger, S. P., and Hopkinson, C. S. (2006). Relationship between river size and nutrient removal. Geophys. Res. Lett. 33:L06410. doi: 10.1029/2006GL025845
Yang, S., Büttner, O., Jawitz, W. J., Kumar, R., Rao, P. S. C., and Borchardt, D. (2019a). Spatial organization of human population and wastewater treatment plants in urbanized river basins. Water Resour. Res. 55, 6138–6152. doi: 10.1029/2018WR024614
Yang, S., Büttner, O., Kumar, R., Jäger, C. G., Jawitz, J. W., Rao, P. S. C., et al. (2019b). Spatial patterns of water quality impairments from point source nutrient loads in Germany's largest national River Basin (Weser River). Sci. Total Environ. 697:134145. doi: 10.1016/j.scitotenv.2019.134145
Yang, S., and Paik, K. (2017). New findings on river network organization: law of eigenarea and relationships among hortonian scaling ratios. Fractals 25:1750029. doi: 10.1142/S0218348X17500293
Zink, M., Kumar, R., Cuntz, M., and Samaniego, L. (2017). A high-resolution dataset of water fluxes and states for Germany accounting for parametric uncertainty. Hydrol. Earth Syst. Sci. 21, 1769–1790. doi: 10.5194/hess-21-1769-2017
Appendix A
Analytical Derivation for the Hortonian Scaling in the Fraction of Ptot Loads Removed in Each Stream Reach (fR)
In this appendix, we show an analytical derivation of the Hortonian scaling in fR,.
Substituting Equation (2) into Equation (3) yields :
where the approximation originates from the Taylor series of the exponential function up to the first-order term (Ensign and Doyle, 2005). The notations of reach i in fR and Q are omitted for the generalized function of g(Q) with the constant M = –vf lKW, by assuming the difference in l from diagonal or orthogonal flow direction is negligible. The power-law exponent of (αw – 1) ranges between-1 and 0. Given the well-known Hortonian scaling for the mean value of Q, <Q>, with its scaling exponent hQ, that is:
we can express the mean of fR, <g(Q)>, as the Taylor series of the g(Q) by taking until the first term at a real constant μ:
When μ = <Q>, <g(Q)> scales with <Q> as:
Substituting Equation (A2) into Equation (A4) yields an exponential scaling of <fR> over ω as:
Therefore, the analytical expression in Equation (A5) presents that Hortonian scaling of fR can be estimated with the exponent of hfR = (αw – 1)hQ., if hierarchical scaling of Q and hydraulic geometry attributes for stream width are given.
Keywords: hierarchical scaling, river networks, phosphorus loadings, in-stream nutrient uptake, spatial heterogeneity
Citation: Yang S, Bertuzzo E, Borchardt D and Rao PSC (2021) Hortonian Scaling of Coupled Hydrological and Biogeochemical Responses Across an Intensively Managed River Basin. Front. Water 3:693056. doi: 10.3389/frwa.2021.693056
Received: 09 April 2021; Accepted: 23 July 2021;
Published: 18 August 2021.
Edited by:
Anna Lupon, Center for Advanced Studies of Blanes, Spanish National Research Council (CSIC), SpainReviewed by:
Asghar Azizian, Imam Khomeini International University, IranNitin Singh, University of Waterloo, Canada
Frederick Cheng, University of Waterloo, Canada, in collaboration with reviewer NS
Copyright © 2021 Yang, Bertuzzo, Borchardt and Rao. This is an open-access article distributed under the terms of the Creative Commons Attribution License (CC BY). The use, distribution or reproduction in other forums is permitted, provided the original author(s) and the copyright owner(s) are credited and that the original publication in this journal is cited, in accordance with accepted academic practice. No use, distribution or reproduction is permitted which does not comply with these terms.
*Correspondence: Soohyun Yang, soohyun.yang@ufz.de