1. Introduction
Global energy consumption is mainly based on non-renewable resources and the increasing energy demand has pushed research on more sustainable and renewable resources [
1]. Photovoltaic solar cells are unanimously considered to be very promising for clean energy production, but production costs, material availability, and toxicity sometimes hinder their deployment. An alternative to conventional cells for their much lower environmental impact and production costs are Dye Sensitized Solar Cells (DSSCs), introduced to the world in 1991 by Grätzel and O’Regan [
2]. Unlike silicon solar cells, DSSCs charge generation and transport does not happen in a single material, but is split in different layers: a counter-electrode, an electrolyte solution, a sensitizing dye, a nanostructured semiconductor, generally titanium dioxide, and finally, a conductive glass.
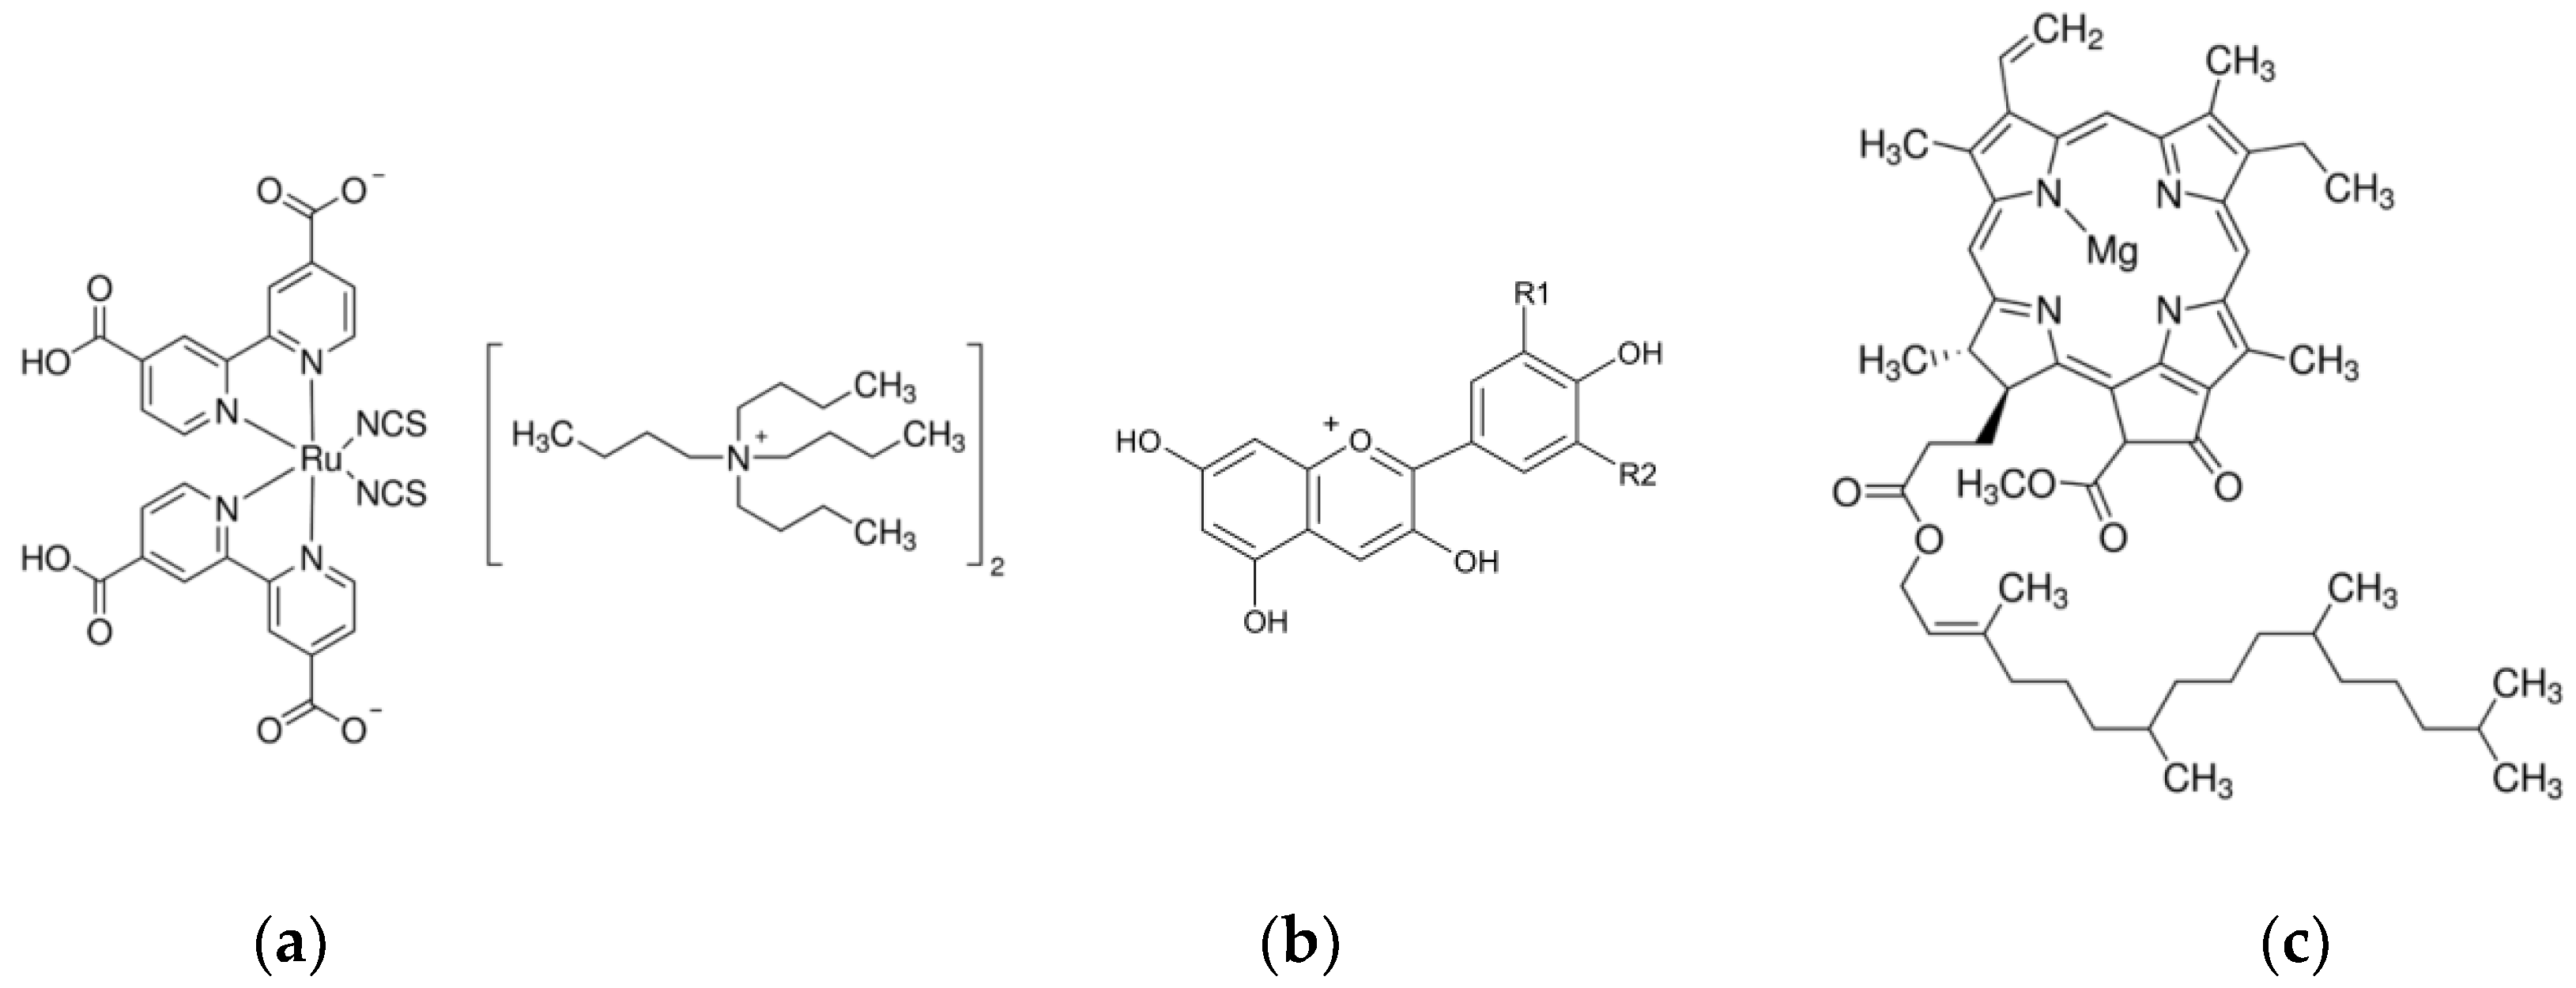
One of the most important cells’ elements is the dye that is adsorbed on titanium dioxide layer, playing a fundamental role in DSSCs because it is involved in the harvesting and conversion of solar energy to electrical energy. Organometallic dyes, which are based on ruthenium (
Figure 1a) and osmium polypyridyl complexes, have been widely employed as efficient sensitizers [
3,
4], since they can absorb light in the visible range, have intense charge-transfer and highly efficient metal-ligand charge transfer. Unfortunately, this kind of metal coordination compounds is usually obtained with multistep reactions and expensive chromatographic purification procedures [
1]. The use of organic dyes is an alternative to transition metals, leading to a significant reduction of manufacturing costs of the final device [
5,
6,
7]. Many organic dyes are available in nature and they can be used as such. In fact, plants are full of natural pigments that determine their colour, covering the entire solar spectrum from red to purple and that can be employed in DSSCs. Therefore, natural dye molecules can be used like a sensitizer for their low cost, good light absorbance, easily preparation process, and eco-friendly behaviour, as they are completely biodegradable. One of the most important groups of naturally occurring pigments are anthocyanins, which are responsible for red, blue, and purple colours in different plant tissues, like fruits, flower, leaves, and bulbs [
8]. These polyphenolic molecules are available in various fruits, such as berries, grapes, pomegranates, raspberries, and many other [
9], and, during the impregnation process, can bind the semiconductor titania nanoparticles with their hydroxyl functional group, to obtain an electronic coupling that allows for an efficient electron transfer reaction.
Anthocyanins [
10,
11] and other several natural dyes, such as tannins [
12], carotenoids [
13,
14], flavonoids [
5,
15], and chlorophylls [
16,
17] (
Figure 1b,c), can be easily extracted from vegetables or fruits and used to build DSSCs [
1,
5] that are characterized by typical efficiency included between 0 and 2%. This difference is depending, among other things, on the starting material that provides different efficiency, such as 0.64% for eggplants, 0.90% for Radicchio, 1.07% for blackberries, and 0.78% for Red Sicilian orange [
9]. Nevertheless, an ethical question arises, since food has to be used and destroyed to obtain dyes from fruits and vegetables. Therefore, developing such a technology on a large scale could be considered incorrect from an ethical point of view and, at the end, also economically disadvantageous. It is necessary to recover and exploit the concept of circular economy, which considers the whole product’s life-cycle, from its production to the creation of markets for waste-derived raw materials.
Waste-to-energy is a broad term that encompasses various waste treatment processes generating energy (e.g. in the form of electricity, heat, or produce a waste-derived fuel), each of which has different environmental impacts and circular economy potential.
The innovative idea behind this applied research work, developed in collaboration with a venetian winery, consists of recovering and valorizing the waste of winemaking process, principally lees after fermentation and clarification processes, for the realization of DSSC solar cells.
Winemaking is one of the most important activities of agri-food industries all over the world, with an approximate worldwide production of 250 million hectoliters (OIV, 2017). This kind of activity produces 2–6% lees on the total volume of wine produced [
18,
19], therefore it generates a large quantity of waste that must be properly disposed, with considerable costs for wineries.
Wine lees can be defined as ‘the residue formed at the bottom of recipients containing wine, after fermentation, during storage or after authorized treatments, as well as the residue obtained following filtration or centrifugation’, according to literature and EEC regulation No. 337/79 [
20].
Therefore, at the end of the winemaking and clarification wine process, the so-called lees are the precipitate composed of many organic materials like yeast, bacteria, tartaric acid salts and vegetable residues. Furthermore, lees also contain a large amount of bentonite, a natural phyllosilicate clay that is used by wineries to reduce protein instability and precipitate suspended solids responsible for wine turbidity [
21]. Usually winemaking lees are re-used for the recovery of tartaric acid [
22], but, in recent years, studies showed that the concentration of anthocyanins in these lees are 10 times higher than grape skins [
23], and this has increased the interest in these lees. Bentonite slightly bleaches white and red wines absorbing molecules responsible of wines color, such as anthocyanins, tannins, catechins, and polyphenols, which, if properly extracted, can be valorized and used as dyes in DSSCs.
The current work aims to study a method to recover the main waste product of a winery, extracting the organic dyes contained in the lees, reintroducing them into the production cycle, and transforming them into a resource to produce renewable and sustainable electricity from organic photovoltaic solar cells.
To the best of our knowledge, the use of winemaking lees extracts is being reported for the first time as sensitizers for TiO2 based dye-sensitized solar cells (DSSCs).
2. Materials and Methods
2.1. Synthesis of Nanostructured Semiconductor
Titanium dioxide powder was synthetized via sol-gel and hydrothermal route, starting from analytical grade reagent without further purifications, following a synthesis that was proposed in the literature [
24]. After the synthesis, powder was thermally treated at 400 °C or 600 °C under air flow for one hour (ramp rate 2 °C/min) and named TiO
2_400 and TiO
2_600, respectively.
2.2. Preparation of Electrodes
Conductive fluorine-doped tin oxide (FTO) glasses, with 7 Ω/sq of surface resistivity, were used as electrodes. The cleaned working electrode was coated with a blocking layer, a thin compact layer that is necessary to reduce the leakage currents and enhance the performance of the device, deposited by spray pyrolysis technique, using an alcoholic solution of titanium diisopropoxide bis(acetylacetonate) on a heated substrate at 400 °C, in order to evaporate the solvent and obtain a compact layer of titanium dioxide. The electrodes coated with TiO2 blocking layer were heated in air from room temperature (RT) to 500 °C to sinter this compact layer.
The Dyenamo
® screen printer with polyester mesh was used to print on FTO glass a 10 µm thickness [
25] active layer of titania semiconductor with an area of 9 × 9 mm
2. The required viscous titanium dioxide paste was prepared by grinding titanium dioxide powder and then dispersing it with a terpenic dispersing agent and ethyl cellulose in an excess of ethanol (which was evaporated through rotavapor), as described in literature [
26].
After the deposition of a porous TiO
2 layer and its sintering at 450 °C for 20 min [
24], the plate was immersed in the natural dye solution in a dark container overnight to complete the sensitizer uptake. After soaking the film in this solution, dye molecules were left to be adsorbed on the surface of the titania. A counter-electrode was prepared depositing on FTO platinum by thermal decomposition [
27]. An alcoholic solution 1 mM of H
2PtCl
6 in 2-propanol was sprayed on a cleaned conductive transparent glass that was heated at 250 °C through spray pyrolysis technique that was finally treated at 450 °C for 30 min [
24] to obtain metal platinum clusters.
2.3. Extraction of Dyes from Winemaking Lees
Winemaking lees were collected in the first period of the year 2019 from a venetian winery that was situated in the Prosecco DOCG region (Conegliano, Italy). Lees derive from winemaking process of both red and white wines. Several tests were carried out both at RT (room temperature) and with a Soxhlet extraction technique, using different solvent, concentrations, times, and solvent-to-solid ratio. A suitable amount of lees was firstly centrifuged to simulate the process used by the winery to extract residual wine from winemaking lees. Subsequently, the solid waste was recovered and a certain amount (w/w) of solvent (methanol, ethanol, water, and mixtures of them), acidified with 1% v/v with concentrated HCl (37%), was added to maintain pH < 2. The extraction process was monitored by evaluating the maximum of absorbance variation (λ = 525 nm) with an UV-Vis spectrophotometer. The dye solution was stored in the dark at 5 °C after extraction process, and then used for the following impregnation process and analyses.
2.4. Dye Sensitized Solar Cell Prototypes Assembling
Dye-titania electrode and counter-electrode were assembled into a sandwich-type cell and then sealed with a gasket that was made by a hot-melt ionomeric resin made by Surlyn®. Some drops of an iodine-based electrolyte (EL-HPE Sigma Aldrich) solution were introduced into the cell via vacuum backfill through a small circular hole previously done on the counter electrode before the cleaning process. The cell was put in a vacuum chamber and, then, when atmospheric pressure was restored, the electrolyte was pushed inside the internal free space by pressure variation. This method allows for the electrolyte to completely fill the internal space existing between counterelectrode and photoanode, made by 25 µm polymeric Surlyn® gasket. After this, the dye sensitized solar cells prototype was tested for photocurrent measurements.
2.5. Characterization Techniques
Nitrogen physisorption at −196 °C with an ASAP 2010 Micrometrics sorptometer characterized the textural properties of titanium dioxide. The samples (about 0.1 g) were treated first at 130 °C for 12 h at 0.67 Pa and then at RT for 2 h at 1 × 10⁻⁴ Pa. The well-known BET equation was applied and the specific pore volume (Vs) was calculated at P/P0 = 0.98 to determine the specific surface areas. The pore size distribution was calculated according to the BJH method.
X-Ray Diffraction (XRD) was used to determine the crystalline phases of titania, by using a Philips X’Pert system (Bragg–Brentano parafocusing geometry) with a nickel-filtered Cu Kα
1 radiation at 0.154 nm. The samples (disc shaped pressed powders) were analyzed before and after calcination. The anatase and rutile crystallite average size was determined on XRD peak broadening by the Scherrer equation (line width of the anatase (101) reflection at 2θ = 25.3° and rutile (110) reflection at 2θ = 27.4°):
where
is the crystallite size,
the shape factor,
is the X-ray wavelength for Cu Kα
1 radiation,
is the line broadening at FWHM, and
is the Bragg’s angle.
To obtain the anatase/rutile weight fraction, the following equation [
28] was used:
where
IA and
IR are the peak intensities of the (101) and (110) reflections for anatase and rutile, respectively.
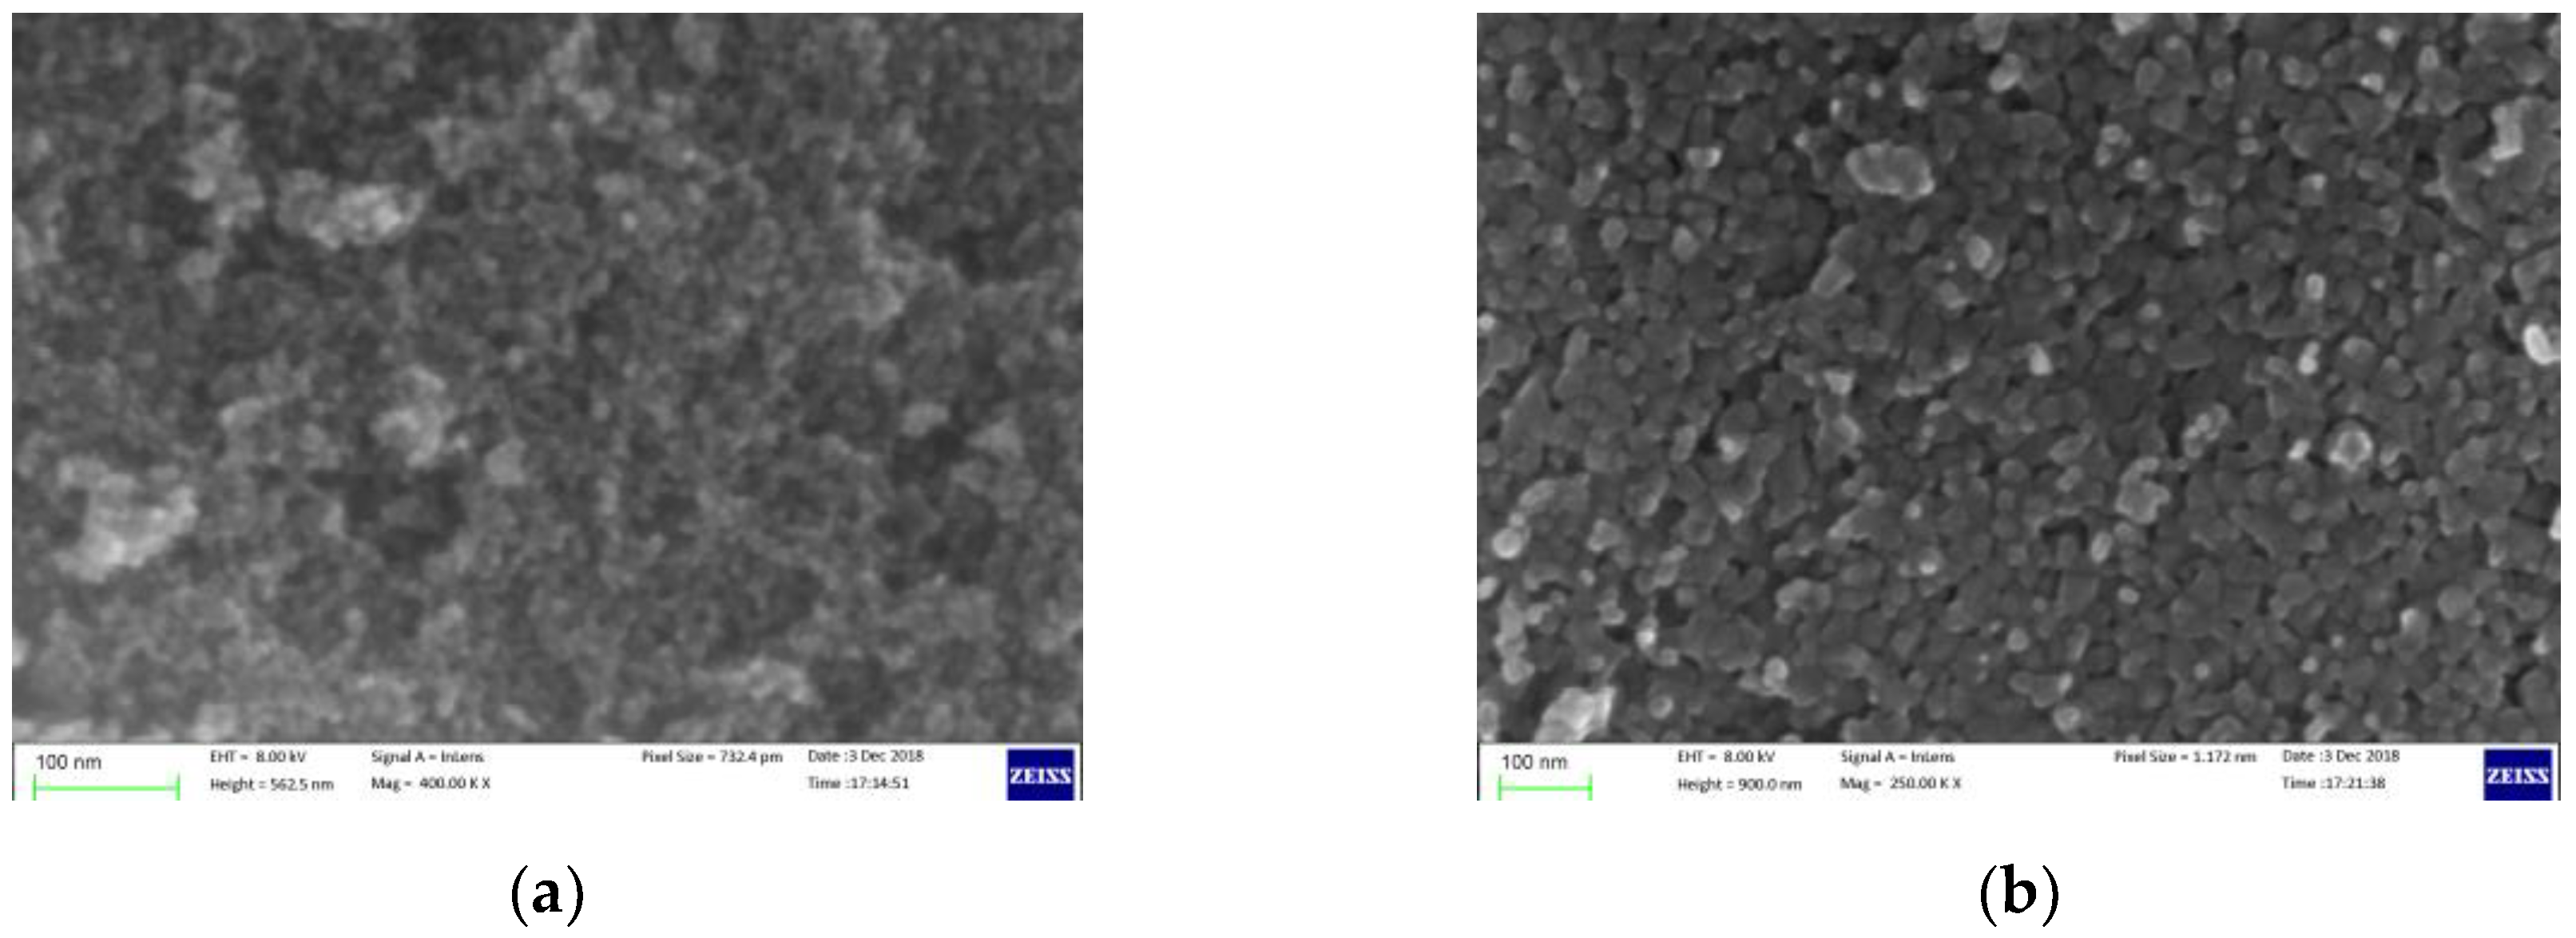
Field-Emission-Gun Scanning Electron Microscopy (FEG-SEM) Zeiss with cutting-edge electro-optical design was used to study the size and morphology of the nanoparticles.
Diffuse Reflectance Spectroscopy (DRS) determined the band gap of titania. The spectra were collected with a Perkin Lambda 35 UV-Vis spectrophotometer. Band gap energy, Eg, thoroughly determined the absorption coefficient α value (m−1) from a plot of (αhν)0.5 versus photon energy (hν), where h is the Planck’s constant and v is the frequency (s−1). The intercept of the tangent to the absorption curves was used to estimate the band gap (Eg) value.
The dye extraction process was monitored by an Agilent 8453 UV-Vis spectrophotometer, following the absorbance at the maximum of UV-Vis spectrum, after water dilution. Dye solutions were characterized by various methods to determine the concentrations of anthocyanins, catechins, tannins, polyphenols, and color intensity. Anthocyanins that were extracted from winemaking lees were determined by the procedure of Ribereau Gayon and Stonestreet (1965) [
29] with the bisulphite bleaching as anthocyanins form colorless compound with the bisulphite ion, thus transferring from the red colored flavylium cation to a non-colored form. The catechins were determined according to the method proposed by Zironi et al. [
30], while using DAC (4-(dimethylamino)cinnamaldehyde). The assay was performed using a chromogen reagent of 1.0 g DAC dissolved in 250 mL of 37% HCl and 750 mL methanol. To 1 mL of 1:25 (v/v) diluted sample, 5 mL of DAC solution were added and, after 5 minutes, the maximum value of absorption at 640 nm was measured against a blank that was prepared by substituting sample with 1 mL of 10% ethanol. Tannins characterization was carried out following the Weinges and Nader method [
31]: the sample was diluted fifty times and 2 mL of solution was added to a tube containing 6 mL of acidized butyl alcohol prepared by dissolving 150 mg Fe(SO
4) in 500 mL of 1-butanol and 500 mL of HCl 37%. Half of this solution was put in an oven at 100 °C for 30 minutes. After cooling, the optical density was measured at 550 nm for both solutions against water. The polyphenols content of extracted dyes was evaluated using the Folin-Ciocalteu’s method that involves the addition of 0.5 mL of Folin–Ciocalteu’s reagent to 0.1 mL dye sample diluted 1:10 in water. After mixing, 2.0 mL of 15% Na
2CO
3 were added and the volume was brought up to 10 mL with deionized water. The sample was kept in the dark for two hours and then absorbance was measured at 750 nm while using a solution with deionized water as reference sample. The color intensity was determined as a sum of the absorbance at 420 nm, 520 nm, and 620 nm following the Glories method [
32], with an optical path of 10 mm.
The measurements of power (P) and photocurrent (J) that were generated by the obtained photovoltaic cell were carried out by irradiating the prototype with a Sunlight Solar Simulator (AM 1.5G filter, 100 W Xenon arc lamp, Abet Technologies) to simulate the solar spectrum on earth surface, and using a digital multimeter (Tecktronix Keithley 2410) that was directly connected to the cell electrodes. The power against voltage P-V curve was obtained by simultaneous measurements of flowing current J and cell voltage V. The efficiency of solar cells η = Jmax Vmax/Pi were finally calculated, where Jmax and Vmax are the current density and voltage at maximum power generation of a solar cell and Pi is the incident power of the light source used (1000 W/m2).
3. Results and Discussion
3.1. Nanostructured Semiconductor
FEG-SEM microscopy evaluated the morphology of the synthesized TiO
2.
Figure 2 illustrates the presence of aggregated nanoparticles with a size between 5–50 nm. After the screen-printing process of titania paste, a thermal treatment is required to obtain a layer with the most suitable characteristics. As expected for this type of oxide, the aggregation of TiO
2 nanoparticles, as well as their average size, increased by increasing the calcination temperature, passing from about 10 nm for the sample that was treated at 400 °C to about 28 nm for the sample treated at 600 °C.
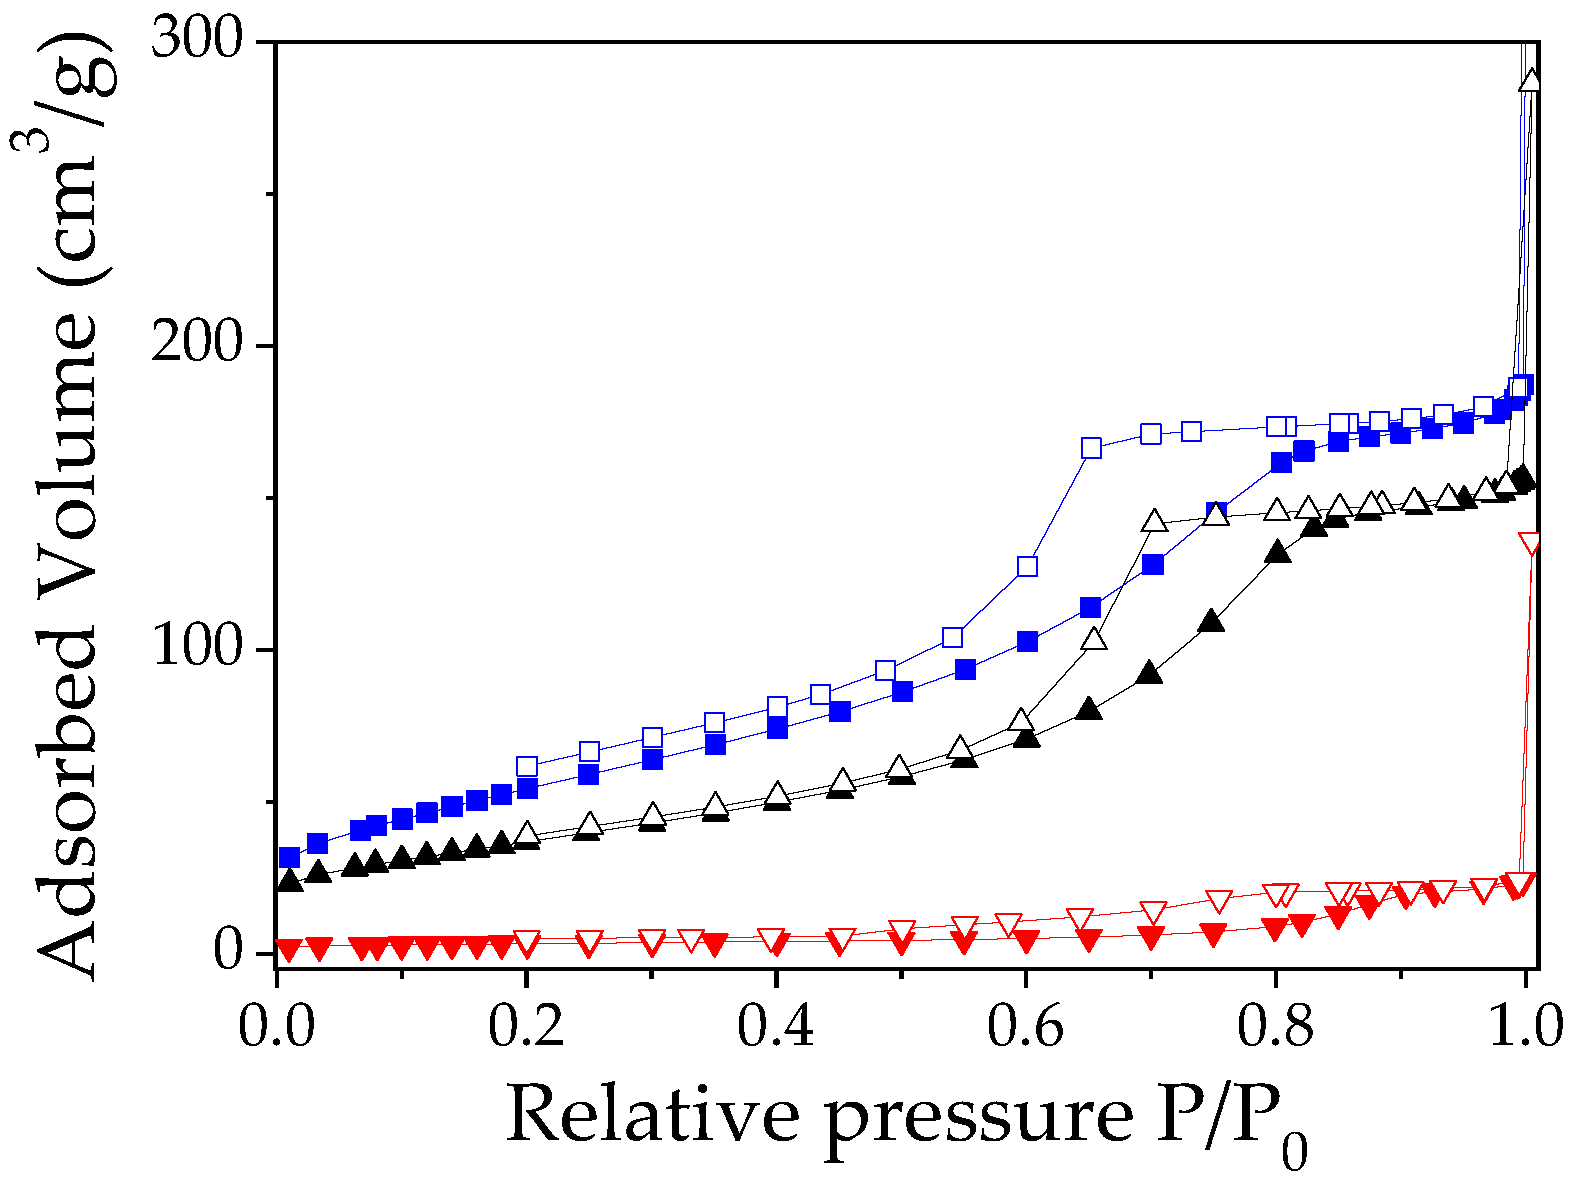
N
2 physisorption at −196 °C to evaluate its textural properties as well as the porosity formed during the sol-gel synthesis characterizes the nanostructured titania semiconductor (
Table 1). The isotherms of the samples, both before and after calcination (at 400 °C or 600 °C) are of type IV according to the IUPAC classification, with a hysteresis loop indicating an ordered pore size distribution in the mesoporous region (
Figure 3).
Nanostructured titania sample before calcination showed very high specific surface area, SABET, of 206 m2 g−1, a pore diameter distribution lower than 20 nm and a pore volume of 0.281 cm3 g−1. A correlation between the calcination temperature process and the textural features of these materials can be noticed. By increasing the calcination temperature from 400 °C to 600 °C, the surface area drops from 136 to 12 m2 g−1, and the cumulative pore volume significantly decreases, passing from 0.236 to 0.036 cm3 g−1, respectively. This phenomenon can be attributed to the reorganization of the crystalline structure towards a thermodynamically more stable structure, with an increase of the nanoparticles average size, as observed by the FEG-SEM micrographs.
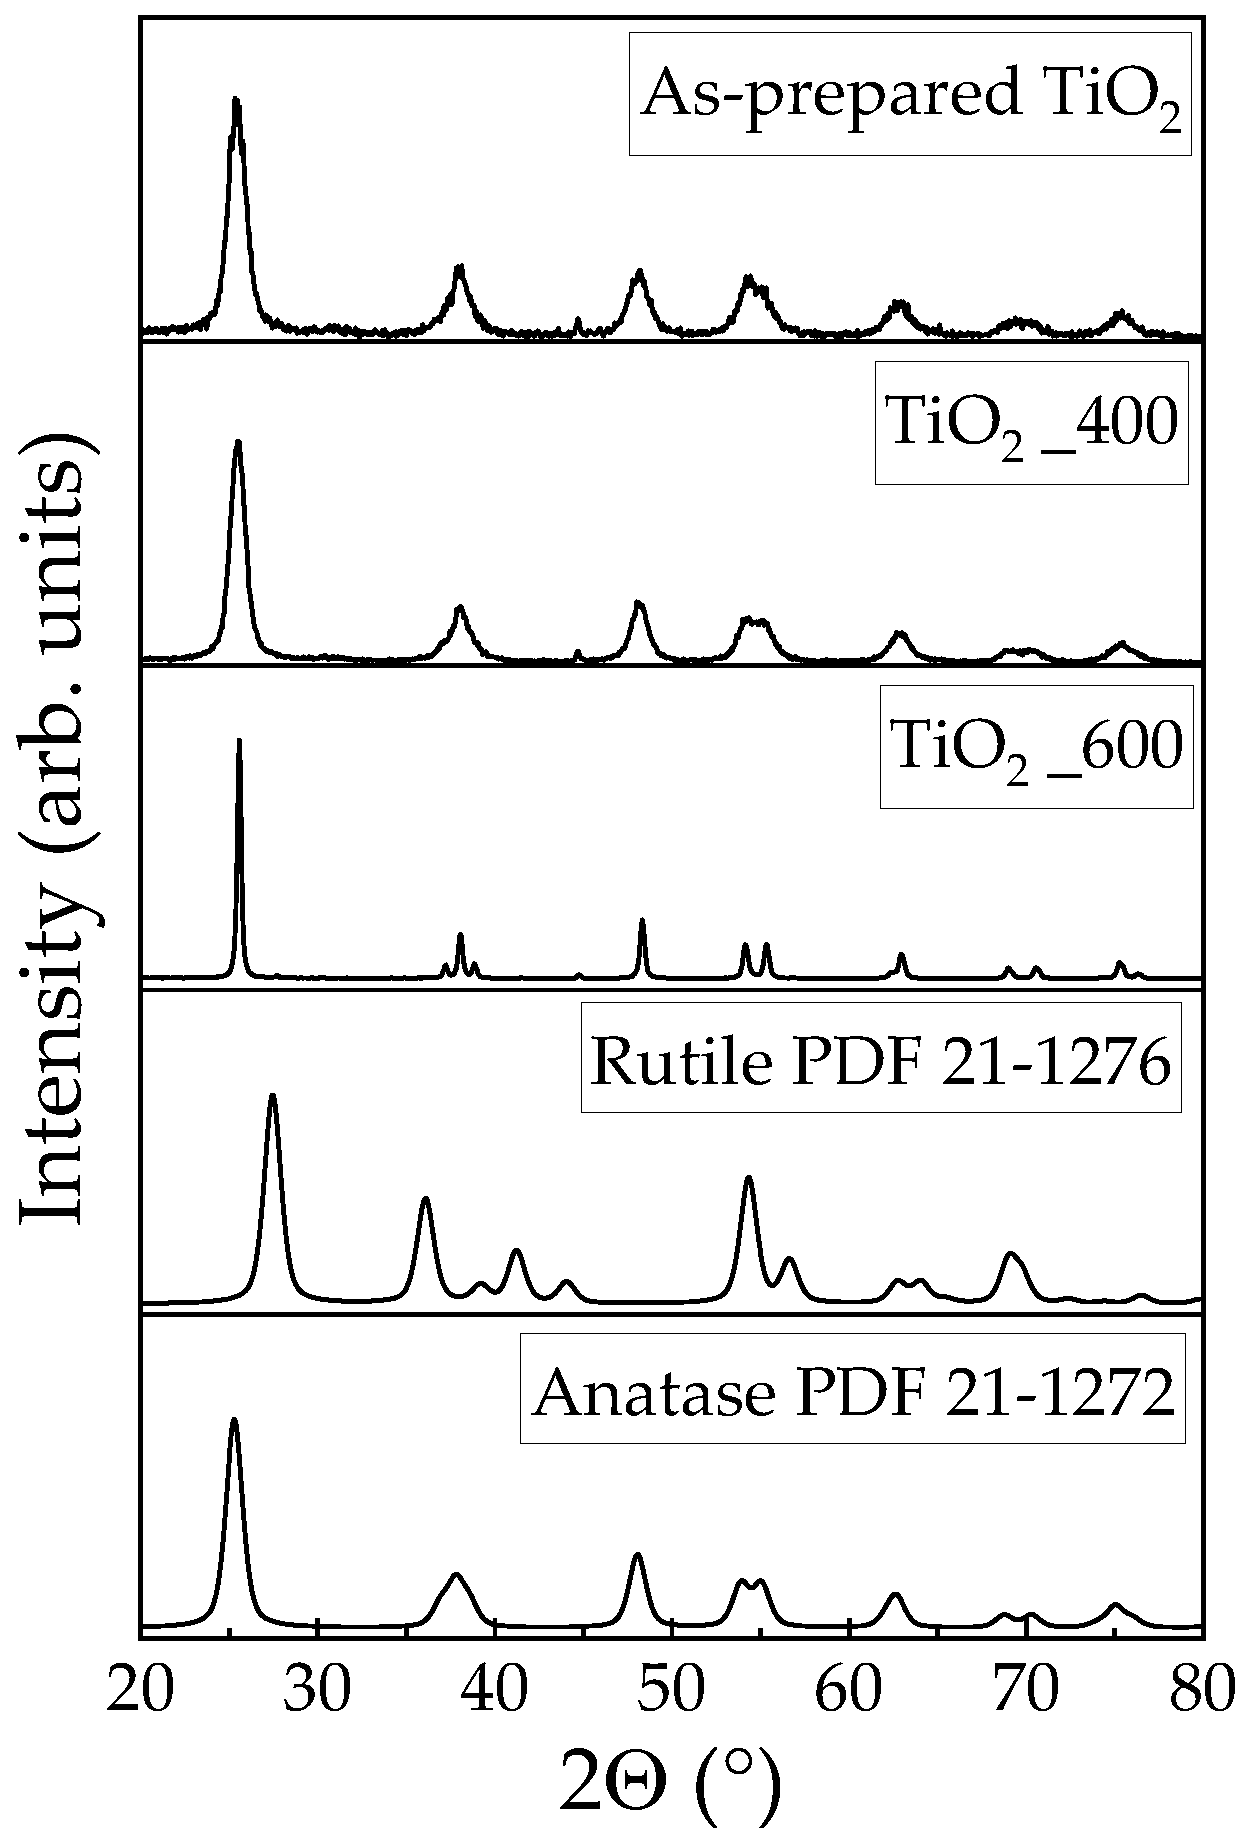
Figure 4 shows the diffractograms of titania samples before and after calcination. The diffraction peaks of the as-prepared and calcined at 400 °C samples can be indexed, which is in agreement with the values of standard cards, as typical anatase phase (JCPDS, PDF card no. 21–1272) of TiO
2. When the calcination temperature increases to 600 °C, the typical rutile (110) reflection becomes noticeable at 2θ = 27.4°, showing a partial transformation of anatase phase into rutile polymorph (JCPDS, PDF card no. 21–1276). The peak broadening that was observed for the as-synthetized titania sample suggests the formation of small crystallites during the particle growth in the sol-gel synthesis process. As the calcination temperature increases, anatase and rutile peaks become sharper and more intense, due to particles aggregation, which leads to the growth of larger crystal domains.
The average size of anatase results to be 6.50 ± 0.07 nm for the as-prepared sample and 28.1 ± 0.4 nm for the titania treated at the highest temperature (600 °C). In
Table 1, the weight fractions of the different titania phases are reported, showing the presence of only anatase in both the as-synthesized and the 400 °C treated titania samples. The transformation from anatase to rutile phase is detected at 600 °C, as expected.
In DSSC, an increasing crystallite size, due to high calcination temperature, usually leads to a decrease in traps-level number, thus increasing the final electrical current. On the other hand, thermal treatment at too high temperature reduces the surface area and pore volume of the nanostructured titania, as clearly shown in
Table 1, decreasing the available area for dye absorption. For this reason, the titania that was thermally treated at 600 °C was discarded for the realization of a photovoltaic cell.
Diffuse Reflectance Spectroscopy was used to determine the band gap value of the sample calcined at 400 °C. An absorption peak in the UV region, below 400 nm, and due to an intrinsic absorption of titanium dioxide, was recorded (
Figure 5).
The optical band gap, Eg, of both as-prepared and calcined titania samples was estimated from the linear extrapolation of (αhν)½ versus photon energy (hν) curves, where h is Planck’s constant and ν is the frequency (s−1). The band gap was approximately 3.2 eV for both samples, as expected for pure anatase polymorphs.
3.2. Winemaking Lees Dye Extraction
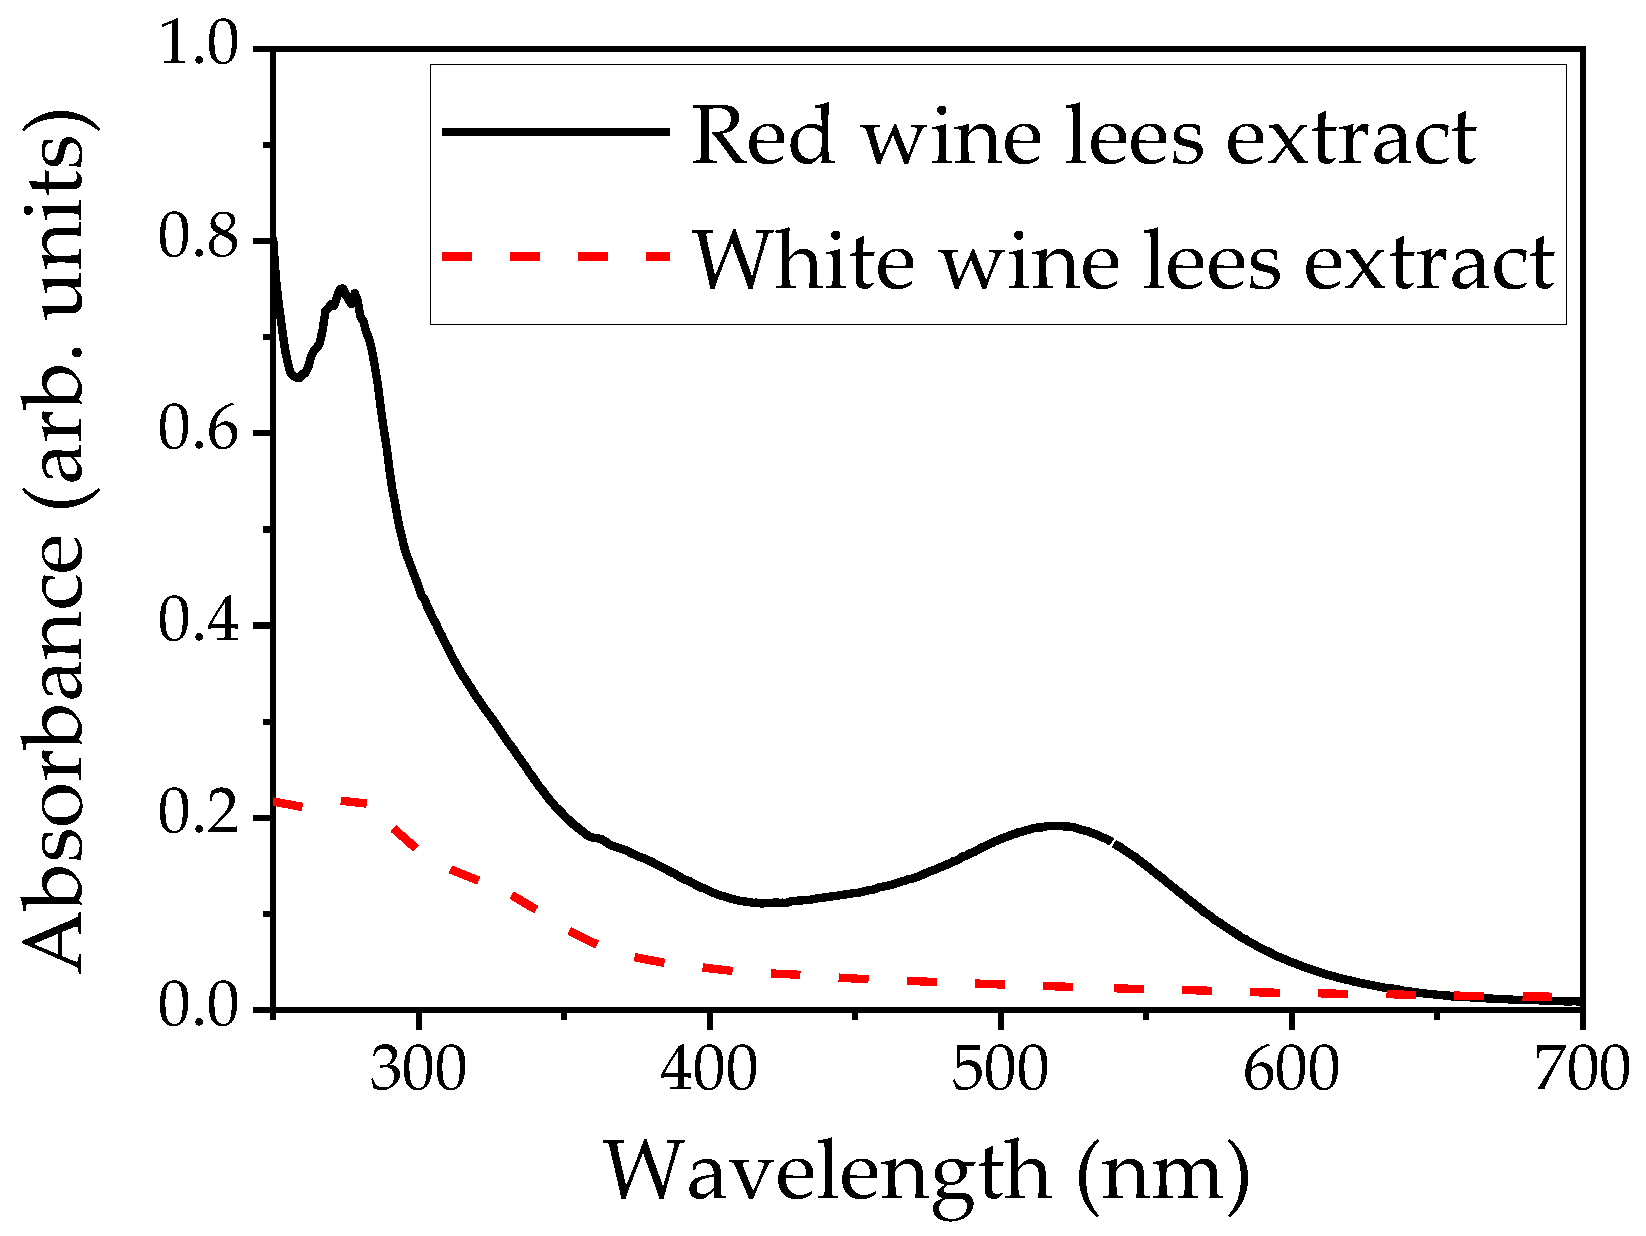
Dye extraction process was carried out valorizing the lees deriving from red and white wines, characterized by a pH value of 3.7 ± 0.5. After centrifugation of winemaking lees, the colored solid was used to extract the dyes that were used for the realization of a DSSC photovoltaic cell. Firstly UV-Vis spectra of water diluted dyes sample, extracted with ethanol in 1:1 w/w lees-solvent ratio, acidified with concentrated HCl were registered. A peak at 280 nm and a large absorption band centered at 520 nm for red wine lees and at 280 nm for white wine lees can be noticed (
Figure 6). It is evident that the red extracts absorb in the visible region of light spectrum and, hence, fulfil the primary criterion for their use as sensitizers in DSSCs.
Considering that the most efficient organic DSSCs are usually based on organic dyes that consist of anthocyanins obtained from red or purple fruits [
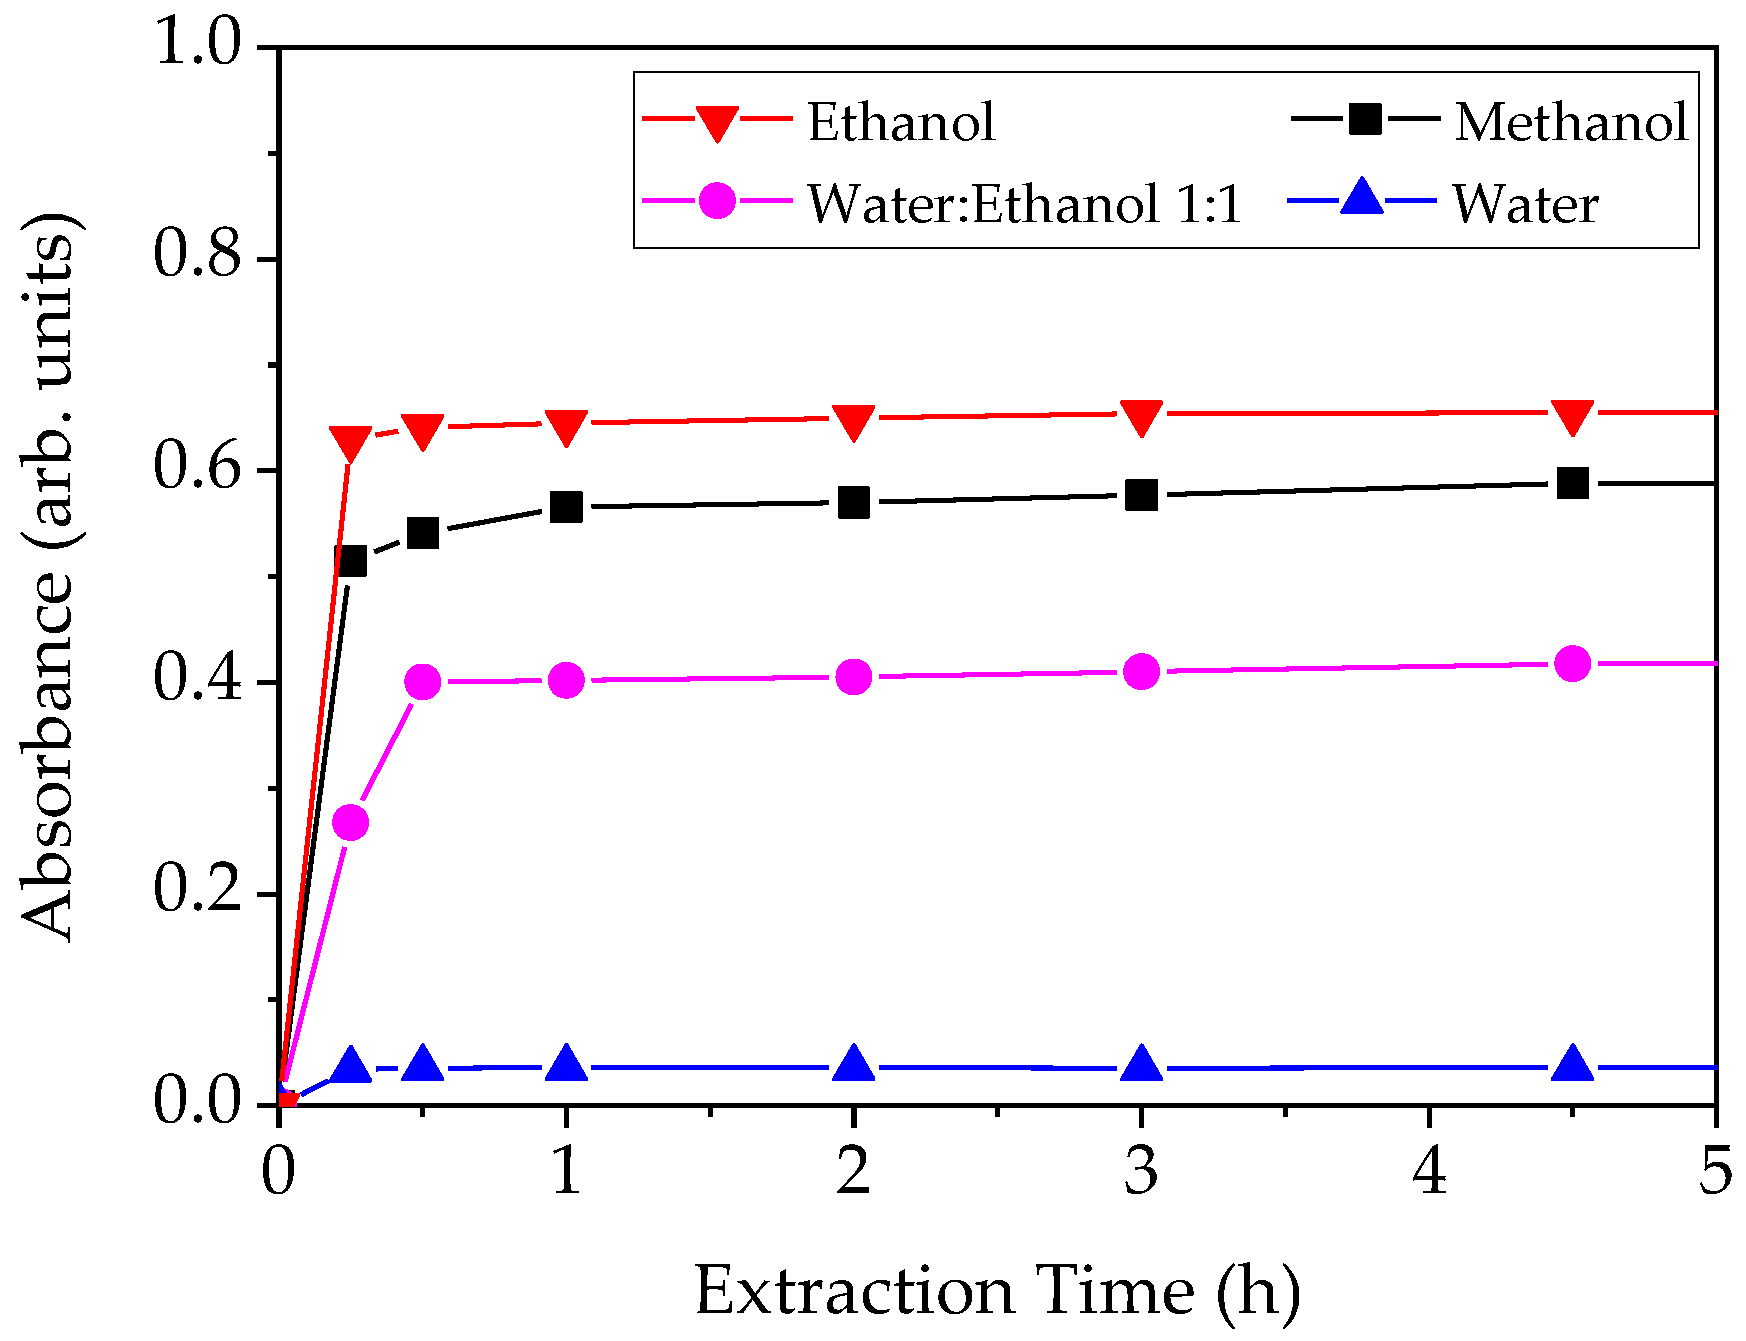
9], the red extract was further investigated. Using the same conditions reported before, several extractions were conducted with different solvents (methanol, ethanol, water, and mixture thereof). The maximum absorbance of red wine extract was used to monitor the concentration of dye solution during the extraction process, as a function of the extraction time.
The kinetics of the dye extraction process, as shown in
Figure 7, prove that the dye extraction from bentonite clay can occur in some hours. For all of the solvents used, absorbance increases very rapidly in the first hour, reaching an asymptotic behavior just after 2 h. These experimental findings suggest that, at the beginning of the extraction process, solvent desorbs dye molecules from the external structure of bentonite layers, and then extracting organic molecules located in the middle of the clay layers. After optimizing the extraction process, the organic molecules were further characterized, and the concentration of the different organic molecules that were involved in color appearance was evaluated.
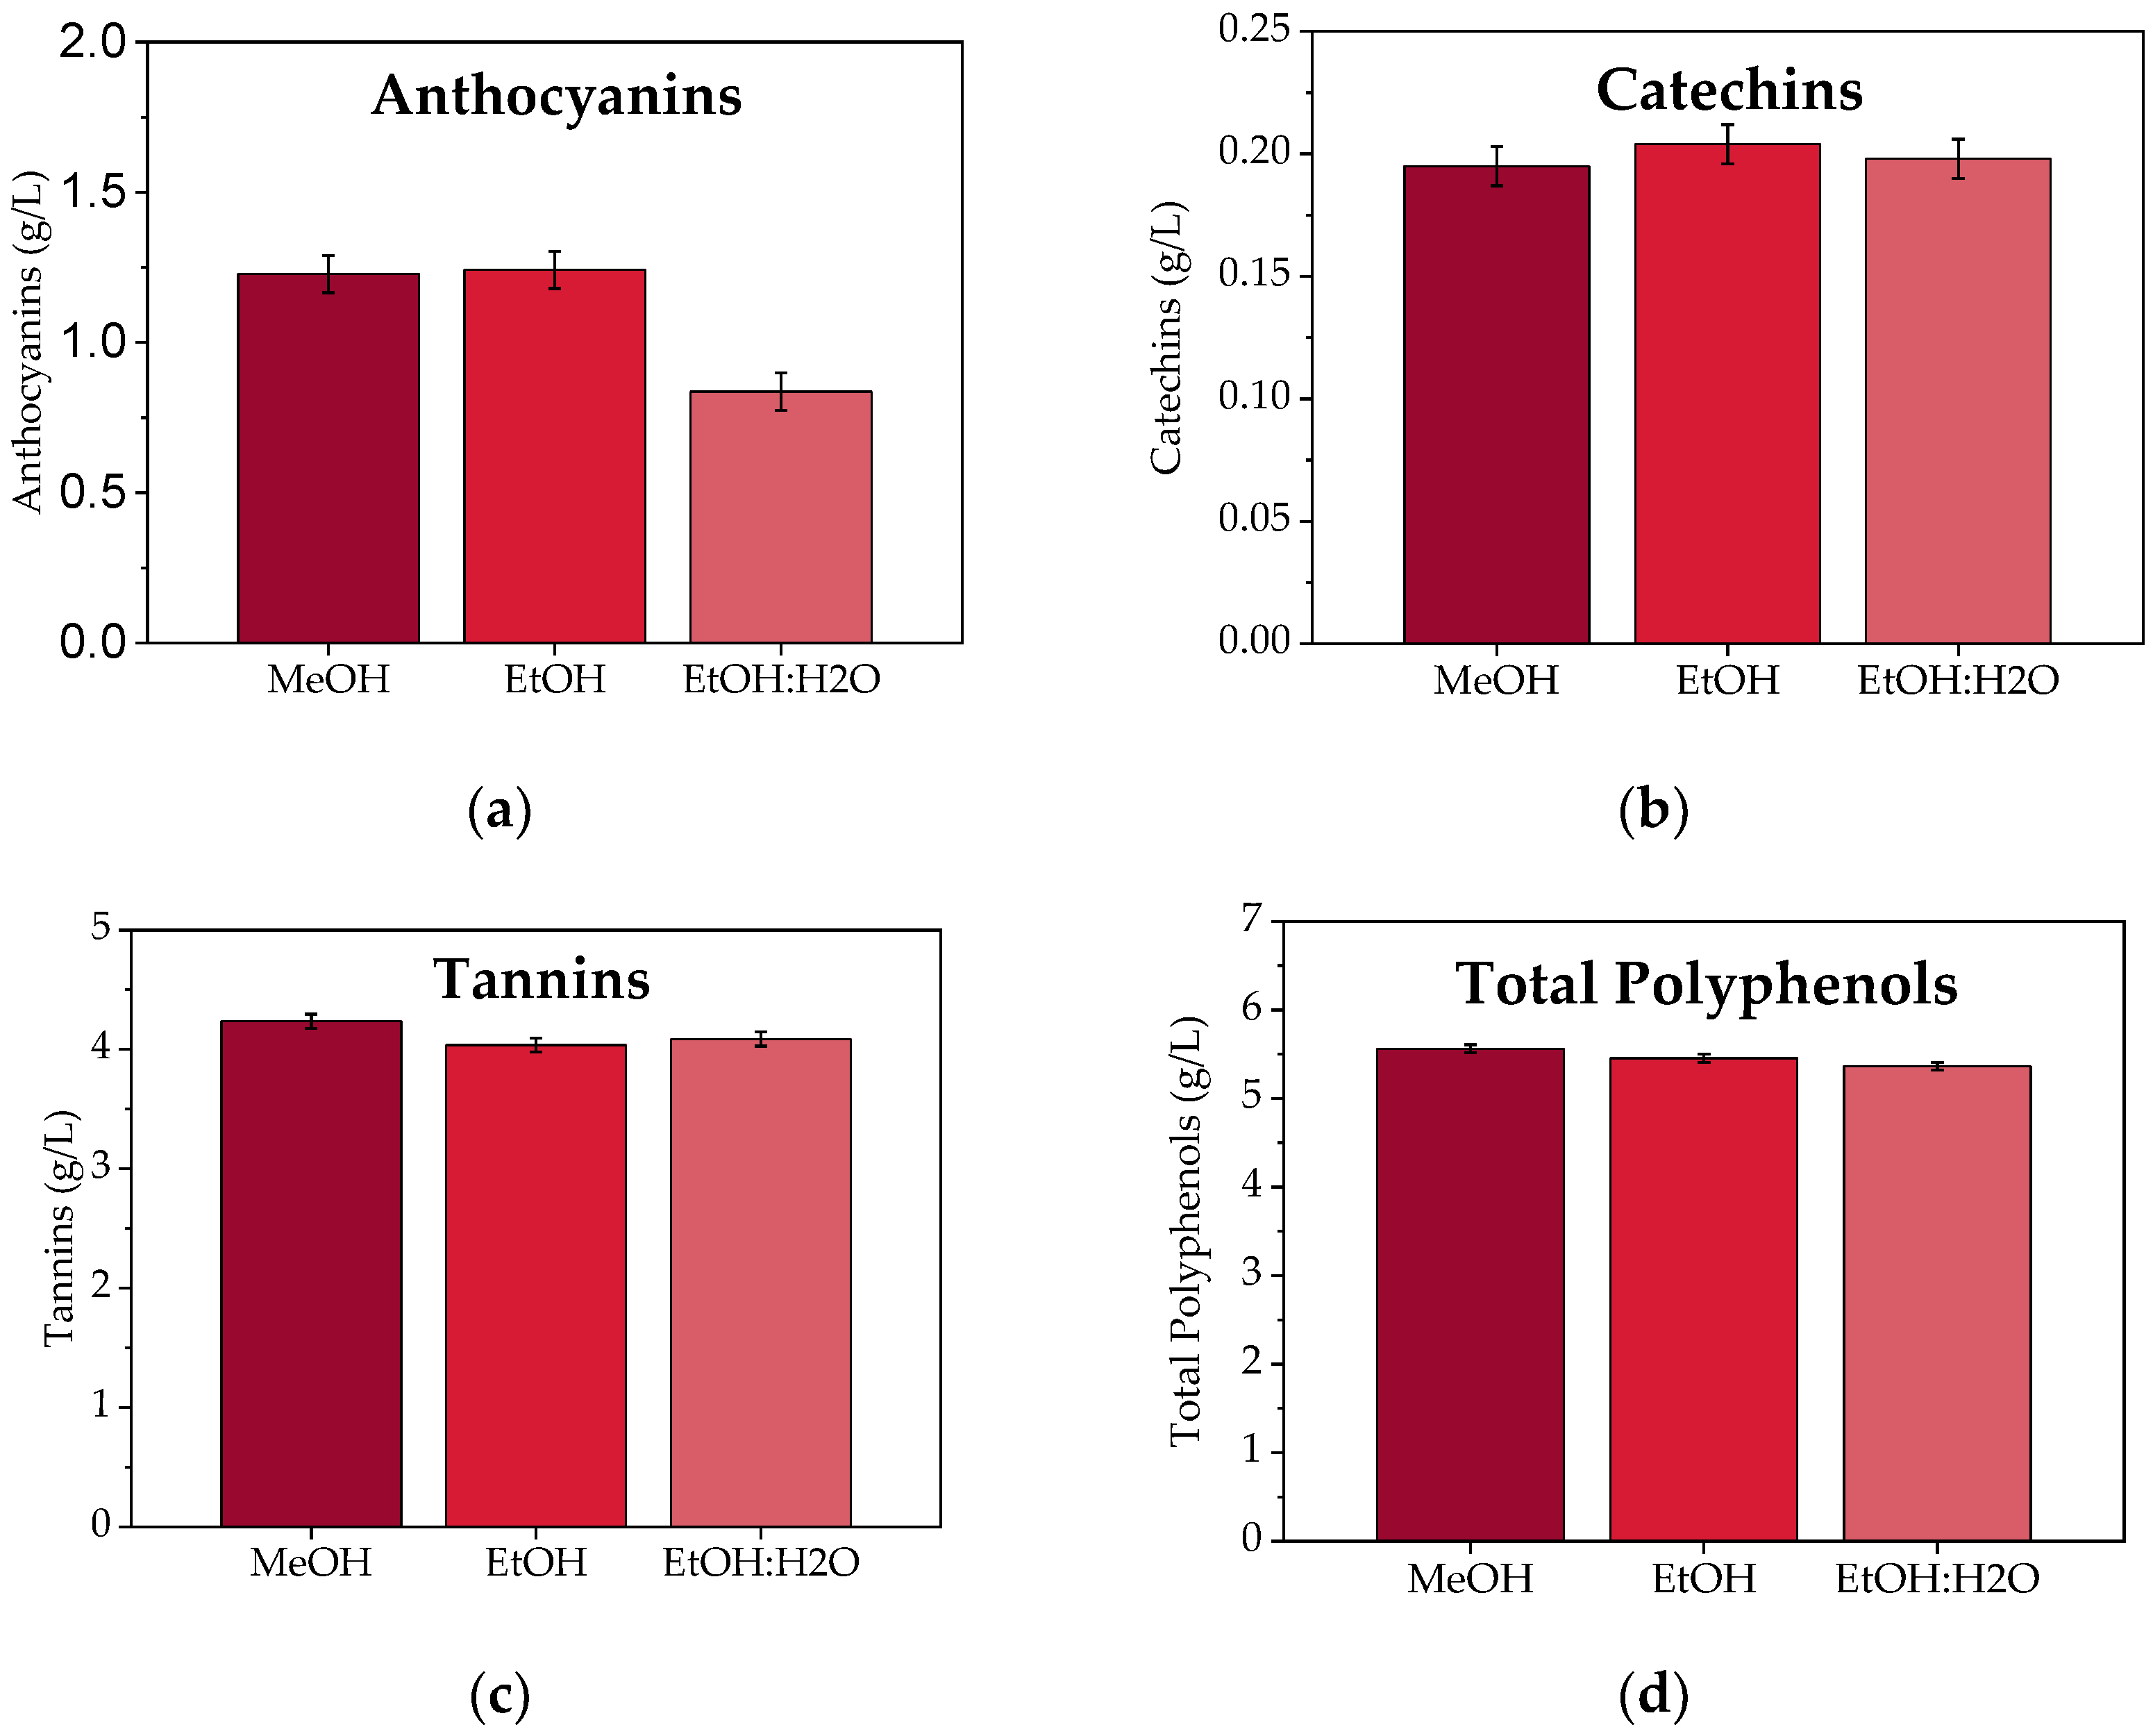
Figure 8 reports anthocyanins, tannins, catechins, and total polyphenols concentrations.
In particular, the anthocyanins responsible for red color resulted in being very concentrated (1 g/L), as compared to the typical values of anthocyanins content in red wines [
33]. The presence of water is responsible for the decreasing of dye concentration in the extracted solutions, which was probably due to the different solubility of these molecules in organic and aqueous solutions.
Another important characterization is the color intensity (related to the dye concentration): it was determined as the sum of the absorbance values at 420 nm, 520 nm, and 620 nm. The values of color intensity were 41.3 for methanol extraction, 43.2 by using ethanol, and 32.0 with a mixture ethanol-water.
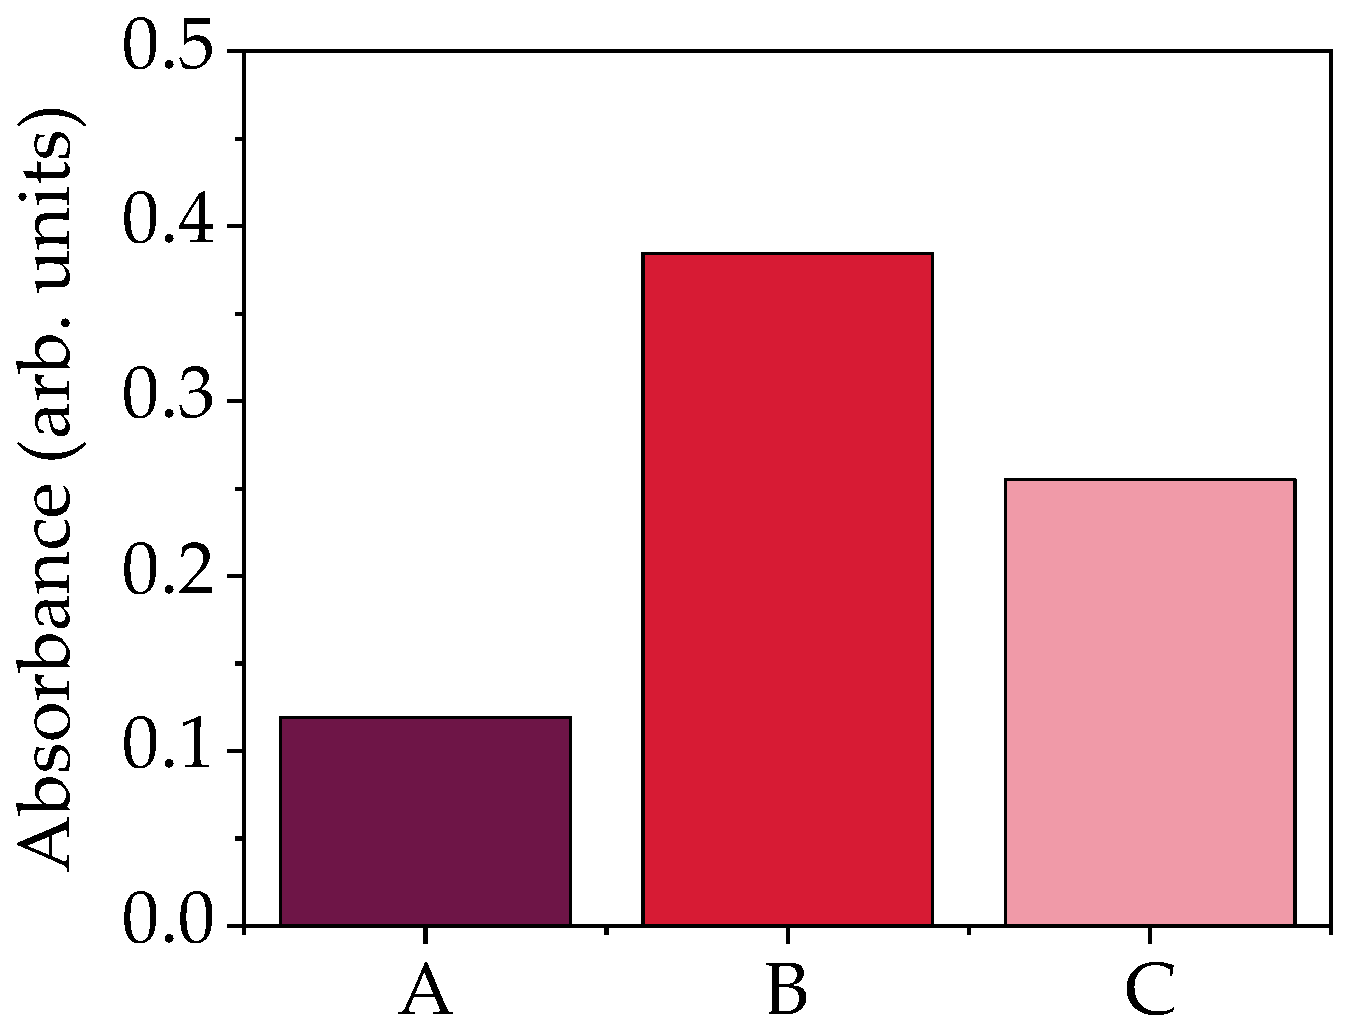
Soxhlet extraction can be another possible way to extract organic dye from solid lees. In this case, the lees are continuously washed with fresh ethanol, allowing for recycling the solvent and perhaps increased the polyphenols content in dye extract. Soxhlet extraction was performed, by using 1:3 w/w lees-solvent ratio. For comparison, solid-liquid extraction was performed with 1:1 w/w or 1:3 w/w lees-solvent ratio.
As reported in
Figure 9, the Soxhlet extraction process led to a quite poor absorbance in comparison with both 1:3 w/w lees-solvent ratio and 1:1 w/w extraction. The different absorbance values between the two methods can be due to the different temperature conditions used (RT and reflux temperature, about 80 °C), determining a partial degradation of polyphenols during Soxhlet extraction. Literature reports in fact that these molecules are very sensitive to changes in temperature, following a first-order kinetic model degradation [
34]. The different absorbance between 1:3 and 1:1 w/w extracts is due to different volumes used for extraction. Therefore, an alcoholic extraction with 1:1 w/w ratio is the best choice if a concentrated polyphenols solution is needed; conversely, a more diluted solution is preferred if a higher total content of colored polyphenols is required.
As reported in
Table 2, the total amount of polyphenols evaluated through spectrophotometric analysis is lower for Soxhlet extract than for RT extraction, most probably due to degradation of organic molecules during the extraction process at high temperature. In particular tannins, that absorb visible light around 280 nm, results less concentrated using Soxhlet but, despite different dilution and thermal treatment, anthocyanins content is similar. The method used to determine the concentration of tannins is based on Weinges and Nader method, where procyanidin were depolymerized through the breakdown of their intra-flavonols bonds in an acidic heat medium [
35]. This gives rise in carbocation formation partially converted into red cyanidins with a specific absorption at 550 nm. It is possible to assume that also, during Soxhlet extraction, this reaction took place, because of the high temperature and the presence of hydrochloric acid. Tannins content is lower in Soxhlet extract because the sample was already depolymerized and a certain amount of tannins was converted to red cyanidins. Moreover, degradation of anthocyanins is compensated by tannins conversion to anthocyanidin monomers, that absorb close to the wavelength used to determine the anthocyanin contents (520 nm). During Soxhlet extraction of white wine lees (where the anthocyanins content is less than 10 mg/L), a change in color has been noticed from yellow to red-orange, confirming the reaction of tannins in acidic heat medium. Finally, RT and Soxhlet extracts of both, red and white lees, were used to impregnate semiconductor porous film of DSSCs.
Anthocyanin can show different color and stability depending on the solution pH, from red flavylium form in acidic solution to purple deprotonated quinonodial form at higher pH values. Therefore, the complexation with metal ions can shift to lower energy the absorption band of these molecules. This mechanism can be visible after impregnation process on a porous film, where there is a strongly interaction between hydroxyl or carbonyl group of anthocyanin with titanium(IV) sites of nanostructured semiconductor [
10,
36] that leads dye color change from red to purple.
3.3. DSSCs Efficiencies
The photovoltaic performances of DSSCs using natural winemaking lees dyes as the photosensitizer (TiO
2-dye/electrolyte containing I, I
3− /Pt counter electrode) were determined to evaluate the cell power and the photocurrent generated in the presence of the solar simulator. The J-V and P-V curves can be used to determine the open circuit voltage (V
OC), the short circuit current density (J
SC), the fill factor (FF), and the efficiency (η). The same photocurrent tests for the cell using bare TiO
2_400 electrode determined under identical experimental conditions were also carried out and, as expected, no current was observed. DSSCs was realized with the mesoporous nanostructured titania calcined at 400 °C and using four different organic dyes that were extracted from winemaking lees to impregnate the semiconductor layer.
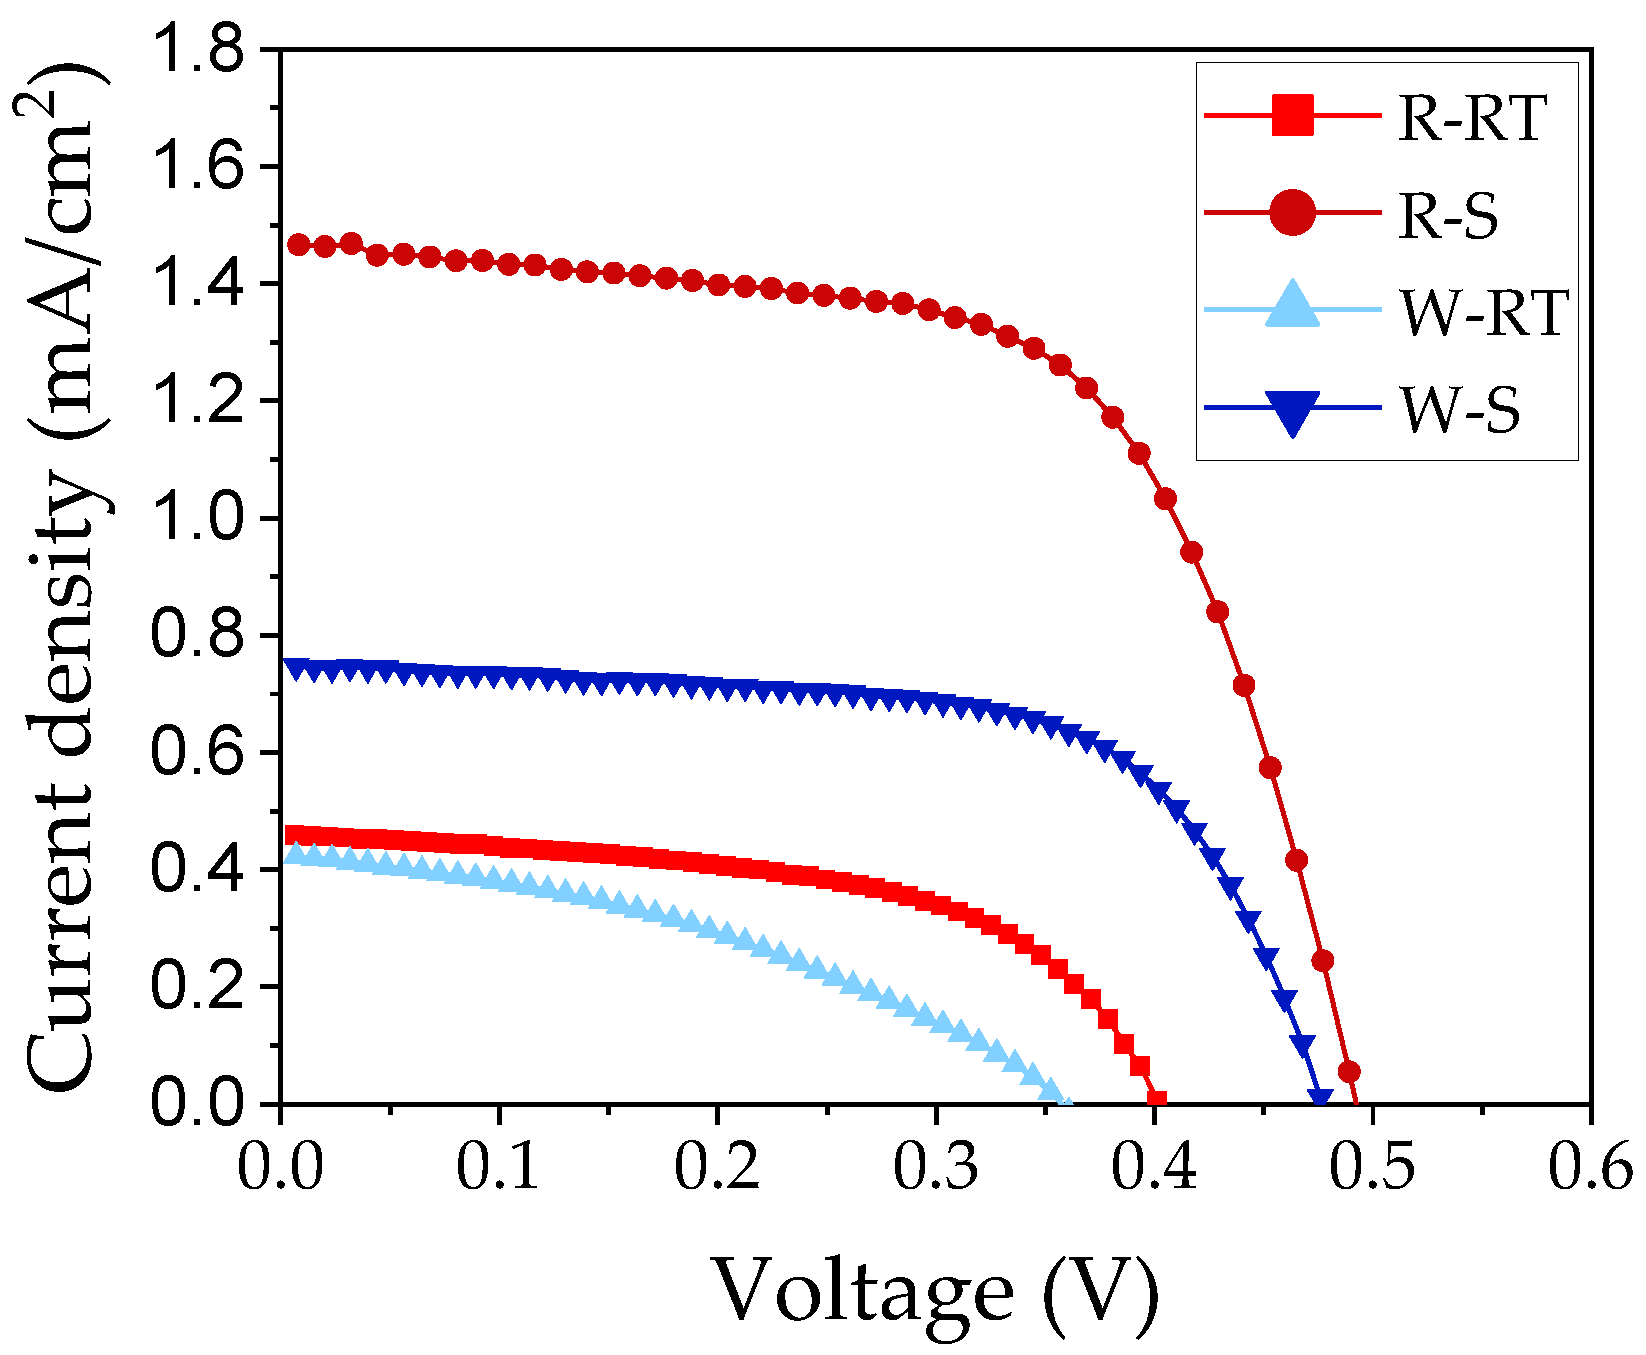
Figure 10 reports the J-V and P-V curves of these solar cells.
As reported in
Table 3, the efficiency of cells built with white wine lees has lower efficiency than red wine extract, due to the poor content of anthocyanins that limits the absorption of visible light radiation. Using Soxhlet extraction for both red and white winemaking lees can increase the performance of the cell, most probably due to the tannins reaction, which leads to an increase in red-coloured molecules that can absorb in the visible range and efficiently transfer excited electron to semiconductor layer. The best efficiency η was obtained by red wine extract made with Soxhlet, showing a V
oc and J
sc values of 0.492 V and 1.47 mA/cm
2, respectively. All these data are comparable with the typical values of an organic dye sensitized solar cell [
9] built with dyes that were extracted from vegetables and fruits.
Plant kingdom is full of dyes and, depending on fruit, flower or leaf concentration of photosensitive molecules, can significantly vary. Although winemaking lees are widely available, every kind of grape also has different types of polyphenols and different concentrations. Moreover, differences of polyphenols composition depending on the picking times of the grapes are possible, also employing the same type of processed wine.
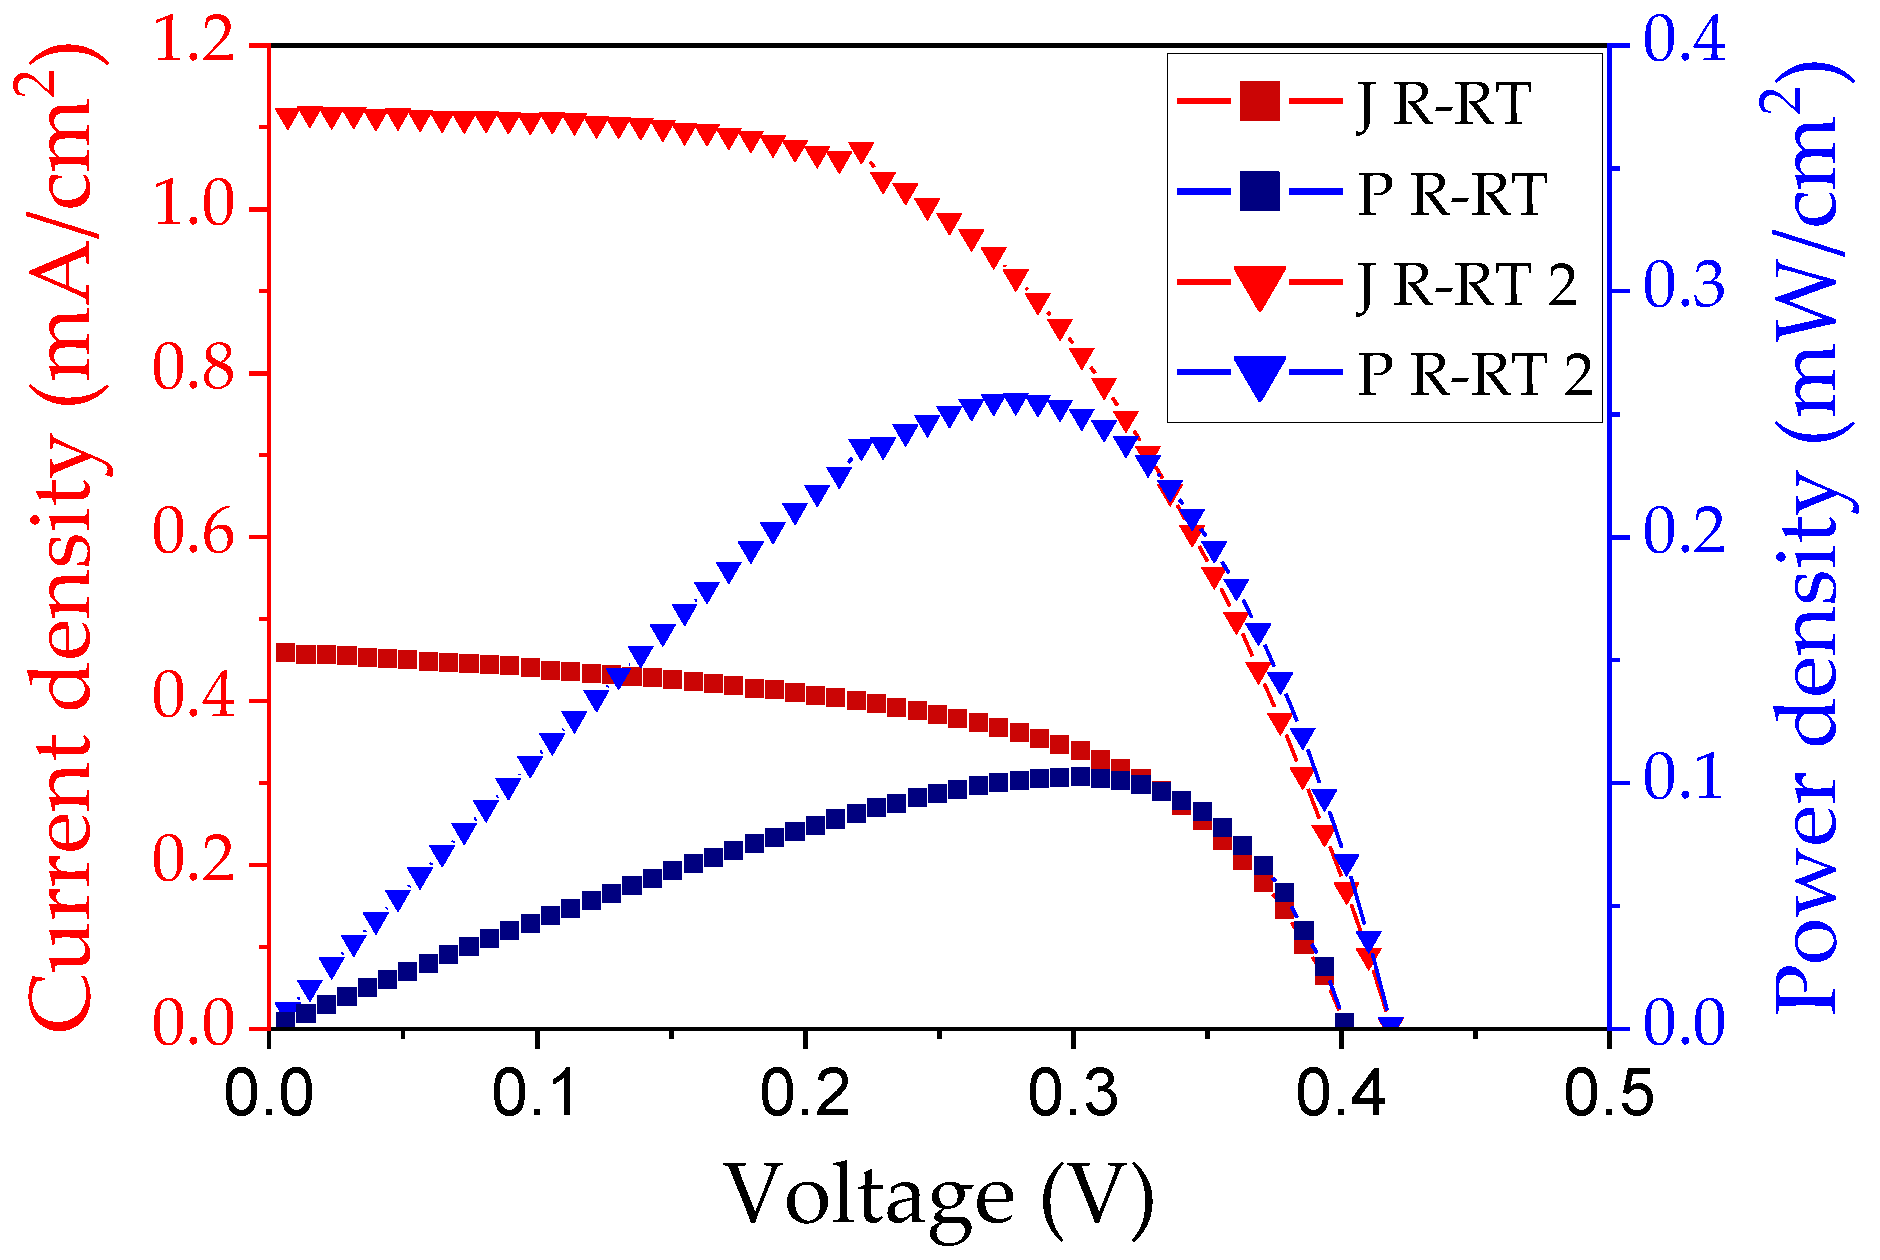
Two kinds of red wine lees can lead to different efficiency, although lees have been subjected to the same extraction process, as reported in
Figure 11.
Efficiency, J
sc and V
oc are comparable with other DSSCs existing in literature (
Table 4) and built while using grapes or wine as dyes. As expected, changing the typology of grapes and wine leads to a widely different efficiency, from 0.025% to 0.57%. For the future it is desirable to further study the variation of winemaking lees composition during the year to understand how the grapes properties can affect the final composition of winemaking lees and eventually purify the extracts to obtain more comparable solutions during the year since vegetables and fruits are natural agricultural products subjected to climatic conditions.


 ,
, 


