Article

Source Apportionment of PM2.5 and of its Oxidative Potential in an Industrial Suburban Site in South Italy

1
Institute of Atmospheric Sciences and Climate, ISAC-CNR, Str. Prv. Lecce-Monteroni km 1.2, 73100 Lecce, Italy
2
Institute of Atmospheric Sciences and Climate, ISAC-CNR, Via Piero Gobetti, 101 40129 Bologna, Italy
3
Institute for the Dynamics of Environmental Processes, IDPA-CNR, Via Torino, 155-30172 Venezia Mestre, Italy
4
Department of Environmental Sciences, Informatics and Statistics, Ca’ Foscari University of Venice, Via Torino 155, 30172, Venice, Italy
*
Author to whom correspondence should be addressed.
Atmosphere 2019, 10(12), 758; https://doi.org/10.3390/atmos10120758
Submission received: 16 October 2019 / Revised: 26 November 2019 / Accepted: 27 November 2019 / Published: 29 November 2019
(This article belongs to the Special Issue Oxidative Potential of Atmospheric Aerosols)

Abstract

:
Some studies suggested a role of the atmospheric particulate matter (PM) and of its oxidative potential (OP) in determining adverse health effects. Several works have focused on characterisation of source contributions to PM OP, mainly using three approaches: correlation between OP and chemical markers of specific sources; use of OP as input variable in source apportionment with receptor models; and multi-linear regression (MLR) between OP and source contributions to PM obtained from receptor models. Up to now, comparison of results obtained with different approaches on the same dataset is scarce. This work aims to perform a OP study of PM2.5 collected in an industrial site, located near a biogas production and combustion plant (in southern Italy), comparing different approaches to investigate the contributions of the different sources to OP. The PM2.5 samples were analysed for determining ions, metals, carbonaceous components, and OP activity with the DTT (dithiotreitol) assay. Results showed that OP normalised in volume (DTTV) is correlated with carbonaceous components and some ions (NO3, and Ca2+) indicating that PM of combustion, secondary, and crustal origin could contribute to the OP activity. The source apportionment, done with the Environmental Protection Agency (EPA)—Positive Matrix Factorization (PMF5.0) model, identified six sources: secondary sulphate; biomass burning; industrial emissions; crustal; vehicle traffic and secondary nitrate; and sea spray. A MLR analysis between the source’s daily contributions and the daily DTTV values showed a reasonable agreement of the two approaches (PMF and MLR), identifying the biomass burning and the vehicle traffic and secondary nitrate as the main sources contributing to DTTV activity.

1. Introduction

Several studies worldwide have identified particulate matter (PM), and especially its fine fraction, as a critical parameter responsible for adverse health effects [1,2,3]. Although the toxic effects of PM have been correlated with some chemical and physical properties, the toxicity mechanisms are not yet fully known. Some studies [1,4,5] suggested that several adverse health effects could be due to the oxidative potential (OP) of particulate matter, which leads to high concentrations of reactive oxygen species (ROS), chemical species capable of causing damage at the cellular level. Particularly, these ROS trigger an oxidative stress response involving several proinflammatory cascades that ultimately result in pathology [6,7]. For this reason, in the international scientific community, the OP of atmospheric particulate has started to be considered as a general indicator of risks for human health due to atmospheric particulate matter [8]. Thus, several studies were focused to develop/apply biological and chemical assays to quantify the oxidative potential of atmospheric aerosol and cellular oxidative stress response [9] leading to a variety of cellular [10,11] and acellular methods to evaluate OP ([12] and references therein). Acellular assays are faster and less resource-demanding compared to cellular assays, allowing the collection of reasonably large data sets in different locations that could be used in statistical analyses [12]. One common acellular test is the dithiothreitol (DTT) assay, which analyses the rate of DTT depletion catalysed by chemical species present in the PM [13]. Particularly, DTT is a surrogate for the cellular oxidant, such as nicotinamide adenine dinucleotide (NADH) or nicotinamide adenine dinucleotide phosphate (NADPH), which reduces oxygen to the superoxide anion (O2). Overall, the rate of O2 generation catalysed by PM is measured evaluating the rate at which DTT is consumed, depending on the concentration of redox-active species in PM.
This study is focused on the water soluble DTT activity of fine aerosol (PM2.5). The properties of water soluble urban aerosol are relevant for epidemiologists and policy makers [14,15,16,17]. Moreover, some researches established that the water-soluble DTT activity is linked to adverse health impacts of PM [18,19,20,21]. The water soluble OP is thought to involve compounds that, because of their solubility, can be readily absorbed and transported by the body and involved in acute oxidative stress episodes, such as those associated with respiratory and cardiovascular ailments [8].
Summarising the results from studies focused on the correlation of OP and chemical composition of PM, it is possible to conclude that components having a strong redox activity are: metals such as Fe, Cu, Mn, and V [22,23,24], water-soluble organic carbon (WSOC) [16,25,26,27,28], elemental carbon (EC) [13,25,29], organic carbon (OC) [25,30,31], and polycyclic aromatic hydrocarbons (PAHS) [13,32,33]. Instead, several other components, including secondary inorganic ions that may contribute significantly to PM mass concentrations, do not have strong correlation with OP [34].
During recent years, several studies [12,34,35,36,37,38] investigated the contribution of atmospheric sources of PM to OP suggesting that this could provide useful information to effectively reduce emissions from sources that release PM with greater potential toxicity. The main approaches used in the literature to estimate source contributions to OP are essentially three. The first is linear or multi-linear (MLR) regression between OP and concentrations of the different chemical species looking at tracers of specific sources [27,39,40,41,42]. This is essentially a qualitative approach that could give information regarding the sources influencing OP. The second is the quantitative analysis performed applying MLR to the outputs of receptor models regressing contributions of PM sources against measured OP values. Receptor models used are principal component analysis (PCA) [21,43,44], chemical mass balance (CMB) [8,33,34,43,45], and positive matrix factorization (PMF) [35,46,47]. In the third approach, the measured OP values are included as input in the PMF receptor model [36]. In some cases, results coming from application of different receptor models are compared [34,36,43], however, up to now no comparison has been done among results obtained by application of MLR and the use of OP values as input for the PMF model.
This work aims to perform a study of OP of the water-soluble fraction of PM2.5 collected at an industrial site located near a biogas plant in the background area of Sarno territory (Campania region, South of Italy) and to estimate the contribution of PM2.5 sources to the measured oxidative potential. Contributions to OP obtained with MLR applied to the outputs (contributions to PM2.5) of EPA-Positive Matrix Factorization (PMF5) receptor model will be compared to the contributions obtained directly using OP as input in the PMF5 run.

2. Experimental

2.1. Measurement Site Description and Sampling Campaign

The area investigated is located in the municipality of the town of Sarno (in Campania, southern Italy), about 1.5 km from the industrial area and 4–5 km from the town (Figure 1). The measurement site (coordinates 40°50′14′’ N–14°34′49′’ E) is located about 1.5 km from the access to the Caserta-Salerno motorway (A30) and at 100 m from the delimitation of a biogas production (from agricultural wastes) and combustion plant (electrical power of 999 kWe, thermal power of 1069 kWt). The plant covers an area of 12500 m2, and the cogeneration engine has a continuous operation of 24 h/day and discharges the flue gases through a chimney 10 m tall having an internal diameter of 27 cm.
The measurement campaign was performed between 30/01/2018 and 28/03/2018, using a low-volume (2.3 m3/h) sequential PM2.5 sampler (Zambelli Explorer Plus) equipped with quartz fibre filters (Whatmann, diameter 47 mm). The filters were heated, before use, for 2 h at 700 °C in order to reduce carbon contamination [48]. After sampling they were storage refrigerated (at 4 °C) until the laboratory analysis.

2.2. Gravimetric and Chemical Analysis

The concentration of PM2.5 on the sampled filters was evaluated with the gravimetric method using an analytical microbalance (Sartorious Cubis, ± 1 μg). The uncertainty in the evaluation of daily PM2.5 concentrations was variable between 1 and 1.6 μg/m3 with an average value of about 10% [49]. The daily PM2.5 samples were chemically analysed in order to evaluate the concentrations of elemental carbon (EC), organic carbon (OC), of the main water-soluble ions, and of the main metals.
The EC and OC analyses were done with a Sunset carbon analyser (Sunset Laboratory Inc., OR, USA) operating with the EUSAAR2 protocol (thermo-optical method) [50] on single punch (1 cm2) obtained from ¼ of filter. The analyser was calibrated using standard sucrose solution (2.198 g/l of carbon in water, CPAchem Ltd., Stara Zagora, Bulgaria). Concentrations obtained from collected samples were corrected by subtracting the average levels measured in blank filters. The average uncertainty of the determination of OC was estimated at 5% while that for EC was 10% [51].
A quarter of filter was used to extract the water-soluble fraction of aerosol (30 min in an ultrasonic bath). Aliquots of the extracts were used for the determination of the major ions using two DIONEX ICS_2000 chromatographs: one dedicated to the analysis of cations and one to that of anions. Anions were separated using an IonPac AS11 2 mm × 250 mm column with KOH as an eluent in gradient mode. Cations were separated using an IonPac CS16 3 mm × 250 mm column using an MSA solution as eluent in gradient mode. The average concentrations obtained in collected samples were corrected using measurements done on blank filters.
Another aliquot of each extract was used for the analysis of the oxidative potential of the PM by using the dithiotreitol (DTT) assay [13,52]. The extracts were buffered with 0.5 mL of phosphate buffer 0.5 M at pH = 7.4 for the assay. Reagents used were: DTT 10 mM prepared in 0.5 M phosphate buffer stored at 0 °C, 10% trichloroacetic acid (TCA) prepared in Milliq, tris(hydroxymethyl)aminomethane (TRIS) 0.4 M buffer at pH 8.9 in ethylenediaminetetraacetic acid (EDTA) 20 mM, 5,5’-dithiobis (2-nitrobenzoic acid) (DTNB) 10 mM in 0.5 M phosphate buffer. The reaction was carried out in vials (obscured) in a bath at 37 °C. Aliquots were taken from the vials at regular intervals of 5 min and the absorbance was measured, after stopping the reaction, using a TIDAS E UV-vis spectrophotometer (J&M Analytik AG, Essingen, Germany). The consumption of DTT over time was determined through a linear fitting of the absorbance versus time. The depletion rate of DTT, opportunely corrected using results obtained in field blanks, was used to determine OP value as DTT-activity normalized in terms of sampled air volume (DTTV) or in terms of mass of collected aerosols (DTTM).
The analysis of metal content was carried out by mineralization of ¼ of each filter and successive analysis using an ICP-QMS (inductively coupled plasma-quadrupole mass spectrometry, ICP-QMS 7500I, Agilent Technologies, Santa Clara, CA, USA). Mineralization was done with a microwave (Ethos1-Milestone) and a mixture of ultrapure acids: 6mL of HNO3, 3 mL of H2O2, and 1mL of HF (Romil® UPA). The temperature program for microwave filter mineralization consists of a ramp during which the solutions are brought from room temperature to 190 °C in 25 min, and an isothermal during which the temperature of 190 °C is maintained for 15 min. The solutions obtained from microwave mineralization were then diluted to 50 mL with fully deionized ultrapure water (18 MΩ cm−1 resistivity) produced using the Purelab Ultra system (Elga, High Wycombe, UK). The ICP-MS was calibrated using the multi-elemental standard solution IMS-102 (10 µg/l, Ultrascientific, Santa Clara, CA, USA). The calibration curves had R2 = 0.999 for arsenic and R2 = 1 for all other elements. A standard reference material was used at known concentrations (NIST 1648a) to evaluate recoveries that ranged between 90% and 100%. The concentration of the elements was obtained subtracting that found in blanks. Concentrations lower or comparable with blanks or lower than the method detection limit (MDL) were replaced with MDL/2.

2.3. Source Apportionment Approach

The PM2.5 chemical composition was used for source apportionment based on the positive matrix factorization (EPA-PMF5.0) receptor model that uses the Multilinear Engine (ME-2). This is widely used in scientific literature to evaluate the contribution of specific sources to atmospheric aerosol [53,54,55]. Concentrations and uncertainties from the chemical analysis were used directly as input to PMF. The input variables were classified using the signal-to-noise (S/N) criteria and also considering the percentage of data above the detection limit as a complementary criterion [56,57,58]. The species OC, EC, NH4+, K+, DMA (dimethylamine), Mg2+, Ca2+, Cl, NO3, Mn, and Ni were classified as strong variables; the species Na+, SO42−, Oxa, Al, Cr, Fe, Co, Zn, Pb, and Tl were classified as weak variables and, consequently, the model uses these variables with tripled uncertainties. The PM2.5 was categorized as “total variable”. The final dimension of the input matrix was [48 × 22] and it respects the limits defined by Henry et al. [59], where the minimum required number of samples in order to obtain a statistically stable factor analysis is:
N > 30 + 0.5 × (S + 3)
where S is the number of species considered.
Two PMF5 runs were done, the first without using DTTV in the input dataset (this run is referred throughout the paper as “without DTTV”) and the second including DTTV (in nmol/min·m3) and its uncertainty among the model input variables (this run is referred throughout the paper as “with DTTV”). In both cases, the uncertainties on the factor profiles and on source contributions were obtained using the bootstrap method [60].
After the PMF study, a MLR analysis was also performed. The multi-linear regression analysis has been performed between the daily contributions of the sources identified by the PMF (using the dataset without DTTV) and the daily measured DTTV values (as the dependent variable), in order to have an independent estimate of the source contributions to OP. The MLR has been performed using the XLSTAT tool and imposing the intercept equal to zero.

3. Results and Discussion

3.1. PM2.5 and Chemical Species

The median and average concentrations of PM2.5 and of the different chemical species are reported in Table 1 together with their standard deviations and inter-quartile ranges (IQR between 25th and 75th percentiles).
The average concentration of PM2.5 was 16.3 µg/m3 and the chemical species analysed explain, on average, 75.0% of PM2.5 mass. The carbonaceous material (OC + EC) represents 33.8% (29.5% OC and 4.3% EC); water-soluble ions represent 32.4%, and analysed metals about 8.8%.
An analysis of the Pearson correlation coefficients among the different chemical species could give information regarding possible aerosol sources. In order to investigate the secondary inorganic aerosol in PM2.5, the correlation between the species NH4+, NO3, and SO42− has been studied. However, the concentration of ammonium is not sufficient to fully neutralise nitrate and sulphate, calcium nitrate and/or sulphate are likely present. Calcium sulphate can be partly due to the advection of Saharan dust, observed in some specific days, which can lead to an increase of this compound in PM2.5 [55]. In Figure 2a the correlation between the sum of NH4+ and Ca2+ concentrations and the sum of NO3 and SO42− concentrations in PM2.5 was reported. The two-time series are well correlated (Pearson 0.97, p < 0.05) and Figure 2a shows that that secondary inorganic aerosol contributes significantly to the PM2.5 concentrations especially in days with high aerosol loads.
Figure 2b shows the correlation of the time series of organic carbon (OC) and of K+ concentrations. K+ is a good tracer of biomass burning emissions [57,61,62]. Considering the good correlation between this two species (Pearson 0.87, p < 0.05), especially at high loads of PM2.5, it is possible to assume, in the study area, the presence of biomass burning sources contributing to the PM2.5 and a large fraction of OC could be attributed to biomass burning. This hypothesis is confirmed by the high correlation between OC and EC concentrations (R2 = 0.97, p < 0.05) and the high values for OC/EC (7.1, standard deviation 1.5). Values between 5 and 12 are typically observed for biomass combustion but lower values are expected for traffic emissions [63].
A good correlation was observed between the concentrations of Na+ and Cl (Pearson 0.91, p < 0.05) and between Na+ and Mg2+ (Pearson 0.71, p < 0.05) which indicates the presence of a contribution of marine aerosol in PM2.5, in agreement with the proximity of the measurement site to the coast (about 15 km) and with the fact that, during the sampling periods, different events of Saharan dust transport were observed, using the back-trajectories of air masses evaluated with Hysplit (http://arl.noaa.gov/ready/) and the simulations of the Dust REgional Atmospheric Model (BSC-DREAM8b, https://ess.bsc.es/bsc-dust-daily-forecast) (not reported here), which are generally associated with transport of marine aerosol in Southern Italy [64].
A correlation was observed between the crustal elements Mn with Fe (Pearson 0.70, p < 0.05), and Al (Pearson 0.65, p < 0.05), suggesting the presence of a crustal contribution that, although usually more relevant in PM10, can also contribute to PM2.5 [57,65].
A correlation between Ni and Cr was observed (Pearson 0.79, p < 0.05), indicating a probable common source of anthropic origin (potentially of industrial origin).

3.2. Oxidative Potential and Correlation with Chemical Composition

In Table 2 the DTTV (nmol/min·m3) and DTTM (pmol/min·µg) levels detected at Sarno are shown, together with other values obtained from other studies focused on the PM2.5 fraction. The average level for DTTV is comparable or slightly lower than the levels observed in other northern Italian cities and that those observed in PM2.5 at the Environmental-Climate Observatory of Lecce. It is also shown that the average obtained value for DTTV and DTTM is in average lower or comparable to the ranges of the OP detected for PM2.5 collected in different sites of Europe and America.
The analysis of correlation between DTTM and DTTV with the chemical species (in µg/m3) in PM2.5 showed that DTTM does not have any statistically significant correlation. Instead, DTTV showed a good correlation with carbonaceous components: OC (Pearson 0.63, p < 0.05) and EC (Pearson 0.68, p < 0.05), indicating that combustion sources could contribute the measured OP activity. Other correlations are observed with some ions: NO3 (Pearson 0.65, p < 0.05) and Ca2+ (Pearson 0.63, p < 0.05), indicating that PM of crustal origin or resuspended dust and of secondary origin could contribute to the OP activity. Lower correlations (Pearson~0.5, p < 0.05) have been observed with NH4+, K+, and Pb.

3.3. Source Apportionment Results for PM2.5

The PMF5 allowed us to characterise, as best solution, looking at the physical interpretation of results and at the stability running bootstrap, six sources contributing to PM2.5. The scaled residuals were symmetrically distributed for almost all variables, meaning that the model was able to reasonably fit each chemical species. The sources found are: secondary sulphate; biomass burning; industrial emissions; crustal; traffic and secondary nitrate; sea spray. The final solution was obtained by applying a constraint (constrained solution) to the base profile, in order to optimize the starting solution (base solution). The constraint was applied to the “vehicular traffic and secondary nitrate” profile, setting the ratio: OC/EC = 2.3, obtained as the average value of the OC/EC ratios calculated on the traffic profiles present in the European database SPECIEUROPE DATABASE 2.0 (http://source-apportionment.jrc.ec.europa.eu/Specieurope/index.aspx). The constraint had the objective of improving the separation of the contributions related to the sources “vehicular traffic and secondary nitrate” and “biomass burning” that could present a certain level of collinearity and therefore the use of these constraints helped to separate the two sources [58]. The final dQ variation compared to the solution base was limited to 0.4%. The bootstrap of the constrained solution (applied with 100 runs with random seed and R = 0.6) gave a good mapping of the PMF5 solution with unmapped cases limited to 1% (for industrial source profile). The swap between the profiles was 18% and 10% respectively for “traffic and secondary nitrate” and for “secondary sulphate” source profiles, while were ≤2% for the other source profiles. The analysis of G-space plot performed for both the base and the constrained solutions revealed that no edges were evident suggesting that the factors found were linearly independent. Successively, a second PMF run was done including the DTTV among the input variable.
In Figure 3, the source chemical profiles obtained by input dataset “with DTTV” and “without DTTV” are compared while in Figure 4 the source contributions are compared. Figures show that the introduction of DTTV as input variable in PMF produces little changes in the profiles and almost no changes in estimated contribution to PM2.5 considering the uncertainties.
Particularly, the contribution of the sources identified by the PMF model using dataset “without DTTV”, expressed both in absolute concentrations (µg/m3) and relative (% of measured PM2.5), showed that the biomass burning contribution is the predominant one, representing about 32.8% (±1.4%) of PM2.5, followed by secondary sulphate (19.7 ± 2.4%) and nitrate and vehicular traffic (17.0 ± 3.9%). The industrial (primary) contribution represents 5.4% (±2.3%) of PM2.5. Finally, the contributions of natural origin vary between 12.9% (±2.3%) for the sea spray (aged) up to 14.7 (±2.1%) for the crustal contribution.

3.4. MLR Analsysis

In order to estimate the contributions of the PM sources to the OP (in terms of DTTV) and also to validate our results previously obtained with PMF5, we used a multi-linear regression, assuming that the OP is linearly linked to the PM2.5 due to the different sources, according to the formula [35]:
DTTV = mPM × β + ε
where DTTV is the dependent variable, i.e., a matrix (n × 1) in nmol/min·m3, mPM the (n × p) matrix with the PM contributions attributed to each source by PMF “without DTTV” in µg/m3, and ε the (n × 1) uncertainty matrix in nmol/min·m3. Finally, n is the number of samples and p the number of sources. The estimator β matrix (p × 1) represents the slopes, expressed in nmol/min·µg.
The results of PMF “without DTTV”-MLR approach (for simplicity, named MLR in this section) are characterised by an R2 = 0.90 (R2 correct = 0.88) and a MSE (mean standard error) equal to 0.05. These results, together with the F-test results (at 95% a confidence level) indicated that the model gave a good fit of the variables considered.
In Table 3, the results of MLR analysis, in terms of coefficients of β, standard error, P-values and 95% confidence intervals, are reported. Considering the p-value (with α = 0.05) shown for each source investigated, it has been noted that the model gave a good fit for all sources except for secondary sulphate which has a p-value > α. This finding is in agreement with other works [8,34], where ammonium sulphate source gave an insignificant contribution to DTTV. For this reason and according with what has been done in other works [34,43,46], the MLR analysis has been performed again excluding this factor and maintaining only statistically significant sources.
In Figure 5 the measured and reconstructed daily DTTV values obtained with the two approaches (directly by PMF results and using MLR analysis) are compared. The measured and reconstructed data are highly correlated for the PMF “with DTTV” approach with a slope comparable to one and negligible intercept. The comparison of measured and reconstructed DTT activity using MLR also shows a good correlation but with larger scatter on the data comparable to what has been observed also in other works using MLR approach [8,21,39].
Figure 6 compares the contributions, in absolute and relative terms, of the different sources to DTTV obtained with PMF “with DTTV” and MLR approaches. Both approaches indicate negligible contribution of secondary sulphate to the DTTV activity. There are some differences among the results of the two approaches, mainly in combustion sources (i.e., biomass burning, industrial, and traffic emissions); however, these differences are comparable to the differences in average source contributions to DTT activity estimated using different receptor models [34,36]. Despite these differences, both approaches give a similar trend with large contributions to DTTV due to biomass burning as found in other research works [8,34,36,43,46]. The other combustion sources, that are vehicle traffic and secondary nitrate and industrial emission (the latter larger in MLR results), also contributes significantly to the DTTV activity. In MLR results, crustal source contributes significantly to DTTV, confirming the correlation observed for DTTV and Ca2+. Contrarily, PMF “with DTTV” showed limited crustal contributions to DTTV, in agreement with the results of a MLR study reported in literature [46] and with a previous study which highlighted as the crustal matter is characterized by a lower specific OP [30]. Another difference between PMF “with DTTV” and MLR results is for marine contribution that is negligible for the former, contrarily to MLR that showed a certain contribution to the DTTV activity. In general terms, the contributions to DTTV and PM2.5 are not correlated in the same way for all sources: the industrial factor gives the smallest contribution to PM2.5 but has a contribution to DTTV that is greater than that of secondary sulphate, which has a larger contribution to PM2.5.
Figure 7 shows the time series of source contributions to PM2.5 (a) and to DTTV (b) activity using the PMF “with DTTV” approach. Despite the large daily variability, there is a general considerable contribution coming from combustion sources, i.e., biomass burning and traffic emissions, followed by industrial emission. Further, the DTTV time series is well correlated with the PM2.5 time series showing simultaneous peaks during the measurement period.

4. Conclusions

A study of the contribution of PM2.5 sources to the OP evaluated using the DTT assay in an industrial site located near a biogas production and combustion plant is reported. Two approaches are used and compared: the first is to include DTTV in the input of the receptor model EPA PMF5 and the second is to use a multi-linear regression (MLR) for estimating the source contributions to OP. The main conclusions of this study are summarized as follows:
  • During the measurement period the average concentration of PM2.5 was 16.3 µg/m3. The carbonaceous material represents 33.8%; water-soluble ions represent a total of 32.4%, and the analysed metals represent about 8.8% of PM2.5.
  • The correlations between some of the chemical species investigated indicate possible contributions to the PM2.5 concentrations from biomass burning; marine aerosol; crustal and industrial sources.
  • The DTTV and DTTM levels detected at Sarno are comparable or slightly lower than the levels observed for PM2.5 in other Italian, European, and USA cities.
  • The DTTV showed a good correlation with carbonaceous components as possible origin of the source combustion processes. Other correlations were observed with NO3, Ca2+, and, to a lower extent NH4+, K+, and Pb.
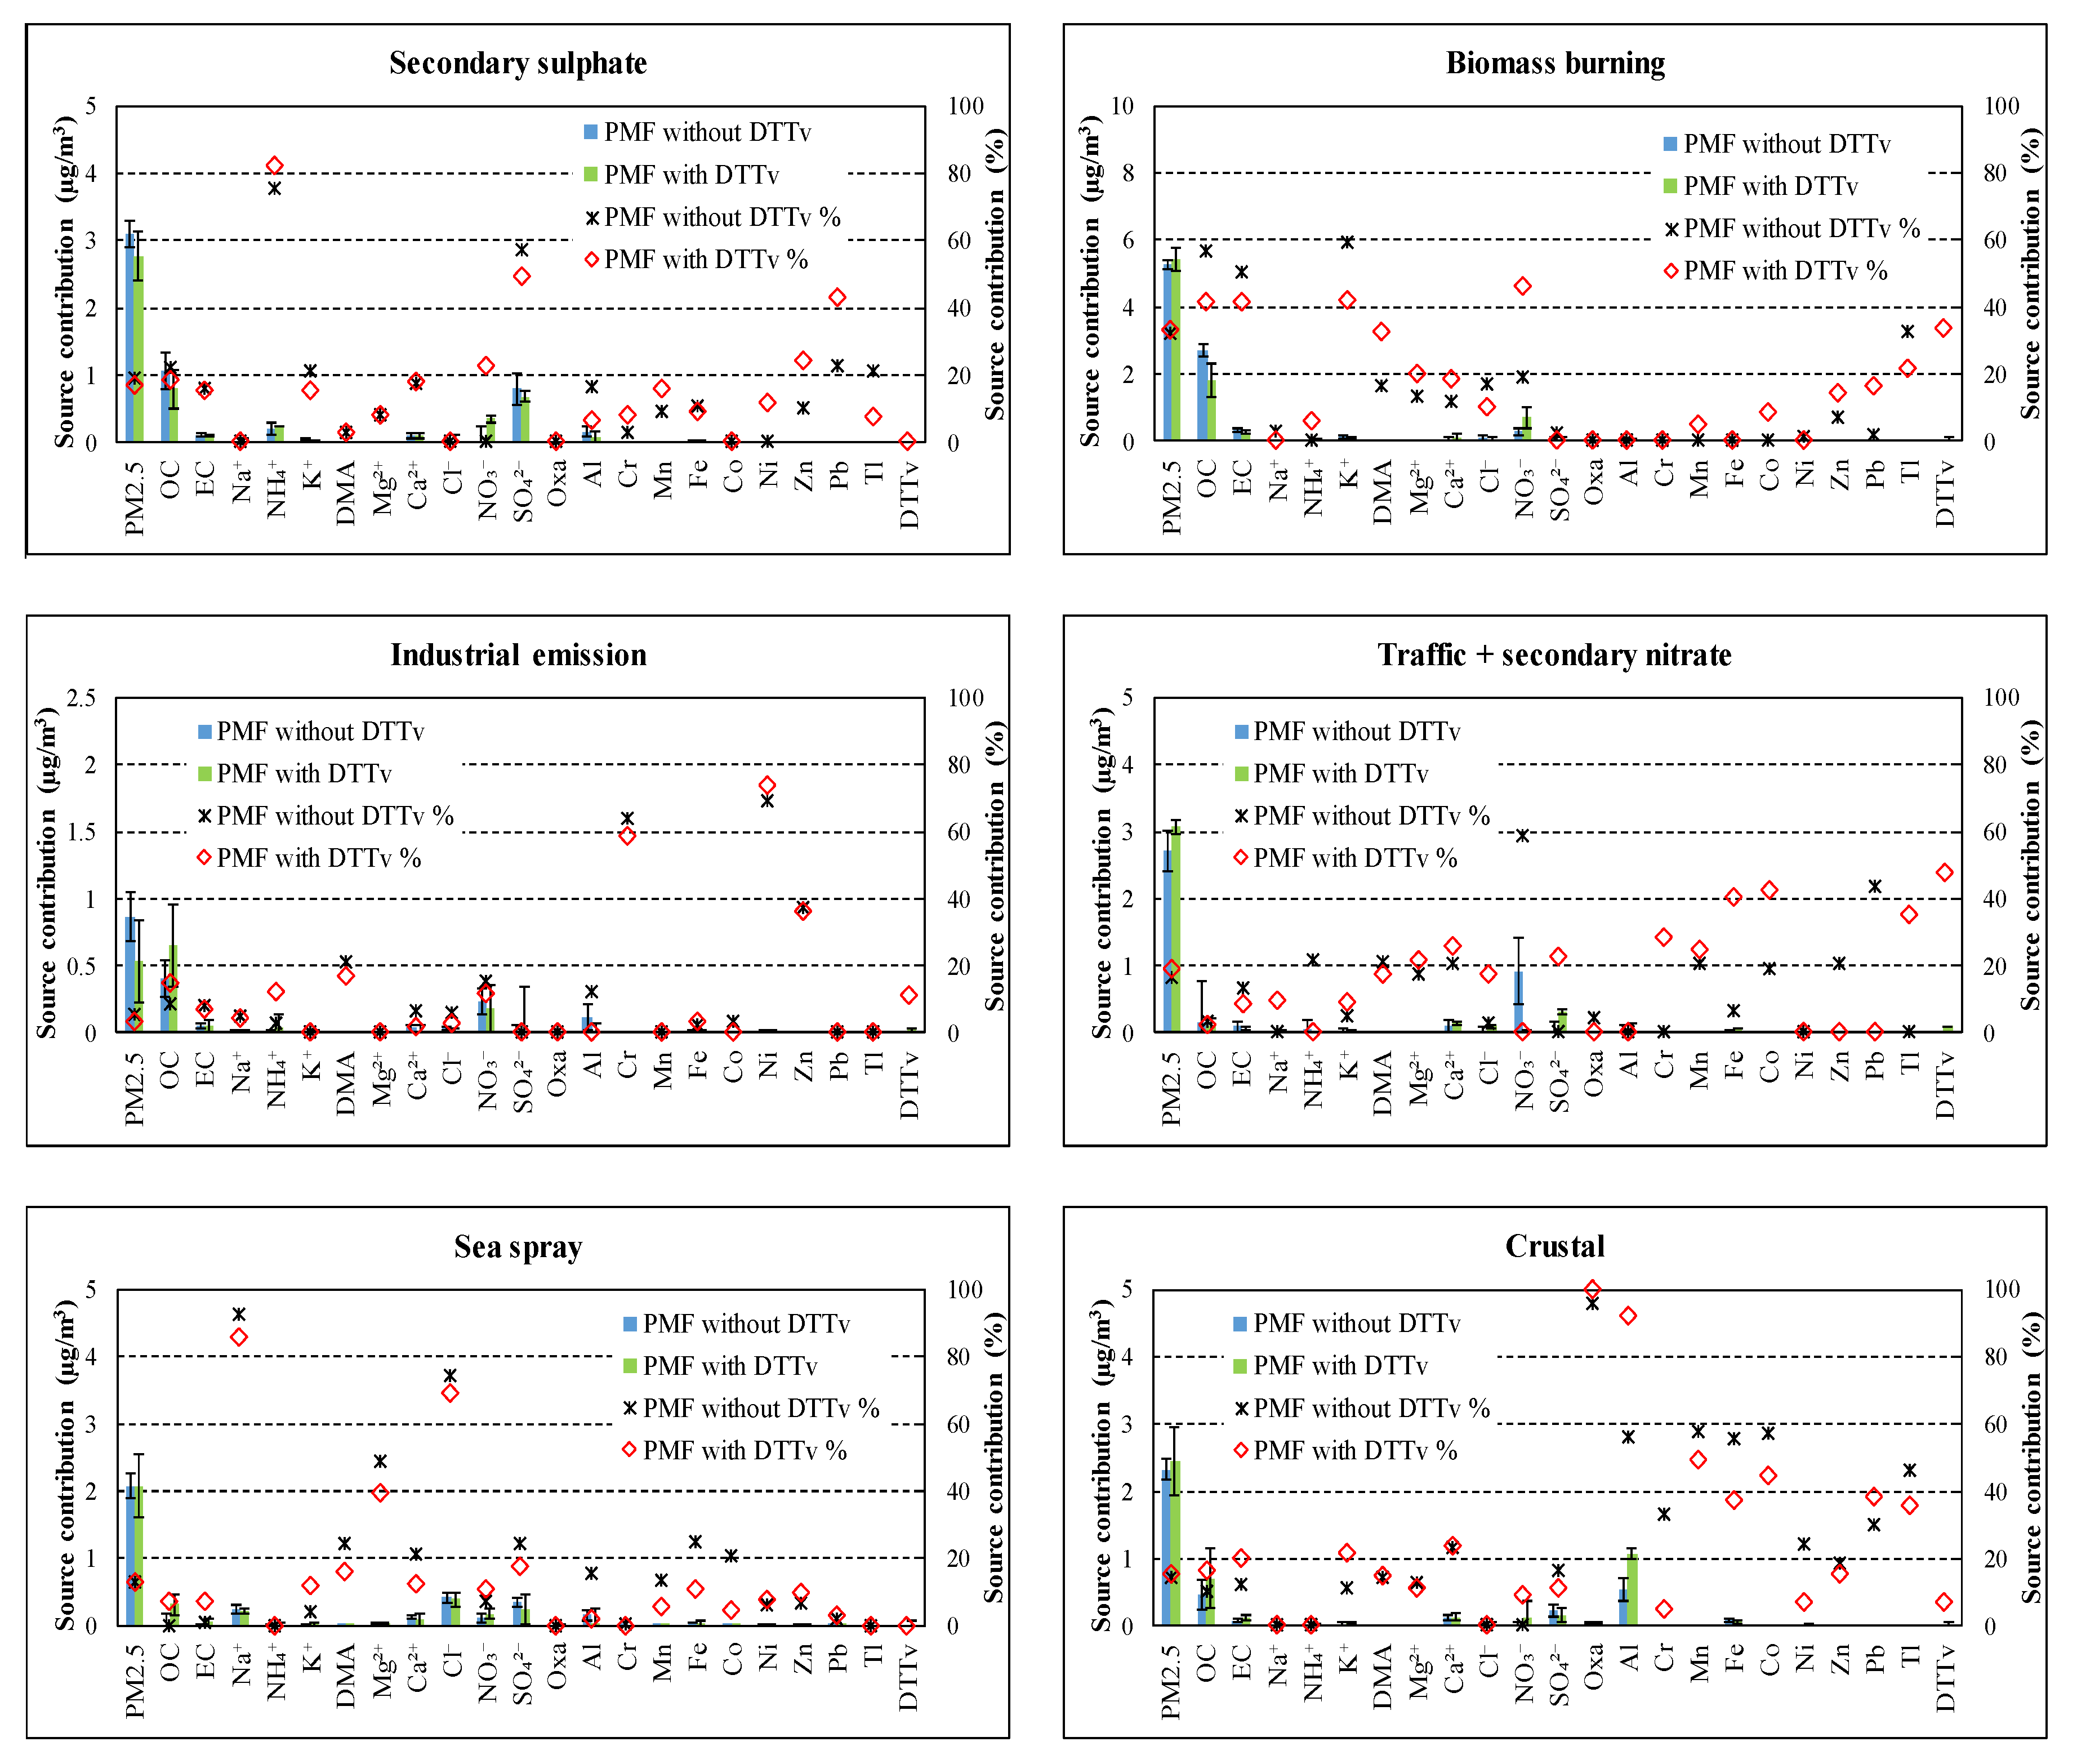
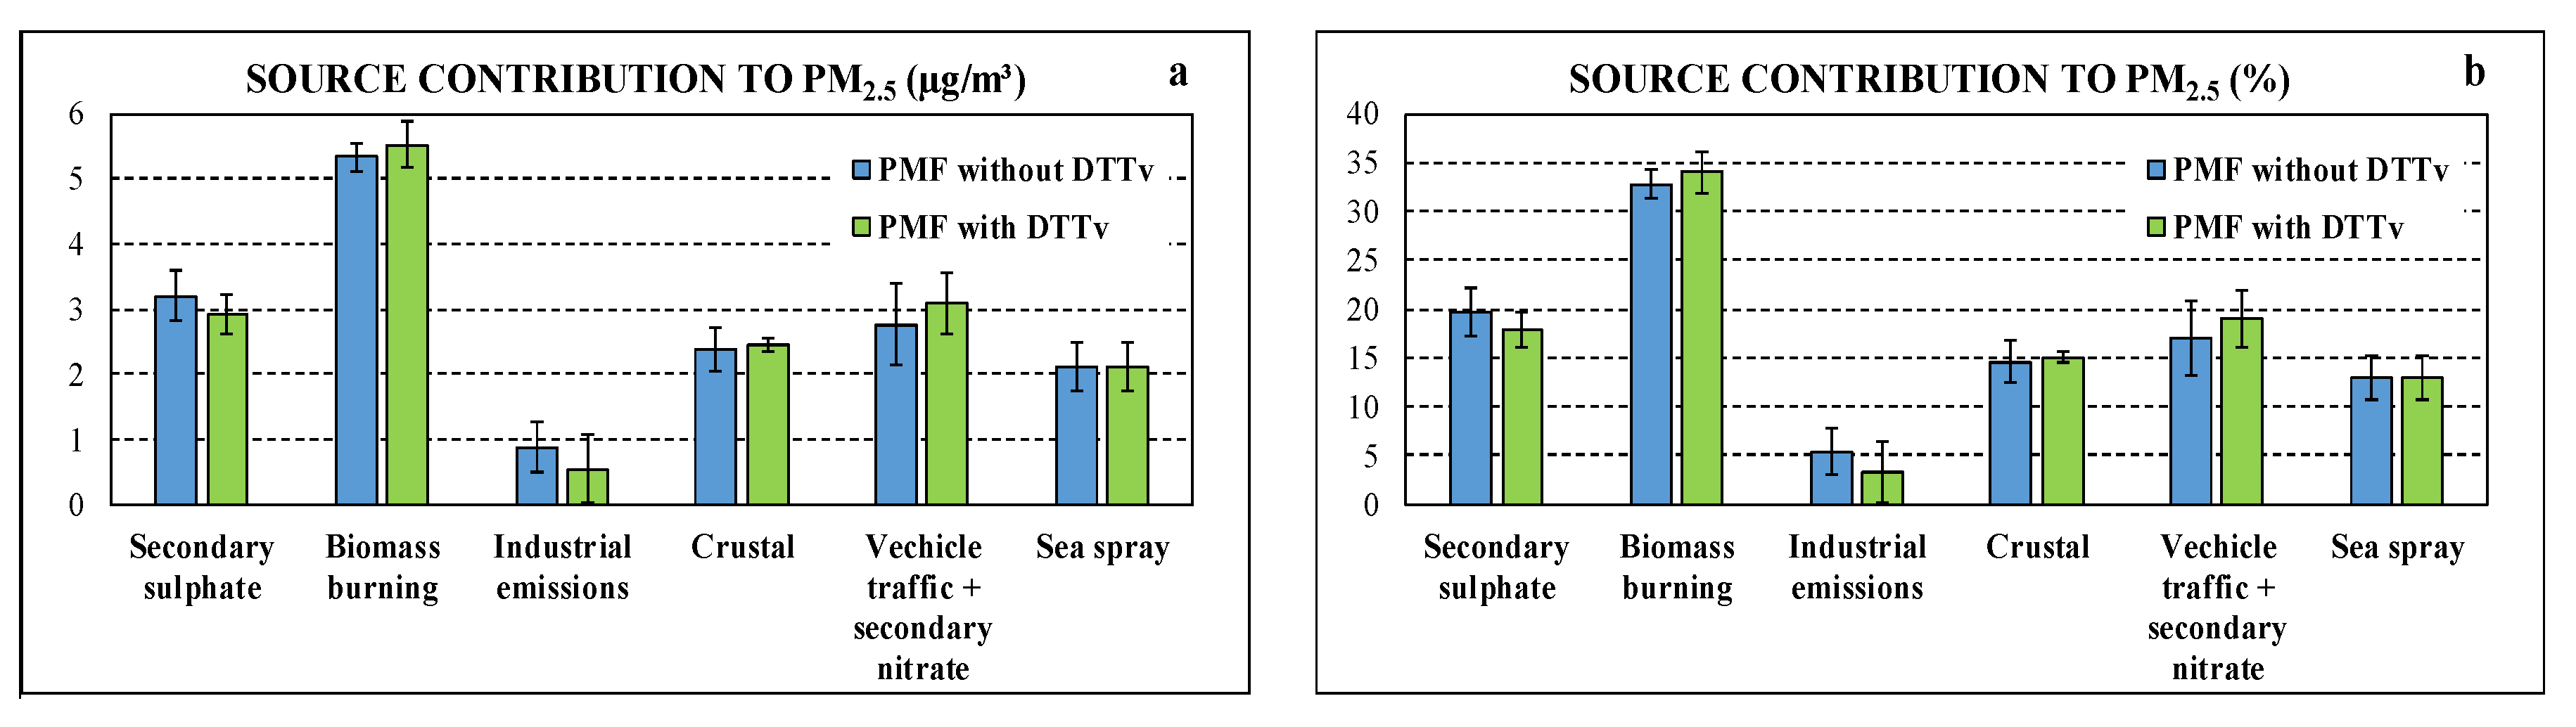
  • The PMF5 model identified six sources contributing to PM2.5: biomass burning, 32.8 ± 1.4%; secondary sulphate, 19.7 ± 2.4%; vehicle traffic and secondary nitrate, 17.0 ± 3.9%; crustal, 14.7 ± 2.1%; sea spray, 12.9 ± 2.3%; and industrial (primary) emissions, 5.4 ± 2.3%. Introducing the DTTV as input variable does not change significantly these results.
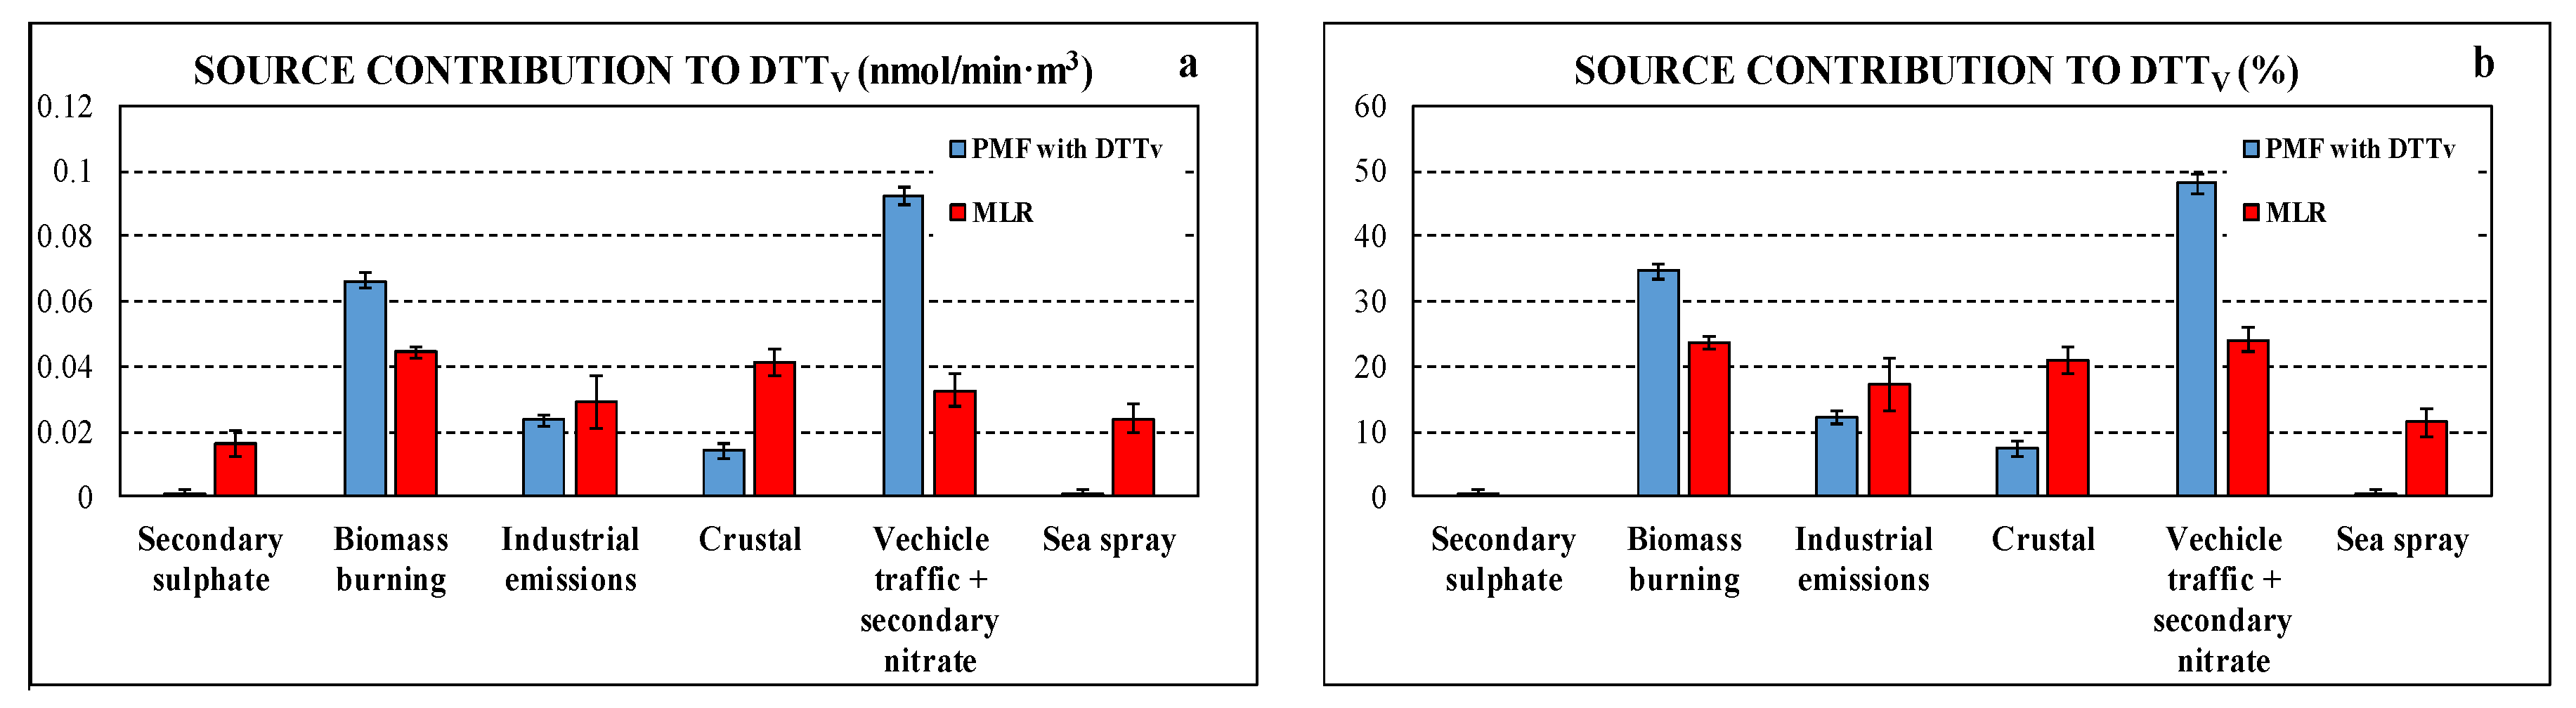
  • Contributions of sources to DTTV were estimated using two independent approaches: a MLR analysis performed between measured DTTV and output of the PMF; a PMF run including DTTV in the input variables. The two approaches gave a similar trend with negligible contribution of sulphate and larger contributions of combustion sources: biomass burning and road traffic. Major differences were observed for crustal and marine sources that are larger using MLR.
  • Comparison of daily DTTV reconstruction with the two approaches shows a better agreement with a lower scattering in the data with the PMF “with DTTV” approach compared to MLR.
  • In general, the contributions to DTTV and PM2.5 are not correlated for all sources: The industrial factor has the smallest contribution to PM2.5 but shows a contribution to DTTV that is greater than that of secondary sulphate which has a larger contribution to PM2.5 and a negligible contribution to DTTV.
These results provide further evidences that combustion sources (biomass burning and traffic emissions) are the major contributors to the OPDTT activity of PM. At the site analysed, the PMF seems to show a good ability, even better than using external MLR approach, in investigating the contribution of the PM sources on the OP activity, despite the differences in the units of measurement of the variables considered (OP activity and chemical species); however, further investigations are needed in different conditions to confirm this result.

Author Contributions

Conceptualization, D.C. (Daniele Contini), and F.B.; methodology, D.C. (Daniela Cesari), P.D.N., S.D., and A.G.; data collection, D.C. (Daniela Cesari), F.M.G., and E.M.; chemical analysis E.M., F.M., F.V., and M.R.; writing—original draft preparation, D.C. (Daniela Cesari); writing—review and editing, all authors.

Funding

The authors gratefully acknowledge that this research was funded by the Sarno Municipality, grant number 4614.

Acknowledgments

Authors wish to thank Mr. Antonio Sorrentino for hosting our instruments in his property.

Conflicts of Interest

The authors declare no conflict of interest.

References

  1. Delfino, R.J.; Staimer, N.; Tjoa, T.; Gillen, D.L.; Schauer, J.J.; Shafer, M.M. Airway inflammation and oxidative potential of air pollutant particles in a pediatric asthma panel. J. Expo. Sci. Environ. Epidemiol. 2013, 23, 466–473. [Google Scholar] [CrossRef] [PubMed]
  2. Dockery, D.W.; Pope, C.A. Acute respiratory effects of particulate air pollution. Annu. Rev. Public Health 1994, 15, 107–132. [Google Scholar] [CrossRef] [PubMed]
  3. Ostro, B.; Broadwin, R.; Green, S.; Feng, W.Y.; Lipsett, M. Fine particulate air pollution and mortality in nine California counties: Results from CALFINE. Environ. Health Perspect. 2006, 114, 29–33. [Google Scholar] [CrossRef] [PubMed]
  4. Li, N.; Sioutas, C.; Cho, A.; Schmitz, D.; Misra, C.; Sempf, J.; Wang, M.; Oberley, T.; Froines, J.; Nel, A. Ultrafine particulate pollutants induce oxidative stress and mitochondrial damage. Environ. Health Perspect. 2003, 111, 455–460. [Google Scholar] [CrossRef] [PubMed]
  5. Li, N.; Wang, M.; Bramble, L.A.; Schmitz, D.A.; Schauer, J.J.; Sioutas, C.; Harkema, J.R.; Nel, A.E. The adjuvant effect of ambient particulate matter is closely reflected by the particulate oxidant potential. Environ. Health Perspect. 2009, 117, 1116–1123. [Google Scholar] [CrossRef] [PubMed]
  6. Ayres, J.G.; Borm, P.; Cassee, F.R.; Castranova, V.; Donaldson, K.; Ghio, A.; Harrison, R.M.; Hider, R.; Kelly, F.; Kooter, I.M.; et al. Evaluating the Toxicity of Airborne Particulate Matter and Nanoparticles by Measuring Oxidative Stress Potential—A Workshop Report and Consensus Statement. Inhal. Toxicol. 2008, 20, 75–99. [Google Scholar] [CrossRef]
  7. Jiang, H.; Jang, M. Dynamic oxidative potential of atmospheric organic aerosol under ambient sunlight. Environ. Sci. Technol. 2018, 52, 7496–7504. [Google Scholar] [CrossRef]
  8. Bates, J.T.; Weber, R.J.; Abrams, J.; Verma, V.; Fang, T.; Klein, M.; Strickland, M.J.; Sarnat, S.E.; Chang, H.H.; Mulholland, J.A.; et al. Reactive oxygen species generation linked to sources of atmospheric particulate matter and cardiorespiratory effects. Environ. Sci. Technol. 2015, 49, 13605–13612. [Google Scholar] [CrossRef]
  9. Verma, V.; Fang, T.; Xu, L.; Peltier, R.E.; Russell, A.G.; Ng, N.L.; Weber, J. Organic aerosols associated with the generation of reactive oxygen species (ROS) by water soluble PM2.5. Environ. Sci. Technol. 2015, 49, 4646–4656. [Google Scholar] [CrossRef]
  10. Landreman, A.P.; Shafer, M.M.; Hemming, J.C.; Hannigan, M.P.; Schauer, J.J. A macrophage-based method for the assessment of the reactive oxygen species (ROS) activity of atmospheric particulate matter (PM) and application to routine (daily-24 h) aerosol monitoring studies. Aerosol Sci. Technol. 2008, 42, 946–957. [Google Scholar] [CrossRef]
  11. Shirmohammadi, F.; Wang, D.B.; Hasheminassab, S.; Verma, V.; Schauer, J.J.; Shafer, M.M.; Sioutas, C. Oxidative potential of on road fine particulate matter (PM2.5) measured on major freeways of Los Angeles, CA, and a 10-year comparison with earlier roadside studies. Atmos. Environ. 2017, 148, 102–114. [Google Scholar] [CrossRef]
  12. Bates, J.T.; Fang, T.; Verma, V.; Zeng, L.; Weber, R.J.; Tolbert, P.E.; Abrams, J.Y.; Sarnat, S.E.; Klein, M.; Mulholland, J.A.; et al. Review of Acellular Assays of Ambient Particulate Matter Oxidative Potential: Methods and Relationships with Composition, Sources, and Health Effects. Environ. Sci. Technol. 2019, 53, 4003–4019. [Google Scholar] [CrossRef] [PubMed]
  13. Cho, A.K.; Sioutas, C.; Miguel, A.H.; Kumagai, Y.; Schmitz, D.A.; Singh, M.; Eiguren-Fernandez, A.; Froines, J.R. Redox activity of airborne particulate matter at different sites in the Los Angeles Basin. Environ. Res. 2005, 99, 40–47. [Google Scholar] [CrossRef] [PubMed]
  14. Wang, D.; Pakbin, P.; Shafer, M.M.; Antkiewicz, D.; Schauer, J.J.; Sioutas, C. Macrophage reactive oxygen species activity of water-soluble and water-insoluble fractions of ambient coarse, PM2.5 and ultrafine particulate matter (PM) in Los Angeles. Atmos. Environ. 2013, 77, 301–310. [Google Scholar] [CrossRef]
  15. Kim, K.H.; Kabir, E.; Kabir, S. A review on the human health impact of airborne particulate matter. Environ. Int. 2015, 74, 136–143. [Google Scholar] [CrossRef]
  16. Bae, M.S.; Schauer, J.J.; Lee, T.; Jeong, J.H.; Kim, Y.K.; Ro, C.U.; Song, S.K.; Shon, Z.H. Relationship between reactive oxygen species and water-soluble organic compounds: Time-resolved benzene carboxylic acids measurement in the coastal area during the KORUS-AQ campaign. Environ. Pollut. 2017, 231, 1–12. [Google Scholar] [CrossRef]
  17. Qi, Z.; Song, Y.; Ding, Q.; Liao, X.; Li, R.; Liu, G.; Tsang, S.; Cai, Z. Water soluble and insoluble components of PM2.5 and their functional cardiotoxicities on neonatal rat cardiomyocytes in vitro. Ecotoxicol. Environ. Saf. 2019, 168, 378–387. [Google Scholar] [CrossRef]
  18. Lyu, Y.; Guo, H.; Cheng, T.; Li, X. Particle size distributions of oxidative potential of lung-deposited particles-assessing contributions from quinones and water-soluble metals. Environ. Sci. Technol. 2018, 52, 6592–6600. [Google Scholar] [CrossRef]
  19. Wang, Y.; Plewa, M.J.; Mukherjee, U.K.; Verma, V. Assessing the cytotoxicity of ambient particulate matter (PM) using Chinese hamster ovary (CHO) cells and its relationship with the PM chemical composition and oxidative potential. Atmos. Environ. 2018, 179, 132–141. [Google Scholar] [CrossRef]
  20. Yang, A.; Janssen, N.A.H.; Brunekreef, B.; Cassee, F.R.; Hoek, G.; Gehring, U. Children’s respiratory health and oxidative potential of PM2.5: The PIAMA birth cohort study. Occup Environ. Med. 2016, 73, 154–160. [Google Scholar] [CrossRef]
  21. Paraskevopoulou, D.; Bougiatioti, A.; Stavroulas, I.; Fang, T.; Lianou, M.; Liakakou, E.; Gerasopoulos, E.; Weber, R.; Nenes, A.; Mihalopoulos, N. Yearlong variability of oxidative potential of particulate matter in an urban Mediterranean environment. Atmos. Environ. 2019, 206, 183–196. [Google Scholar] [CrossRef]
  22. Akhtar, U.S.; McWhinney, R.D.; Rastogi, N.; Abbatt, J.P.D.; Evans, G.J.; Scott, J.A. Cytotoxic and proinflammatory effects of ambient and source-related particulate matter (PM) in relation to the production of reactive oxygen species (ROS) and cytokine adsorption by particles. Inhal. Toxicol. 2010, 22, 37–47. [Google Scholar] [CrossRef] [PubMed]
  23. Charrier, J.G.; Anastasio, C. On dithiothreitol (DTT) as a measure of oxidative potential for ambient particles: Evidence for the importance of soluble transition metals. Atmos. Chem. Phys. 2012, 12, 9321–9333. [Google Scholar] [CrossRef]
  24. Gasser, M.; Riediker, M.; Mueller, L.; Perrenoud, A.; Blank, F.; Gehr, P.; Rothen-Rutishauser, B. Toxic effects of brake wear particles on epithelial lung cells in vitro. Part. Fibre Toxicol. 2009, 6, 30. [Google Scholar] [CrossRef]
  25. Samara, C. On the redox activity of urban aerosol particles: Implications for size distribution and relationships with organic aerosol components. Atmosphere 2017, 8, 205. [Google Scholar] [CrossRef]
  26. Verma, V.; Polidori, A.; Schauer, J.J.; Shafer, M.M.; Cassee, F.R.; Sioutas, C. Physicochemical and Toxicological Profiles of Particulate Matter in Los Angeles during the October 2007 Southern California Wildfires. Environ. Sci. Technol. 2009, 43, 954–960. [Google Scholar] [CrossRef]
  27. Vreeland, H.; Weber, R.; Bergin, M.; Greenwald, R.; Golan, R.; Russell, A.G.; Verma, V.; Sarnat, J.A. Oxidative potential of PM2.5 during Atlanta rush hour: Measurements of in-vehicle dithiothreitol (DTT) activity. Atmos. Environ. 2017, 165, 169–178. [Google Scholar] [CrossRef]
  28. Perrone, M.G.; Zhou, J.; Malandrino, M.; Sangiorgi, G.; Rizzi, C.; Ferrero, L.; Dommen, J.; Bolzacchini, E. PM chemical composition and oxidative potential of the soluble fraction of particles at two sites in the urban area of Milan, Northern Italy. Atmos. Environ. 2016, 128, 104–113. [Google Scholar] [CrossRef]
  29. Kleinman, M.T.; Sioutas, C.; Froines, J.R.; Fanning, E.; Hamade, A.; Mendez, L.; Meacher, D.; Oldham, M. Inhalation of concentrated ambient particulate matter near a heavily trafficked road stimulates antigen induced airway responses in mice. Inhal. Toxicol. 2007, 19, 117–126. [Google Scholar] [CrossRef]
  30. Chirizzi, D.; Cesari, D.; Guascito, M.R.; Dinoi, A.; Giotta, L.; Donateo, A.; Contini, D. Influence of Saharan dust outbreaks and carbon content on oxidative potential of water-soluble fractions of PM2.5 and PM10. Atmos. Environ. 2017, 163, 1–8. [Google Scholar] [CrossRef]
  31. Styszko, K.; Samek, L.; Szramowiat, K.; Korzeniewska, A.; Kubisty, K.; Rakoczy-Lelek, R.; Kistler, M.; Giebl, A.K. Oxidative potential of PM10 and PM2.5 collected at high air pollution site related to chemical composition: Krakow case study. Air Qual. Atmos. Health 2017, 10, 1123–1137. [Google Scholar] [CrossRef]
  32. Lundstedt, S.; White, P.A.; Lemieux, C.L.; Lynes, K.D.; Lambert, I.B.; Öberg, L.; Haglund, P.; Tysklind, M. Sources, Fate, and Toxic Hazards of Oxygenated Polycyclic Aromatic Hydrocarbons (PAHs) at PAH-contaminated Sites. AMBIO 2007, 36, 475–485. [Google Scholar] [CrossRef]
  33. Shirmohammadi, F.; Hasheminassab, S.; Wang, D.; Schauer, J.J.; Shafer, M.; Delfino, R.J.; Sioutas, C. The relative importance of tailpipe and nontailpipe emissions on the oxidative potential of ambient particles in Los Angeles, CA. Faraday Discuss. 2016, 89, 361–380. [Google Scholar] [CrossRef] [PubMed] [Green Version]
  34. Fang, T.; Verma, V.; Bates, J.T.; Abrams, J.; Klein, M.; Strickland, M.J.; Sarnat, S.E.; Chang, H.H.; Mulholland, J.A.; Tolbert, P.E.; et al. Oxidative potential of ambient water-soluble PM2.5 in the southeastern United States: Contrasts in sources and health associations between ascorbic acid (AA) and dithiothreitol (DTT) assays. Atmos. Chem. Phys. 2016, 16, 3865–3879. [Google Scholar] [CrossRef] [Green Version]
  35. Weber, S.; Uzu, G.; Calas, A.; Chevrier, F.; Besombes, J.L.; Charron, A.; Salameh, D.; Ježek, I.; Močnik, G.; Jaffrezo, J.L. An apportionment method for the oxidative potential of atmospheric particulate matter sources: Application to a one-year study in Chamonix, France. Atmos. Chem. Phys. 2018, 18, 9617–9629. [Google Scholar] [CrossRef] [Green Version]
  36. Verma, V.; Fang, T.; Guo, H.; King, L.; Bates, J.T.; Peltier, R.E.; Edgerton, E.; Russell, A.G.; Weber, R.J. Reactive oxygen species associated with water-soluble PM2.5 in the southeastern United States: Spatiotemporal trends and source apportionment. Atmos. Chem. Phys. 2014, 14, 12915–12930. [Google Scholar] [CrossRef] [Green Version]
  37. Fang, T.; Guo, H.; Verma, V.; Peltier, R.E.; Weber, R.J. PM2.5 water-soluble elements in the southeastern United States: Automated analytical method development, spatiotemporal distributions, source apportionment, and implications for heath studies. Atmos. Chem. Phys. 2015, 15, 11667–11682. [Google Scholar] [CrossRef] [Green Version]
  38. Lin, M.; Yu, J.Z. Dithiothreitol (DTT) concentration effect and its implications on the applicability of DTT assay to evaluate the oxidative potential of atmospheric aerosol samples. Environ. Pollut. 2019, 251, 938–944. [Google Scholar] [CrossRef]
  39. Pietrogrande, M.C.; Dalpiaz, C.; Dell’Anna, R.; Lazzeri, P.; Manarini, F.; Visentin, M.; Tonidandel, G. Chemical composition and oxidative potential of atmospheric coarse particles at an industrial and urban background site in the alpine region of northern Italy. Atmos. Environ. 2018, 191, 340–350. [Google Scholar] [CrossRef]
  40. Mousavi, A.; Sowlat, M.H.; Hasheminassab, S.; Polidori, A.; Shafer, M.M.; Schauer, J.J.; Sioutas, C. Impact of emissions from the Ports of Los Angeles and Long Beach on the oxidative potential of ambient PM0.25 measured across the Los Angeles County. Sci. Total Environ. 2019, 651, 638–647. [Google Scholar] [CrossRef]
  41. Verma, V.; Ning, Z.; Cho, A.K.; Schauer, J.J.; Shafer, M.M.; Sioutas, C. Redox activity of urban quasi-ultrafine particles from primary and secondary sources. Atmos. Environ. 2009, 43, 6360–6368. [Google Scholar] [CrossRef]
  42. Calas, A.; Uzu, G.; Kelly, F.J.; Houdier, S.; Martins, J.M.F.; Thomas, F.; Molton, F.; Charron, A.; Dunster, C.; Oliete, A.; et al. Comparison between five cellular oxidative potential measuments assays performed with detailed chemistry on PM10 samples from the city of Chamonix (France). Atmos. Chem. Phys. 2018, 18, 7863–7875. [Google Scholar] [CrossRef] [Green Version]
  43. Argyropoulos, G.; Besis, A.; Voutsa, D.; Samara, C.; Sowlat, M.H.; Hasheminassab, S.; Sioutas, C. Source apportionment of redox activity of urban quasi-ultrafine particles (PM0.49) in Thessaloniki following the increased biomass burning due to the economic crisis in Greece. Sci. Total Environ. 2016, 568, 124–136. [Google Scholar] [CrossRef] [PubMed]
  44. Park, J.; Park, E.H.; Schauer, J.J.; Yi, S.M.; Heo, J. Reactive oxygen species (ROS) activity of ambient fine particles (PM2.5) measured in Seoul, Korea. Environ. Int. 2018, 117, 276–283. [Google Scholar] [CrossRef]
  45. Saffari, A.; Hasheminassab, S.; Wang, D.; Shafer, M.M.; Schauer, J.J.; Sioutas, C. Impact of primary and secondary organic sources on the oxidative potential of quasi-ultrafine particles (PM0.25) at three contrasting locations in the Los Angeles Basin. Atmos. Environ. 2015, 120, 286–296. [Google Scholar] [CrossRef]
  46. Liu, W.; Xu, Y.; Liu, W.; Liu, Q.; Yu, S.; Liu, Y.; Wang, X.; Tao, S. Oxidative potential of ambient PM2.5 in the coastal cities of the Bohai Sea, northern China: Seasonal variation and source apportionment. Environ. Pollut. 2018, 236, 514–528. [Google Scholar] [CrossRef]
  47. Liu, Q.; Baumgartner, J.; Zhang, Y.; Liu, Y.; Sun, Y.; Zhang, M. Oxidative potential and inflammatory impacts of source apportioned ambient air pollution in Beijing. Environ. Sci. Technol. 2014, 48, 12920–12929. [Google Scholar] [CrossRef]
  48. Contini, D.; Cesari, D.; Conte, M.; Donateo, A. Application of PMF and CMB receptor models for the evaluation of the contribution of a large coal-fired power plant to PM10 concentrations. Sci. Total Environ. 2016, 560–561, 131–140. [Google Scholar] [CrossRef]
  49. Conte, M.; Merico, E.; Cesari, D.; Dinoi, A.; Grasso, F.M.; Donateo, A.; Guascito, M.R.; Contini, D. Long-term characterisation of African dust advection in south-eastern Italy: Influence on fine and coarse particle concentrations, size distributions, and carbon content. Atmos. Res. 2020, 233, 10469–10490. [Google Scholar] [CrossRef]
  50. Cavalli, F.; Viana, M.; Yttri, K.E.; Genberg, J.; Putaud, J.P. Toward a standardised thermal-optical protocol for measuring atmospheric organic and elemental carbon: The EUSAAR protocol. Atmos. Meas. Tech. 2010, 3, 79–89. [Google Scholar] [CrossRef] [Green Version]
  51. Merico, E.; Cesari, D.; Dinoi, A.; Gambaro, A.; Barbaro, E.; Guascito, M.R.; Giannossa, L.C.; Mangone, A.; Contini, D. Inter-comparison of carbon content in PM 10 and PM 2.5 measured with two thermo-optical protocols on samples collected in a Mediterranean site. Environ. Sci. Pollut. Res. 2019. [Google Scholar] [CrossRef] [PubMed]
  52. Fang, T.; Verma, V.; Guo, H.; King, L.E.; Edgerton, E.S.; Weber, R.J. A semi-automated system for quantifying the oxidative potential of ambient particles in aqueous extracts using the dithiothreitol (DTT) assay: Results from the Southeastern Center for Air Pollution and Epidemiology (SCAPE). Atmos. Meas. Tech. 2005, 8, 471–482. [Google Scholar] [CrossRef] [Green Version]
  53. Viana, M.; Kuhlbusch, T.A.J.; Querol, X.; Alastuey, A.; Harrison, R.M.; Hopke, P.K.; Winiwarte, W.; Vallius, M.; Szidat, S.; Prévôt, A.S.H.; et al. Source apportionment of particulate matter in Europe: A review of methods and results. J. Aerosol Sci. 2008, 39, 827–849. [Google Scholar] [CrossRef]
  54. Belis, C.A.; Karagulian, F.; Amato, F.; Almeida, M.; Artaxo, P.; Beddows, D.C.S.; Bernardoni, V.; Bove, M.C.; Carbone, S.; Cesari, D.; et al. A new methodology to assess the performance and uncertainty of source apportionment models II: The results of two European intercomparison exercises. Atmos. Environ. 2015, 123, 240–250. [Google Scholar] [CrossRef]
  55. Cesari, D.; Donateo, A.; Conte, M.; Merico, E.; Giangreco, A.; Giangreco, F.; Contini, D. An inter-comparison of PM2.5 at urban and urban background sites: Chemical characterization and source apportionment. Atmos. Res. 2016, 174, 106–119. [Google Scholar] [CrossRef]
  56. Amato, F.; Alastuey, A.; Karanasiou, A.; Lucarelli, F.; Nava, S.; Calzolai, G.; Severi, M.; Becagli, S.; Gianelle, V.L.; Colombi, C.; et al. AIRUSE443 LIFE+: A harmonized PM speciation and source apportionment in five southern European cities. Atmos. Chem. Phys. 2016, 16, 3289–3309. [Google Scholar] [CrossRef] [Green Version]
  57. Cesari, D.; De Benedetto, G.E.; Bonasoni, P.; Busetto, M.; Dinoi, A.; Merico, E.; Chirizzi, D.; Cristofanelli, P.; Donateo, A.; Grasso, F.M.; et al. Seasonal variability of PM2.5 and PM10 composition and sources in an urban background site in Southern Italy. Sci. Total Environ. 2018, 612, 202–213. [Google Scholar] [CrossRef]
  58. Cesari, D.; Donateo, A.; Conte, M.; Contini, D. Inter-comparison of source apportionment of PM10 using PMF and CMB in three sites nearby an industrial area in central Italy. Atmos. Res. 2016, 182, 282–293. [Google Scholar] [CrossRef]
  59. Henry, R.C.; Lewis, C.W.; Hopke, P.K.; Williamson, H.J. Review of receptor model fundamentals. Atmos. Environ. 1984, 18, 1507–1515. [Google Scholar] [CrossRef]
  60. Paatero, P.; Eberly, S.; Brown, S.G.; Norris, G.A. Methods for estimating uncertainty in factor analytic solutions. Atmos. Meas. Tech. 2014, 7, 781–797. [Google Scholar] [CrossRef] [Green Version]
  61. Sandrini, S.; Fuzzi, S.; Piazzalunga, A.; Prati, P.; Bonasoni, P.; Cavalli, F.; Bove, M.C.; Calvello, M.; Cappelletti, D.; Colombi, C.; et al. Spatial and seasonal variability of carbonaceous aerosol across Italy. Atmos. Environ. 2014, 99, 587–598. [Google Scholar] [CrossRef]
  62. Salameh, D.; Detournay, A.; Pey, J.; Pérez, N.; Liguori, F.; Saraga, D.; Bove, M.C.; Brotto, P.; Cassola, F.; Massabò, D.; et al. PM2.5 chemical composition in five European Mediterranean cities: A 1-year study. Atmos. Res. 2015, 155, 102–117. [Google Scholar] [CrossRef]
  63. Szidat, S.; Jenk, T.M.; Synal, H.A.; Kalberer, M.; Wacker, L.; Hajdas, I.; Kasper-Giebl, A.; Baltensperger, U. Contributions of fossil fuel, biomass-burning, and biogenic emissions to carbonaceous aerosols in Zurich as traced by 14C. J. Geophys. Res. Atmos. 2006, 111, 1–12. [Google Scholar] [CrossRef] [Green Version]
  64. Contini, D.; Cesari, D.; Genga, A.; Siciliano, M.; Ielpo, P.; Guascito, M.R.; Conte, M. Source apportionment of size-segregated atmospheric particles based on the major water-soluble components in Lecce (Italy). Sci. Total Environ. 2014, 472, 248–261. [Google Scholar] [CrossRef]
  65. Contini, D.; Cesari, D.; Donateo, A.; Chirizzi, D.; Belosi, F. Characterization of PM10 and PM2.5 and Their Metals Content in Different Typologies of Sites in South-Eastern Italy. Atmosphere 2014, 5, 435–453. [Google Scholar] [CrossRef] [Green Version]
  66. Visentin, M.; Pagnoni, A.; Sarti, E.; Pietrogrande, M.C. Urban PM2.5 oxidative potential: Importance of chemical species and comparison of two spectrophotometric cell-free assays. Environ. Pollut. 2016, 219, 72–79. [Google Scholar] [CrossRef]
  67. Janssen, N.A.H.; Yang, A.; Strak, M.; Steenhof, M.; Hellack, B.; Gerlofs-Nijland, M.E.; Kuhlbuschc, T.; Kellyd, F.; Harrisone, R.; Brunekreefb, B.; et al. Oxidative potential of particulate matter collected at sites with different source characteristics. Sci. Total Environ. 2014, 472, 572–581. [Google Scholar] [CrossRef] [Green Version]
  68. Chan, J.K.; Charrier, J.G.; Kodani, S.D.; Vogel, C.F.; Kado, S.Y.; Anderson, D.S.; Anastasio, C.; Van Winkle, L.S. Combustion-derived flame generated ultrafine soot generates reactive oxygen species and activates Nrf2 antioxidants differently in neonatal and adult rat lungs. Part. Fibre Toxicol. 2013, 10, 34. [Google Scholar] [CrossRef] [Green Version]
  69. Jedynska, A.; Hoek, G.; Wang, M.; Yang, A.; Eeftens, M.; Cyrys, J.; Keuken, M.; Ampe, C.; Beelen, R.; Cesaroni, G.; et al. Spatial variations and development of land use regression models of oxidative potential in ten European study areas. Atmos. Environ. 2017, 150, 24–32. [Google Scholar] [CrossRef] [Green Version]
Figure 1. Map of the municipality of Sarno and indications of the location of the measurement site.
Atmosphere 10 00758 g001
Figure 2. (a) Comparison of the daily sum of the NH4+ and Ca2+ concentrations and the sum of NO3 and SO42 in PM2.5. (b) Comparison daily concentrations of OC and K+ in PM2.5.
Atmosphere 10 00758 g002
Figure 3. Comparison of source chemical profiles obtained by datasets “with DTTV” and “without DTTV”.
Atmosphere 10 00758 g003
Figure 4. Comparison of source contributions obtained by datasets “with DTTV” and “without DTTV” in absolute (a) and relative (b) terms.
Atmosphere 10 00758 g004
Figure 5. (a) PMF reconstructed vs. measured oxidative potential (OP) of fine aerosol; (b) MLR reconstructed vs. measured OP of fine aerosol; (c) PMF reconstructed OP vs. MLR reconstructed OP.
Atmosphere 10 00758 g005
Figure 6. Comparison of source contributions to DTTV obtained using the two approaches, PMF with DTTV and MLR in absolute (a) and relative (b) terms.
Atmosphere 10 00758 g006
Figure 7. Time series of source contributions to PM2.5 (a) and to DTTV (b) activity obtained by PMF “with DTTV” approach. The figure includes measured PM2.5 concentrations (black marks).
Atmosphere 10 00758 g007
Table 1. Average and median concentrations of particulate matter (PM)2.5 and chemical species detected together with inter-quartile ranges and standard deviations.
SpeciesAverage St. Dev. (µg/m3)Median Range 25–75th (µg/m3)SpeciesAverage St. Dev. (ng/m3)Median Range 25–75th (ng/m3)
PM2.516.261.14Al1036.9727.15
9.539.69–19.43838.6412.82–1289.01
OC4.793.60Cr3.371.83
3.742.69–5.704.630.80–3.20
EC0.700.53Mn4.333.02
0.510.39–0.843.830.80–3.20
Na+0.280.14Fe324.0113.74
0.320.06–0.39759.155.45–235.85
NH4+0.290.10Co0.170.09
0.380.01–0.480.160.07–0.29
K+0.230.19Ni19.5715.90
0.200.12–0.2921.5713.42–20.56
DMA0.0030.001Zn26.018.02
0.0070.0005–0.00225.69.76–33.97
Mg2+0.070.07Pb4.593.48
0.020.05–0.083.721.88–6.63
Ca2+0.570.57Tl0.050.02
0.200.46–0.690.070.01–0.07
NO31.561.14Cl-560.0410.0
1.220.79–1.91420.0270.0–640.0
SO42−1.481.17Oxa64.953.7
0.950.69–2.1362.20.05–101.7
Table 2. Comparison between dithiothreitol (DTT)V and DTTM measured in PM2.5 collected in this work and in other sites of Italy, Europe, and USA.
Location SiteSiteDTTV (nmol/min·m3)DTTM (pmol/min·µg)
Sarno, IT
current study
Urban background0.19 (±0.10)11.67 (±8.43)
Lecce (ECO), IT [30]Urban background0.40 (±0.26)14.5 (±7.6)
Bologna, IT [66]UrbanRange: 0.3–1.7-
Athens, GR [21]Urban background0.33 (±0.20)27.9 (±14.4)
Netherlands [67]Urban background1.4Range: 30–80
Farm2.7-
Traffic1.7-
Traffic3.3-
Atlanta, GA [37]Near road0.2324.9
Urban0.3337.6
Traffic0.3233.2
Rural0.2836.1
Los Angeles, CA [41]Urban0.62 (±0.21)7.3 (±1.6)
San Joaquin Valley, CA [23]Rural-23
Fresno, CA [68]Urban-39
Rome [69]Urban and urban background0.23
(0.11–0.34)
-
Table 3. Multi-linear regression (MLR) analysis results and parameters indicating the goodness of the fit produced by the model for each source.
SourceΒ CoefficientsStandard Errorp-valueLower 95%Upper 95%
Biomass burning0.0080.002<0.00010.0050.012
Industrial emission0.0370.008<0.00010.0220.053
Crustal0.0170.004<0.00010.0090.025
Traffic and secondary nitrate0.0170.003<0.00010.0100.024
Sea spray0.0100.0040.0140.0020.019

