Article

Bioaerosol Emissions during Organic Waste Treatment for Biopolymer Production: A Case Study

1
Department of Public Health and Pediatrics, University of Torino, Piazza Polonia 94, 10126 Torino, Italy
2
Department Productive Plants and Environment Interaction (DIPIA), National Institute of Occupational Safety and Prevention INAIL, Via Roberto Ferruzzi 38/40, 00143 Roma, Italy
3
Department of Environmental Sciences, Informatics and Statistics, Cà Foscari University of Venice, Dorsoduro 3246, 30123 Venice, Italy
*
Author to whom correspondence should be addressed.
Atmosphere 2021, 12(8), 1069; https://doi.org/10.3390/atmos12081069
Submission received: 23 June 2021 / Revised: 16 August 2021 / Accepted: 17 August 2021 / Published: 20 August 2021
(This article belongs to the Special Issue Occupational Exposure Biological Agents: Focus on a Growing Concern)

Abstract

:
Environmentally sustainable methods of waste disposal are a strategic priority. For organic waste management and innovative biological treatments present advantageous opportunities, although organic waste treatment also includes environmental drawbacks, such as bioaerosol production. This study aims to evaluate bioaerosol spread during an innovative experimental treatment. The process consists of two anaerobic steps: acidogenesis, which includes polyhydroxyalkanoate accumulation, followed by methanogenesis. Bioaerosol, PM10, and endotoxin concentrations were measured at three sampling points during different campaigns to evaluate: (1) the background levels, (2) the contamination produced in the pre-treatment stage, and (3) the residual contamination of the outgoing digested sludge. Environmental PM10 seemed to be generally quite contained, while the endotoxin determination was close to 90 EU/m3. Significant microbial concentrations were detected during the loading of the organic fraction of municipal solid waste (fungi > 1300 CFU/m3, Bacillus genus (≈103 CFU/m3), higher Clostridium spp. and opportunistic human pathogens such as Pseudomonas aeruginosa and Klebsiella pneumoniae), suggesting a significant contamination level. Such results are useful for hazard identification in the risk assessment of innovative processes, as they reveal contaminants potentially harmful to both workers’ health and the environment.

1. Introduction

The amount of waste produced worldwide is rapidly rising due to population growth and urbanization. The global production of municipal solid waste (MSW) is likely to double in the next decade, more than 40% of which is expected to be organic matter, higher in developing countries than higher-income countries [1,2]. More attention needs to be paid to waste management to safeguard both the environment and human health. Therefore, it would be desirable to rely more on environmentally sustainable methods for waste disposal to prevent organic waste from entering landfills. To that aim, the European Union (EU) has proposed that member states reduce biodegradable waste entering landfills [3] to 10% by 2035 [4]. Another priority of the EU consists of a transition toward a circular economy, producing added-value commercial products and energy to minimize waste generation and thus the environmental impact [5].
An example of high-value production of biological origin is the extraction of polyhydroxyalkanoates (PHAs). PHAs are a type of polyester that are synthesized mainly by Gram-positive, Gram-negative, and anaerobic photosynthetic bacteria through sugar and lipid fermentation [6]. The use of PHAs is a more profitable way to recover organic matter than traditional anaerobic digestion technology. The recovery process offers the opportunity to retrofit existing waste facilities or wastewater treatment plants [7]. Moreover, replacing synthetic plastics with biodegradable PHAs would be extremely advantageous for society and the environment. However, PHAs have a higher production cost than conventional plastics (about 15 times more expensive than polymers derived from petroleum, such as polypropylene). Therefore, commercializing and industrializing them on a large scale are still limited. More efforts are required to improve the PHA synthesis process and reduce the cost [7,8]. One option could be to include PHA production in the anaerobic digestion of organic waste.
Anaerobic digestion (AD) is an economically advantageous technology for the treatment of organic waste and its management. It is a biological process that involves catalysis by anaerobic and microaerophilic microorganisms (typically thriving in 2–10% O2). It allows the degradation of organic biomass, leading to the production of biogas and digestate. The latter consists of the leftover indigestible matter and the microorganisms’ mass. AD has several noteworthy advantages, such as low production of sludge, low energy requirement, low operating costs, and potential energy recovery [9,10]. Anaerobic digestion technologies can be classified into continuous or batch operation, wet (total solids (TS) content <20%) or dry (TS content >20%) moisture levels, mesophilic (20–45 °C temperature range) or thermophilic (50–55 °C temperature range) conditions, and single- or two-stage digestion [10]. For PHA production, separation of acidogenesis and subsequent methanogenesis is needed. PHAs are synthesized in bacteria by using intermediates of the β-oxidation of alkanoic acids and accumulated in intracellular vacuoles during acidogenesis, then the growth conditions for selected PHAs producing microorganisms can be optimized [7]. Generally, for the organic fraction of municipal solid waste (OFMSW), thermophilic treatment can be used to guarantee higher effectiveness [11] and adequate management to guarantee pathogen reduction [12].
Although organic waste treatment is a preferable process with respect to disposal, it is not risk-free and must be properly assessed and managed. One of the weaknesses of the organic waste treatment process is bioaerosol dispersion. Bioaerosol, also known as primary biological airborne particles (PBAPs), includes all airborne particles from a biological source ranging from 0.001 to 100 µm in size. Pathogenic or non-pathogenic and viable or non-viable microorganisms can exist in bioaerosol [3,13]. Bioaerosol components that are considered potentially dangerous are bacteria, archaea, fungi, fungal spores, viruses, endotoxins, microbial fragments, β (1,3) glucans, mycotoxins, pollen, and others [13,14]. Biological particles can remain suspended in the air for extended periods and potentially cover distances >250 m from their source due to their small size and light weight [15]. Bioaerosol can cause adverse health effects, including a wide range of acute and chronic illnesses, in occupational environments and even in nearby residential communities subjected to high exposure levels [3,16,17].
PBAPs are part of the airborne total suspended particles (TSP). Particulate matter is a key indicator of air pollution and is generated as a consequence of natural and human activities. The finest PM can remain suspended for a long time and travel long distances in the atmosphere, potentially causing a wide range of health problems, such as heart attacks, aggravated asthma, decreased lung function, and airway irritation [18].
The World Health Organization (WHO) defines particles suspended in the air according to their equivalent aerodynamic diameter. PM10 has been defined as particles among which 50% have an equivalent aerodynamic diameter smaller than 10 µm [19,20] and can be considered one of the reference parameters to evaluate air quality. European Directive 2008/50/EC set the environmental limit for PM10 emissions at 50 µg/m3 daily, and this value should not be exceeded more than three times in a calendar year [21].
This work aims to provide, through microbial characterization, a method for monitoring environmental air microbiological during the emissions of an AD pilot plant producing PHAs starting from OFMSW. The evaluation considers an experimental process in the absence of containment measures. The diffusion in the air of any pathogens is assessed to define measures to be taken to contain the risk.

2. Materials and Methods

2.1. Sampling Campaigns

Three sampling campaigns were conducted to characterize the composition of bioaerosol exposure in a pilot-scale facility for PHA and biogas production using urban organic biowaste. The pilot plant was located in a wastewater treatment plant (WWTP) in the northeast of Italy and was previously described [5,7]. The anaerobic treatment of OFMSW occurred in separate phases under thermophilic conditions (55 °C), with fermentation and methanogenesis conducted in 2 distinct reactors. The sampling campaigns were performed in March, May, and November of 2016. They were carried out at 3 points (P0, P1, and P2) in the pilot plant, as shown in Figure 1.
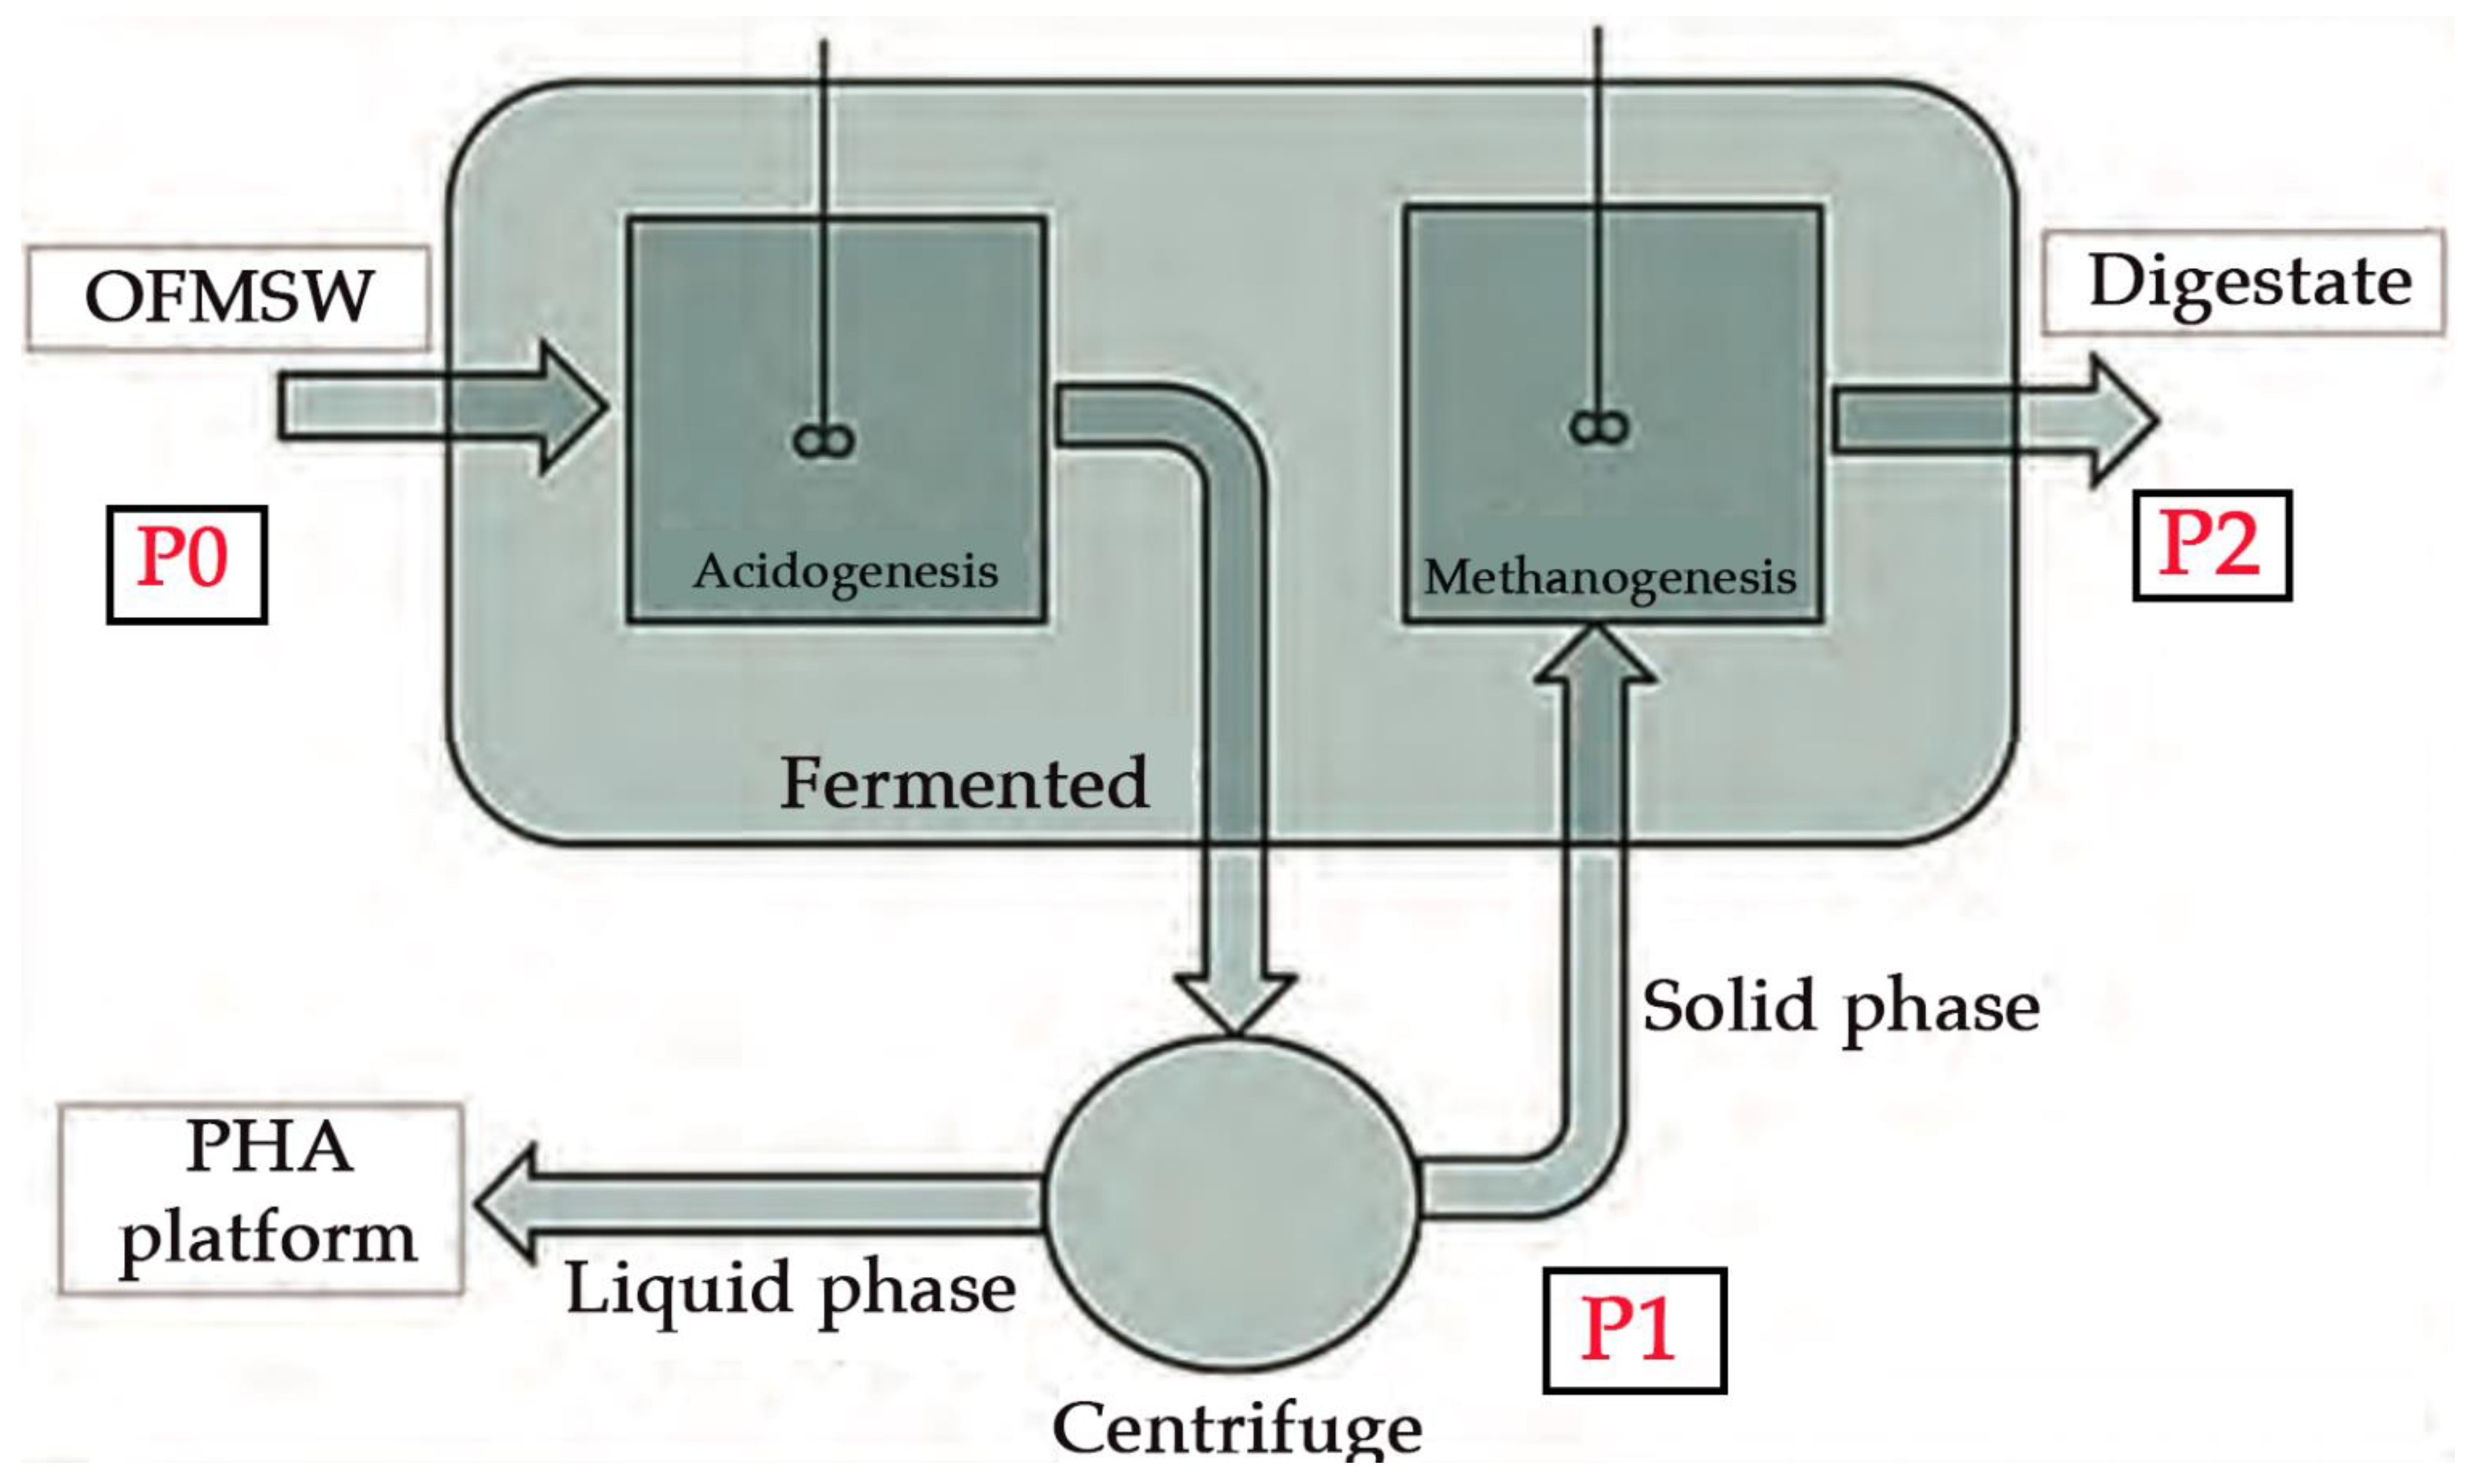
  • P0 was located in the area where the process of shredding OFMSW is self-managed and the pre-treated OFMSW enters the plant. The pre-treatment process included shredding or squeezing and was conducted at the pilot plant itself (3 and 4 May) or by an external company.
  • P1 was the intermediate phase where the liquid phase coming from acidogenesis was separated by centrifuge for subsequent enrichment of PHA producers (22 November).
  • P2 was located where the methanogenesis of the resulting biosolids process took place.
The sampling points were very close to each other (just 10 m).
The sampling campaigns were conducted as follows:
  • Background definition (10 and 11 March 2016): the first campaign evaluated the background contamination levels of the pilot plant, sampling all points (P0, P1, P2).
  • AD process including pre-treatment of the OFMSW (3 and 4 May 2016): the second campaign assessed the potential impact of the OFMSW shredding phase, which is self-managed and somewhat automated, analyzing points P0 and P1. During this phase, to limit worker exposure, no collective protective equipment was employed, only personal equipment.
  • AD process without pre-treatment of OFMSW (22 November 2016): the third campaign evaluated the residual contamination when AD was conducted using OFMSW liquid partly squeezed and homogenized by an outsourcing plant [7]. In this phase, P1 and P2 were sampled.
Both PM10 and bioaerosol sampling were performed in all 3 campaigns. Meteorological conditions, such as wind speed and temperature, were also collected.

2.2. PM10 Sampling and Analysis

An AirFlow PM10 high-volume sampler (HVS) (AMS Analitica, Pesaro, Italy) was employed for PM10 monitoring. It provides a suction flow of 1.27 m3/min, which perfectly complies with the UNI EN 12341 requirements. Its operating principle relies on the entrance of dispersed airborne particles into a high-volume pre-selector cascade impact system. The PM10 samplings were conducted for at least 4 h, and the normalized volume of each sampling was annotated as the meteorological variables detected by the sampler sensors. Five glass microfiber filters (203 × 254 mm; Pall Corporation, Port Washington, NY, USA) were used. These were conditioned before and after the samplings by placing them in a dryer with silica gel for 48 h to reduce humidity. Gravimetric analysis of the filters was conducted using a precision weighing scale to determine the PM mass concentration [22].

2.3. Endotoxin Content Assessment

Endotoxins were extracted from 1/8 of the HVS filters. Each section of the filter was cut into smaller pieces and placed in pyrogen-free 50 mL centrifuge tubes containing 15 mL of RPMI-1640 medium (Sigma Aldrich, St. Louis, MI, USA) and 0.025% of Tween-20 (Sigma Aldrich, USA). The centrifuge tubes were then put into an ultrasonic bath for 10 min and vortexed for an additional 5 min 3 consecutive times. The samples were centrifuged at 5000 RPM for 10 min to remove the filter. The supernatant was collected and stored at −20 °C. The endotoxins were analyzed using the LAL (limulus amebocyte lysate) chromogenic endpoint assay (QLC-1000 n. 50-648U, Lonza) at 37 °C. Microplates were read at 405 nm with a Tecan Infinite 200 PRO spectrophotometer and i-control (version 1.10) software, following the manufacturer’s instructions. E. coli 0111:B4 endotoxin was used as standard due to its ability to catalyze LAL proenzyme activation, thus allowing the release of p-nitroaniline. The latter produces a yellow color that can be quantitatively detected by a spectrophotometric read at 405 nm. E. coli is used as a standard because it is economical and an easily cultivable microorganism. The standard curve was obtained through 6 known endotoxin concentrations (starting at 50 EU/mL) suspended in RPMI-1640 medium (Sigma) and diluted 1:10 with autoclaved MilliQ water (pH ranging from 6.0 to 8.0). The regression coefficient of the curve should be at least 0.98. The limit of detection (LOD) is 0.01 EU/mL. Only the values quantified between the first and last curve points were considered valid [23].

2.4. Bioaerosol Sampling and Culture-Dependent Analysis

Bioaerosol sampling was performed with the SAS Super 180 dual surface air system (PBI International, Milan, Italy), a high-volume sampler that allows microbial air monitoring through air contact on Petri dishes (RODAC contact plates, VWR, Radnor, PA, USA) set up with specific media. Culture media were prepared in the laboratory following the manufacturer’s protocol. The heads of the SAS sampler were sterilized in an autoclave at 121 °C for 20 min before sampling. Table 1 lists the investigated microbial parameters, the respective culture media, and the appropriate incubation temperature.
An antimycotic (cycloheximide 0.2 g/L) was added to all media except Sabouraud to avoid fungal contamination. Bioaerosol samples were repeated from 3 to 4 plates for each biological target for at least 3 different concentrations (air volume sampling). The count of colonies formed by the microorganisms (colony-forming unit (CFU)) allowed the microbial contamination of the sampled air (most probable number (MPN)/m3) to be determined. Rapid biochemical tests (API, bioMérieux) were also performed for the isolation and identification of microorganisms.
The Global Index of Microbial Contamination (GIMC), proposed by Dacarro et al. [24], was calculated as the sum of total microbial counts determined for mesophilic bacteria, psychrophilic bacteria, and fungi in all sampled areas. The Index of Mesophilic Bacterial Contamination (IMC) can be obtained by calculating the ratio between the values measured for mesophilic and psychrophilic bacteria at the same sampling point.
The bioaerosol sampling points for each campaign were as follows:
  • Background definition (10 and 11 March) at P0, P1, and P2.
  • AD process, including pre-treatment of OFMSW (3 and 4 May) at P0 and P1.
  • AD process without pre-treatment of OFMSW (22 November) at P1 and P2.

2.5. Data Elaboration and Statistics

Statistical analysis was conducted using SPSS software, version 26.0 (IBM Corp., Armonk, NY, USA). The following statistical analyses were performed: (a) log transformation was applied to nonnormally distributed data; (b) Spearman’s rank correlation coefficients were calculated to evaluate relationships between variables; (c) Student’s t-test was employed to compare means; and (d) ANOVA was used for multivariate analysis assuming equal variance, followed by Tukey’s post hoc test for multiple comparisons. The mean differences and correlations were considered statistically significant when the p-value was <0.05 and highly significant when the p-value was <0.01.

3. Results

The PM10 values were rather low and consistent with what was expected for a suburban area (about 7 km from the city center) located in a green area. Moreover, they were in line with PM10 environmental data validated by the local environmental protection agency (ARPAV), ranging from a mean of 8 to 28 µg/m3 at the four local sampling stations. The highest level observed was 37.53 µg/m3 (afternoon/evening of 10 March 2016), and the lowest level was 5.97 µg/m3 (morning of 4 May 2016) under conditions of moderate wind (13.5 km/h). No statistically significant differences were observed among the three sampling campaigns or the sampling points.
Endotoxin values varied; the highest detected concentration was 85.62 endotoxin units (EU)/m3 (11 March 2016), and the lowest was 24.11 EU/m3 (10 March 2016). Endotoxin levels did not increase significantly following the use of OFMSW and were not affected by wind speed or temperature. The limited available data may have a negative influence on the significance of PM10 and endotoxin levels. Table 2 reports the PM10 and endotoxin concentrations.
During the use of OFMSW, fungi concentrations were underestimated because the sampled plates showed confluent growth even with the lowest sampling volume (50 L). In the second sampling campaign, an accurate evaluation of the 55 °C count and Actinomycetes was not possible due to the spread of Bacillus spp., which showed crusty colonies that inhibited the growth of other microorganisms. Plates containing Bacillus spp.-selective media were confluent in the second sampling campaign (shredding of OFMSW). Table 3 shows the results of bioaerosol monitoring.
Mean differences for each parameter, considering the three sampling campaigns, showed statistically significant results for the following:
  • Fungi (ANOVA p < 0.01): background concentration was lower than the other two sampling campaigns with OFMSW (207.8 CFU/m3 vs. >1307 and >1307 CFU/m3).
  • Bacillus spp. (ANOVA p < 0.05): background concentration was lower than the campaign with manually shredded OFMSW (4.3 CFU/m3 vs. 369.8 CFU/m3).
  • Clostridium spp. (ANOVA p < 0.05): background concentration was lower than the campaign with manually shredded OFMSW (<limit of quantification CFU/m3 vs. 7.3 CFU/m3).
The background level was low but not negligible for a nonconfined site, although protected by a canopy and with limited dispersion due to the surrounding buildings on two sides. GIMC registered 1455, 5785, and 2856 CFU/m3 in the first, second, and third campaigns, respectively. The contamination level markedly increased during the OFMSW shredding phase, and in this phase, GIMC increased from 485 to more than 1400 CFU/m3. The IMC increased with manually shredded and squeezed OFMSW by 2.31 and 1.22 times, respectively, indicating worsening sanitary conditions. The Bacillus spp. background concentration was lower than 3 CFU/m3 (first sampling campaign). The concentration reached 1307 CFU/m3 during the OFMSW shredding phase (second campaign) and 50 CFU/m3 with squeezed OFMSW (third campaign). The growth of Enterobacteria in selective media was also detected. Some pathogens and many opportunistic microorganisms, mainly transmissible by air, contact, and the oral–fecal route, were isolated and identified through rapid biochemical tests (API, bioMérieux). Table 4 lists the identified microorganisms; most of them were also previously detected at a similar plant [25]. Among them, Pseudomonas aeruginosa and Klebsiella pneumoniae, which are classified as class 2 pathogens, were observed. Regarding the indicators, only Clostridium perfringens was found during the third sampling campaign, while Escherichia coli was never detected.

4. Discussion

The registered PM10 and endotoxin concentrations were not conditioned by the OFMSW treatment, probably due to the outdoor location of the pilot plant and the small number of available measurements. PM10 samplings performed in the afternoon (10 March and 3 May) registered higher concentrations than those performed in the morning (11 March and 4th May). These levels were lower than the value established by the European Air Quality Regulation (Directive 2008/50/EC) as a daily mean of 50 µg/m3 for PM10, which should not be exceeded more than three times in a calendar year. Observed PM10 levels were also significantly lower than threshold limits for respirable PNOC in occupational environments proposed by the American Conference of Governmental Industrial Hygienists (TLV/TWA 3 mg/m3), even if such limit refers to personal sampling [26]. The data collected on March 10, which were closer to the environmental limit, do not refer to the pilot-scale impact but to the background contamination (campaign 1) due to the presence of constantly active wastewater treatment impacting the same area.
In general, the afternoon data were influenced by environmental accumulation due to anthropic activities and heating, while the morning data were influenced by the dispersion effect of the night. Endotoxin levels were consistent with the literature in similar environmental conditions [27,28,29,30]. Additionally, the endotoxin content was below the lowest proposed value in the workplace (OEL of 90 EU/m3, suggested by the Dutch Expert Committee on Occupational Standards in 2010) [3,31]. However, the number of samples collected was low, and they were limited to pilot plant activities, which cannot be extrapolated to full-time activities. In fact, a higher value of 86 EU/m3 was observed on March 11. This was probably due to contamination caused by the normal activity of the wastewater treatment plant hosting the pilot plant.
Bioaerosol data showed relatively low Clostridia concentrations and high Bacillus concentrations. These results are in line with what was expected and reported in the literature [13,33,34], except for airborne Salmonella (maximum 30 CFU/m3), which is not commonly detected in bioaerosol monitoring [13]. This could be due to the limited containment measures taken at pilot-scale plants for bioaerosol generation and dispersion. The sampled bioaerosol represents the surrounding contamination of the pilot plant, so even if it was affected by the anaerobic contribution effluents at the pilot plant, the bacterial and fungal species sampled were both anaerobic and aerobic.
In the first sampling, bioaerosol monitoring showed low concentrations overall, as measured by the GIMC value, indicating a limited bioaerosol presence and persistence in the background area where the pilot plant was located. However, in the second sampling campaign, higher concentrations were detected for both fungi and Bacillus spp. Significant contamination levels were also supported by the GIMC values for the second and third sampling campaigns. Notably, the levels of microorganisms belonging to the Bacillus genus, which are important for their ability to produce spores [35] and withstand the chemical–physical conditions of anaerobic digestion, were especially high. The Bacillus genus could be representative of microbial contamination related to OFMSW and could be used as a potential indicator [36]. The Bacillus genus is also relevant because it encompasses pathogenic species such as Bacillus cereus and Bacillus anthracis. The former infects humans, causing food-borne illness, while the latter causes anthrax [35]. Bacillus subtilis and Bacillus cereus are also involved in biofilm production, allowing them to survive even the most aggressive environmental conditions [37,38].
Another finding was the detection of Pseudomonas aeruginosa and Klebsiella pneumoniae through culture-dependent methods. Pseudomonas aeruginosa is a Gram-negative bacterium, ubiquitous in the environment and commonly associated with soil and water. It is an opportunistic human pathogen that can cause a wide range of acute and chronic infections, especially in immunocompromised individuals. It is particularly hazardous because it is responsible for severe nosocomial infections, such as pneumonia. It is also able to adapt to, survive, and resist various classes of antibiotics, such as carbapenems. For all of these reasons, P. aeruginosa is considered a rising threat to public health and a cause of great concern in the scientific community [39,40,41]. Klebsiella pneumoniae, another opportunistic Gram-negative bacterium, was also identified in this study. Similar to Pseudomonas aeruginosa, Klebsiella pneumoniae mainly affects individuals with compromised immune defense. It is hypervirulent and multi-drug resistant due to the diversity of its antimicrobial resistance (AMR) genes, its varied DNA composition, and its high plasmid burden. It is the causative agent of a variety of infections, including in the respiratory tract, urinary tract, and bloodstream [42,43]. It is one of the most frequent causes of nosocomial and community-acquired infections, representing a major hazard to human health [43]. Unlike endotoxins and PM10, significant differences were observed in bioaerosol dispersion due to both the presence of OFMSW and its treatment methods. The level of biological contamination can be considered intermediate, according to the National Institute for Insurance against Accidents at Work (INAIL) classification in 2010, since the GIMC was always higher than 1000 CFU/m3 but always lower than 10,000 CFU/m3.
As reported in the literature, the activity with the most impact is farming, in which animals and biomasses are present contemporaneously as bioaerosol sources. Generally, wastewater treatment plants present lower air contamination levels [44] with respect to farming [45] and composting plants [46]. In this study, the background bioaerosol of the wastewater treatment plant was increased by the impact of the organic waste treatment at the pilot plant. Such increase is not negligible, even if not so critical.
Finally, it should be noted that all analyses conducted in this study involved a pilot facility that employs techniques that cannot always be applied to an industrial-scale plant. Therefore, the results obtained cannot be directly extrapolated to an industrial-scale plant. However, this research gives some valuable insights into airborne microbial species released during organic waste treatment processes and provides a qualitative assessment of bioaerosol contamination levels. At the pilot plant, no collective protection was used, allowing the possibility to see what could be worker exposure risk in the case of a lack of protection. At an industrial-scale plant, quantitative evaluation of the actual bioaerosol levels emitted during organic waste disposal would be essential, considering that the volume of treated organic waste will increase and the technical solutions applied will differ. The occupational risk associated with bioaerosol exposure should be minimized by managing the work activity and using collective protective equipment (e.g., biofilters) and personal protective equipment (e.g., glasses, helmets, masks, gloves, safety shoes, protective suits), along with other protective devices (e.g., respiratory protection and efficient ventilation systems) [43,47,48].

5. Limits

The monitoring campaign was performed in a pilot plant employing techniques that cannot always be applied to industrial-scale plants. In this scenario, each step must be subjected to risk assessment and reorganized to improve efficiency and safeguard both workers and the environment.
Occupational risk assessments are usually performed with personal samplers, and in this study, high-volume environmental samplers were used, which can detect what was dispersed in a particular area but not exactly what and how much people would be exposed to. However, in this case, we considered an experimental plant, which differed from an industrial plant where there is a different duration of exposure, and individual and collective protective devices are routinely used.
The lack of correlation and significant differences among PM10, endotoxins, and bioaerosol data may be due to the outdoor location of the pilot plant and the small number of available measurements. There were few repetitions because the microbial characterization was not the main focus of the facility; on the other hand, the results obtained in this monitoring campaign show the effect of the self-managed pre-treatment process, which is the most contaminating stage.
The use of only culture-based methods underestimated the microbial contamination levels since the culturability of environmental bacteria is generally low [43]. Consequently, some microorganisms that are not cultivatable under certain specific growth conditions could have been undetected. Biomolecular techniques such as real-time polymerase chain reaction (PCR) and next-generation sequencing (NGS) are more sensitive, provide greater microbial resolution and diversity, and have much higher quantification limits [3]. Nevertheless, these methods cannot discern if the genetic material belongs to a viable or non-viable microorganism, potentially leading to overestimation [25]. Using a combination of both techniques could better represent bioaerosol contamination levels [13].

6. Conclusions

The results obtained in this study showed higher microbial contamination produced when the organic waste treatment in the plant was included, especially fungi, Bacillus spp., and opportunistic pathogens. Such air contamination is potentially harmful to both workers’ health and the environment, in particular when pre-treatment of raw organic waste was involved. Consequently, regular monitoring of critical parameters can be auspicial. On the other hand, no particular impact can be attributed to the other pilot plant activities for the production of PHAs. However, for PM10 and endotoxins, the detected levels in such an outdoor environment can be considered acceptable. A complete risk assessment requires a specific quantitative evaluation of the mass flows emitted at each processing step and cannot disregard full-scale monitoring. Finally, an industrial-scale process, with both manually shredded and squeezed OFMSW, should consider the findings of this study to achieve appropriate risk containment.

Author Contributions

Conceptualization, D.T., G.G. and B.P.; methodology, D.T., B.P., P.P. and F.V.; software, D.T., S.F. and E.P.; validation, G.G., B.P., E.F. and E.A.; formal analysis, S.F., D.T. and G.C.; resources, G.G., B.P. and P.P.; data curation, E.A. and E.P.; writing—original draft preparation, E.P.; writing—review and editing, E.F., C.C. and E.A.; visualization, E.F. and C.C.; supervision, D.T.; project administration, D.T.; funding acquisition, G.G. and B.P. All authors have read and agreed to the published version of the manuscript.

Funding

This research was funded by INAIL, informative number 72002.22.09.2015.0007289, Codice Unico di Progetto (CUP) B82I15 003410005, and the APC was funded by Università di Torino.

Institutional Review Board Statement

Not applicable.

Informed Consent Statement

Not applicable.

Data Availability Statement

The data presented in this study are available on motivated request from the corresponding author. The data are not publicly available due to necessary authorization of the funding Institution.

Acknowledgments

The authors wish to thank the WWTP plant for collaborating on this project.

Conflicts of Interest

The authors declare no conflict of interest.

References

  1. Clarke, W.P. The uptake of anaerobic digestion for the organic fraction of municipal solid waste—Push versus pull factors. Bioresour. Technol. 2018, 249, 1040–1043. [Google Scholar] [CrossRef] [PubMed]
  2. Fernández-González, J.M.; Díaz-López, C.; Martín-Pascual, J.; Zamorano, M. Recycling organic fraction of municipal solid waste: Systematic literature review and bibliometric analysis of research trends. Sustainability 2020, 12, 4798. [Google Scholar] [CrossRef]
  3. Robertson, S.; Douglas, P.; Jarvis, D.; Marczylo, E. Bioaerosol exposure from composting facilities and health outcomes in workers and in the community: A systematic review update. Int. J. Hyg. Environ. Health 2019, 222, 364–386. [Google Scholar] [CrossRef] [PubMed]
  4. European Parliament and Council. Directive (EU) 2018/850 of the European Parliament and of the Council of 30 May 2018 amending Directive 1999/31/EC on the landfill of waste. Off. J. Eur. Union 2018, 2018, 100–108. [Google Scholar]
  5. Moretto, G.; Russo, I.; Bolzonella, D.; Pavan, P.; Majone, M.; Valentino, F. An urban biorefinery for food waste and biological sludge conversion into polyhydroxyalkanoates and biogas. Water Res. 2020, 170, 115371. [Google Scholar] [CrossRef] [PubMed]
  6. Crognale, S.; Tonanzi, B.; Valentino, F.; Majone, M.; Rossetti, S. Microbiome dynamics and phaC synthase genes selected in a pilot plant producing polyhydroxyalkanoate from the organic fraction of urban waste. Sci. Total Environ. 2019, 689, 765–773. [Google Scholar] [CrossRef]
  7. Valentino, F.; Moretto, G.; Lorini, L.; Bolzonella, D.; Pavan, P.; Majone, M. Pilot-Scale Polyhydroxyalkanoate Production from Combined Treatment of Organic Fraction of Municipal Solid Waste and Sewage Sludge. Ind. Eng. Chem. Res. 2019, 58, 12149–12158. [Google Scholar] [CrossRef]
  8. Bátori, V.; Åkesson, D.; Zamani, A.; Taherzadeh, M.J.; Sárvári Horváth, I. Anaerobic degradation of bioplastics: A review. Waste Manag. 2018, 80, 406–413. [Google Scholar] [CrossRef] [PubMed]
  9. Chen, Y.; Cheng, J.J.; Creamer, K.S. Inhibition of anaerobic digestion process: A review. Bioresour. Technol. 2008, 99, 4044–4064. [Google Scholar] [CrossRef]
  10. Wu, Y.; Wang, S.; Liang, D.; Li, N. Conductive materials in anaerobic digestion: From mechanism to application. Bioresour. Technol. 2020, 298, 122403. [Google Scholar] [CrossRef]
  11. Ahmed, B.; Tyagi, V.K.; Aboudi, K.; Naseem, A.; Álvarez-Gallego, C.J.; Fernández-Güelfo, L.A.; Kazmi, A.A.; Romero-García, L.I. Thermally enhanced solubilization and anaerobic digestion of organic fraction of municipal solid waste. Chemosphere 2021, 282, 131136. [Google Scholar] [CrossRef]
  12. Seruga, P.; Krzywonos, M.; Paluszak, Z.; Urbanowska, A.; Pawlak-Kruczek, H.; Niedzwiecki, L.; Pińkowska, H. Pathogen Reduction Potential in Anaerobic Digestion. Molecules 2020, 25, 275. [Google Scholar] [CrossRef] [Green Version]
  13. Wéry, N. Bioaerosols from composting facilities—A review. Front. Cell. Infect. Microbiol. 2014, 4, 42. [Google Scholar] [CrossRef]
  14. Pearson, C.; Littlewood, E.; Douglas, P.; Robertson, S.; Gant, T.W.; Hansell, A.L. Exposures and health outcomes in relation to bioaerosol emissions from composting facilities: A systematic review of occupational and community studies. J. Toxicol. Environ. Health Part B Crit. Rev. 2015, 18, 43–69. [Google Scholar] [CrossRef] [PubMed]
  15. Douglas, P.; Tyrrel, S.F.; Kinnersley, R.P.; Whelan, M.; Longhurst, P.J.; Hansell, A.L.; Walsh, K.; Pollard, S.J.T.; Drew, G.H. Predicting Aspergillus fumigatus exposure from composting facilities using a dispersion model: A conditional calibration and validation. Int. J. Hyg. Environ. Health 2017, 220, 17–28. [Google Scholar] [CrossRef] [Green Version]
  16. Schlosser, O.; Robert, S.; Debeaupuis, C.; Huyard, A. Inhalable dust as a marker of exposure to airborne biological agents in composting facilities. Waste Manag. 2018, 81, 78–87. [Google Scholar] [CrossRef]
  17. Schlosser, O.; Huyard, A.; Cartnick, K.; Yañez, A.; Catalán, V.; Do Quang, Z. Bioaerosol in Composting Facilities: Occupational Health Risk Assessment. Water Environ. Res. 2009, 81, 866–877. [Google Scholar] [CrossRef] [PubMed]
  18. Kim, K.H.; Kabir, E.; Kabir, S. A review on the human health impact of airborne particulate matter. Environ. Int. 2015, 74, 136–143. [Google Scholar] [CrossRef] [PubMed]
  19. Environmental Protection Agency EPA. Particulate Matter (PM) Basics; US EPA: Washington, DC, USA, 2021. [Google Scholar]
  20. WHO. Air Quality Guidelines; WHO: Geneva, Switzerland, 2006. [Google Scholar]
  21. Directive 2008/50/EC Air Quality Directive. 2008. Available online: http://eur-lex.europa.eu/legal-content/en/ALL/?uri=CELEX:32008L0050 (accessed on 1 August 2021).
  22. Traversi, D.; Gilli, G. Mutagenicity of PM2.5. Encycl. Environ. Health 2018, 880–887. [Google Scholar] [CrossRef]
  23. Traversi, D.; Alessandria, L.; Schilirò, T.; Gilli, G.; Schiliro, T.; Gilli, G.; Schilirò, T.; Gilli, G. Size-fractionated PM10 monitoring in relation to the contribution of endotoxins in different polluted areas. Atmos. Environ. 2011, 45, 3515–3521. [Google Scholar] [CrossRef]
  24. Dacarro, C.; Grignani, E.; Lodola, L.; Grisoli, P.; Cottica, D. Proposed microbiological indexes for the assessment of air quality in buildings. G. Ital. Med. Lav. Ergon. 2000, 22, 229–235. [Google Scholar] [PubMed]
  25. Degois, J.; Simon, X.; Clerc, F.; Bontemps, C.; Leblond, P.; Duquenne, P. One-year follow-up of microbial diversity in bioaerosols emitted in a waste sorting plant in France. Waste Manag. 2021, 120, 257–268. [Google Scholar] [CrossRef] [PubMed]
  26. ACGIH. 2018 Guide to Occupational Exposure Values; Governmental American Conference of Industrial Hygienists: Cincinnati, OH, USA, 2018; ISBN 978-1-607260-98-1. [Google Scholar]
  27. Chang, M.W.; Lee, C.R.; Hung, H.F.; Teng, K.S.; Huang, H.; Chuang, C.Y. Bioaerosols from a Food Waste Composting Plant Affect Human Airway Epithelial Cell Remodeling Genes. Int. J. Environ. Res. Public Health 2014, 11, 337–354. [Google Scholar] [CrossRef] [PubMed] [Green Version]
  28. Duquenne, P.; Simon, X.; Koehler, V.; Goncalves-Machado, S.; Greff, G.; Nicot, T.; Poirot, P. Documentation of bioaerosol concentrations in an indoor composting facility in France. J. Environ. Monit. 2012, 14, 409–419. [Google Scholar] [CrossRef] [PubMed]
  29. Madsen, A.M.; Schneider, T.; Larsson, L. Microbial Dustiness and Particle Release of Different Biofuels. Ann. Occup. Hyg. 2004, 48, 327–338. [Google Scholar] [CrossRef] [Green Version]
  30. Rolph, C.A.; Gwyther, C.L.; Tyrrel, S.F.; Nasir, Z.A.; Drew, G.H.; Jackson, S.K.; Khera, S.; Hayes, E.T.; Williams, B.; Bennett, A.; et al. Sources of Airborne Endotoxins in Ambient Air and Exposure of Nearby Communities—A Review. Atmosphere 2018, 9, 375. [Google Scholar] [CrossRef] [Green Version]
  31. Eduard, W.; Heederik, D.; Duchaine, C.; Green, B.J. Bioaerosol exposure assessment in the workplace: The past, present and recent advances. J. Environ. Monit. 2012, 14, 334. [Google Scholar] [CrossRef] [Green Version]
  32. Carballa, M.; Regueiro, L.; Lema, J.M. Microbial management of anaerobic digestion: Exploiting the microbiome-functionality nexus. Curr. Opin. Biotechnol. 2015, 33, 103–111. [Google Scholar] [CrossRef]
  33. Mata-Alvarez, J.; Mace, S.; Llabres, P. Anaerobic digestion of organic solid wastes. An overview of research achievements and perspectives. Bioresour. Technol. 2000, 74, 3–16. [Google Scholar] [CrossRef]
  34. Nelson, M.C.; Morrison, M.; Yu, Z. A meta-analysis of the microbial diversity observed in anaerobic digesters. Bioresour. Technol. 2011, 102, 3730–3739. [Google Scholar] [CrossRef]
  35. Ministero del Lavoro. Allegato XLVI D.Lgs 81/2008 Elenco degli Agenti Biologici Classificati; Ministero del Lavoro: Rome, Italy, 2008. [Google Scholar]
  36. Maughan, H.; Van der Auwera, G. Bacillus taxonomy in the genomic era finds phenotypes to be essential though often misleading. Infect. Genet. Evol. 2011, 11, 789–797. [Google Scholar] [CrossRef] [PubMed]
  37. Gutarowska, B.; Skóra, J.; Stępień, Ł.; Szponar, B.; Otlewska, A.; Pielech-Przybylska, K. Assessment of microbial contamination within working environments of different types of composting plants. J. Air Waste Manag. Assoc. 2015, 65, 466–478. [Google Scholar] [CrossRef] [PubMed]
  38. Flemming, H.; Wingender, J. The biofilm matrix. Nat. Rev. Microbiol. 2010, 8, 623–633. [Google Scholar] [CrossRef]
  39. Simões, M.; Simões, L.C.; Vieira, M.J. Species association increases biofilm resistance to chemical and mechanical treatments. Water Res. 2009, 43, 229–237. [Google Scholar] [CrossRef] [PubMed] [Green Version]
  40. Hilborn, E.D.; Arduino, M.J.; Pruden, A.; Edwards, M.A. Epidemiology and Ecology of Opportunistic Premise Plumbing Pathogens: Legionella pneumophila, Mycobacterium avium, and Pseudomonas aeruginosa. Environ. Health Perspect. 2015, 123, 749–758. [Google Scholar]
  41. Feng, W.; Sun, F.; Wang, Q.; Xiong, W.; Qiu, X.; Dai, X.; Xia, P. Epidemiology and resistance characteristics of Pseudomonas aeruginosa isolates from the respiratory department of a hospital in China. J. Glob. Antimicrob. Resist. 2017, 8, 142–147. [Google Scholar] [CrossRef]
  42. Moradali, M.F.; Ghods, S.; Rehm, B.H.A. Pseudomonas aeruginosa Lifestyle: A Paradigm for Adaptation, Survival, and Persistence. Front. Cell. Infect. Microbiol. 2017, 7, 39. [Google Scholar] [CrossRef] [Green Version]
  43. Martin, R.M.; Bachman, M.A. Colonization, Infection, and the Accessory Genome of Klebsiella pneumoniae. Front. Cell. Infect. Microbiol. 2018, 8, 4. [Google Scholar] [CrossRef] [Green Version]
  44. Wyres, K.L.; Holt, K.E. Klebsiella pneumoniae as a key trafficker of drug resistance genes from environmental to clinically important bacteria. Curr. Opin. Microbiol. 2018, 45, 131–139. [Google Scholar] [CrossRef] [PubMed]
  45. Singh, N.K.; Sanghvi, G.; Yadav, M.; Padhiyar, H.; Thanki, A. A state-of-the-art review on WWTP associated bioaerosols: Microbial diversity, potential emission stages, dispersion factors, and control strategies. J. Hazard. Mater. 2021, 410, 124686. [Google Scholar] [CrossRef]
  46. Kim, K.Y.; Ko, H.J.; Kim, D. Assessment of airborne microorganisms in a swine wastewater treatment plant. Environ. Eng. Res. 2012, 17, 211–216. [Google Scholar] [CrossRef]
  47. Duquenne, P. On the identification of culturable microorganisms for the assessment of biodiversity in bioaerosols. Ann. Work Expo. Health 2018, 62, 139–146. [Google Scholar] [CrossRef] [PubMed] [Green Version]
  48. Anedda, E.; Carletto, G.; Gilli, G.; Traversi, D. Monitoring of Air Microbial Contaminations in Different Bioenergy Facilities Using Cultural and Biomolecular Methods. Int. J. Environ. Res. Public Health 2019, 16, 2546. [Google Scholar] [CrossRef] [PubMed] [Green Version]
Figure 1. Three sampling locations (P0, P1, and P2) at the pilot plant. P0: Area dedicated to preparation of shredded organic fraction of municipal solid waste (OFMSW); P1: position next to entry point of OFMSW pre-treated by shredding or squeezing; P2: location of final methanogenesis.
Atmosphere 12 01069 g001
Table 1. Microorganisms investigated and technical information on culture media used.
Investigated MicroorganismsCulture MediaIncubation
Temperature
Bacterial count at 22 °CPlate Count Agar (Merck VM361263 202)22 °C
Bacterial count at 37 °CPlate Count Agar (Merck VM361263 202)37 °C
Bacterial count at 55 °CPlate Count Agar (Merck VM361263 202)55 °C
Fungi/yeastsSabouraud Glucose Agar with 4% Chloramphenicol (Sigma 89579)24 °C
PseudomonadaceaeCetrimide (Merck VM077084 930)37 °C
Bacillus spp.Hi-crome Bacillus Agar (Fluka 92325)30 °C
Clostridium spp.mCP (SIFIN TN1288)44 °C
Gram-negative bacteriaMacConkey Agar (Biolife 4016702)37 °C
Salmonella/ShigellaXLD-D (bioMérieux 51049)37 °C
ActinomycetesStarch Casein Agar (US Biological S7968-25)55 °C
Table 2. PM10 and endotoxin concentrations divided by campaign.
CampaignDatePM10
(µg/m3)
Endotoxin
(EU/m3)
Wind Speed
(Km/h)
Temperature
(°C)
First10 March 37.5324.11810
11 March 9.3885.62710.5
Second3 May 11.8958.05923
4 May 5.9737.1913.517.5
Third22 November 29.9736.617.612.5
Table 3. Microbial concentrations measured in all three sampling campaigns. CFU, colony-forming unit.
Indicators
CFU/m3
First Campaign (P0, c1, P2)Second Campaign (P0, P1)Third Campaign (P1, P2)Analysis of Variance
MeanStandard
Deviation
MeanStandard
Deviation
MeanStandard
Deviation
p-Value
Bacterial count at 22 °C187.7897.5468.3360.1278.000n.s.
Bacterial count at 37 °C89.3317.2471.0045.0843.004.24n.s.
Bacterial count at 55 °C24.0027.78005.001.41n.s.
Fungi/yeasts207.7873.961,30701,3070<0.01
Pseudomonadaceae0.330.5813.0024.091.502.12n.s.
Bacillus spp.4.331.53369.75729.0173.3333.00<0.05
Clostridium spp.0.330.587.255.033.002.83<0.05
Gram-negative bacteria0.330.5812.7512.069.5012.02n.s.
Salmonella/Shigella0030.2529.023.503.54n.s.
Actinomycetes3.673.060.500.584.503.54n.s
Table 4. Microorganisms isolated through rapid biochemical tests (API, bioMériux) in all three sampling campaigns. % indicates percentage identified.
CampaignIsolated
Microorganism
%Relevance to Human Health [32]Main Transmission
Route/Vehicle
Environmental DispersionGeneral Description
FirstPseudomonas aeruginosa99.5Opportunistic pathogen (class 2)AerosolUbiquitousGram-negative, Pseudomonadaceae
Serratia rubidaea81.2Opportunistic pathogenParenteralWater, soilGram-negative, Enterobacteriaceae
Photobacterium damselae95.0PathogenOral–fecalWater, foodGram-negative, Vibrionaceae
Pseudomonas fluorescens75.2Opportunistic pathogenOral–fecal, parenteralSoil, surface waterGram-negative, Pseudomonadaceae
SecondHafnia alvei99Opportunistic pathogenOral–fecalSoil, foodGram-negative, Enterobacteria
Serratia marcescens98Opportunistic pathogenDirect contactUbiquitousGram-negative, Enterobacteria
Proteus vulgaris99.9Pathogen (class 2)ContactSoil, fertilizers, sewageGram-negative, Enterobacteria
Serratia liquefaciens90.3Opportunistic pathogenDirect contact,
oral–fecal
Soil, waste, wastewaterGram-negative, Enterobacteria
Serratia odorifera99.9Opportunistic pathogenDirect contact,
oral–fecal
UbiquitousGram-negative, Enterobacteria
Pseudomonas luteola82.6Opportunistic pathogenAerosolUbiquitousPseudomonadaceae
Klebsiella pneumoniae98Opportunistic pathogen (class 2)AerosolWet environment, water facilitiesEnterobacteriaceae
Klebsiella oxytoca99.6Opportunistic pathogen (class 2)Direct contactUbiquitousEnterobacteriaceae
Bacillus cereus99.9PathogenOral–fecalSoil, dust, foodGram-positive, Bacillaceae
Pantoea spp. 99.8Opportunistic pathogensParenteralWater, soilEnterobacteriaceae
Bacillus licheniformis99.9Opportunistic pathogenAerosolSoilGram-positive, Bacillaceae
Citrobacter freundii76Opportunistic pathogenOral–fecalWater, soilEnterobacteriaceae
ThirdPantoea 1 spp. 98.8Opportunistic pathogensParenteralWater, soilGram-negative, Enterobacteriaceae
Enterobacter cloacae (2) 99.0;98.7Opportunistic pathogensContact/aerosolWater, ubiquitous
Pseudomonas aeruginosa99.0Opportunistic pathogen (class 2)AerosolUbiquitousPseudomonadaceae
Pseudomonas luteola (2) 98.6;89.0Opportunistic pathogenAerosolUbiquitousPseudomonadaceae
Pseudomonas putida (2) 98.8;91.0Opportunistic pathogenAerosolNosocomialPseudomonadaceae
Cintrobacter freundii97.8Opportunistic pathogenOral-fecalWater, soilEnterobacteriaceae
Enterobacter aerogens99.0Opportunistic pathogenContact/aerosolWater, ubiquitous
Klebsiella pneumoniae97.9Opportunistic pathogen (class 2)AerosolWet environments, waterEnterobacteriaceae
Proteus vulgaris99.0Pathogen (class 2)Direct/indirect contactSoil, fertilizers, sewageEnterobacteriaceae
Publisher’s Note: MDPI stays neutral with regard to jurisdictional claims in published maps and institutional affiliations.

