
Non-Invasive-Monitoring Methodology for the Evaluation of Environmental Impacts on Istrian Stone Surfaces in Venice


Department of Environmental Sciences, Informatics, Statistics, Ca’ Foscari University of Venice, Scientific Campus, Via Torino 155, 30172 Venice Mestre, Italy
*
Author to whom correspondence should be addressed.
Atmosphere 2022, 13(7), 1036; https://doi.org/10.3390/atmos13071036
Submission received: 13 May 2022
/
Revised: 22 June 2022
/
Accepted: 23 June 2022
/
Published: 29 June 2022
(This article belongs to the Special Issue Atmospheric Environment and Cultural Heritage Protection)
Abstract
:This work proposes a non-invasive, affordable, and easily reproducible methodology for monitoring limestone surfaces vulnerability. The proposed methodology integrates the study of environmental factors impacting limestone surfaces with physical–chemical and morphological observations of historical Istria stone surfaces in Venice. Pollutant trends of particulate matters (PPM), NO2, SO2, O3, and the meteorological forcing were considered over a 20-year period. To collect information on the conservation state of stone surfaces, visual, optical microscopy observation, chemical analysis via FT-IR-ATR spectroscopy, and the evaluation of morphological and profilometric parameters by digitalizing the surface of silicone molds were carried out. The surfaces of Ca’ Foscari, Ca’ Dolfin, and Garzoni Palace were monitored in 2015 and five years after. Indicators, such as site, sheltered or exposed position, and location of the stone surfaces, were taken into consideration for data interpretation. A relationship between surface conservation state and the proposed environmental indicators has been evaluated. Deposits and crusts were found only in the courtyard façade and in sheltered points, reflecting SO2 reduction; large, eroded areas were found on exposed surfaces related to rain runoff and possibly related to the locally high NOx levels.
1. Introduction
The monitoring of historical stone surfaces is essential to gain knowledge on their vulnerability and inform owners and stakeholders involved in building conservation on the implementation of smart preventive protection and maintenance plans [1,2]. Monitoring needs an integrated evaluation of the conservation state of the surfaces along with an evaluation of the environmental context. It should be prolonged over time to assess the possible variations that are occurring and to act as an early warning system, thus, gaining necessary information to propose preventive conservation actions [3,4,5,6,7,8,9]. Knowledge about the vulnerability of limestone surfaces pointed out that air quality and weather events have a strong impact on limestone surfaces, leading to erosion, chemical changes, deposition, crust formation, and decay processes [7,8,9,10]. The scientific literature on the impacts of the environment on stone surfaces focuses mainly on the study of real ancient buildings surfaces [11,12], on deposits or wash-out of freshly caved smooth samples exposed to the environment [3,5,13,14], and separate reports on the main pollutant emissions [15,16,17]. Often the two aspects are not compared, and the evaluation of the texture variation of carved and finished historical surfaces overtime is rarely considered [18,19]. However, the texture of the stone is a fundamental characteristic of the surface, strongly influencing the aesthetical yield. The texture can give useful information on the extent of the environment’s impact.
The present study carries out a non-invasive methodology for the monitoring of a compact limestone commonly found in Venice, Istrian stone in 2015 and in 2020. This allows us to gain further knowledge on the environmental impacts on compact limestones in coastal areas [20,21,22].
Within our research, the environmental impacts were evaluated by considering the trends of pollutants [17,22,23], such as NO2, SO2, O3, PPMs, and of meteorological precipitations, humidity [15,17], and temperatures from 2000 to 2020 [24]. The large timespan considered allows us to take into account the role of increasing or decreasing trends in pollutant concentrations and precipitations on the stone surfaces before the monitoring campaigns (2015, 2020). The concentration of pollutants was collected from the open data from different monitoring stations of the Veneto Regional Agency for the Environment Prevention and Protection [25]. Moreover, the link between environmental emissions and socio-economic changes in Venice was investigated, thanks to the results of APICE “Common Mediterranean strategy and local practical actions for the mitigation of port, industries, and cities emissions” (2011–2013) project [26]. In APICE, a knowledge-based approach for air pollution mitigation and sustainable development of port activities was developed, starting from the inter-comparison of data acquired in five different pilot areas (Venice, Genoa, Barcelona, Marseille, and Thessaloniki). In particular, the APICE project investigated the transformation that occurred to the lagoon area during the last decades: from being the site of the important chemical pole of the Marghera port [27] (which decreased its activities and pollution emission over time) to becoming an international airport and important cruise port [28,29].
The variations of the conservation status of the surfaces were evaluated by applying the methodology developed in Falchi et al. [30] on the same surfaces on two selected Venetian buildings and on a new one. Ca’ Foscari [31], Ca’ Dolfin, and Garzoni palace surfaces were selected as significant examples of Istria stone carved and bush-hammered finish. The selected surface areas were subjected to morphological and profilometric analyses to obtain information on the original texture of the stone, on the erosion and deposition areas, and on patinas and crust formation. The morphology variations were related to the environmental impacts by considering the building position (nearby or far away from canals), façade location (overlooking canal or courtyards), and the specific exposure of each sampled area (exposed to rains or sheltered).
2. Materials and Methods
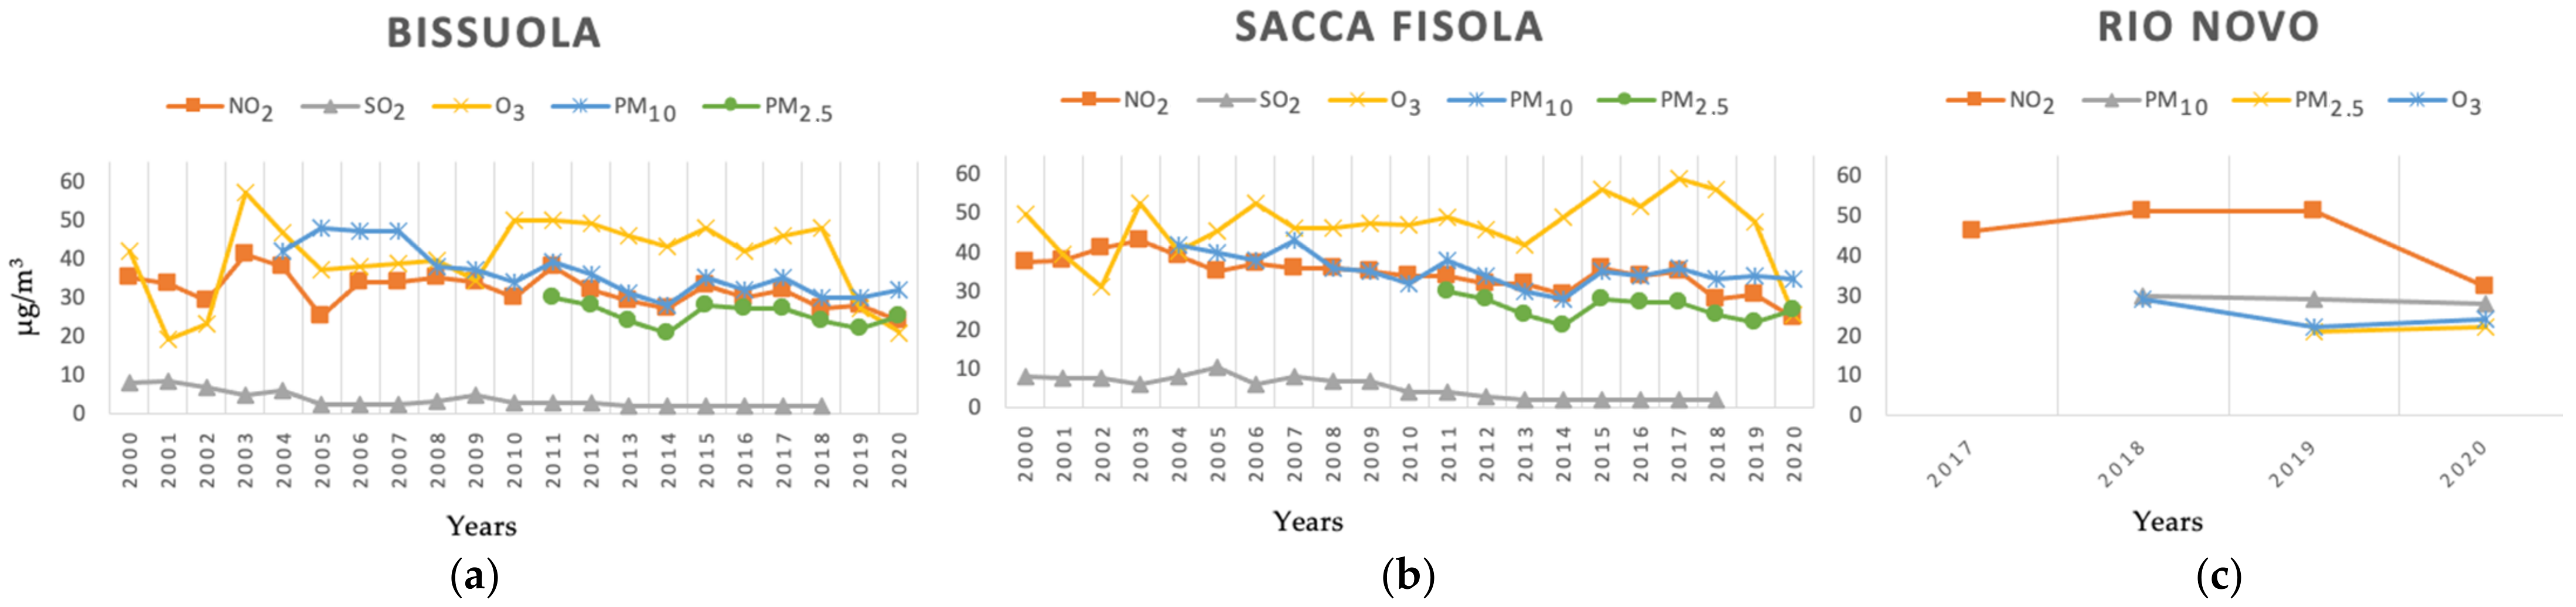
The annual average concentrations of PM10, PM2.5, NO2, SO2, and O3, were collected from the Regional Agency for Environmental Prevention and Protection of Veneto—ARPAV—for the 2000–2020 period [25]. The monitoring stations used as reference are those of Bissuola, Sacca Fisola, and Rio Novo, signifying a background green area, urban coastal area, and intense water-traffic area, respectively.
Meteorological conditions, such as precipitation, humidity, and temperature, which have a direct consequence on pollution impact, were considered. In this regard, the open data for the years 2000–2020 reported on the website of ARPAV were collected [25].
A critical evaluation of pollution emission sources of anthropogenic origin in relation to the socio-economic changes of Venice based on the APICE project results was carried out [25]. Among them, emission of traffic, industry, energy production, and domestic heating were taken into account.
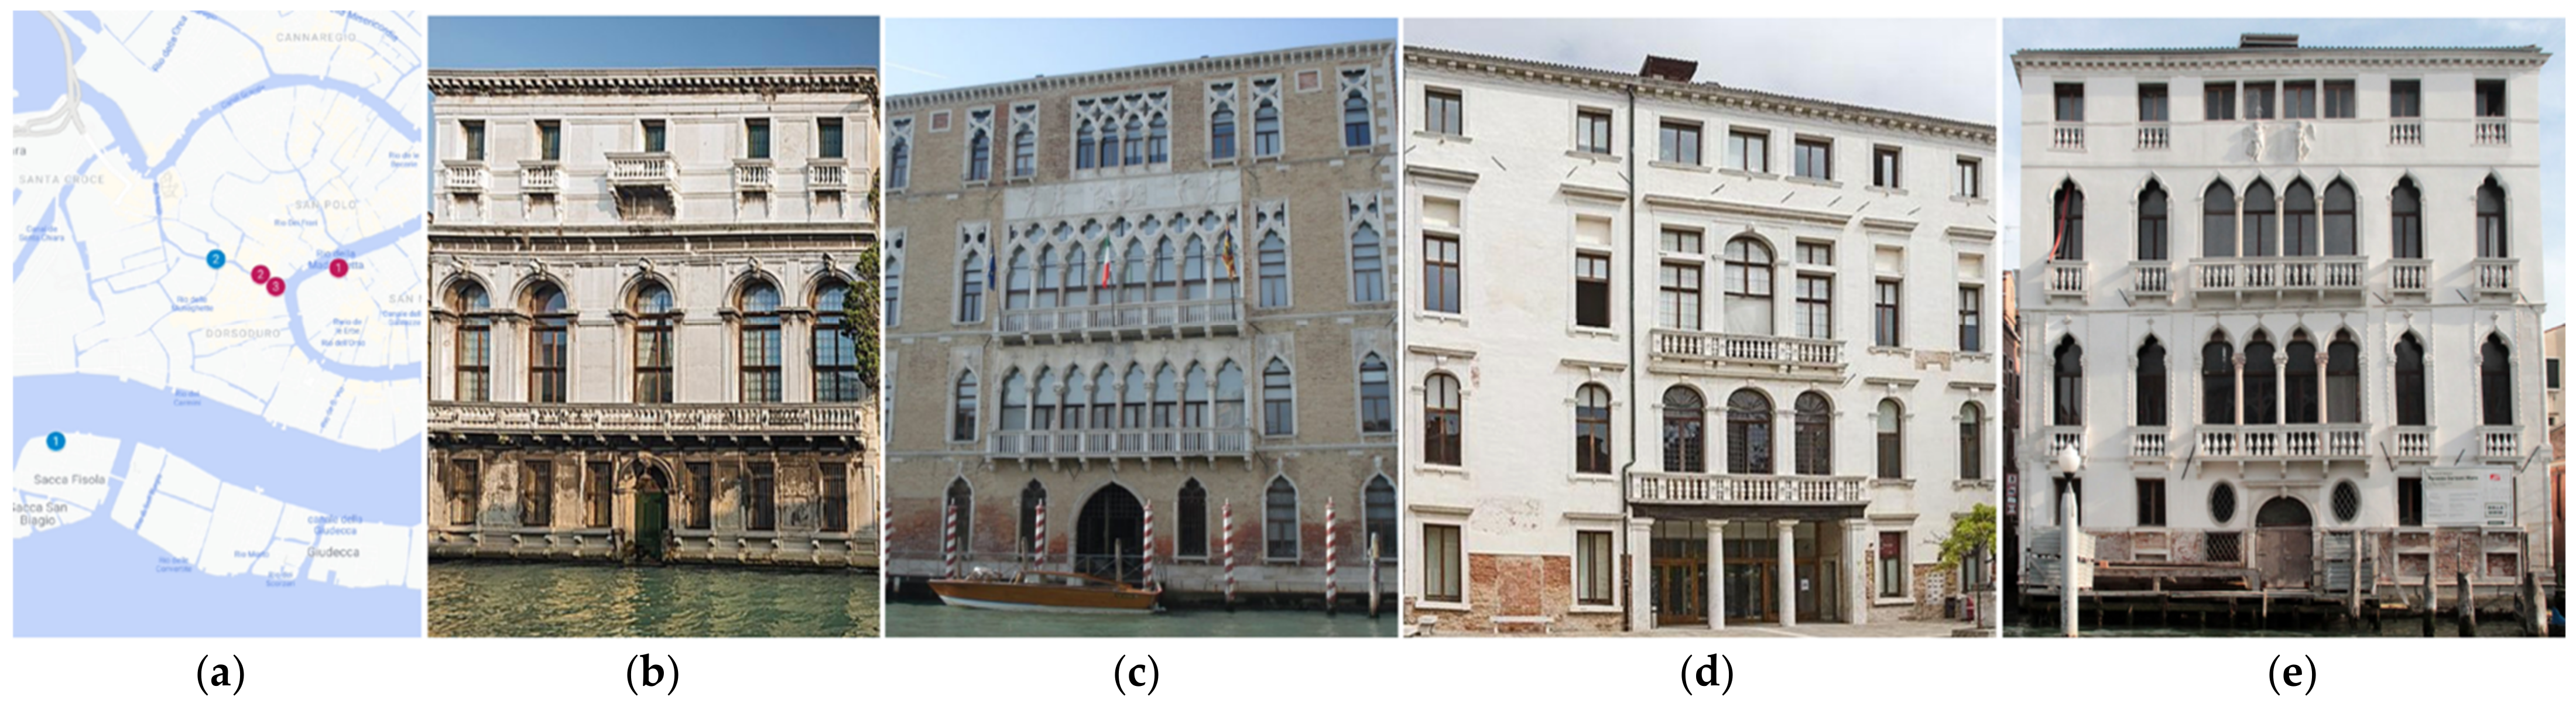
To evaluate the relationships between the specific Venetian environmental condition and the consequent morphological and chemical variations, Ca’ Dolfin (DOL), Ca’ Foscari (CAF), and Garzoni Palace (GAR), were selected (Figure 1 and Figures S1–S4 in Supplementary Materials section). Istria stone surfaces, similar in terms of architectural structures (corbels, balustrade pillars, window frames) and material processing (carved, bush-hammered), are present in each building. Moreover, they have a similar exposure since they are all located within the district of Dorsoduro in a heavy water-traffic area.
The main façades of each building are subjected to slightly different environmental conditions: some of them directly face the canal and one faces an internal courtyard. The façades include jutting structures, such as balconies, columns and shelves, that are less or more exposed to specific environmental impacts. Such differences were considered by applying specific exposure descriptors defined previously [30]: façades facing canals or façades facing internal courtyards; exposed to runoff (E) or sheltered (S).
To observe the variations in the conservation status of the surfaces, the non-invasive survey methodology developed in [30] was applied in 2020 on the points of Ca’ Foscari and Ca’ Dolfin firstly observed in 2015; moreover, the surfaces of Garzoni Palace were included.
To observe the areas of interest, a photographic documentation with a Canon PowerShot G12 camera by Canon Europe N.V., Amsterdamand with portable optical microscope (Dino-Lite AM4133 by ANMOelectronics Corporation, made in Taiwan, at 54× and 124×) was performed.
The selected surface areas were subjected to morphological and profilometric analyses to obtain information on the original texture of the stone, on the erosion and deposition areas, and on patinas and crusts presence. This phase involved casting silicone molds on around 5 cm × 5 cm areas on stone surfaces, their subsequent digitization and processing, and calculation of roughness parameters (Figure 2).
The silicone cast allows for obtaining a faithful reproduction in negative of the surface in scale 1:1. The two-component silicone elastomer GSP-400N® by Prochima® srl, Colli al Metauro, Italy, rubber was chosen since no residues on stones were observed in laboratory tests. The rubber paste was spread in direct contact with the surface and placed with constant and homogeneous pressure. After 8 h, the curing was complete, and the molds were peeled off. The molds were digitized by scanning (600 Dpi scans with HP Photosmart C7280 scanner by Hewlett Packard Inc., USA) and processed with FiJi® ImageJ software [32]. A surface plot was obtained, that is a 3D graph based on the grey levels in which the deep points are indicated by darker colors, while surface points are indicated by lighter colors.
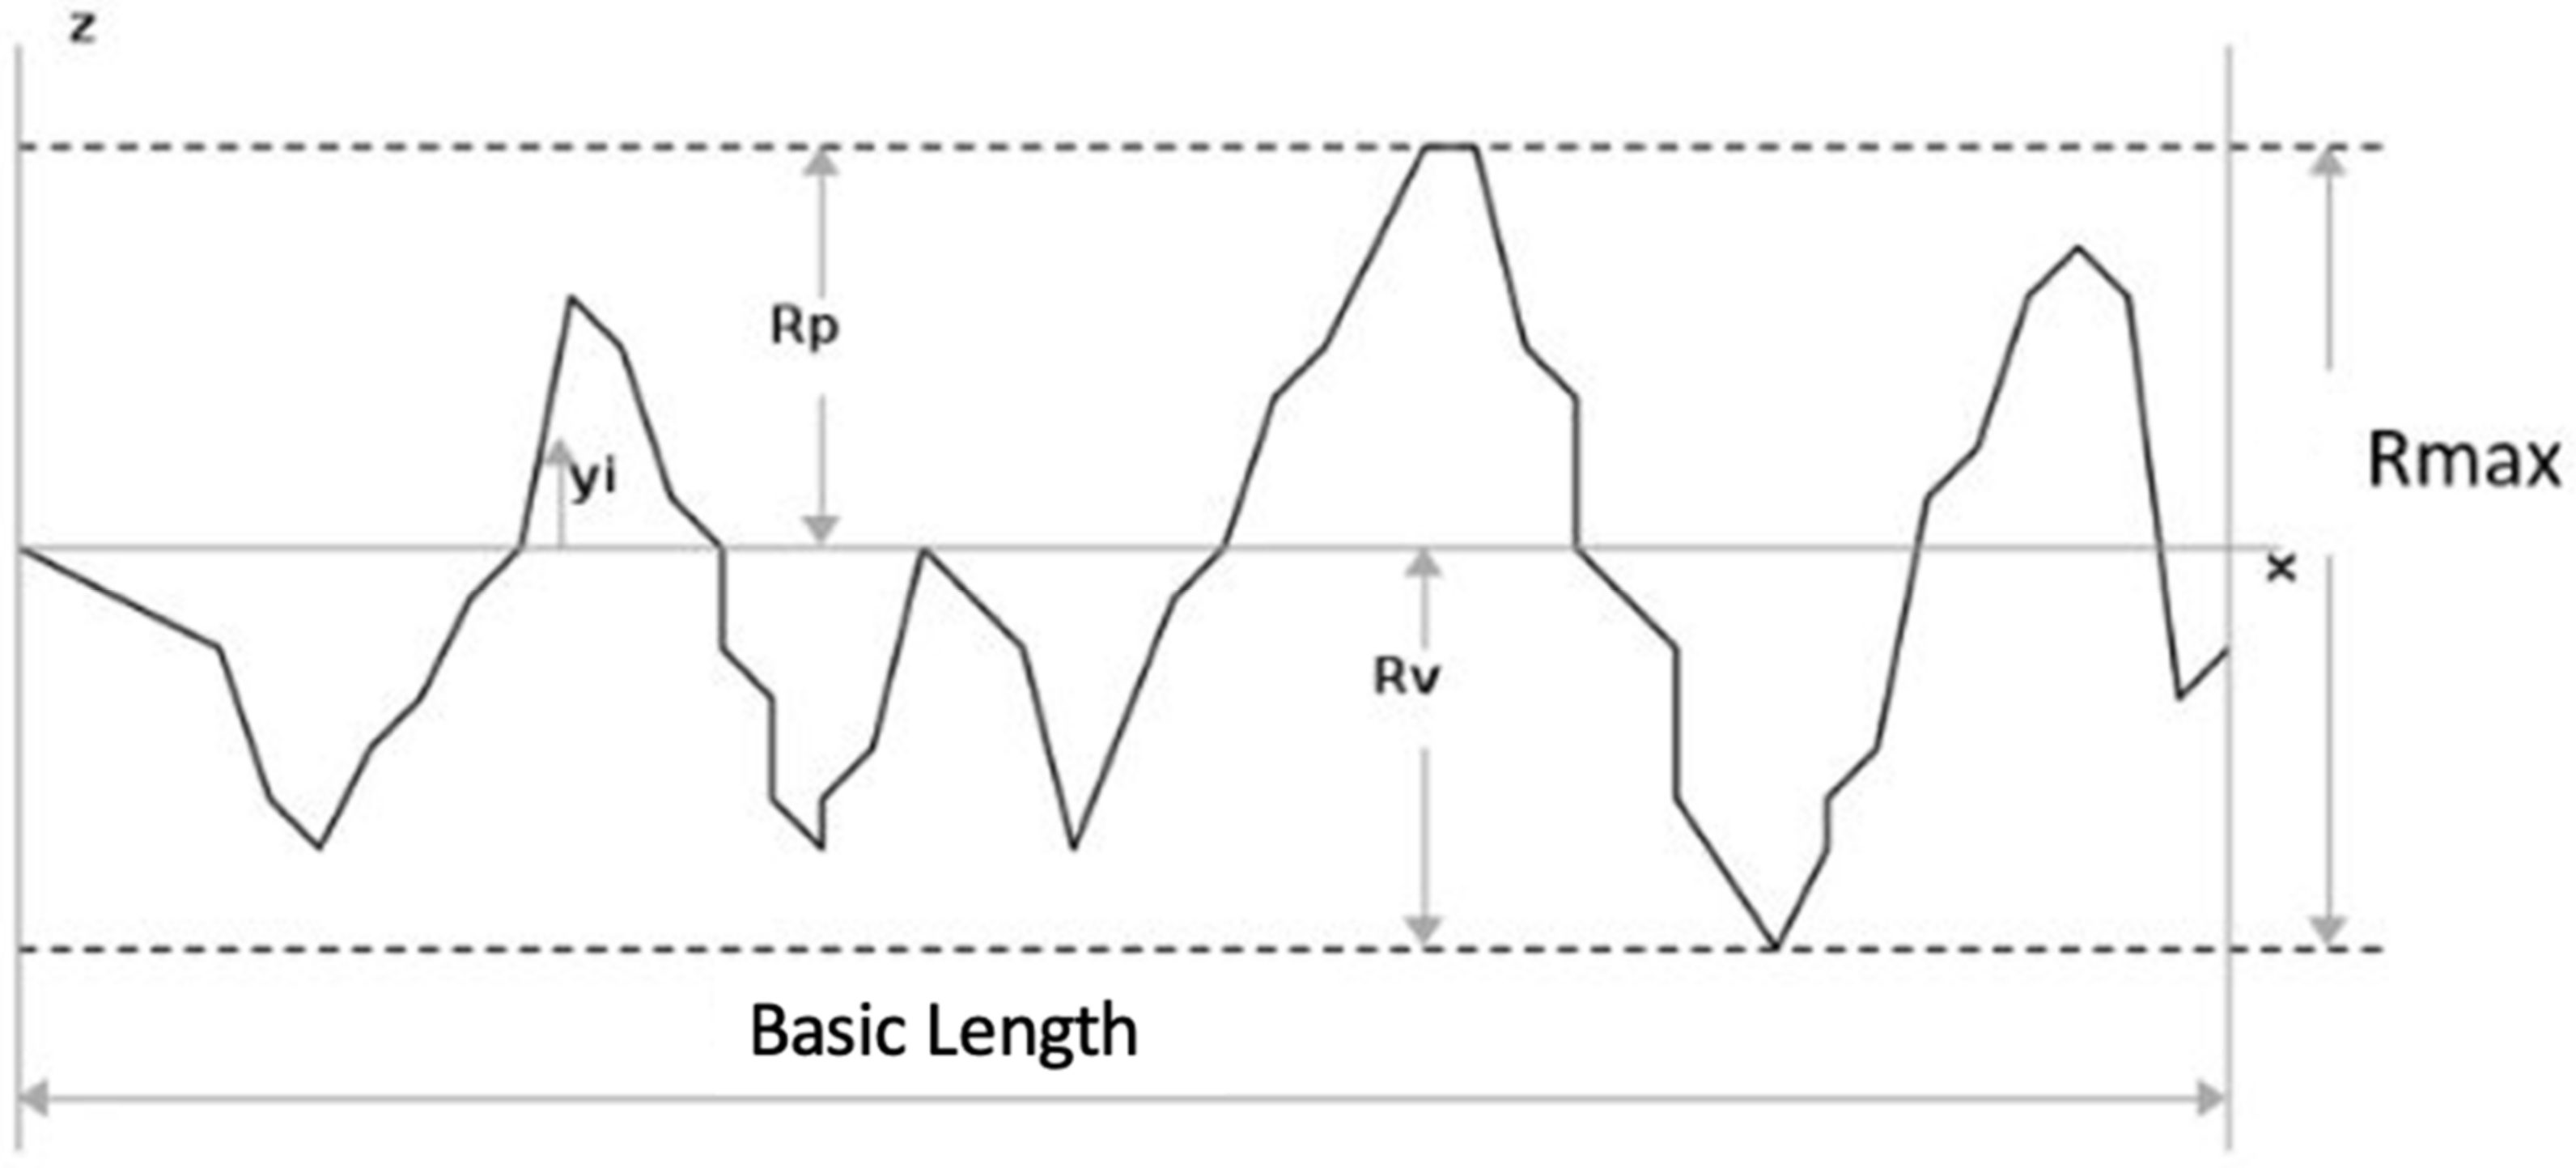
Besides, the surface roughness was evaluated on mold cross-profiles. The molds were cut every 5 mm, and the side sections were digitized and elaborated with Gimp software to detect the profile contours. The contours were measured to obtain the profile length, L0, and the base length, L. The surface roughness parameters, Lr, Ra, Rmax, and R2 (Figure 3), were calculated according to Equations (1)–(3).
where Lr is the roughness estimate, Ra is the average roughness estimate (calculated by considering the areas between the actual profile and the mean line equivalent to rectangle with base, dx, and height, y), Rmax allows the estimation of the maximum irregularities present in a profile, and R2 is the value of data dispersion with respect to the trend line.
Lr = L0/L
Ra = 1/L∫|y|dx
Rmax = (Ypmax) − (Yvmin)
To evaluate the chemical impact of pollutants on Istria stone, sampling of surface deposits was collected by slightly scratching with a scalpel. The collected amount of powder is less than 5 milligrams and was collected in small areas (3 × 3 mm2) to be non-invasive. The obtained powder was analyzed with a Nicolet Nexus 670 Fourier Transform Infrared Spectroscopy (FTIR) instrument. KBr and sample powder 100:1 by volume pellets were measured in transmission mode with a resolution of 4 cm−1, from 4000 cm−1 to 400 cm−1, 68 scan each, with background collected before each sample.
3. Results
3.1. Evaluation of Selected Environmental Indicators
The graphs (Figure 4) depicting the trends of main atmospheric parameters over 20 years in Venice allow us to observe:
- -
- Average concentrations of NOx were high and cause of concern, and the years from 2000 to 2004 showed exceedances of the maximum daily allowable limit by Italian law [33]. Rio Novo station (available for years 2017–2020) recorded the highest average annual concentrations among the considered stations, but in 2020 the trend is downward.
- -
- The SO2 trend has varied greatly over the years; from high concentrations of great concern before 2009, the trend has stabilized toward concentrations less than 10 µg/m3. SO2 is no longer monitored by Arpav, confirming that sulfur dioxide is no longer a critical pollutant.
- -
- Ozone concentrations tend to increase during the warm and sunny periods of the year, and this explains the inconstancy in the concentrations of some years. In addition, there is an upward trend since in recent years there have been prolonged periods with anti-cyclonic situations and high temperatures that have increased the formation of ozone.
- -
- The PM10 trend refers to the years from 2004 to 2020 as the data previously collected were incomplete. Particulate matter shows strong seasonal variability with higher concentrations in winter months. The limit number of annual daily exceedances for PM10 has been significantly surpassed from 2004 to 2008. Additionally, even if PM10 shows a slightly downward trend, high concentrations are maintained over time.
- -
- Concerning PM2.5, the station of Sacca Fisola and Bissuola did not detect this pollutant before 2011. PM2.5 annual concentrations are very high, above the allowed limit value for human safety [25], and an upwards trend is shown for the year 2020.
Comparisons among the data collected in the different stations signify the background green area (Bissuola), background urban area (Sacca Fisola), and intense water-traffic area highlighted slightly higher PM10 values in Bissuola and higher O3 values in Sacca Fisola, while NO2 is similar for the background stations but locally high in Rio Novo, near the Palaces.
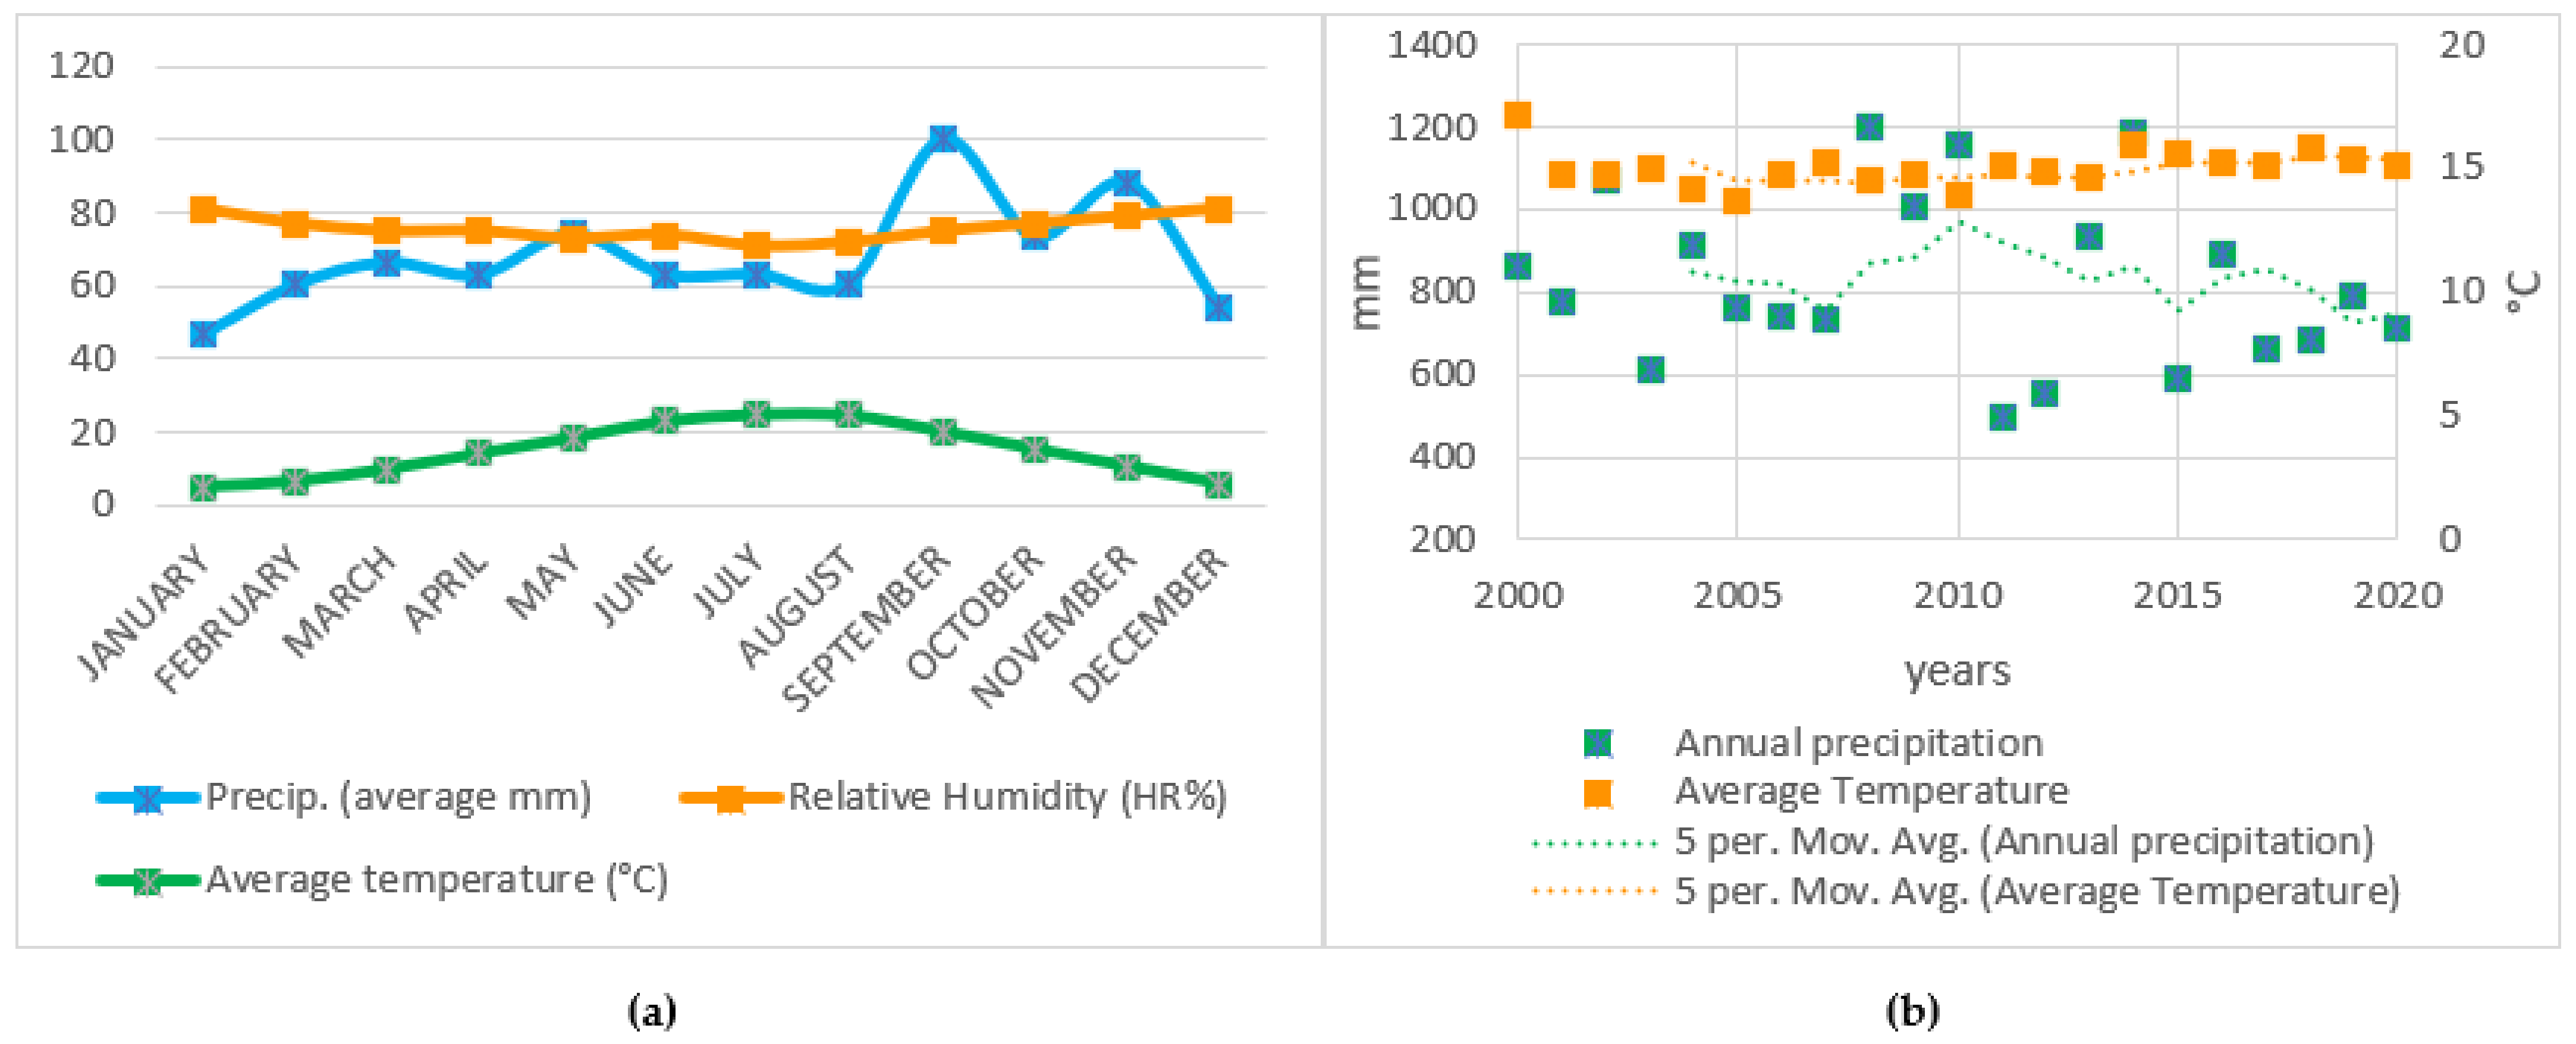
Whenever gaseous pollutants are in touch with water or high-humidity levels, they form aggressive solutions that can attack stone surfaces. Therefore, gaseous concentration trends are to be read in relation to the meteorological variations. Data regarding temperature and rainfall trends from 2000 to 2020 shows that (Figure 5):
- -
- The average temperature over the years has risen, maintaining a rather stable upward trend in recent years, especially in the months of April, May, June, and August.
- -
- The trend of rainfall has diverged a lot over the years; the months that have been found to be rainier are November and September, while January, June–August, and December seem to be less rainy with the passage of time.
- -
- There is evidence of general high-humidity levels in conjunction with static climatic conditions for long periods, leading to low dispersion rates of pollutants. Thus, a consequent increase of pollutant concentration in the historic center is revealed, in particular for NO2 in the Rio Novo station.
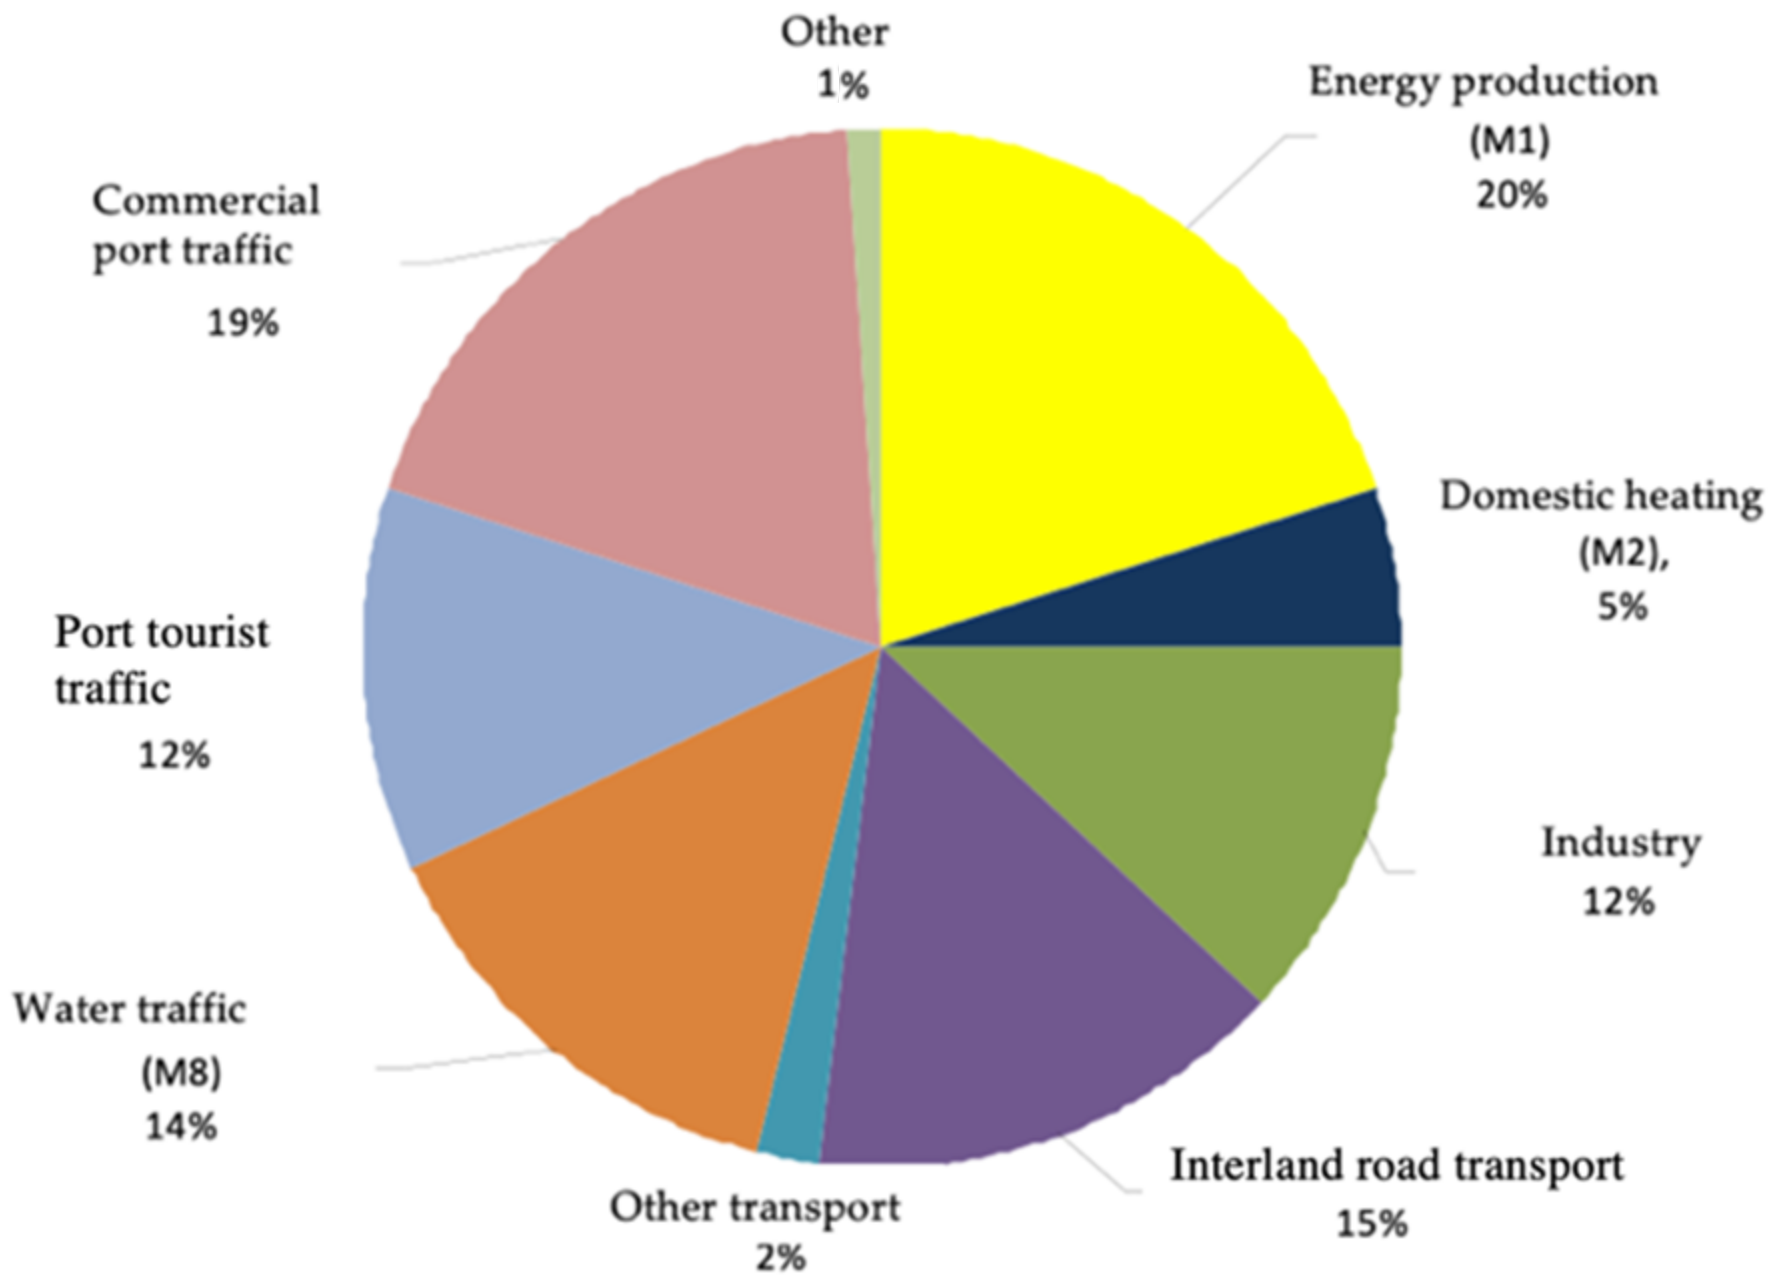
Finally, it is possible to link the percentage distribution of the main pollutant emissions to certain emission sources, thanks to the results of the European project, APICE [26] (Figure 6). It is known that combustion reactions of motor vehicles, thermoelectric power plants, and domestic heating are the main emission sources of NO2, while SO2 emissions are mainly due to the use of fuels for transportation and industrial activity. O3 is not a primary pollutant as it is not directly produced by anthropogenic activity. O3 is formed in the atmosphere due to photochemical reactions from pollutants produced by combustion processes (NOx, hydrocarbons, aldehydes). PPM in Venice is a mixture of PM10 and PM2.5 particles of anthropogenic origin (from industrial activities, vehicular traffic, and heating systems) and from natural sources (sand particles, marine aerosols rich in soluble salts, e.g., NaCl and MgCl2, and organic materials, such as pollen.
Figure 6 shows a graphical elaboration of APICE results [26], highlighting the prominent role of transport and industry as anthropogenic emissions source in Venice. It is the commercial and passenger port traffic that had the greatest impact in the last 20 years, especially due to emissions from cruise ships. Within the city center, the main source is constituted by locally produced emission from water traffic.
3.2. Physico-Chemical and Morphological Evolution of Istrian Stone Surfaces
Some significant examples of the in-situ microscope observation collected in 2015 and 2020 on the same areas of the Ca’ Foscari and Ca’ Dolfin are shown in Table 1. The observations allow us to first make a distinction based on the stone exposure. The exposed surfaces to washout and water runoff (E) show smooth and polished surfaces, sometimes spongy and white or slightly grey. Exposed surfaces exhibit similar characteristics regardless of whether they are on façades overlooking a canal or a courtyard. In some cases, surface erosion revealed the clay veins and sedimentation layers characteristic of the Istria stone. The degradation state of the surface is easily attributable to water erosion due to direct impact with rainfall and water runoff. In sheltered surfaces S dark or greyish colors were always observed. S areas overlooking the canal showed irregular and dendritic crust growths. These areas are subject to the phenomenon of deposition of atmospheric particles.
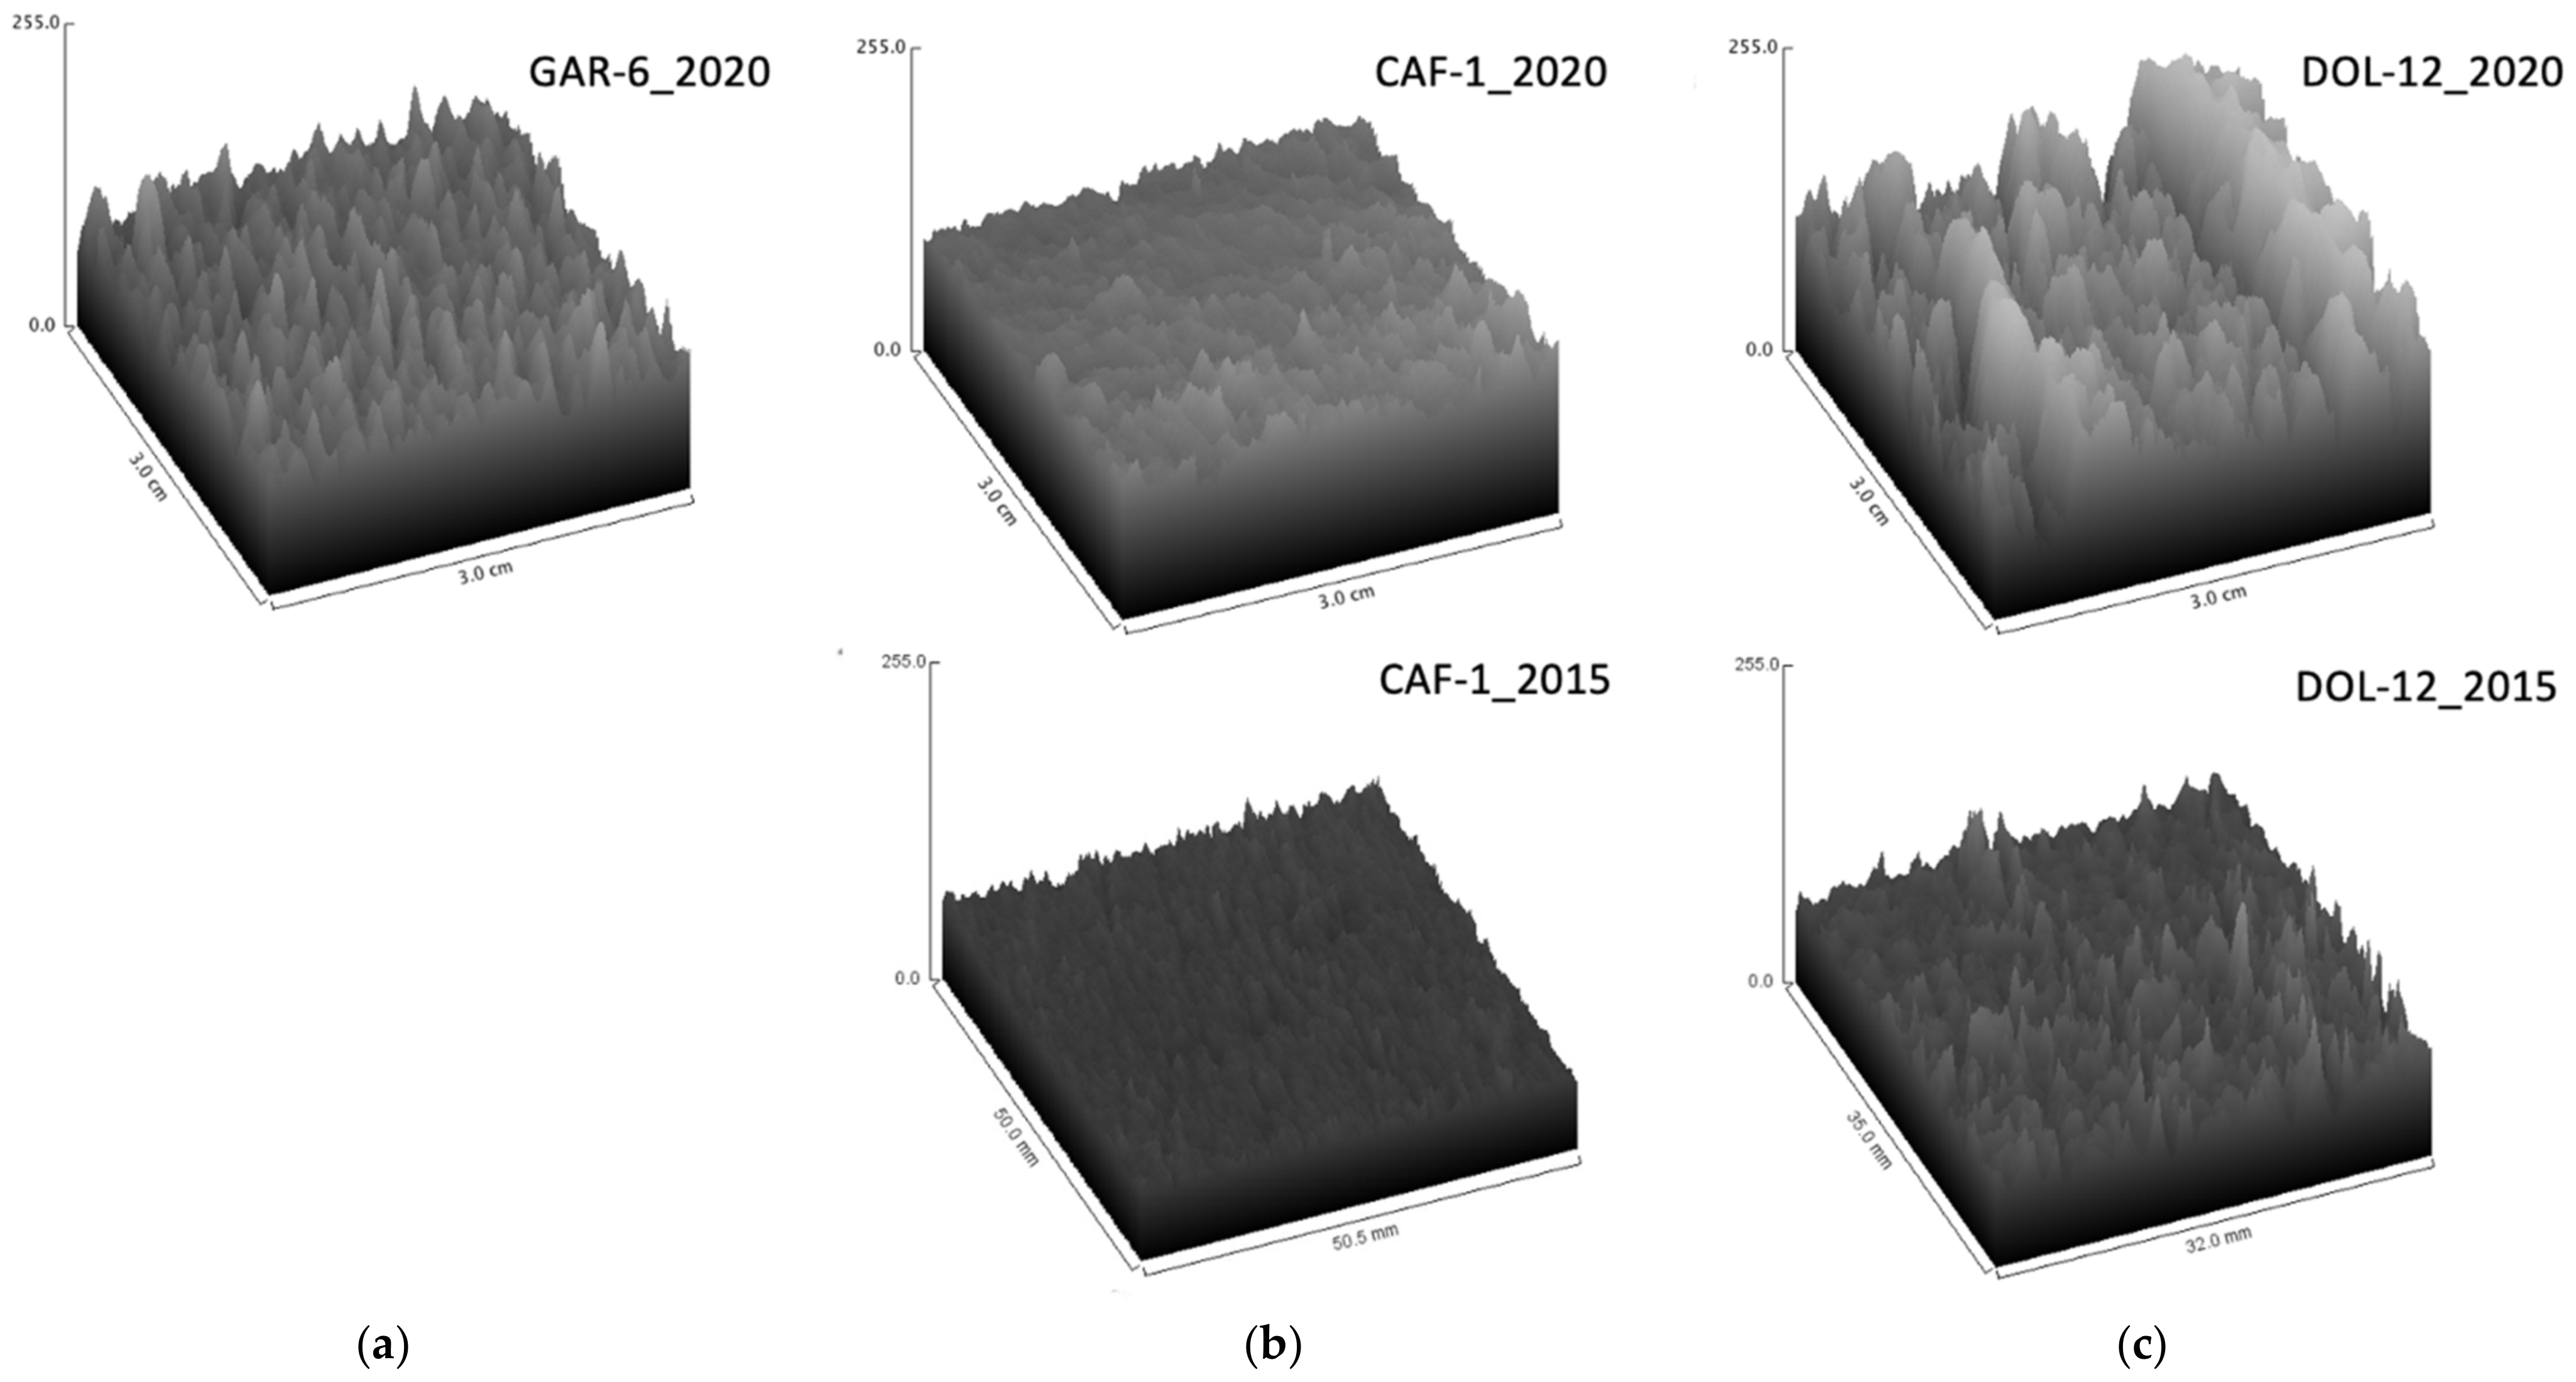
The morphological analysis of the surface allowed us to obtain information about the original structure of the stone. In Figure 7, the selected surface plot in the form of three-dimensional graphs is presented, while further graphs are reported in the Supplementary Material section (Table S1). The surface plots highlighted which areas the bush hammering or smooth finish of the stone were still conserved and not eroded. The surface plots of Garzoni Palace, regardless of location and exposure, appear to be quite homogeneous with each other. All the surface plots show a periodic pattern of ripples, with unevenness at small distances and very similar grey tones, which can be attributed to the surface processing by bush hammering. Going down from the third to the first floor in the Garzoni Palace, the graphs showed more homogeneous grey tones in each plot, pointing out the presence of smoother surfaces, with the loss of the original bush-hammered finish.
The results of the investigated areas of the Ca’ Foscari and Ca’ Dolfin buildings have been compared with the data collected in 2015. Both had smoother and polished surfaces compared to Garzoni Palace, in particular, on the canal where the surfaces are particularly free of ripples and very light and homogeneous in color. The surface plots of the areas facing the internal courtyard show ripples with periodic frequency, which can be traced back to a bush-hammering finish. Some 3D graphs showed deeper ripples forming ridges due to preferential water-runoff paths.
To obtain more information about the roughness of the investigated surfaces and the preservation state, roughness values, Lr, Ra, Rmax, R2, were calculated (Table 2).
As seen also in the surface plots, Garzoni Palace shows rather homogeneous values of roughness among different areas of the same floor, while higher rough values were found on the third floor. The roughness values of Ca’ Foscari surfaces for a similar exposure are homogeneous. The values of the samples taken from the balcony on the second floor turned out to be significantly lower than the roughness of the ones from the first floor. Besides, it is interesting to compare roughness values calculated for cast from façades facing the canal to casts from façades facing the internal courtyard. The latter shows higher roughness values thanks probably to a better conservation of the bush-hammering finish. Even if the Ra and Rmax values of Ca’ Foscari and Garzoni Palace are comparable, the high R2 values indicate a high-data dispersion on the mean line. In fact, some molds present ridges due to runoff and steps between exposed and sheltered areas. In areas characterized by clay veins, the ridges reach heights up to 2 mm. The step between exposed and sheltered area can gives information both on erosion of the more exposed parts and on deposition crust thickness. In Ca’ Foscari and Ca’ Dolfin lower steps (2 ± 1 mm) were measured in comparison to Garzoni palace, and differences up to 3 mm were observed.
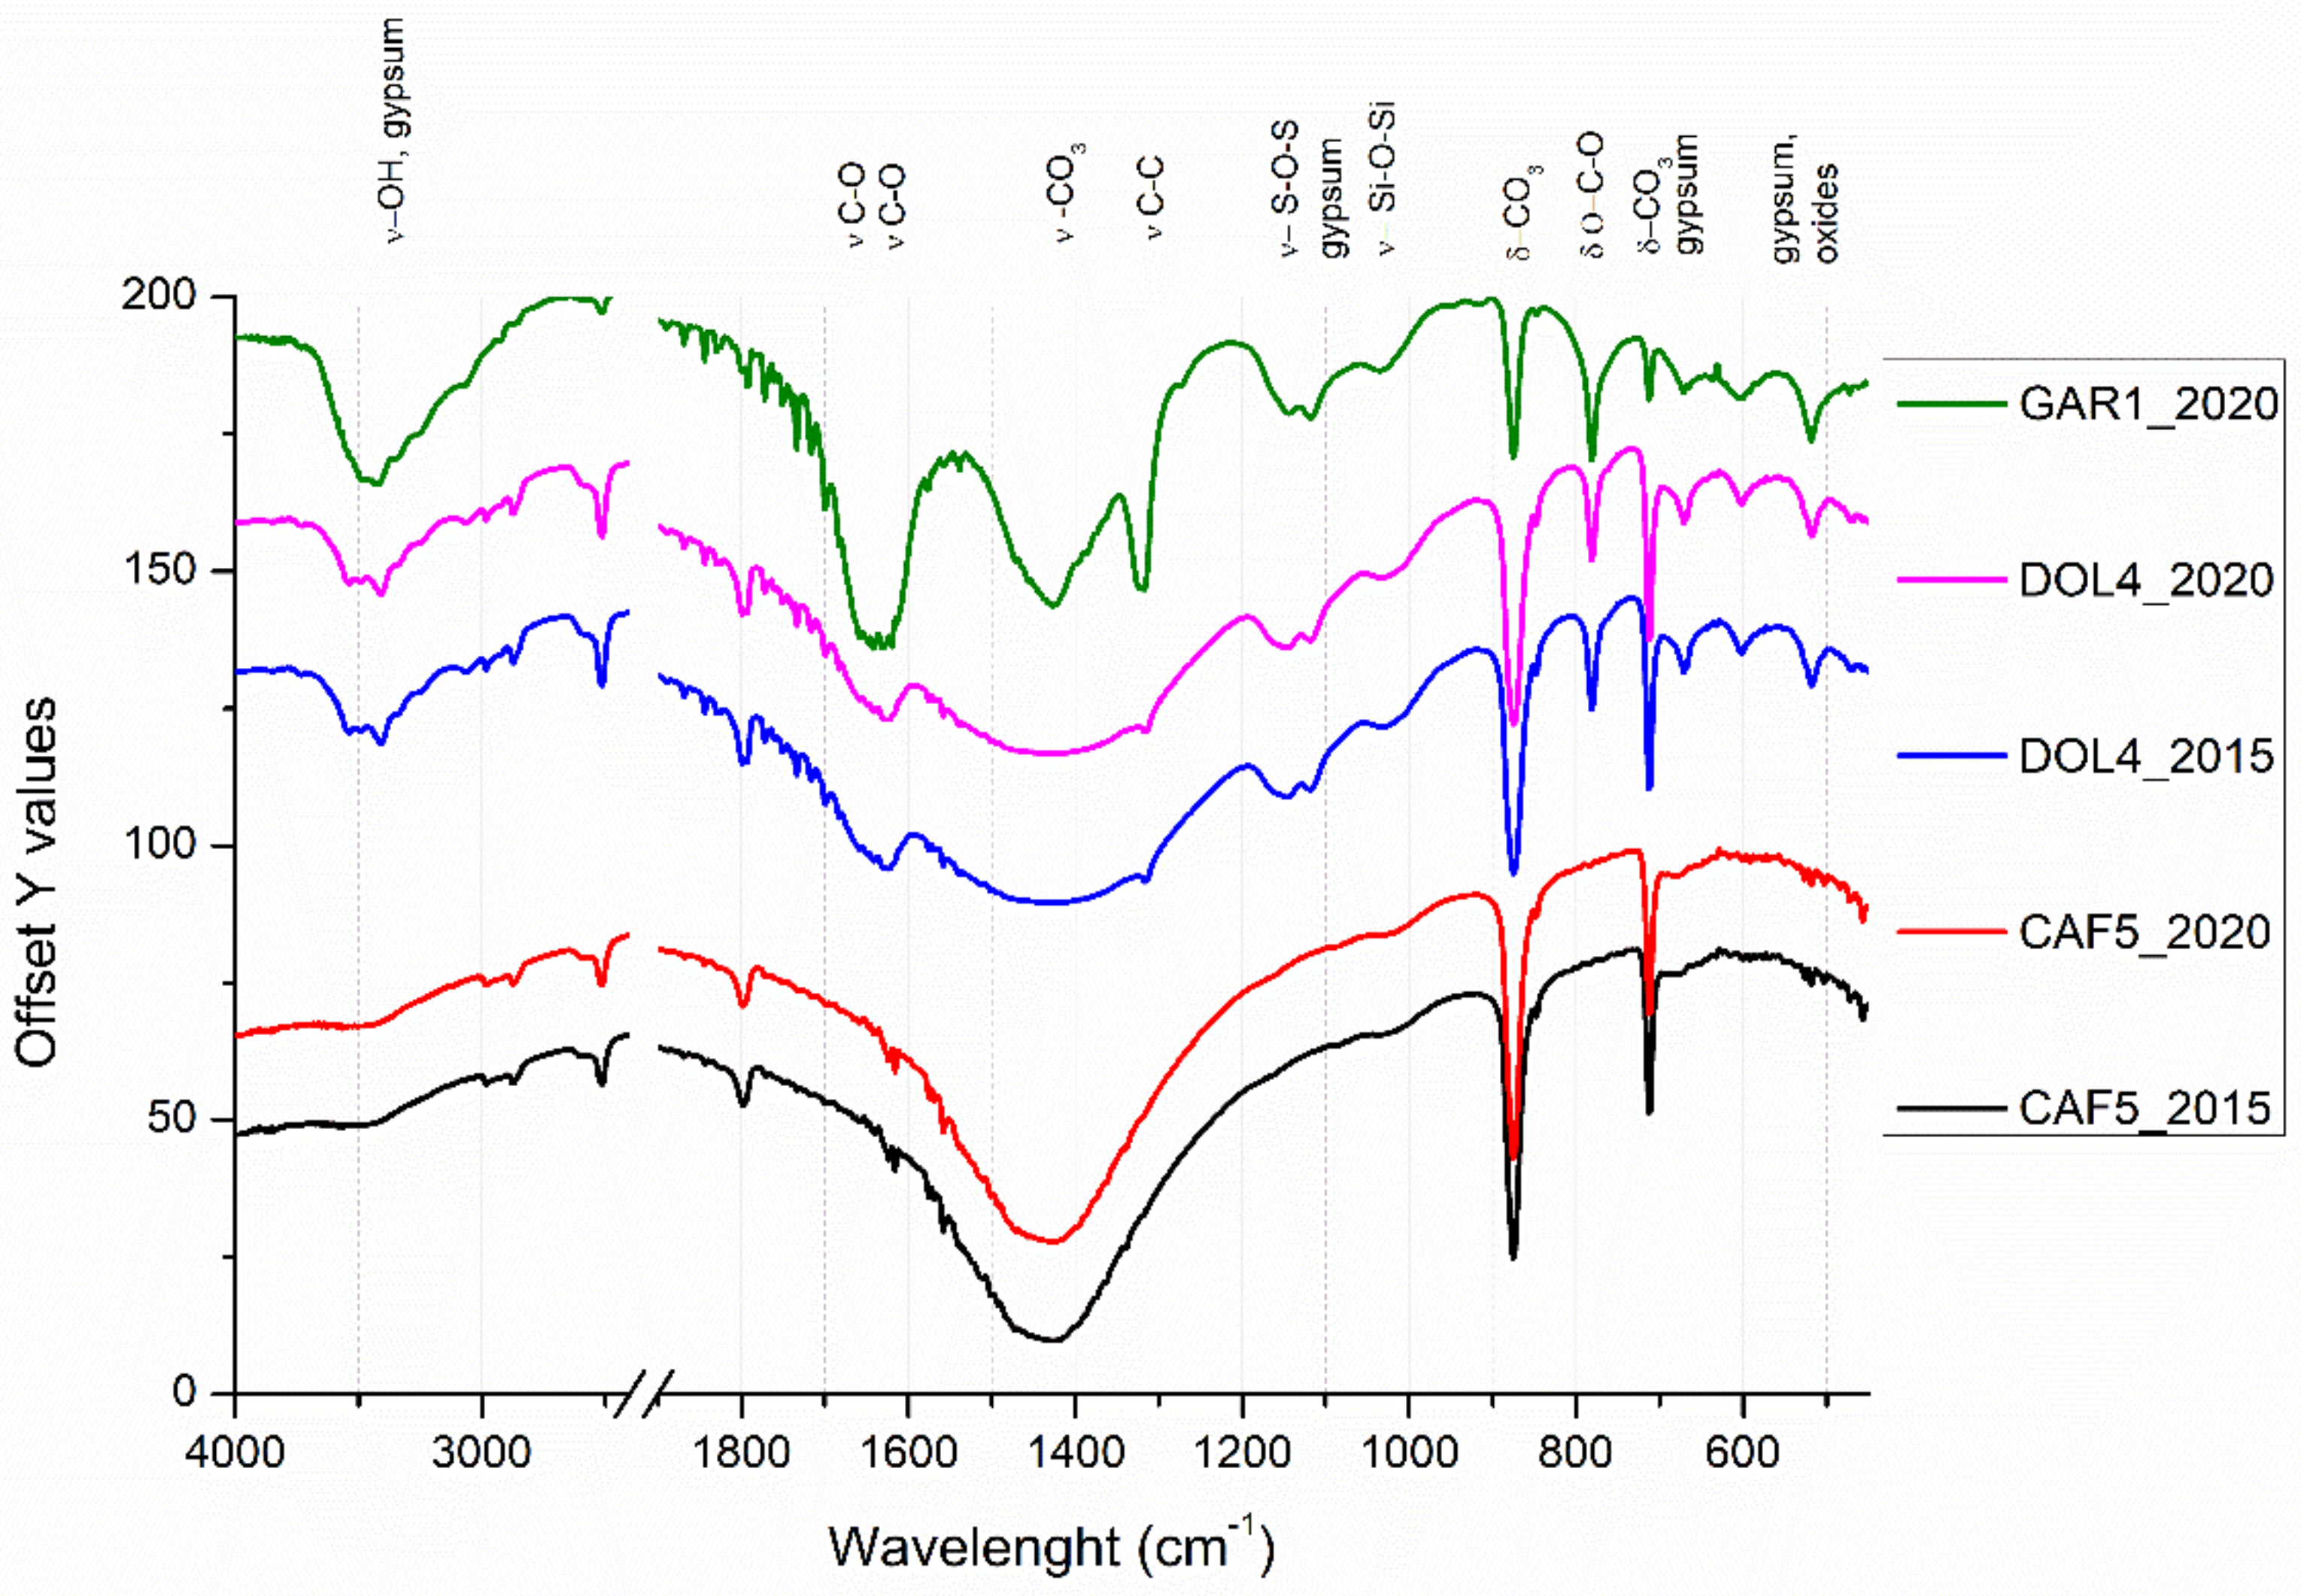
FT-IR spectra of samples collected in 2015 and 2020 (Figure 8) confirmed the naked eye and microscope observations. The characteristic absorptions of the carbonate matrix of the Istrian stone (1440, 875 cm−1) were identified in all the samples. In samples collected from E surfaces, calcium carbonate was the only compound detected, in particular in Ca’ Foscari. The S surfaces showed the presence of different compounds in relation to each building: for some samples from Ca’ Dolfin a diffuse presence of calcium oxalate in the form of whewellite were found (1610, 1315 cm−1) [34]; in the spectra from Garzoni Palace the typical absorption of gypsum was present (3500–3400, 1620, 1100–1050, 700–600 cm−1) [35]; only in a few samples collected from Ca’ Foscari in 2020, gypsum was detected. The comparison among spectra collected in 2015 and 2020 in Ca’ Foscari and Ca’ Dolfin revealed that no new compound due to the interaction of pollutants with the stone was found. Additionally, the presence of gypsum in 2020 in an exposed area of Ca’ Foscari was probably due to deposition from the environment and not to chemical alteration.
4. Discussion
The discussion of air quality and meteorological data pointed out that the air pollutant of most significant concern is NO2, produced locally by water traffic. A slight decrease occurred in the last five years, equal to −14% in the monitoring stations outside the historical city center (Sacca Fisola, Bissuola). On the other hand, the 2017–2020 period monitored at the Rio Novo station shows higher concentrations, exceeding the allowed limit value (except for 2020 due to the COVID-19 epidemic and the tourism stop). Another critical point is found in the number of daily PM10 exceeding the Italian health threshold of 50 µg/m3 [17] where an increasing trend over time is observed with possible negative fallouts on the deposition rate over surfaces.
The climatic conditions of the city in the last five years led to periods of permanence of the pollutants in the presence of high-humidity levels, negatively affecting the air quality condition and favoring the possible chemical interaction with the surfaces. The average rains remained almost constant, but longer drought periods (December–January, June–August) are interrupted by heavy stormy rains, concentrated mainly in September and November. This could lead to erosion phenomena due to heavy water drain off and wind-driven rains. Usually, the presence of marine salts induces decay in limestone materials due to transport by capillarity of salt solutions and salt precipitation within the porosities. However, Istria stone is a compact limestone with a very low open porosity whose decay is mainly induced by water infiltration in clay veins, clay swelling, and stone piece detachments. Therefore, water drain off could be considered as the main environmental stressor. Moreover, the increased presence of CO2 in the atmosphere (from 368.92 ppm of 2000 to 407.58 ppm of 2018 [36], could lead to increased rain acidification and erosion of the stone through the known mechanism described by Winkler [11]. Unfortunately, the local CO2 concentrations were not available.
The results coming from optical microscopy observation, evaluation of morphological and profilometric parameters, and chemical analysis via FT-IR spectroscopy compared to evaluate the conservation state and the variations that occurred on the stone surfaces over a period of five years.
Data collected in 2015 showed that Ca’ Foscari surfaces presented thin grey crusts only in the sheltered areas, probably residues after the cleaning interventions in 2004–2006 and not from new formation; no gypsum was detected in sheltered areas both in 2015 and in 2020. The presence of gypsum on exposed surfaces found in a 2020 analysis was probably due to deposition of gypsum particles, as already observed in Venice, rather than due to a chemical reaction between SO2 and limestone [37]. In fact, SO2 concentration in the atmosphere dropped after the 2000s to low values.
The morphology assessment of exposed areas pointed out the presence of smooth eroded areas probably due to the washout action of rainfall exacerbated by the high NOx levels present in recent years. Similar erosion patterns can be found in exposed parts of Ca’ Dolfin and Garzoni Palace. Ridges due to water runoff are visible in each building with thicknesses up to 4 mm. Moreover, surfaces on the upper floors are more eroded since they are subjected to run-off, while surfaces on the ground floor are more prone to deposition, as highlighted by the darker surfaces and thicker depositions. Patinas and deposits of atmospheric particles were visible both with microscope observation and morphology analysis.
The data collected in 2020 showed similar roughness parameters compared to what had been recorded five years earlier, FT-IR measurements also did not show the presence of different compounds due to deposition. Thus, no critical development of the deterioration patterns was observed, indicating a slow rate of decay processes, such as deposition and erosion, affecting the surface morphology and causing roughness variation. Moreover, the measurement of the steps between protected areas and exposed areas did not increase particularly in five years, highlighting slight effects due to wash out [3,4,5]. The deposition process was also slow during the 2015–2020 periods with no evident new accumulation, probably in relation to the decreasing trend of PPM and SO2.
The different conservation state of surfaces in different exposure and for the same façade at different heights was observed. This information is important to tailor future monitoring on our case studies and generally on other buildings. It is crucial to consider the possible exposure situations in relation to environmental impacts. Besides, wherever a choice of applying protective coating is taken, we might expect that their effectiveness will vary or decrease over time in relation to the exposure. Therefore, an extensive monitoring of the protected surfaces is necessary to evaluate its effectiveness in the long run by including the different exposures pointed out in this paper. This monitoring could also possibly be included in conservation and maintenance plans to inform the decision makers and stakeholders.
5. Conclusions
The monitoring methodology developed in this research allowed usto estimate the physico-chemical and morphological variations of the surfaces in relation to environmental impacts, thus evaluating the limestone surface vulnerability. The five-year time between the two monitoring campaigns allowed us to provide significant information on the possible occurring variations due to external changes of air quality and meteo-climatic variations. The study of a 20-year trend regarding atmospheric pollutants of anthropic and natural origin together with the evaluation of main climatic conditions allowed us to gain knowledge on the main hazards threatening Istria’s stone surface conservation in the historical center of Venice.
The application of molds and their digitalization were demonstrated to be a non-expensive, reliable, and affordable methodology for monitoring morphology variation in Istria stone and for understanding the impact of the environment depending on the original textures, position, and exposure of the stone. Moreover, the data integration with naked eye observations, digital portable microscopes, and FT-IR measurements provided sufficient and necessary information on the surfaces’ conservation state without further complex analysis. Morphological analysis showed that smoothing effects along with preferential water paths forming ridges and ripples are the main degradation patterns of Istria stone surfaces. Differences were found on façades facing the canal, more exposed to the runoff phenomenon, and surfaces facing the inner garden-courtyard, more sheltered, but also by considering the different floors of the same façade with the lower ones in a better conservation state. The research pointed out the environmental impacts on the investigated Istria stone surfaces and allowed the implementation of the monitoring instrument. In particular, the differences observed among exposures at increasing heights suggest that the monitoring plan should include the evaluation of the façade from the ground floor to the top-floor to obtain a complete evaluation of the conservation state and/or intervention durability.
Supplementary Materials
The following supporting information can be downloaded at: https://www.mdpi.com/article/10.3390/atmos13071036/s1, Figure S1: Geographical location of the case studies: (1) Garzoni Palace; (2); Ca’ Dolfin; (3) Ca’ Foscari; Figure S2: Sampling points in Garzoni Palace façade on the canal; Figure S3: Sampling points on Ca’ Foscari façade on canals and internal courtyard; Figure S4: Sampling points on Ca’ Dolfin façade on the canal; Table S1: 8-bit scan of molds and surface plots for Garzoni Palace, Ca’ Foscari, Ca’ Dolfin in 2015 and 2020.
Author Contributions
Conceptualization, L.F. and E.Z.; methodology, LF.; software, MG.; validation, MG.; investigation, MG.; resources, E.Z.; data curation, M.G.; writing—original draft preparation, M.G. and L.F.; writing—review and editing, E.Z.; funding acquisition, E.Z. All authors have read and agreed to the published version of the manuscript.
Funding
Ministero delle infrastrutture e delle Mobilità Sostenibili- Provveditorato Interregionale per le Opere Pubbliche del Veneto-Trentino Alto Adige- “Friuli Venezia Giulia” già Magistrato alle Acque di venezia tramite il Consorzio Venezia Nuova. Grant nr CUP D51B02000050001.
Institutional Review Board Statement
Not applicable.
Informed Consent Statement
Not applicable.
Data Availability Statement
Open data by Arpav available at www.arpa.veneto.it, last accessed on 12 May 2022.
Acknowledgments
We thankfully acknowledge Eleonora Balliana for her support during the sampling. Scientific activity performed in the Research Programme Venezia 2021, coordinated by CORILA, with the contribution of the Provveditorato for the Public Works of Veneto, Trentino Alto Adige and Friuli Venezia Giulia.
Conflicts of Interest
The authors declare no conflict of interest.
References
- Rebollo, V.; Latinos, V. Good Practices in Building Cultural Heritage Resilience. 2020. Available online: https://savingculturalheritage.eu/fileadmin/user_upload/Deliverables/ARCH_D7.2_GoodPractices.pdf (accessed on 12 May 2022).
- Council of Europe of the Committee of Ministers to Member States on “Hate Speech”. In Council of Europe; Council of Europe: Strasbourg, France, 1997; pp. 106–108.
- Vidorni, G.; Sardella, A.; de Nuntiis, P.; Volpi, F.; Dinoi, A.; Contini, D.; Comite, V.; Vaccaro, C.; Fermo, P.; Bonazza, A. Air Pollution Impact on Carbonate Building Stones in Italian Urban Sites. Eur. Phys. J. Plus 2019, 134, 439. [Google Scholar] [CrossRef]
- Sardella, A.; Palazzi, E.; von Hardenberg, J.; del Grande, C.; de Nuntiis, P.; Sabbioni, C.; Bonazza, A. Risk Mapping for the Sustainable Protection of Cultural Heritage in Extreme Changing Environments. Atmosphere 2020, 11, 700. [Google Scholar] [CrossRef]
- Barca, D.; Comite, V.; Belfiore, C.M.; Bonazza, A.; la Russa, M.F.; Ruffolo, S.A.; Crisci, G.M.; Pezzino, A.; Sabbioni, C. Impact of Air Pollution in Deterioration of Carbonate Building Materials in Italian Urban Environments. Appl. Geochem. 2014, 48, 122–131. [Google Scholar] [CrossRef]
- Haugen, A.; Bertolin, C.; Leijonhufvud, G.; Olstad, T.; Broström, T. A Methodology for Long-Term Monitoring of Climate Change Impacts on Historic Buildings. Geosciences 2018, 8, 370. [Google Scholar] [CrossRef] [Green Version]
- Price, C.; Amoroso, G.; Fassina, V. Stone Decay and Conservation: Atmospheric Pollution, Cleaning, Consolidation and Protection. Stud. Conserv. 1984, 29, 158. [Google Scholar] [CrossRef]
- Charola, A.E.; Price, C.A. Stone Conservation: An Overview of Current Research; The Getty Conservation Institute: Los Angeles, CA, USA, 1998; Volume 37. [Google Scholar]
- Zendri, E.; Biscontin, G.; Kosmidis, P. Effects of Condensed Water on Limestone Surfaces in a Marine Environment. J. Cult. Herit. 2001, 2, 283–289. [Google Scholar] [CrossRef]
- Morabito, E.; Zendri, E.; Piazza, R.; Ganzerla, R.; Montalbani, S.; Marcoleoni, E.; Bonetto, F.; Scandella, A.; Barbante, C.; Gambaro, A. Deposition in St. Mark’s Basilica of Venice. Environ. Sci. Pollut. Res. 2013, 20, 2579–2592. [Google Scholar] [CrossRef]
- Winkler, E.M. Stone: Properties, Durability in Man’s Environment, 2nd ed.; Springer: Berlin/Heidelberg, Germany, 1975. [Google Scholar]
- Török, Á.; Rozgonyi, N. Morphology and Mineralogy of Weathering Crusts on Highly Porous Oolitic Limestones, a Case Study from Budapest. Environ. Geol. 2004, 46, 333–349. [Google Scholar] [CrossRef]
- Urosevic, M.; Yebra-Rodríguez, A.; Sebastián-Pardo, E.; Cardell, C. Black Soiling of an Architectural Limestone during Two-Year Term Exposure to Urban Air in the City of Granada (S Spain). Sci. Total Environ. 2012, 414, 564–575. [Google Scholar] [CrossRef]
- Di Turo, F.; Proietti, C.; Screpanti, A.; Fornasier, M.F.; Cionni, I.; Favero, G.; de Marco, A. Impacts of Air Pollution on Cultural Heritage Corrosion at European Level: What Has Been Achieved and What Are the Future Scenarios. Environ. Pollut. 2016, 218, 586–594. [Google Scholar] [CrossRef]
- Rubinetti, S.; Taricco, C.; Alessio, S.; Rubino, A.; Bizzarri, I.; Zanchettin, D. Robust Decadal Hydroclimate Predictions for Northern Italy Based on a Twofold Statistical Approach. Atmosphere 2020, 11, 671. [Google Scholar] [CrossRef]
- Bertolin, C. Preservation of Cultural Heritage and Resources Threatened by Climate Change. Geosciences 2019, 9, 250. [Google Scholar] [CrossRef] [Green Version]
- Vianello, L.; Pistollato, S. Annual Report on Air Qualitiy in Venice 2012–2013 Qualità Dell ’ Aria Provincia Di Venezia Relazione Annuale 2012. 2013. Available online: https://www.arpa.veneto.it/arpav/chi-e-arpav/file-e-allegati/dap-venezia/aria/RQA_2012_Provincia.pdf/view (accessed on 12 May 2022).
- del Fà, R.M.; Riminesi, C.; Tiano, P. Monitoring of the Surface Pattern of Artistic and Architectural Artefacts by Means of Ultra Close Range Photogrammetry. Eur. J. Sci. Theol. 2015, 11, 179–187. [Google Scholar]
- Spagnolo, G.S.; Ambrosini, D.; Paoletti, D.; Accardo, G. Fibre Optic Projected Fringes for Monitoring Marble Surface Status. J. Cult. Herit. 2000, 1, S337–S343. [Google Scholar] [CrossRef]
- Huerto-Cardenas, H.E.; Aste, N.; del Pero, C.; Della Torre, S.; Leonforte, F. Effects of Climate Change on the Future of Heritage Buildings: Case Study and Applied Methodology. Climate 2021, 9, 132. [Google Scholar] [CrossRef]
- Marani, A.; Benvenuto, F.; Cerasuolo, M. Database of the Project “Sistema Lagunare Veneziano”. Nat. Hazards 1999, 20, 311–321. [Google Scholar] [CrossRef]
- Fassina, V. A Survey on Air Pollution and Deterioration of Stonework in Venice. Atmos. Environ. 1978, 12, 2205–2211. [Google Scholar] [CrossRef]
- Contini, D.; Gambaro, A.; Belosi, F.; de Pieri, S.; Cairns, W.R.L.; Donateo, A.; Zanotto, E.; Citron, M. The Direct Influence of Ship Traffic on Atmospheric PM2.5, PM10 and PAH in Venice. J. Environ. Manag. 2011, 92, 2119–2129. [Google Scholar] [CrossRef]
- Isoldi, K.; Cerasuolo, M. Centro Previsioni e Segnalazioni Maree-Municipality of Venice, Open Dataset. Available online: https://www.comune.venezia.it/it/content/la-precipitazione-venezia-a-venezia (accessed on 12 May 2022).
- Air Quality Reports, Open data by Arpav. Available online: www.arpa.veneto.it (accessed on 12 May 2022).
- Emission_Inventory_Venice.xls Content @. Available online: www.Apice-Project.Eu (accessed on 12 May 2022).
- Critto, A.; Agostini, P. Using Multiple Indices to Evaluate Scenarios for the Remediation of Contaminated Land: The Porto Marghera (Venice, Italy) Contaminated Site. Environ. Sci. Pollut. Res. 2009, 16, 649–662. [Google Scholar] [CrossRef]
- Valotto, G.; Zannoni, D.; Rampazzo, G.; Visin, F.; Formenton, G.; Gasparello, A. Characterization and Preliminary Risk Assessment of Road Dust Collected in Venice Airport (Italy). J. Geochem. Explor. 2018, 190, 142–153. [Google Scholar] [CrossRef]
- Merico, E.; Cesari, D.; Gregoris, E.; Gambaro, A.; Cordella, M.; Contini, D. Shipping and Air Quality in Italian Port Cities: State-of-the-Art Analysis of Available Results of Estimated Impacts. Atmosphere 2021, 12, 536. [Google Scholar] [CrossRef]
- Falchi, L.; Orio, E.; Balliana, E.; Izzo, F.C.; Zendri, E. Investigation on the Relationship between the Environment and Istria Stone Surfaces in Venice. Atmos. Environ. 2019, 210, 76–85. [Google Scholar] [CrossRef]
- Naletto, A. Il Restauro Conservativo Delle Facciate Di Ca’ Foscari. In Ca’ Foscari Storia e Restauro del Palazzo dell’Università di Venezia; Pilo, G.M., De Rossi, L., Alessandri, D., Zuanier, F., Eds.; Marsilio Editore: Venice, Italy, 2005; pp. 166–173. [Google Scholar]
- Schindelin, J.; Arganda-Carreras, I.; Frise, E.; Kaynig, V.; Longair, M.; Pietzsch, T.; Preibisch, S.; Rueden, C.; Saalfeld, S.; Schmid, B. Fiji: An Open-Source Platform for Biological-Image Analysis. Nat. Methods 2012, 9, 676–682. [Google Scholar] [CrossRef] [PubMed] [Green Version]
- Sgobbi, M.; Brimblecombe, P.; Grossi, C.; Biscontin, G.; Zendri, E. Surface Stratigraphy on Limestone of Venetian Palaces. J. Archit. Conserv. 2010, 16, 51–70. [Google Scholar] [CrossRef]
- Berthomieu, C.; Hienerwadel, R. Fourier Transform Infrared (FTIR) Spectroscopy. Photosynth. Res. 2009, 101, 157–170. [Google Scholar] [CrossRef]
- Suzuki, A.; Vettori, S.; Giorgi, S.; Carretti, E.; di Benedetto, F.; Dei, L.; Benvenuti, M.; Moretti, S.; Pecchioni, E.; Costagliola, P. Laboratory Study of the Sulfation of Carbonate Stones through SWIR Hyperspectral Investigation. J. Cult. Herit. 2018, 32, 30–37. [Google Scholar] [CrossRef]
- Available online: https://www.Eea.Europa.Eu/Data-and-Maps/Daviz/Atmospheric-Concentration-of-Carbon-Dioxide-5/#tab-Chart_6 (accessed on 12 May 2022).
- Maravelaki-Kalaitzaki, P.; Biscontin, G. Origin, Characteristics and Morphology of Weathering Crusts on Istria Stone in Venice. Atmos. Environ. 1999, 33, 1699–1709. [Google Scholar] [CrossRef]
Figure 1.
(a) Geographical location of the case studies (red dots) and of Sacca Fisola (blue dot 1) and Rio Novo (blue dot 2) meteorological stations; (b) Ca’Dolfin façade; (c) Ca’ Foscari façade on Grand Canal; (d) Ca’ Foscari internal courtyard; (e) Garzoni Palace façade.
Figure 1.
(a) Geographical location of the case studies (red dots) and of Sacca Fisola (blue dot 1) and Rio Novo (blue dot 2) meteorological stations; (b) Ca’Dolfin façade; (c) Ca’ Foscari façade on Grand Canal; (d) Ca’ Foscari internal courtyard; (e) Garzoni Palace façade.

Figure 2.
Graphical representation of morphological measurement methodology. Istria stone elements of the façade are selected, photographed, and observed with a portable microscope; rubber molds are casted and digitized; few milligrams of powder were sampled for FT-IR analysis. The micrographs measures 5 cm × 5 cm.

Figure 3.
Graph depicting the main parameter, Rmax; basic length, L, for calculating roughness values. Z axis represent the height dimension of a surface, x represent the length dimension.
Figure 3.
Graph depicting the main parameter, Rmax; basic length, L, for calculating roughness values. Z axis represent the height dimension of a surface, x represent the length dimension.

Figure 4.
Trend of annual average pollutant concentrations of NO2, SO2, O3, PM10, PM2.5 collected from the stations of: (a) Bissuola; (b) Sacca Fisola; (c) Rio Novo.
Figure 4.
Trend of annual average pollutant concentrations of NO2, SO2, O3, PM10, PM2.5 collected from the stations of: (a) Bissuola; (b) Sacca Fisola; (c) Rio Novo.

Figure 5.
Arpav data elaboration: (a) monthly division for the 2000–2020 period of average precipitation (mm) in blue, average relative humidity (HR%) in orange, average temperature (°C) in green; (b) average annual precipitation and mean temperature from 2000 to 2020 with five year moving averages (dot lines).

Figure 6.
Pie chart of annual emission sources based on APICE results.

Figure 7.
Significant examples of surface plots collected in (a) Garzoni Palace; (b) Ca’ Foscari; (c) Ca’ Dolfin in 2020 (above), and in 2015 (below).
Figure 7.
Significant examples of surface plots collected in (a) Garzoni Palace; (b) Ca’ Foscari; (c) Ca’ Dolfin in 2020 (above), and in 2015 (below).

Figure 8.
Significant examples of FT-IR spectra collected from sheltered areas of Garzoni Palace (GAR), Ca’ Foscari (CAF), and Ca’ Dolfin (DOL) in the years 2015 and 2020. The main stretching and bending absorption of calcium carbonate, weddellite, and gypsum are indicated.
Figure 8.
Significant examples of FT-IR spectra collected from sheltered areas of Garzoni Palace (GAR), Ca’ Foscari (CAF), and Ca’ Dolfin (DOL) in the years 2015 and 2020. The main stretching and bending absorption of calcium carbonate, weddellite, and gypsum are indicated.


Table 1.
Microscopical observation (54×) of the surfaces of Garzoni Palace, Ca’ Foscari, and Ca’ Dolfin calculated for 2015–2020.
Table 1.
Microscopical observation (54×) of the surfaces of Garzoni Palace, Ca’ Foscari, and Ca’ Dolfin calculated for 2015–2020.
| Exposed (E) Surfaces | Sheltered (S) Surfaces | ||
|---|---|---|---|
| Palace | Year | Dino-Lite Photo Scale Bar 2 mm =  | Dino-Lite Photo Scale Bar 2 mm =  |
| Garzoni Palace | 2020 |  |  |
| - | - | - | |
| Ca’ Foscari | 2020 |  |  |
| 2015 |  |  | |
| Ca’ Dolfin | 2020 |  |  |
| 2015 |  |  |
Table 2.
Roughness values for Garzoni Palace, Ca’ Foscari, and Ca’ Dolfin calculated in 2020–2015.
| Palace | Year | Exposition | Lr ± σ mm | Ra | Rmax ± σ mm | R2 |
|---|---|---|---|---|---|---|
| Garzoni Palace | 2020 2020 | GAR-E-canal GAR-S-canal | 1.22 ± 0.08 1.23 ± 0.07 | 0.24 0.30 | 1.40 ± 0.11 1.56 ± 0.12 | 0.34 0.26 |
| - | - | - | - | - | - | |
| Ca’ Foscari | 2020 2020 | CAF-E-canal CAF-S-courtyard | 1.19 ± 0.11 1.23 ± 0.05 | 0.20 0.30 | 1.31 ± 0.16 1.65 ± 0.06 | 0.46 0.31 |
| 2015 2015 | CAF-E-canal CAF-S-courtyard | 1.19 ± 0.24 1.22 ± 0.08 | 0.21 0.30 | 1.29 ± 0.06 1.61 ± 0.11 | 0.50 0.42 | |
| Ca’ Dolfin | 2020 2020 | DOL-S-canal DOL-S-courtyard | 1.22 ± 0.13 1.29 ± 0.10 | 0.29 0.35 | 0.14 ± 0.15 0.24 ± 0.09 | 0.11 0.14 |
| 2015 2015 | DOL-S-canal DOL-S-courtyard | 1.23 ±0.09 1.31 ± 0.08 | 0.28 0.36 | 0.11 ± 0.09 0.22 ± 0.12 | 0.14 0.19 |
Publisher’s Note: MDPI stays neutral with regard to jurisdictional claims in published maps and institutional affiliations. |
© 2022 by the authors. Licensee MDPI, Basel, Switzerland. This article is an open access article distributed under the terms and conditions of the Creative Commons Attribution (CC BY) license (https://creativecommons.org/licenses/by/4.0/).
Share and Cite
MDPI and ACS Style
Gnemmi, M.; Falchi, L.; Zendri, E. Non-Invasive-Monitoring Methodology for the Evaluation of Environmental Impacts on Istrian Stone Surfaces in Venice. Atmosphere 2022, 13, 1036. https://doi.org/10.3390/atmos13071036
AMA Style
Gnemmi M, Falchi L, Zendri E. Non-Invasive-Monitoring Methodology for the Evaluation of Environmental Impacts on Istrian Stone Surfaces in Venice. Atmosphere. 2022; 13(7):1036. https://doi.org/10.3390/atmos13071036
Chicago/Turabian StyleGnemmi, Margherita, Laura Falchi, and Elisabetta Zendri. 2022. "Non-Invasive-Monitoring Methodology for the Evaluation of Environmental Impacts on Istrian Stone Surfaces in Venice" Atmosphere 13, no. 7: 1036. https://doi.org/10.3390/atmos13071036
Note that from the first issue of 2016, this journal uses article numbers instead of page numbers. See further details here.