3. Results and Discussion
As already observed for similar layers [
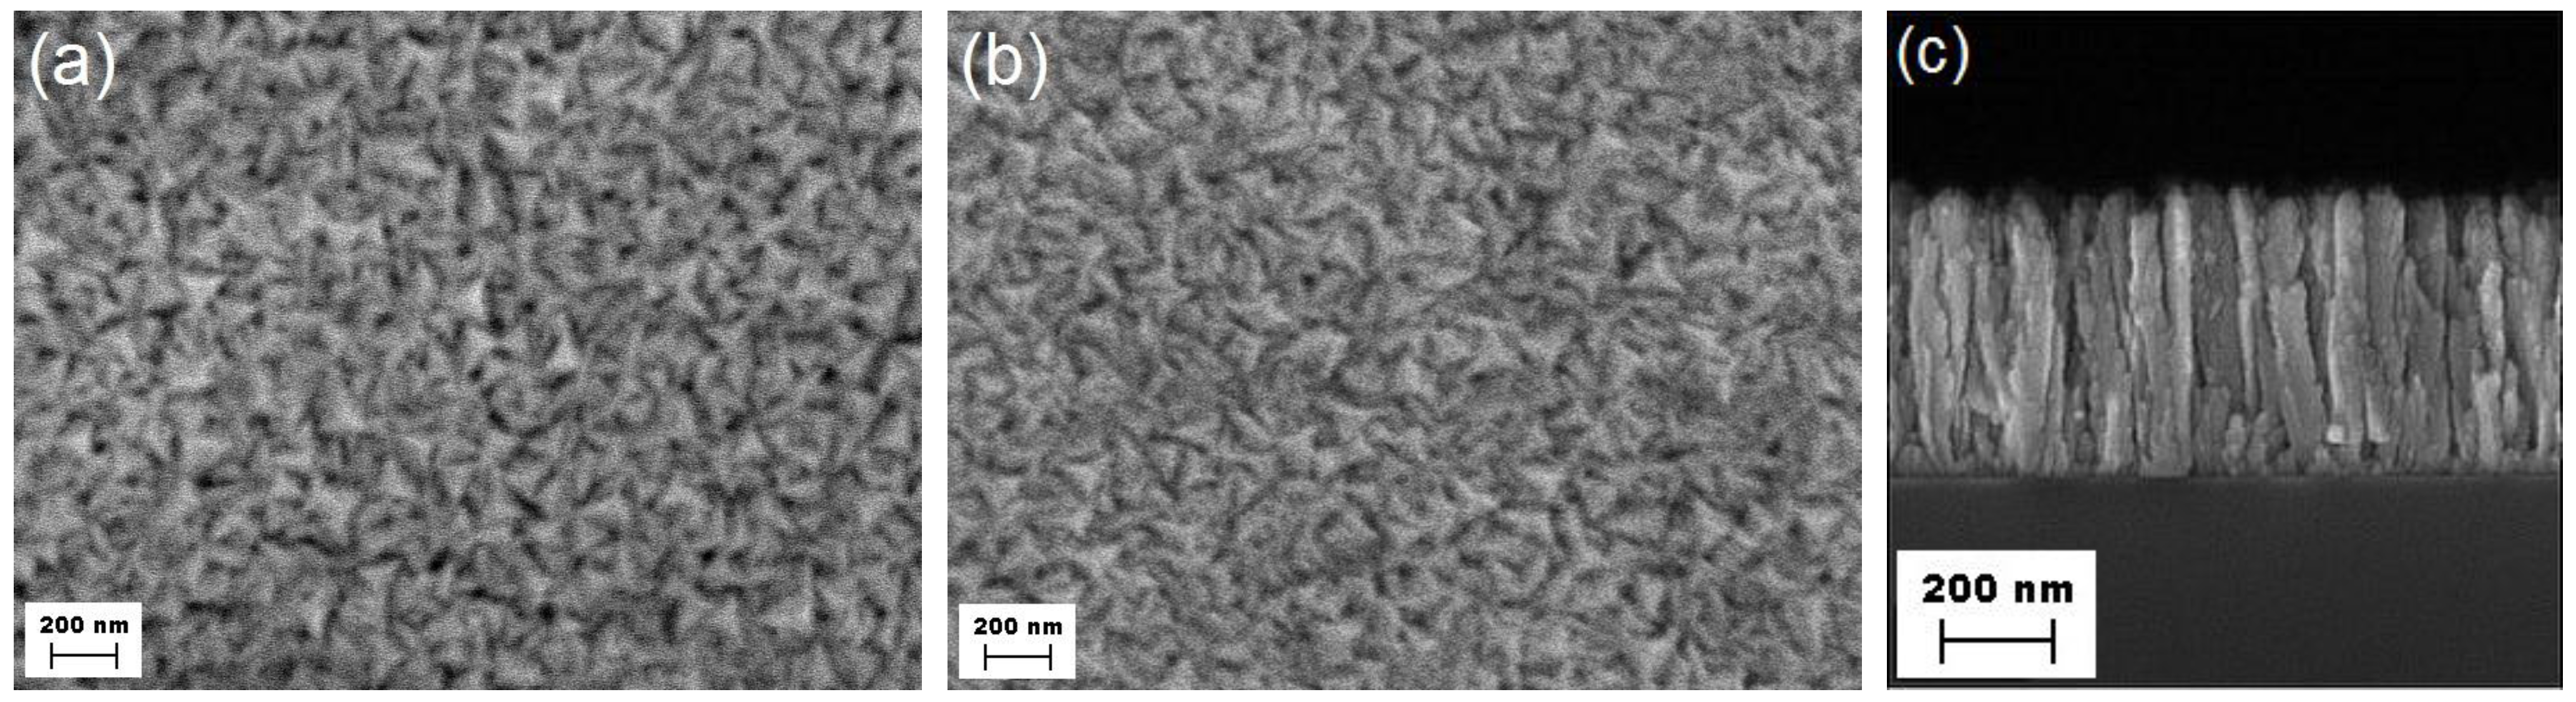
3], the Ti-supported RuN thin films present a rough surface morphology (
Figure 1a,b), which results from a poorly compact organization of defected columnar polycrystalline grains with tetrahedral heads (
Figure 1c). Based on X-ray diffraction (XRD) and SEM investigations, the details of which have been reported elsewhere [
3,
4], the polycrystalline surface is an aggregation of particles having a lateral dimension of less than 50 nm; the average crystallite size amounts to about 18 nm. The intergranular void space leads to estimating a 30% decrease of the density of the coating, from the theoretical value of (4.3 ± 0.2) × 10
22 to a value of (2.9 ± 0.2) × 10
22 RuN species per cm
3 [
3]. Thus, in the case of our films, the estimated density amounts to 5.5 ± 0.4 g·cm
−3.
Figure 1.
Scanning electron microscopy (SEM) of the surface of RuN: (a) before and (b) after the completion of the entire electrochemical investigation; (c) cross-section of the “as deposited” layer synthesized onto the silica substrate.
Figure 1.
Scanning electron microscopy (SEM) of the surface of RuN: (a) before and (b) after the completion of the entire electrochemical investigation; (c) cross-section of the “as deposited” layer synthesized onto the silica substrate.
We investigated the stability of RuN in alkaline media and under specific polarization conditions in our previous work [
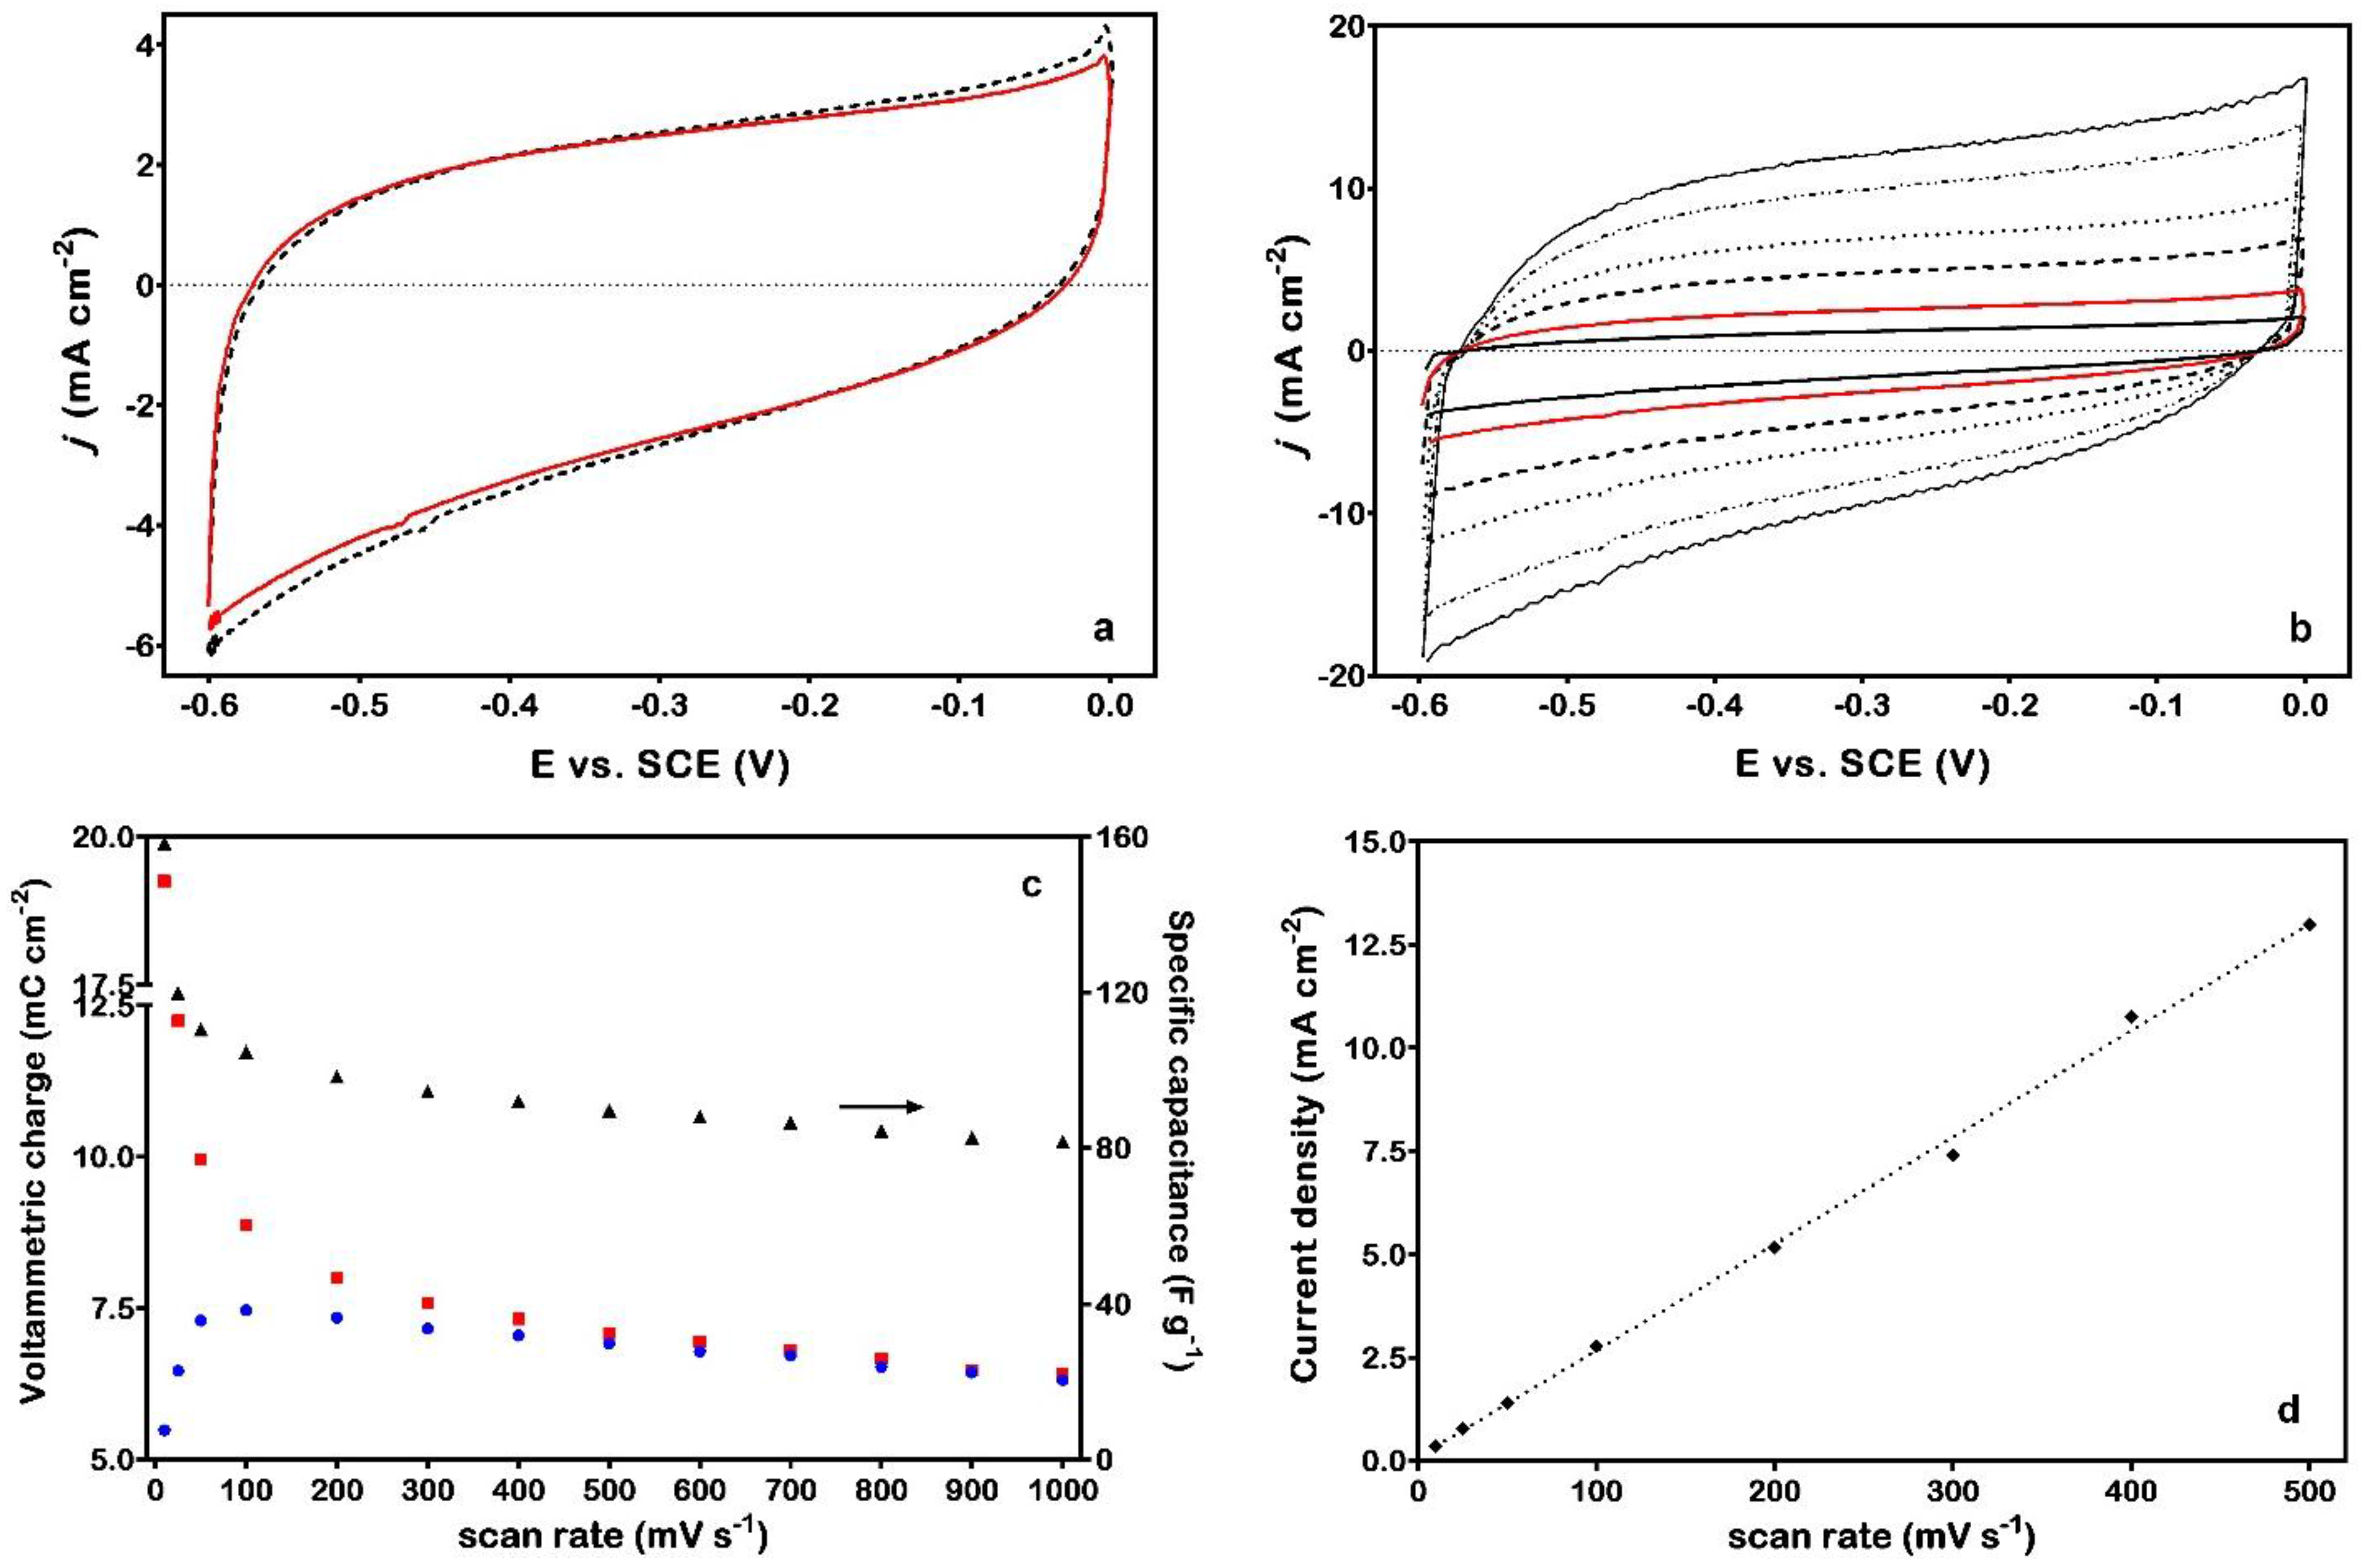
4]; however, further insight is possible. An example of CV data obtained is shown in
Figure 2a. The reproducibility of these curves is quite satisfactory, as witnessed by a substantial superposition of data even after more than 400 cycles [
12]. Voltammetric curves appear slightly tilted and asymmetric, with cathodic charges generally larger than anodic ones. Interestingly, the tilt of CV data can be appreciated only in alkaline media [
4]; moreover, the increase of the scan rate to more than 500 mV·s
−1 allows achieving voltammograms with a quite good symmetry, as witnessed by a substantial correspondence of the charges (
Figure 2b,c).
A sort of hysteresis is evident for
r ≤ 500 mV·s
−1, which is kept unchanged upon cycling and affects both the form of the CV curve and the related cathodic and anodic charges. Regarding the former aspect, an analogous intrinsic irreversibility exists also in the case of noble-metal electrodes (e.g., the oxide formation and reduction signals of Pt or Au). On the other hand, both the anodic and cathodic voltammetric charges change with the scan rate (
Figure 2c) suggesting that not only the most external surface is involved in the charging/discharging process, especially for the low values of variation of the potential (
i.e., when the material has more time to adapt to the imposed perturbation). The larger currents measured during the cathodic scan seem to indicate that the reduction process is easier than the corresponding oxidation. Thus, from a merely physical point of view, the material seems to behave as a “sponge”, incorporating charge within a certain portion of the near-surface region (the micro/nano-porosity due to the columnar structure [
3] may contribute to a significant extent). On the other hand, the linear dependence found for the current response as a function of scan rate suggests that processes take place directly at the active sites, without any significant role of diffusion-controlled mechanisms (
Figure 2d).
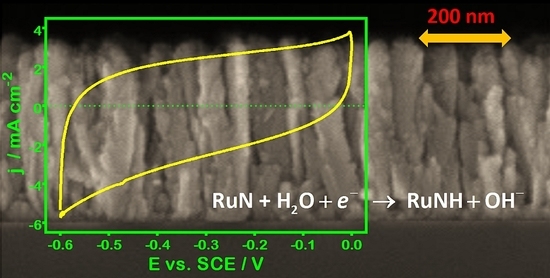
Figure 2.
(a) Cyclic voltammetry (CV) curves for the Ti/RuN electrode, recorded in de-aerated 1 M NaOH solution at 100 mV·s−1 (dashed black line: after 200 scans; solid red line: after 400 scans); (b) effect of scan rate on the CV curves (in the picture, r is comprised between 50 mV·s−1 and 500 mV·s−1); (c) trends of the voltammetric charge (red square: cathodic; blue circle: anodic) and of the specific capacitance (black triangle) as a function of the scan rate; (d) dependence of the current response recorded at −0.2 VSCE on scan rate.
In the case of nanostructured Pt electrodes [
13], a strong hysteresis of the CV curve has been ascribed to phenomena related with the electrode morphology: a diffusion-controlled adsorption of protons within nanochannels, with a subsequent potential-controlled desorption. However, unlike the situation encountered in acidic or quasi-neutral media, protons cannot be considered as the main actors in solutions of NaOH, and their involvement can only be realized through water molecules. The latter may plausibly enter into the complex columnar structure of the interface, thus representing a source of protons (in terms of acid of Brønsted) or allowing for a hidden movement of protons through a Grotthuss-like “pseudo”-diffusion process (it is worth remembering that the Grotthuss mechanism refers to the movement of protons or protonic defects through the hydrogen bond network of water molecules). Since the electronic properties of RuN [
14] are reasonably not very different from those of RuO
2 [
15], and the latter are close to those of IrO
2 [
16], it is realistic to imagine a charge-storage process similar to the one that takes place on the near-surface region of noble-metal oxides [
17]. The alternative implication of the sodium cations is not convincing, since these species are surrounded by at least six water molecules [
18] and therefore assume dimensions not compatible with an agile movement within nano-porosities. Equation (3) schematizes what may happen in the present case.
During the cathodic scan (reduction process), water molecules act as a source of hydrogen species, allowing for the formation of RuNH, a state in which the metal assumes a formal oxidation value of +2. Since the material is porous, and has been anyway hydrated before reaching a reproducible and stable condition, the process is relatively easy and relies upon a hidden movement of hydrogen species (Grotthuss-like diffusion) for the neutralization of the hydroxyl anions that are formed (otherwise, we can consider that hydroxyls are electrostatically expelled from the bulk of the material). As indicated by
Figure 2c, the thickness of the coating that takes part to the electrochemical exchanges depends on the scan rate: the lower the scan rate, the larger the depth of the coating interested by the process. Regarding the anodic scan, hydrogen species are released and should move away towards the solution, but the electrostatic interaction with the negatively-charged electrode surface hinders this movement (as an alternative, hydroxyls are electrostatically repelled), with the result that the oxidation process is less easy than the reduction. A similar slowness in the kinetics of anodic charging and cathodic discharging was found by Conway and coworkers in the case of Mo
xN film electrodes cycled in 0.5 M H
2SO
4 [
19]. In analogy to what has been proposed by Yang
et al. [
13], the hysteresis in the form of the CV seems again related to the electrode morphology, and its vanishing at high scan rates (
i.e., when more limited depths are involved) may represent a further confirmation. Interestingly, the hysteresis of the voltammetric curve disappears when the polarization is extended to 0.2 V (instead of stopping at 0.0 V) [
4]: plausibly, by reaching more positive values, the processes that have to take place are less hindered. Moreover, the reduction process appears completely reversible and we have thus to assume that it stops at RuNH: a complete reduction, with formation of Ru nanoparticles, would drastically modify both the form of the CV curve, and the subsequent outcomes of the non-electrochemical characterization. On the contrary, SEM and RBS investigations have confirmed that the electrochemical treatments do not cause dramatic changes in the morphology (
Figure 1) and composition (
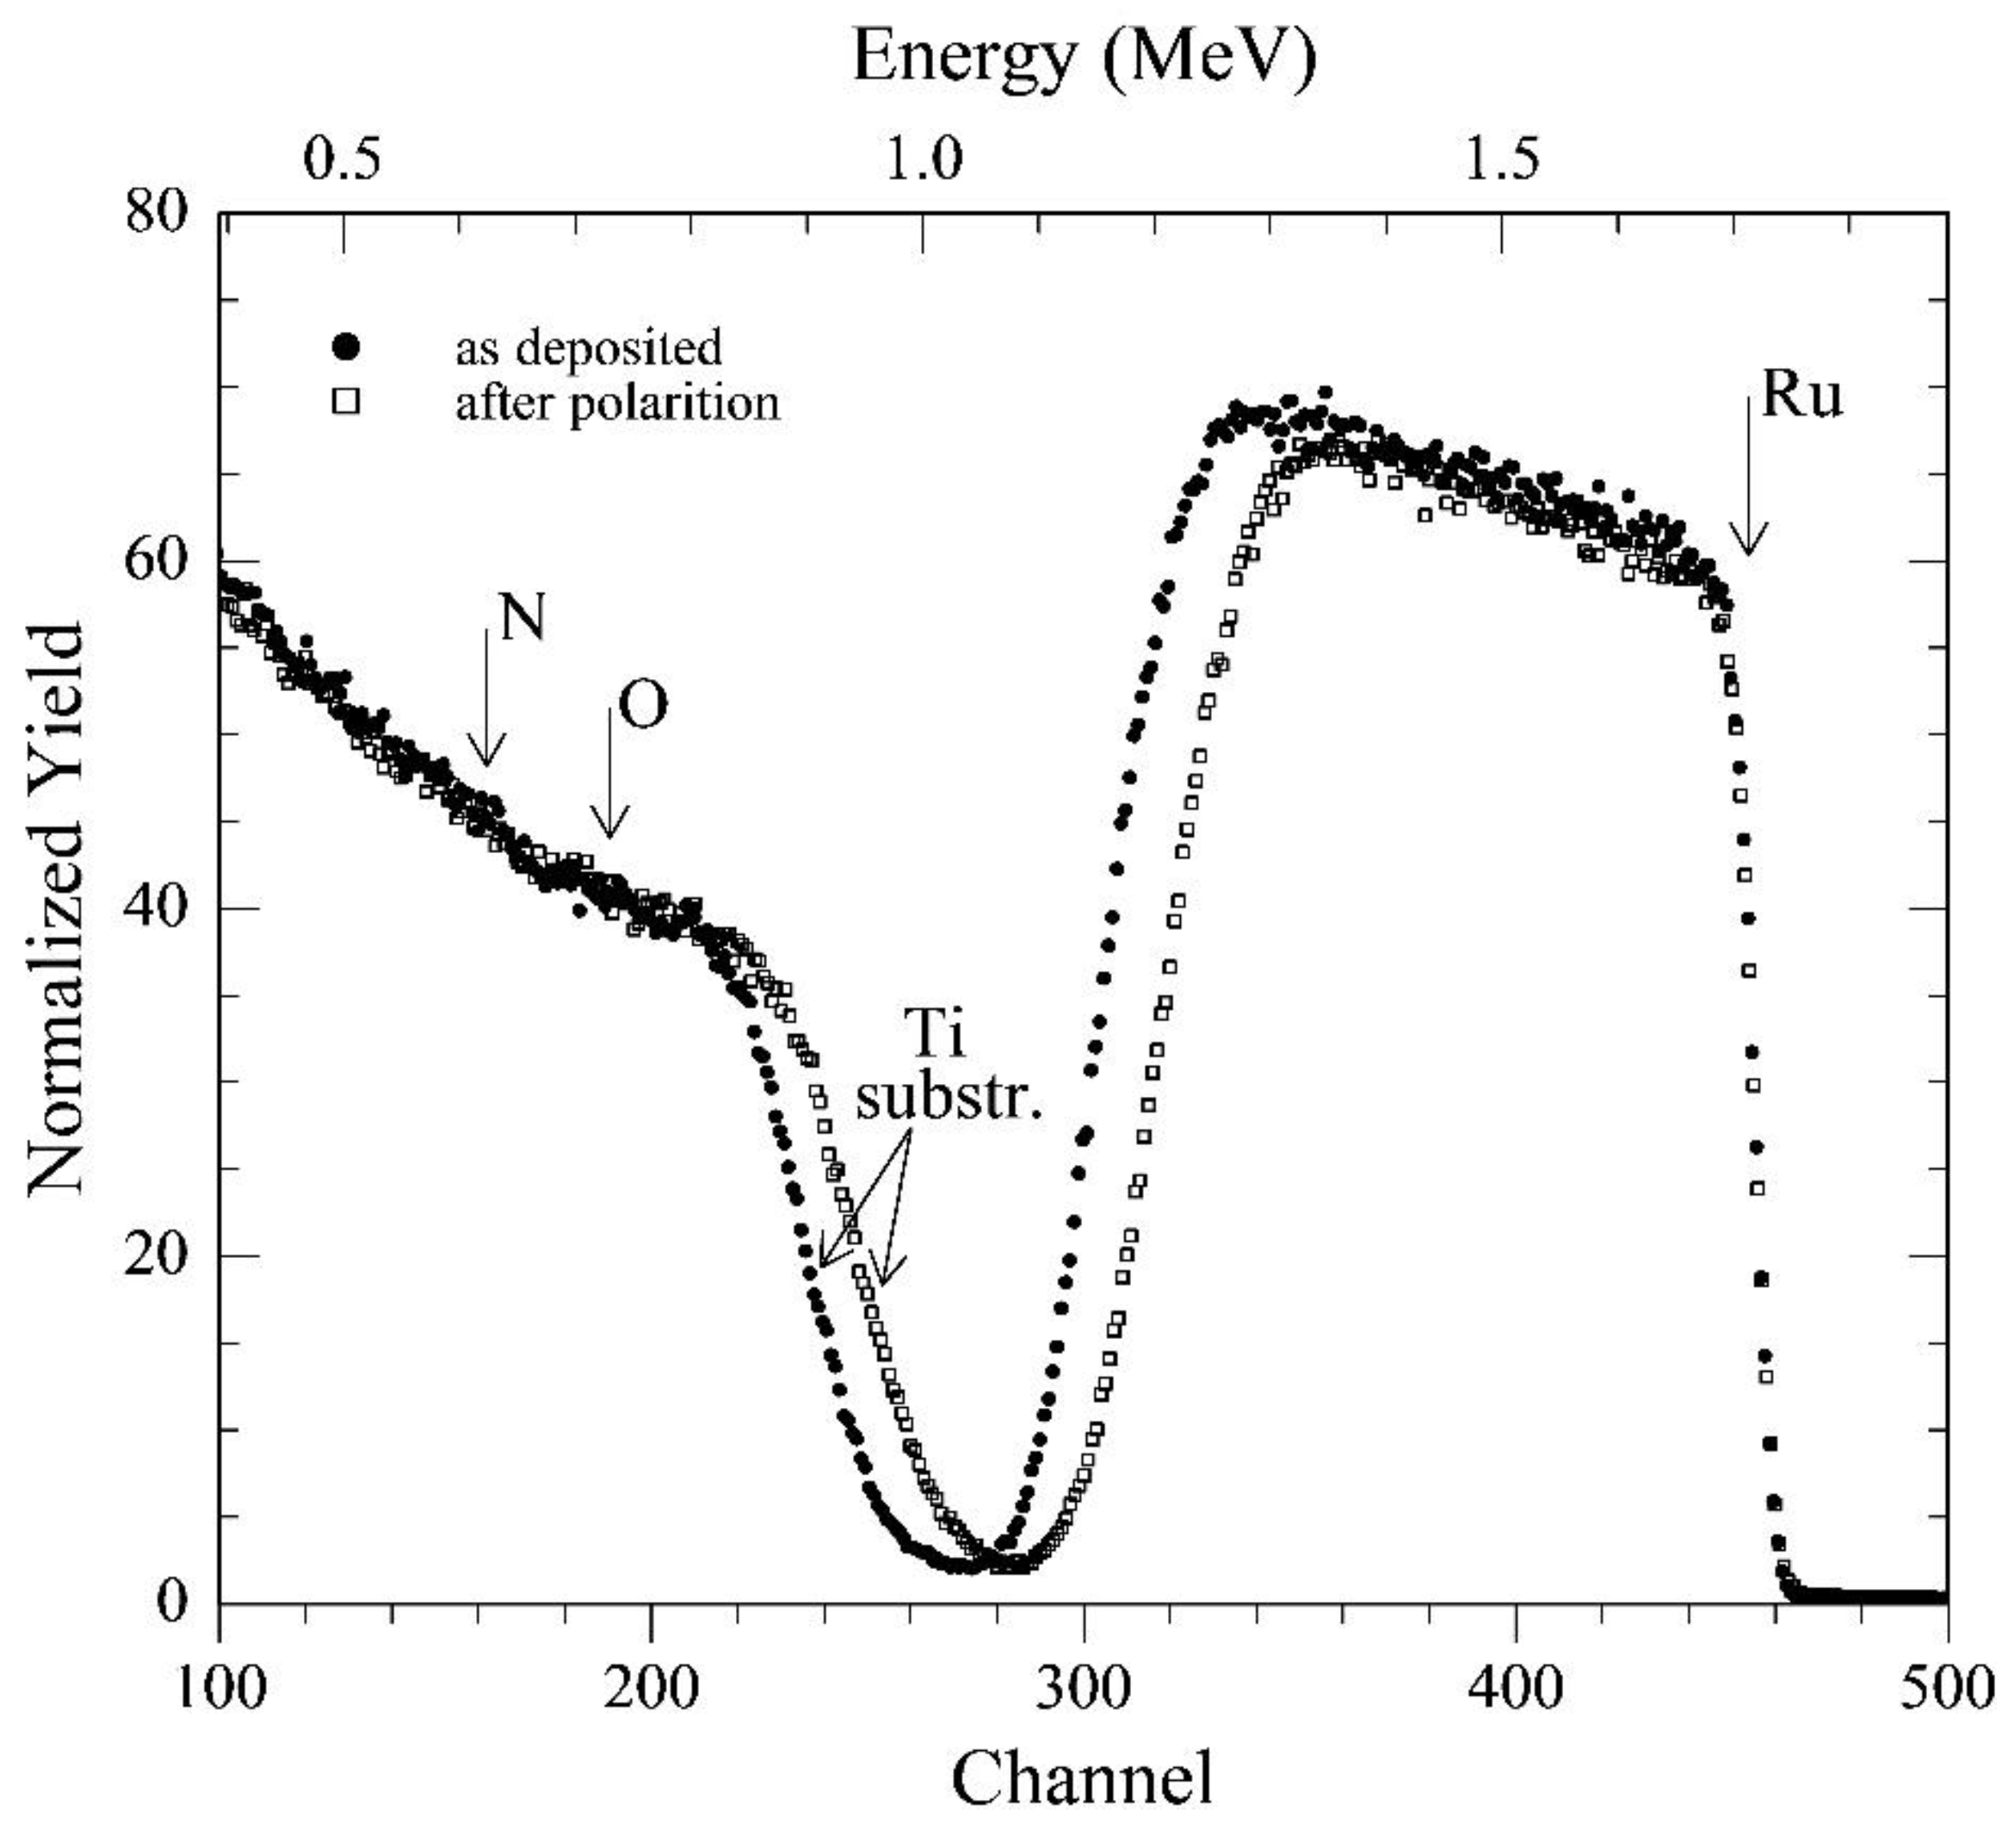
Figure 3) of the RuN layers. In fact, RBS analyses of the films deposited onto the silica sheets (the much lower background signal due to this substrate allows a much more sensitive detection of nitrogen and oxygen) gave the following composition of the pristine samples: Ti = 1 (normalized value); N = 1.00 ± 0.05; O = 0.25 ± 0.05; carbon, if present, below the detection limit (
i.e., C < 0.1). The presence of oxygen is due to a contamination from the environment (
i.e., adsorption of moisture, air and carbon dioxide/hydrocarbons) [
3]. The Ti-supported layer was characterized before and after the completion of the entire electrochemical investigation (RBS analyses are not destructive). Spectra reported in
Figure 3 clearly show that the only detectable change in film composition is a small increase in the oxygen content (to O = 0.30 ± 0.05), evidenced by the very small reduction of the height of the ruthenium signal. On the other hand, the 10% reduction of the width of the same signal (and the related shift of the signal from the titanium support) suggests that thickness of the layer has possibly experienced an analogous 10% reduction because of the electrochemical treatments. This corrosion effect may be ascribed to a generalized erosion/dissolution of the outermost few tens of layers, possibly due to the hydrogen evolution on a surface that has been made less stable owing to the severe electrochemical investigation.
Figure 3.
Rutherford backscattering spectrometry (RBS) for the Ti/RuN specimens: (●) as deposited, and (□) after the completion of the entire electrochemical investigation.
Figure 3.
Rutherford backscattering spectrometry (RBS) for the Ti/RuN specimens: (●) as deposited, and (□) after the completion of the entire electrochemical investigation.
The good cycling stability of RuN is somewhat in contrast with outcomes obtained on other metal-nitride materials: TiN has shown to suffer owing to the irreversible formation of TiO
2 [
20]; a similar behavior has been highlighted for VN, with the formation of vanadium oxides with multiple stoichiometries [
21,
22,
23,
24,
25,
26]. In the latter case, however, the oxynitride is still able to take part to Faradic redox reactions: VN
xO
y + OH
− → VN
xO
y-OH + e
−. Investigations carried out on a γ-Mo
2N/Co
3Mo
3N composite material have pointed out that a 25% at of Co (with respect to Mo) is needed not only to increase the specific capacitance, but also to limit the loss of specific capacitance during cycling [
27]. In the case of WN, the formation of stable WO
3 by surface oxidation has been hypothesized in order to justify the electrochemical stability of the probed material [
28]. Unfortunately, in both latter cases, no indications have been given regarding the possible charge-storage mechanisms.
Regarding the reduction of RuN, with formation of RuNH (as suggested in this work), it is worth observing that the partial hydrogenation of electrocatalytic sites is expected to affect the subsequent hydrogen evolution reaction [
4], since it represents a sort of under-potential deposition (something similar has been discussed also in [
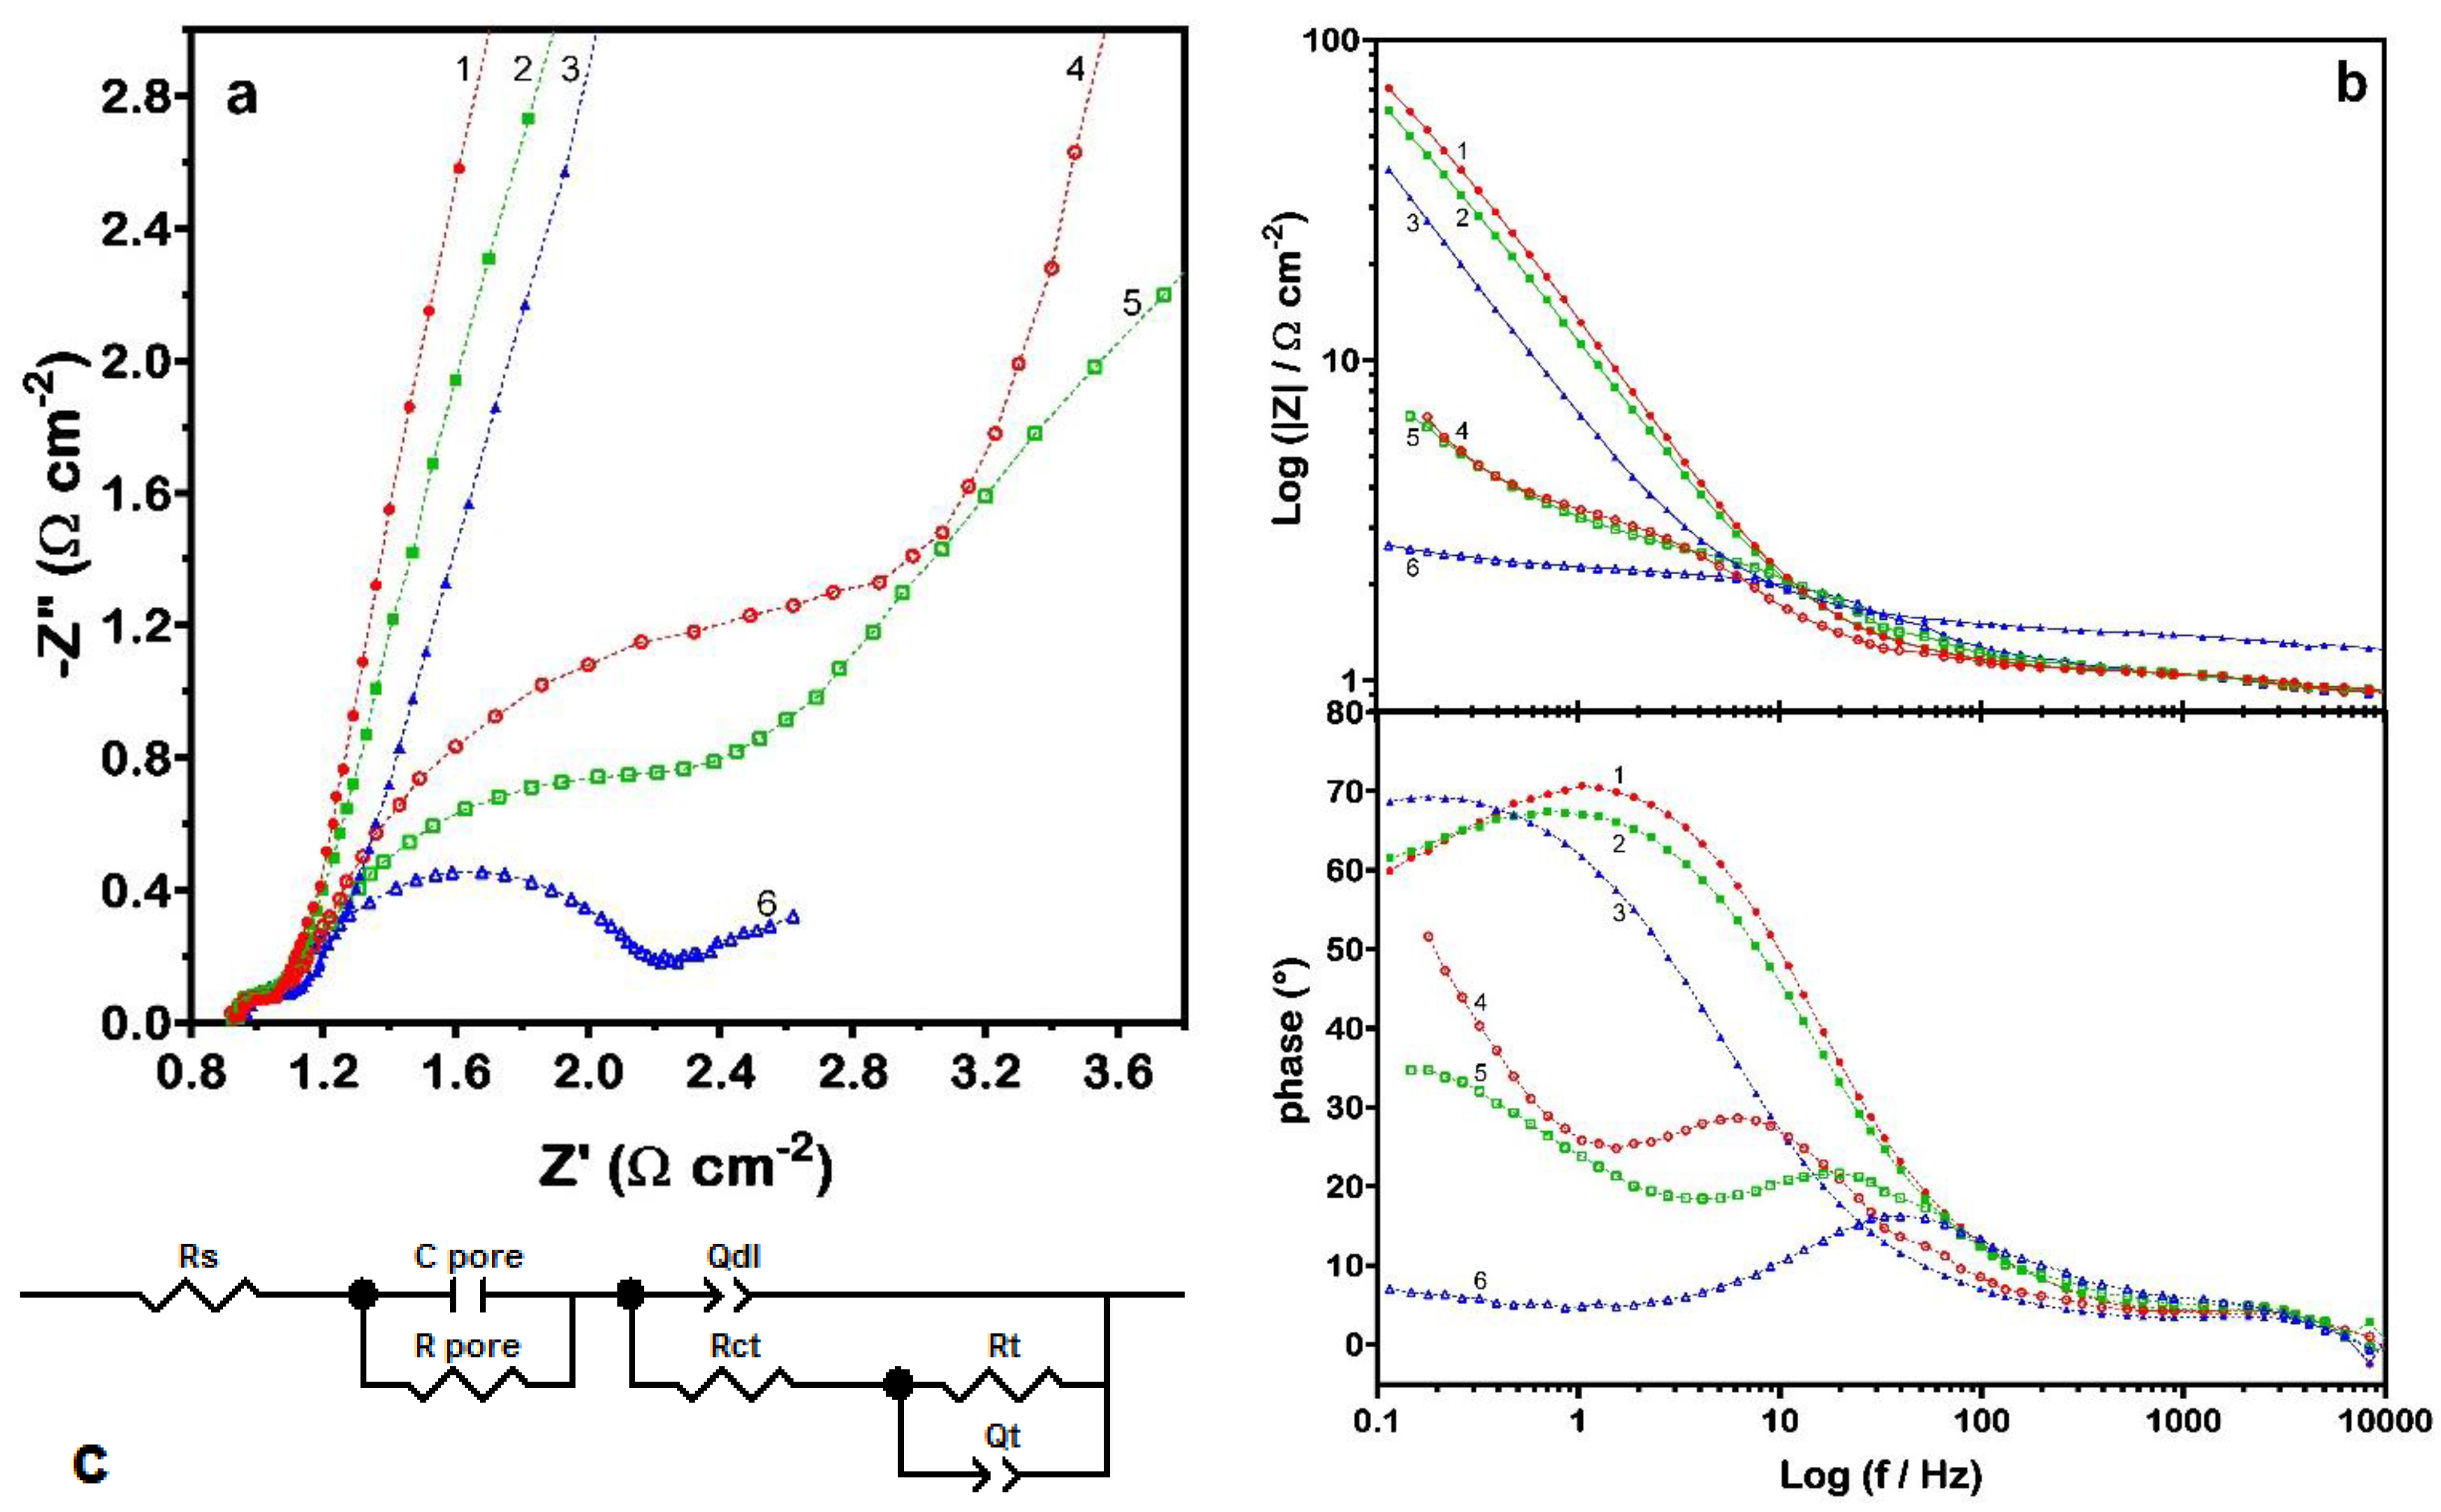
26]). In order to investigate that peculiarity, impedance spectra were recorded at different values of potential. Obtained EIS spectra are shown as Nyquist (zoom—in order to comprise all points, the
Y-axis has to be extended until a value of 70) and Bode plots in
Figure 4. At least three contributions can be easily distinguished in the spectra obtained under incipient hydrogen evolution (
Figure 4a): the first one, at high frequencies, is always pretty well resolved, while the other two appear more or less convoluted at medium-low frequencies. By varying the electrode potential, it has been proven that the first contribution remains practically unchanged and can thus be confidently ascribed to the porosity or, more in general, to geometric features that are characteristic of the material. Then, the other two contributions are necessarily associated to the reduction of RuN (Equation (3a)) and to the subsequent hydrogen evolution. Accordingly, the model circuit adopted for analyzing the data consisted of a RC mesh (in order to account for the role of porosity and geometric surface factors,
Rpore and
Cpore, respectively) in series with a nested circuit with two time constants (
Figure 4c). The latter is suitable to model the charge-transfer process (
Rct and
Qdl, charge-transfer resistance and double-layer constant phase element) and the effects due to reaction intermediates (
Rt and
Qt).
Figure 4.
electrochemical impedance spectroscopy (EIS) data obtained for the RuN electrode polarized at different potential values in de-aerated 1 M NaOH: (a) zoom of Nyquist plot (moving clockwise: (1) 0.00 V, (2) −0.50 V, (3) −0.80 V, (4) −1.05 V, (5) −1.10 V and (6) −1.15 V vs. saturated calomel electrode (SCE)); (b) Bode plot of previous data; and (c) equivalent circuit chosen to model the electrochemical process.
The fitting of EIS data was carried out with ZSimpWin v. 3.21 (Princeton Applied Research, Ann Arbor, MI, USA); relevant data, as a function of the applied potential, have been collected in
Table 1.
Table 1.
Values of parameters associated with the proposed electrical circuit.
Table 1.
Values of parameters associated with the proposed electrical circuit.
| Potential (V) | Rpore (Ω·cm−2) | Cpore (mF cm−2) | Rct (Ω·cm−2) | Cdl (mF·cm−2) | Rt (Ω·cm−2) | Qt − Y0 | Qt − n | χ2 (×10−4) |
|---|
| 0.00 | 0.1329 | 0.959 | 159.300 | 8.40 | 186.400 | 0.0225 | 1.0000 | 2.889 |
| −0.50 | 0.1379 | 0.867 | 183.600 | 8.85 | 114.900 | 0.0222 | 1.0000 | 2.603 |
| −0.80 | 0.1410 | 0.723 | 1.028 | 9.38 | 379.800 | 0.0107 | 0.8704 | 1.793 |
| −1.05 | 0.1445 | 1.078 | 3.093 | 20.37 | 47.960 | 0.2121 | 0.9689 | 1.557 |
| −1.10 | 0.1363 | 1.159 | 1.700 | 9.26 | 15.020 | 0.2385 | 0.7500 | 1.074 |
| −1.15 | 0.1352 | 1.165 | 1.130 | 5.57 | 0.897 | 1.8550 | 0.7132 | 1.515 |
| −1.20 | 0.1450 | 1.004 | 0.866 | 4.28 | 0.154 | 4.0830 | 1.0000 | 1.946 |
As anticipated, the
R and
C parameters of the first mesh remained substantially constant, while varying the potential (
Cpore varied between 0.7 mF·cm
−2 and 1.1 mF·cm
−2, while
Rpore remained close to 0.14 Ω·cm
−2). More interesting are the outcomes relating to
Cdl and
Qt. Within the potential region of the CV curve, values between 8.4 mF·cm
−2 and 8.9 mF·cm
−2 are obtained for the first parameter (by applying the Brug’s formula [
29]), while
Qt assumes a value of about 22.5 mF·cm
−2, independent from frequency, which is more than twice the former value. The EIS estimate of the value of the double-layer capacitance agrees rather well with the outcome from the CV curve at high scan rates (a charge of about 6.5 mC·cm
−2 divided by a potential interval of 0.6 V leads to a capacitance of less than 11 mF·cm
−2). On the other hand, the cathodic charge measured at the lowest scan rate provides a total capacitance (double-layer capacitance plus pseudo-capacitance) of about 32 mF·cm
−2, which is in agreement with the sum of the two EIS contributions. This approximate value is significantly greater than those obtained for homologous noble-metal oxide-based materials prepared by reactive sputtering [
11], and can be realistically justified only through the involvement of the micro/nano-porosities created by the columnar structure of RuN, which are accessible to the water molecules owing to their low steric hindrance. The large pseudo-capacitance of RuN, also confirmed by Laїk
et al. [
5], is thus plausibly related with Equation (3) and represents the main contribution in the CV curve, in close analogy with the response of ruthenium dioxide [
30].
When the electrode polarization is pulled to more negative values (below −1 V
versus SCE) incipient hydrogen evolution is observed. The charge-transfer resistance decreases to values of a few Ω cm
−2 or less (this value decreases by increasing the overvoltage); additionally, the resistance associated to the pseudo-capacitive mesh (
i.e., to reaction intermediates) decreases sharply, tending to zero for
E < −1.15 V
versus SCE. Under vigorous hydrogen evolution conditions, it is reasonable to relate the decrease of
Cdl to the progressive reduction of the electrochemically active surface, due to the clogging of open spaces caused by hydrogen gas. Owing to the minimization of
Cdl, the pseudo-capacitive mesh loses its physical meaning and the nested circuit tends to a single RC mesh, in which the capacitance is actually due to both, the double-layer and the adsorbed species (the electrochemical mechanism implies the adsorption of reaction intermediates: Volmer step in both Volmer-Tafel, V-T, and Volmer-Heyrovsky, V-H, mechanisms). Based on a Tafel slope close to 67 mV per decade [
4] and assuming a Langmuir adsorption isotherm as a first approximation, a coverage value for intermediates of at least 0.4 can be estimated for the V-H mechanism (the coverage would be even larger,
i.e., close to 0.55, in the case of the V-T). The above analysis suggests that the turnover of electroactive sites on the surface reaches a condition of dynamic equilibrium: the hydrogen atoms (per cm
2) that leave the surface as molecular hydrogen are replaced by a corresponding amount of adsorbed radicals.


