Photoreforming of Glucose over CuO/TiO2
by
 , , , and
Elnaz Bahadori
1, 
Gianguido Ramis
1,
Danny Zanardo
2,
Federica Menegazzo
2 ,
,
Michela Signoretto
2,
Delia Gazzoli
3, 
Daniela Pietrogiacomi
3,
Alessandro Di Michele
4 and
Ilenia Rossetti
5,* 1
Civil, Chemical and Environmental Engineering Department, University of Genoa and INSTM Unit of Genoa, via all’Opera Pia 15A, 16145 Genoa, Italy
2
CATMAT Lab, Molecular Sciences and Nanosystems, Università Ca’ Foscari Venezia e Unità INSTM di Venezia, Campus Scientifico, Via Torino 155, 30172 Venice, Italy
3
Chemistry Depatment, Sapienza University of Rome, P. le A. Moro 5, I-00185 Rome, Italy
4
Physics and Geology Department, Università di Perugia, Via Pascoli, 06123 Perugia, Italy
5
Chemical Plants and Industrial Chemistry Group, Chemistry Department, Università degli Studi di Milano and INSTM Unit Milano-Università, via C. Golgi 19, 20133 Milan, Italy
*
Author to whom correspondence should be addressed.
Catalysts 2020, 10(5), 477; https://doi.org/10.3390/catal10050477
Submission received: 1 April 2020
/
Revised: 20 April 2020
/
Accepted: 24 April 2020
/
Published: 27 April 2020
(This article belongs to the Special Issue New Insights into Heterogeneous Catalysis)
Abstract
:Hydrogen production has been investigated through the photoreforming of glucose, as model molecule representative for biomass hydrolysis. Different copper- or nickel-loaded titania photocatalysts have been compared. The samples were prepared starting from three titania samples, prepared by precipitation and characterized by pure Anatase with high surface area, or prepared through flame synthesis, i.e., flame pyrolysis and the commercial P25, leading to mixed Rutile and Anatase phases with lower surface area. The metal was added in different loading up to 1 wt % following three procedures that induced different dispersion and reducibility to the catalyst. The highest activity among the bare semiconductors was exhibited by the commercial P25 titania, while the addition of 1 wt % CuO through precipitation with complexes led to the best hydrogen productivity, i.e., 9.7 mol H2/h kgcat. Finally, a basic economic analysis considering only the costs of the catalyst and testing was performed, suggesting CuO promoted samples as promising and almost feasible for this application.
1. Introduction
Photoreforming (PR) is the application of photocatalysis for hydrogen production from organic substrates, such as methanol, ethanol, glycerol, sucrose, glucose, starch and wood [1,2,3,4]. The first study in this field dates back to 1980 [1] as an interesting possibility to use biomass-derived substrates, and was later better proposed for application to waste raw materials, such as sewage from the food, wine or paper industry [5,6]. In this way, a zero-cost disposal of wastes is achieved, coupled with the production of a highly valued fuel: PR is a fully sustainable method, fitting the concept of circular economy. PR has a higher H2 productivity compared to direct water splitting (WS), because it involves a lower Gibbs free energy and because the product of the oxidation of the half reaction is CO2 instead of O2 [7]. This avoids the need of gas products separation, CO2 being inert with respect to H2, and consequently simpler reactors can be designed, such as a one-compartment cell.
The second generation of biofuels, mainly based on lignocellulosic biomass, has becoming increasingly attractive for PR [8]. Cellulose is the most abundant biopolymer on Earth; therefore its conversion into chemicals and biofuels is of great interest. Moreover, it is easily converted into glucose, which has been proved to be highest reactive molecule in PR among mono-di- and poly-saccharides [9,10]. Glucose is an efficient hole scavenger for TiO2 [10] in the photocatalytic reforming, thanks to its ability to adsorb dissociatively on undercoordinated Ti(IV) surface sites through the OH group yielding a proton and an alkoxide anion. In other words, diffusion of glucose, as a sacrificial agent on the catalyst’s surface, provides an effective scavenging of h+ holes and, at the same time, H+ for its reduction by the photogenerated electron.
Several reaction pathways have been proposed for photocatalytic reforming of glucose mainly by a means of TiO2 catalyst: several consecutive oxidation reactions result in the formation of intermediates such as arabinose, erythrose, glycolic acid, formic acid and finally H2 and CO2/CO [11,12,13].
The key factor for the achievement of a good efficiency in the photoreforming reaction relies on the ability of the semiconductor to absorb a photon to generate an electron-hole pair with an appropriate energy value and with a proper lifetime to avoid a too fast electron-hole recombination, which is the fastest dissipative pathway.
The PR reaction of organic substrates is reported in Equation (1)
CxHyOz + (2x − z) H2O → (2x – z + y/2) H2 + x CO2
The main impediments towards a satisfactory efficiency in the photoreforming are: (i) light scattering; (ii) poor absorption; and (iii) too quick electron/hole recombination.
TiO2 is one of the most used and studied photocatalysts for this purpose [14], usually as commercial Evonik P25, which is a widely used benchmark. This material is formed of primary particles of about 20 nm, composed of two crystalline phases: Anatase (~80%) and Rutile (~20%). The presence of the Anatase–Rutile interface is known to have a positive effect on the separation of the hole-electron pairs, thus increasing the catalytic activity.
The sequestration of the photogenerated electron by metal nanoparticles having a proper work function is a similar strategy to inhibit the electron-hole recombination: typically, TiO2 is loaded with various noble metals (≤1 wt %), to improve the life time of the generated e¯/h+ pairs [15,16].
Moreover, the metal increases the activity of the photoreaction also for its own properties as active site for H2 evolution [17]: the addition of Pt to the TiO2 surface is beneficial for photocatalytic reactions evolving gas, especially hydrogen [15]. Although noble metals show a higher catalytic activity, it is also possible to use nonprecious metals to increase the H2 evolution while accounting also for the economics of the process [18]. Several transition metals have been employed and one of the most promising appears to be copper [19,20,21].
The aim of this work is to investigate different catalysts and their activity for the photoreforming of carbohydrates, using glucose as a model molecule. For this purpose, different titania-based samples, synthesized with different methods, have been prepared by adding CuO and NiO, either singly or in a heterobimetallic configuration [22,23]. Cu is a relatively inexpensive (with respect to the much more investigated noble metals) and nontoxic metal. It has been reported that CuO is a better electronic trap than Cu [16,24]. Furthermore, CuO, compared to metallic Cu, has the advantage of being stable in air [25]. The addition of this cocatalyst results in an increase in activity up to two to three orders of magnitude compared to the nonpromoted sample, according to the literature [26,27]. W.-T. Chen et al., reported that loading of Cu increases activity almost 20 times [20]. According to these studies, the conduction band of nanostructured CuO is able to effectively reduce the water molecules [27,28]. Furthermore, it is known that Ni has a higher activity in the cleavage of C–C bonds than Cu [29], so in theory its presence would favor a greater degradation of the carbon skeleton of the glucose molecule.
Heterobimetallic formulations are known to have a positive impact on the catalytic activity compared to the monometallic ones [22]. However, the higher activity of heterobimetallic systems with respect to monometallic ones have been reported mainly in the case in which one is a noble metal, as a result of a synergistic electronic effect [23]. At the moment, no wholly non-noble heterobimetallic systems have been reported for photoreforming processes [23,30]. Moreover, this transition metal selection can be more cost effective with respect to noble metal promoted catalysts and can possibly produce catalysts more active than the corresponding monometallic ones, as reported for Cu–Ni heterobimetallic systems, proving more active in steam reforming processes [31].
2. Results and Discussion
2.1. Catalysts Characterization
The actual metal loading was determined by flame atomic absorption spectroscopy (FAAS) for all samples, as reported in Table 1. The amount of metal approaches the theoretical value for most of the samples, in particular Cu-loaded P25, while for the 1.0ICu/PREC sample it was halved. Nickel loading was also quite lower than expected, probably due to the highly hygroscopic nature of the precursor.
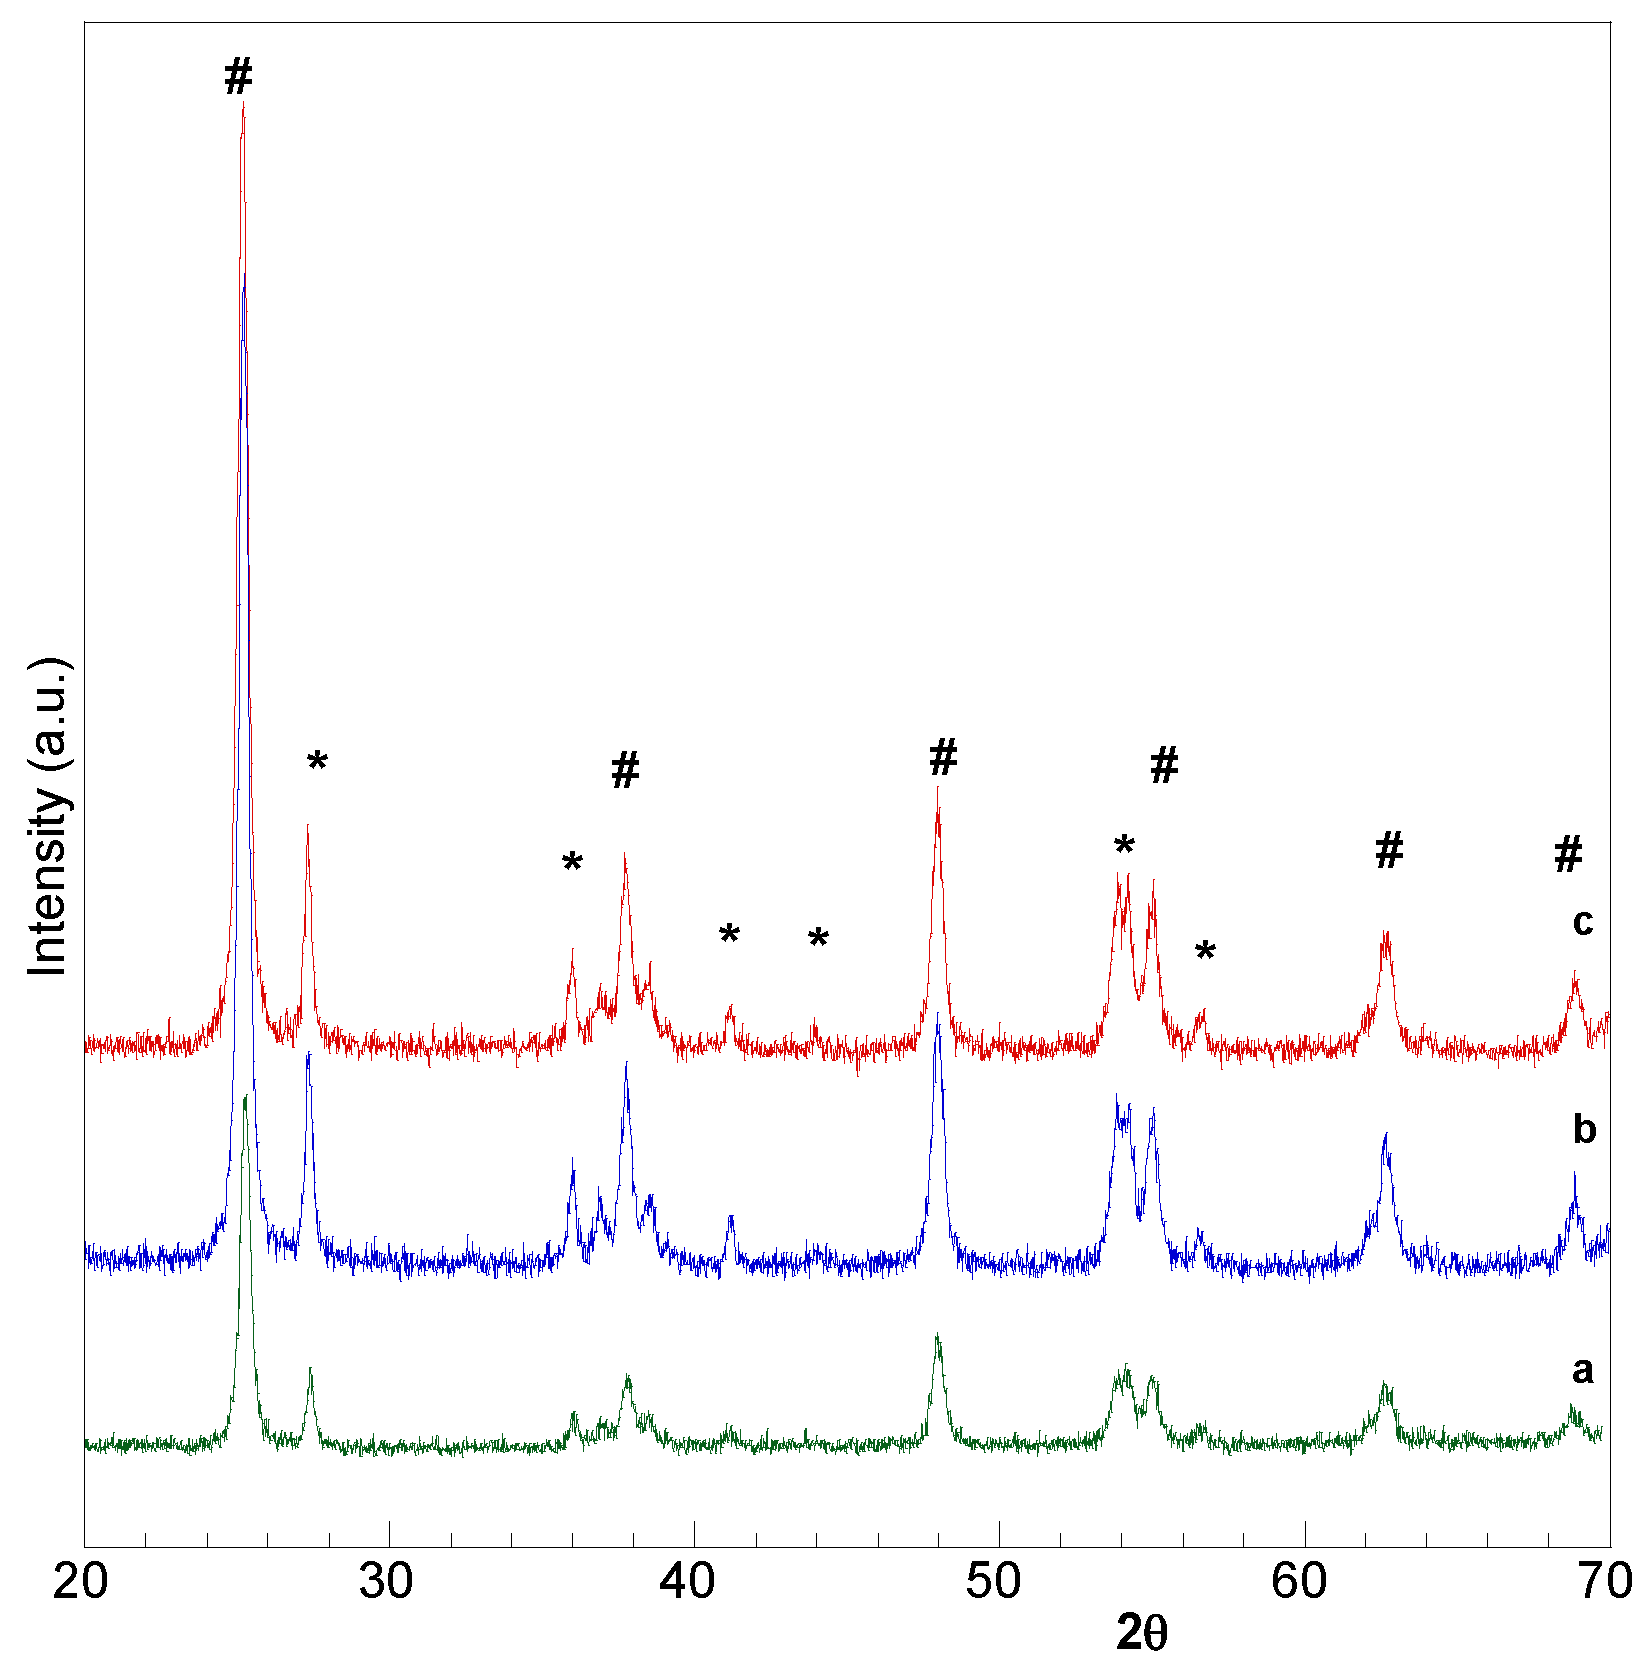
The X-ray diffraction patterns of the Cu-P25 samples show the presence of TiO2 in the Anatase and Rutile modifications, as for the pure P25 (Figure 1). No reflections due to CuO separate phase could be detected.
The Anatase/Rutile fractions, calculated from the integrated intensities of Anatase (101) and Rutile (110) peaks [35], consist of 14.8% Rutile and 85.2% Anatase. The crystallite sizes were in the range of 20 nm. Both findings are in agreement with data reported for TiO2 P25 considering that the commercial P25 sample shows inhomogeneity between production batches.
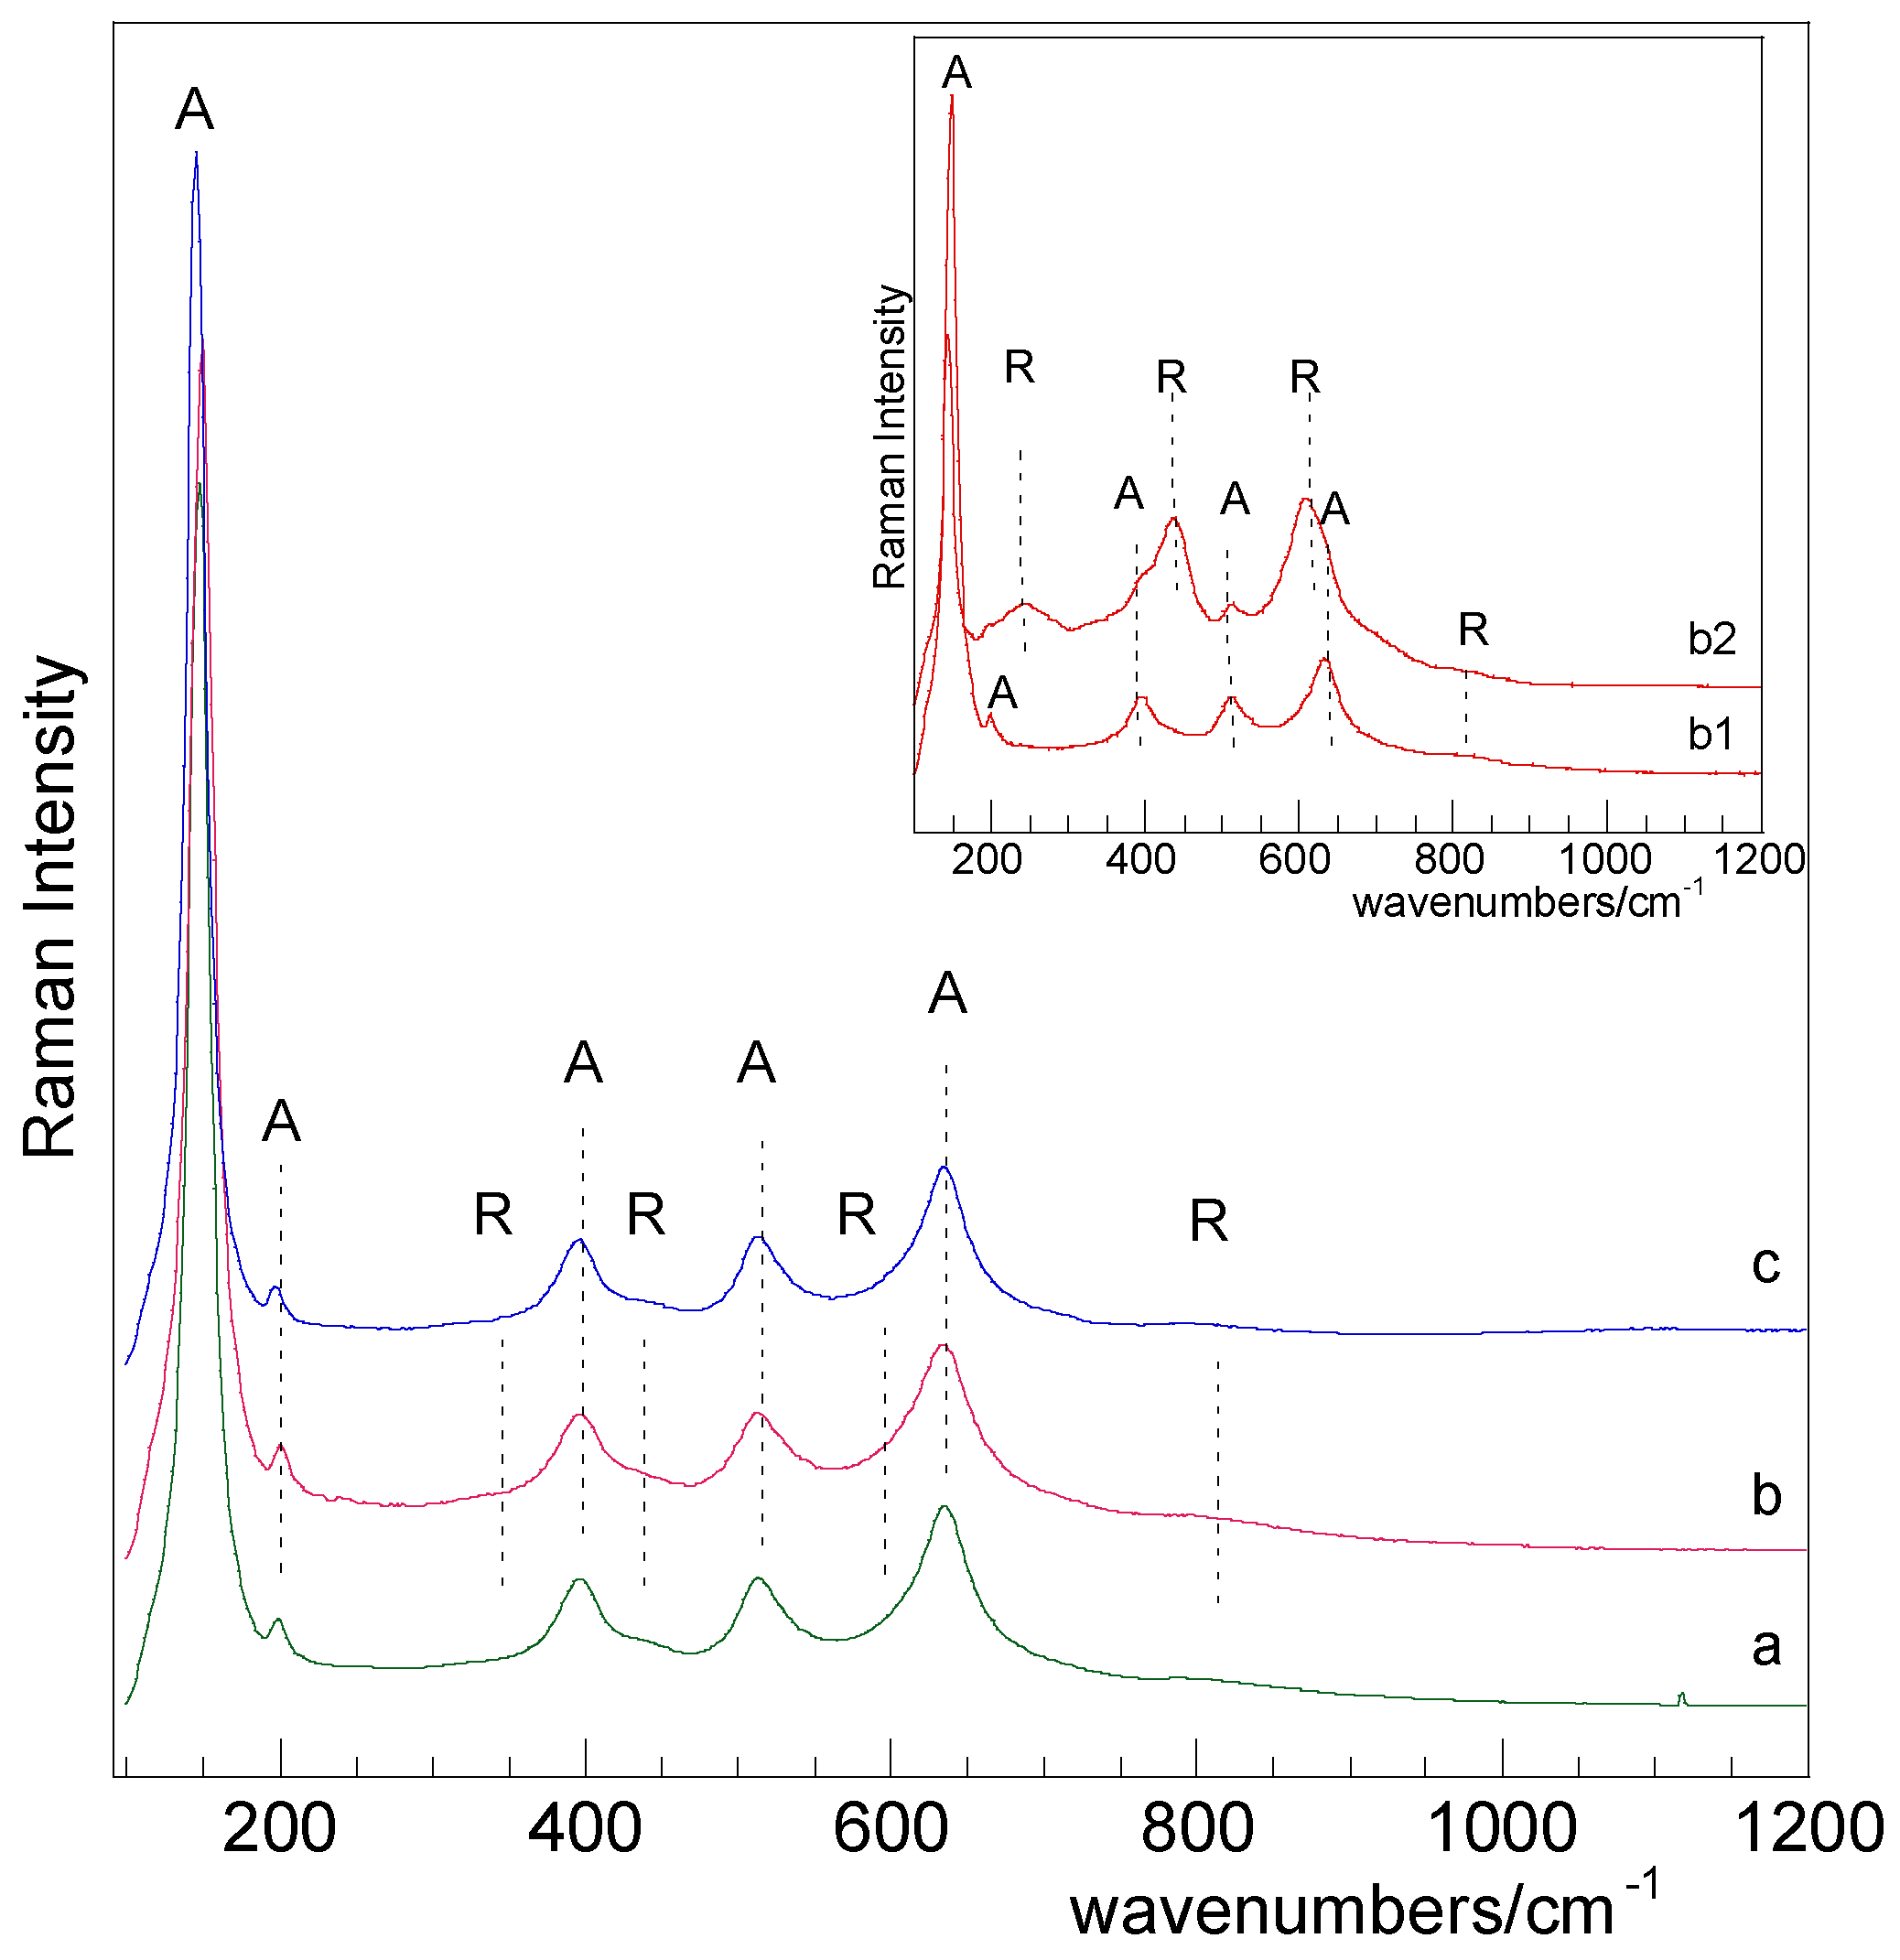
The Raman spectra of the Cu/P25 samples are shown in Figure 2. All the samples (1.0CCu/P25 1.0ICu/P25 and 1.0DCu/P25) exhibit high intensity bands at ca. 143, 199, 396, 514 and 636 cm−1 that are attributed to the Anatase phase, whereas the barely detectable bands at about 235, 443, 608 and 816 cm−1 are characteristic of the Rutile phase [36]. These results compare well with those expected for TiO2 P25. In addition, Raman spectra collected in different regions of the 1.0DCu/P25 sample revealed a certain degree of heterogeneity in phase composition. As shown in the inset of Figure 2, in this sample, particles (b1) having characteristic bands of TiO2 Anatase with low intensity Rutile contribution, as expected for P25, coexist with particles (b2) showing main bands due to TiO2 Rutile and low intensity features due to the Anatase phase.
The BET specific surface area (SSA) highlighted the meso-/macro-porous nature of the materials promoted with copper. Figure 3 reports the BET of the three bare titania samples, similar values being obtained for the Cu-loaded samples. The SSA and mean pore diameter, calculated on the desorption branch by the BJH method for all samples, are reported in Table 1.
The SSA of the bare samples increased from the commercial P25 to FSP (which have a similar preparation procedure and are poorly porous materials, constituted by dense nanoparticles [37]), passing to the sample obtained by precipitation. The impregnation procedure affected the SSA much more than the deposition precipitation methods. Likely, the introduction of copper by impregnation on the titanium hydroxide, before titania crystallization, heavily affects the structure of this material. It is known that Cu2+ can substitute some Ti4+ and improves the grain growth leading to larger crystallites and lower SSA [38], as we observed. The SSA on metal-loaded P25 has been observed to be comparable to bare P25, suggesting that the metal oxide does not affect the overall SSA [34].
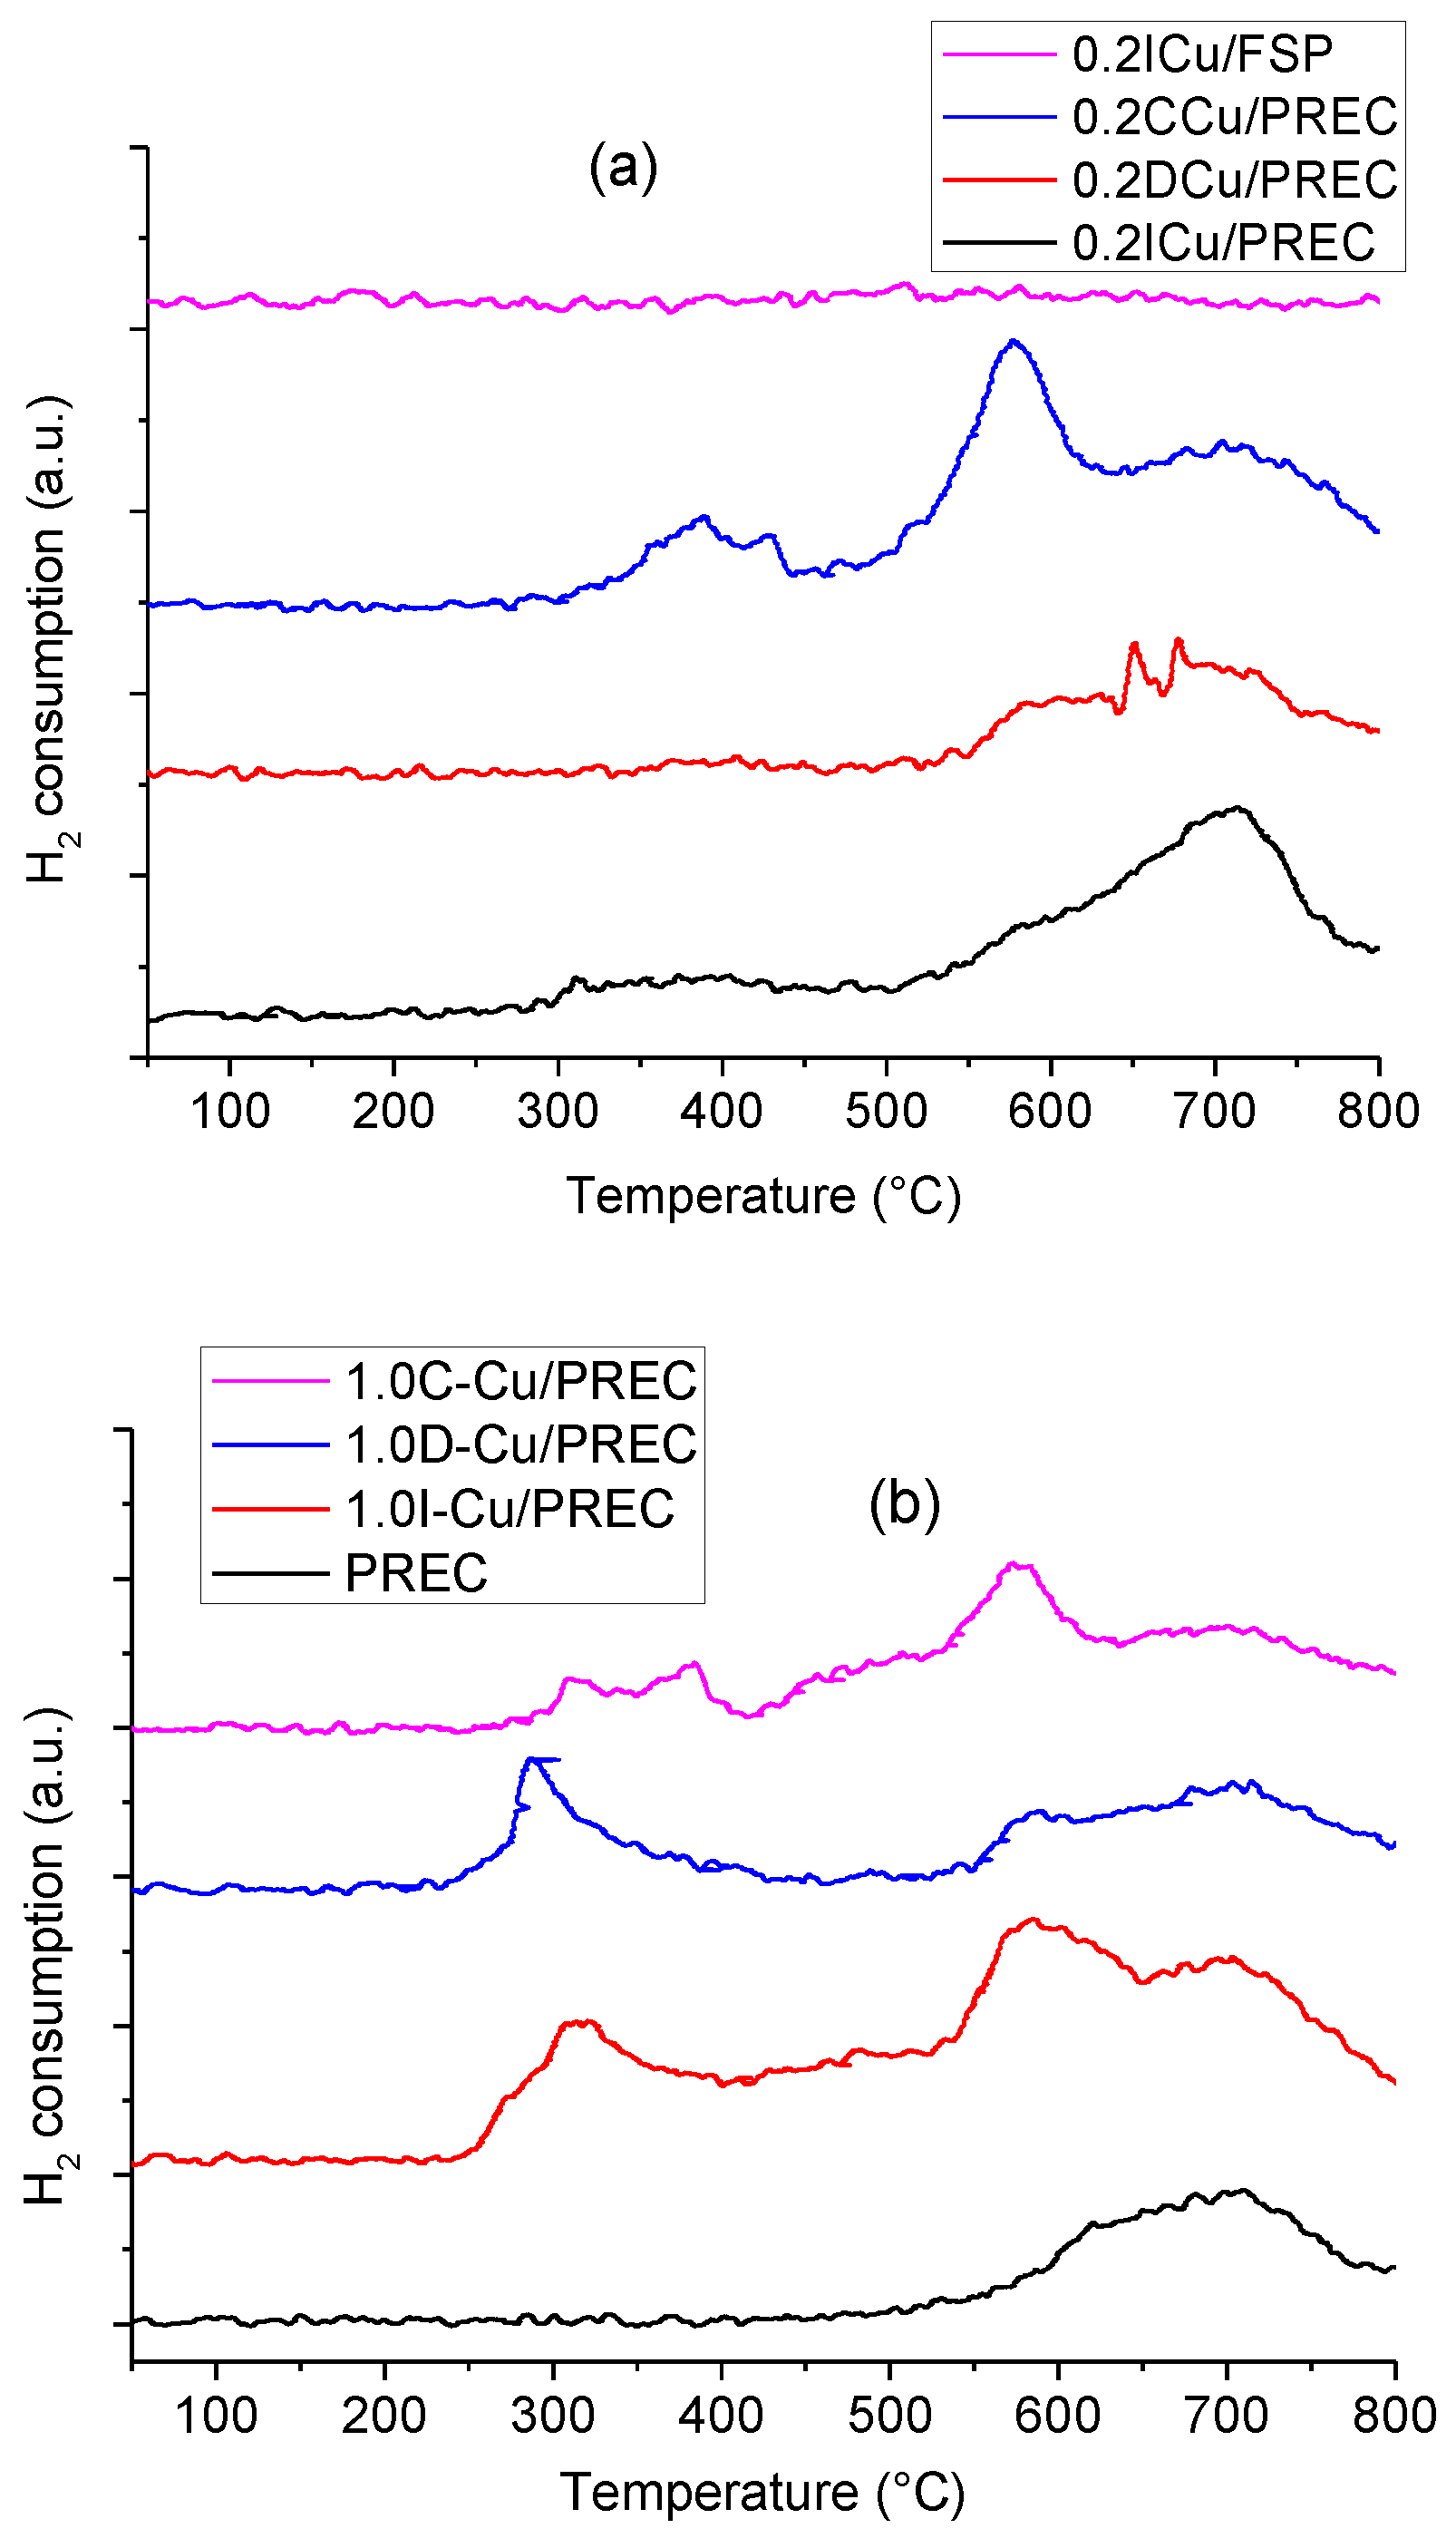
The TPR analyses of Cu-promoted TiO2 are shown in Figure 4. Samples arising from PREC, exhibit two kinds of reduction peaks: one at temperature between 300 and 450 °C and an unresolved envelope in the temperature range 500–700 °C. A TPR analysis of pristine TiO2 PREC was also performed, showing a peak at 700 °C (Figure 4b). So, we can ascribe the observed high-temperature signals to the reduction of titania itself. The lower temperature peaks, weaker for the 0.2 wt % Cu-loaded samples are instead related to the reduction of copper species. Being the reduction temperature of already reported CuO-loaded titania [39,40] lower than those we observed in the present work, we hypothesize a stronger interaction of Cu species with this kind of titania, than for the mentioned references. Since both FSP TiO2 (Figure 4a) and P25 (not shown here) have no high temperature reduction peak at 700 °C, we can also conclude that this intrinsically high reducibility of titania can be related to the preparation technique and could cause the observed strong interaction with copper ions [34].
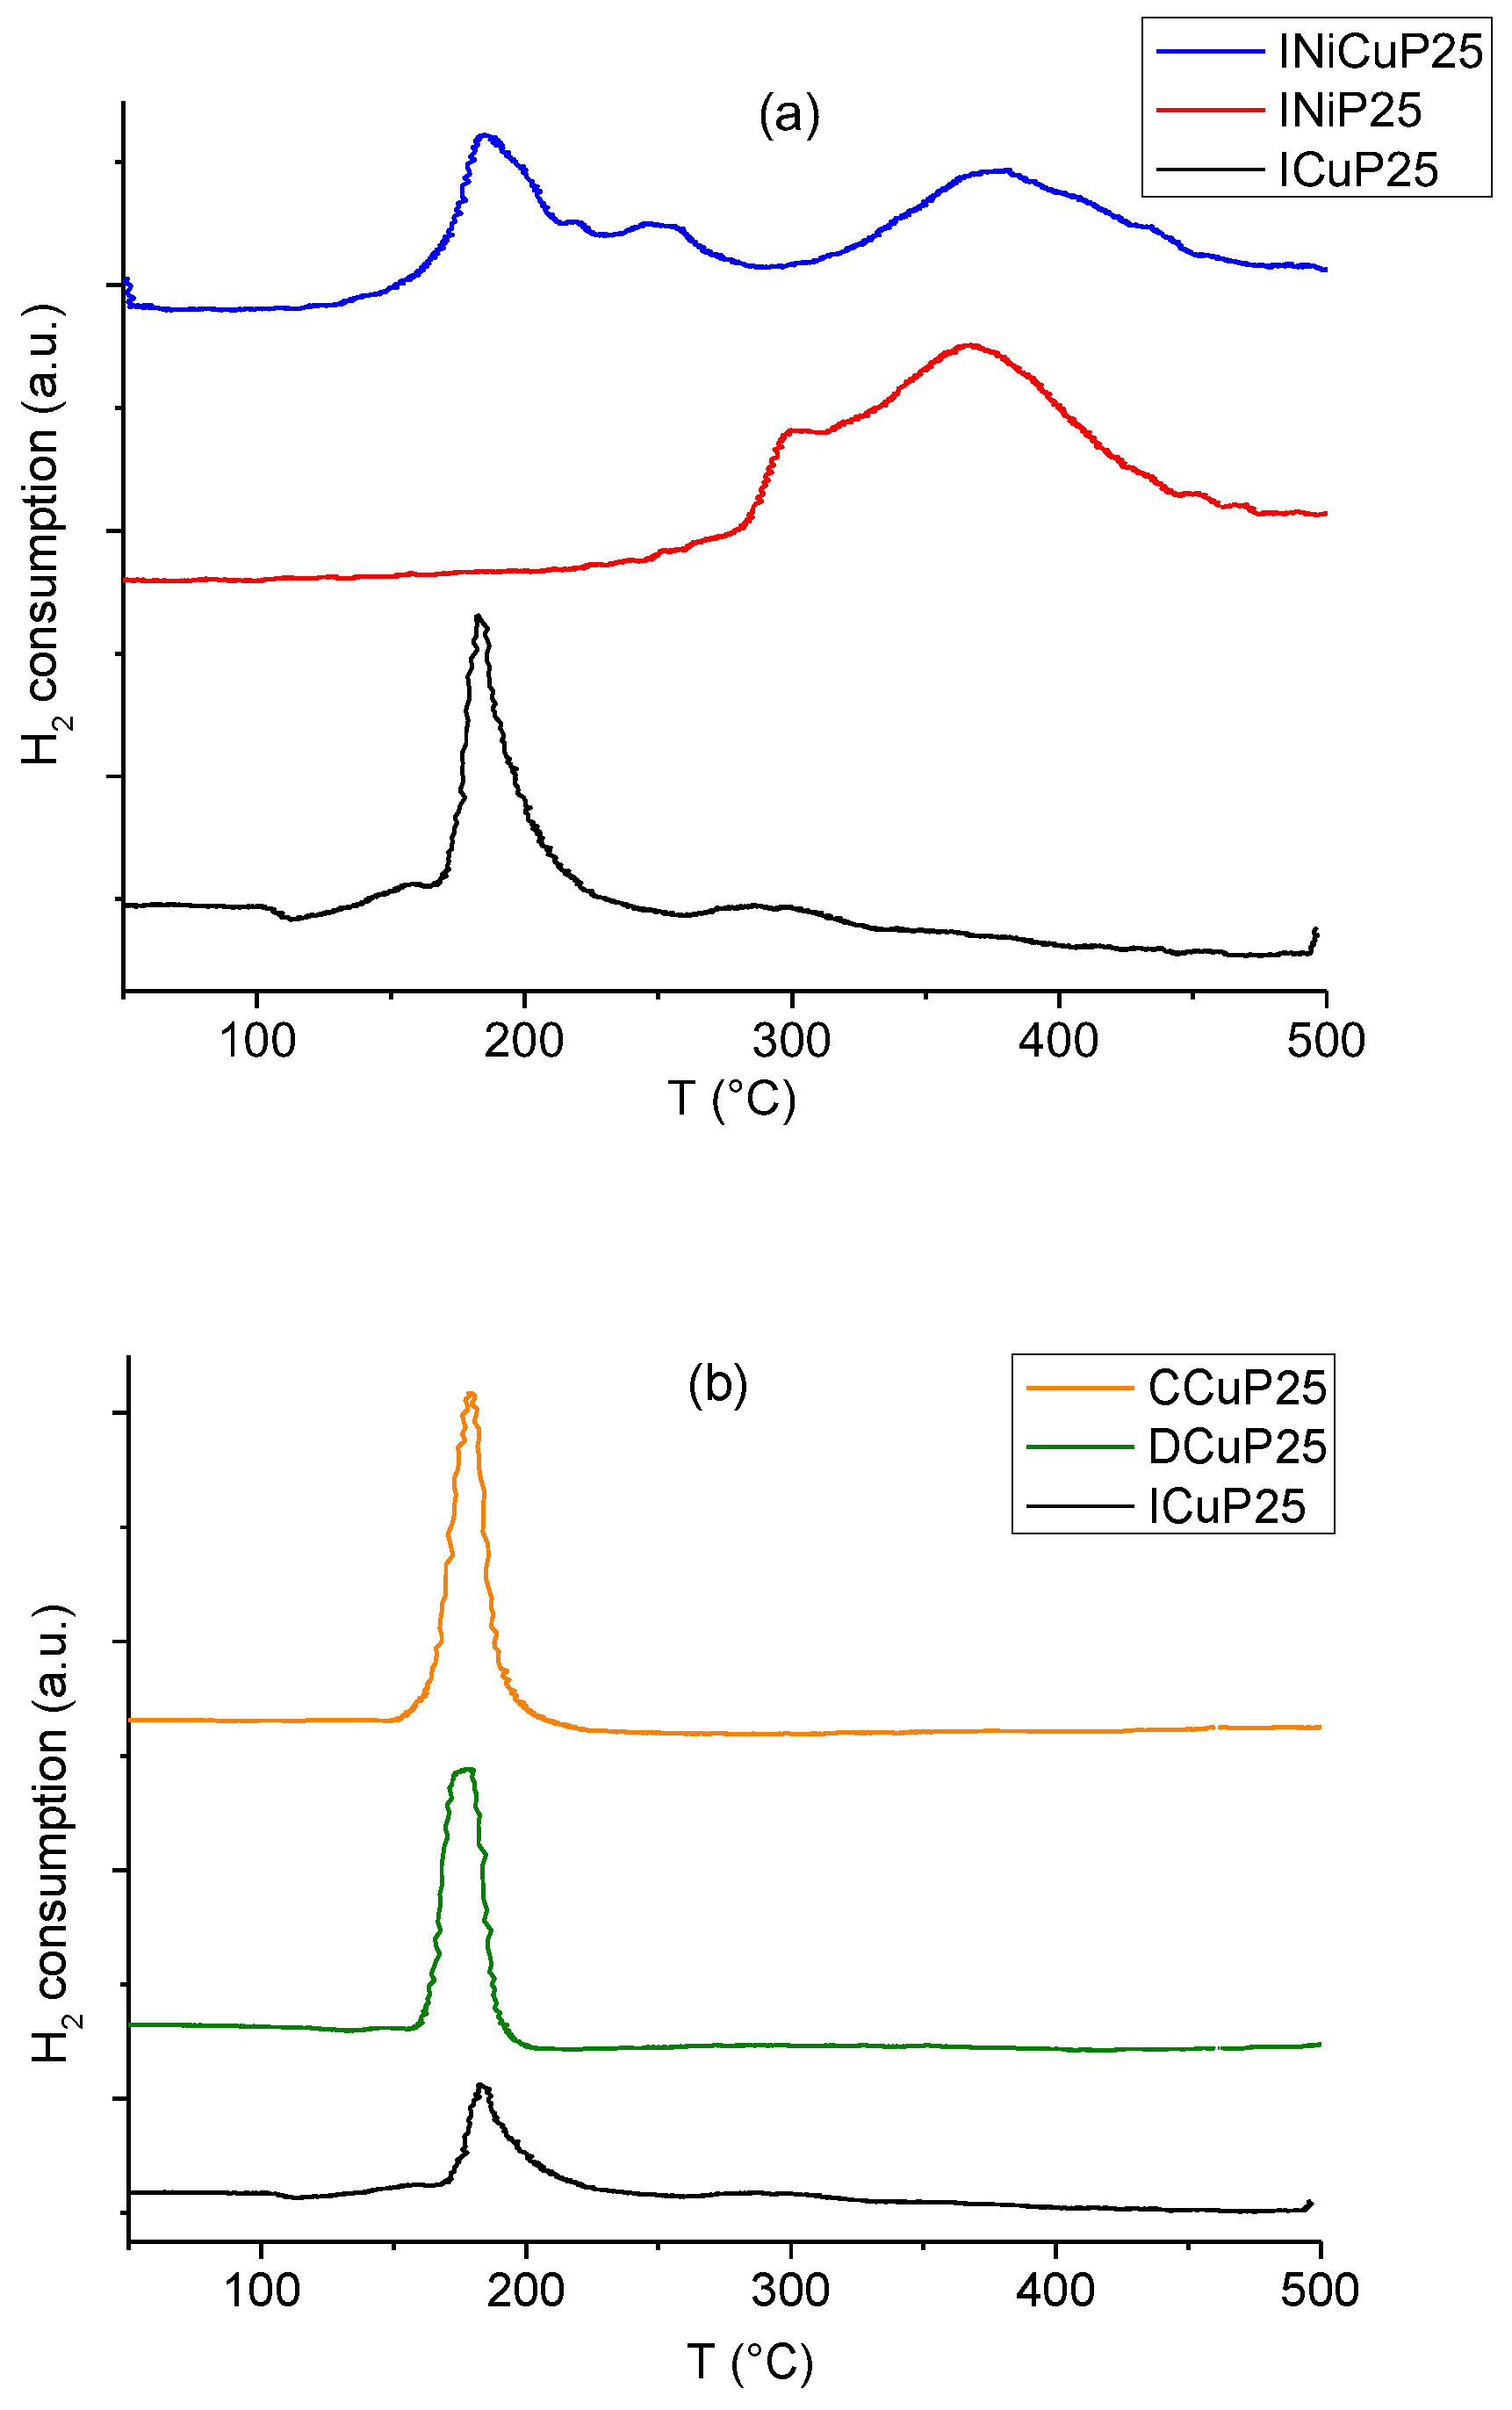
The TPR analyses of Cu-loaded P25 samples (Figure 5b) show sharper peaks with reduction temperature below 200 °C, a temperature lower than that found for both PREC-based materials and those reported in literature [39,40]. This finding suggests that more homogeneous and reducible Cu species were formed on P25 surface. Furthermore, the PC-prepared samples (1.0DCu/P25 and 1.0CCu/P25) exhibit a sharper and stronger reduction peak than the impregnated one (1.0ICu/P25), meaning that the Cu deposition method allows the formation of more reactive CuO species [34].
Comparing the TPR profiles of P25 loaded with Cu, Ni and Cu-Ni by impregnation (Figure 5a) the monometallic samples were characterized by a reduction peak at about 180 °C for the 1.0ICu/P25 sample and by a broad feature centered at about 350 °C for the 1.0INi/P25 sample.
The heterobimetallic sample, 0.5ICu-0.5Ni/P25, showed TPR profile traces closely resembling those of the monometallic sample with two distinct maxima at about 180 and 350 °C, suggesting that CuO and NiO on the surface are not chemically interacting with each other. The low-intensity peak, centered at about 240 °C could be assigned to the reduction of a mixed oxide arising from a strong interaction between NiO and CuO.
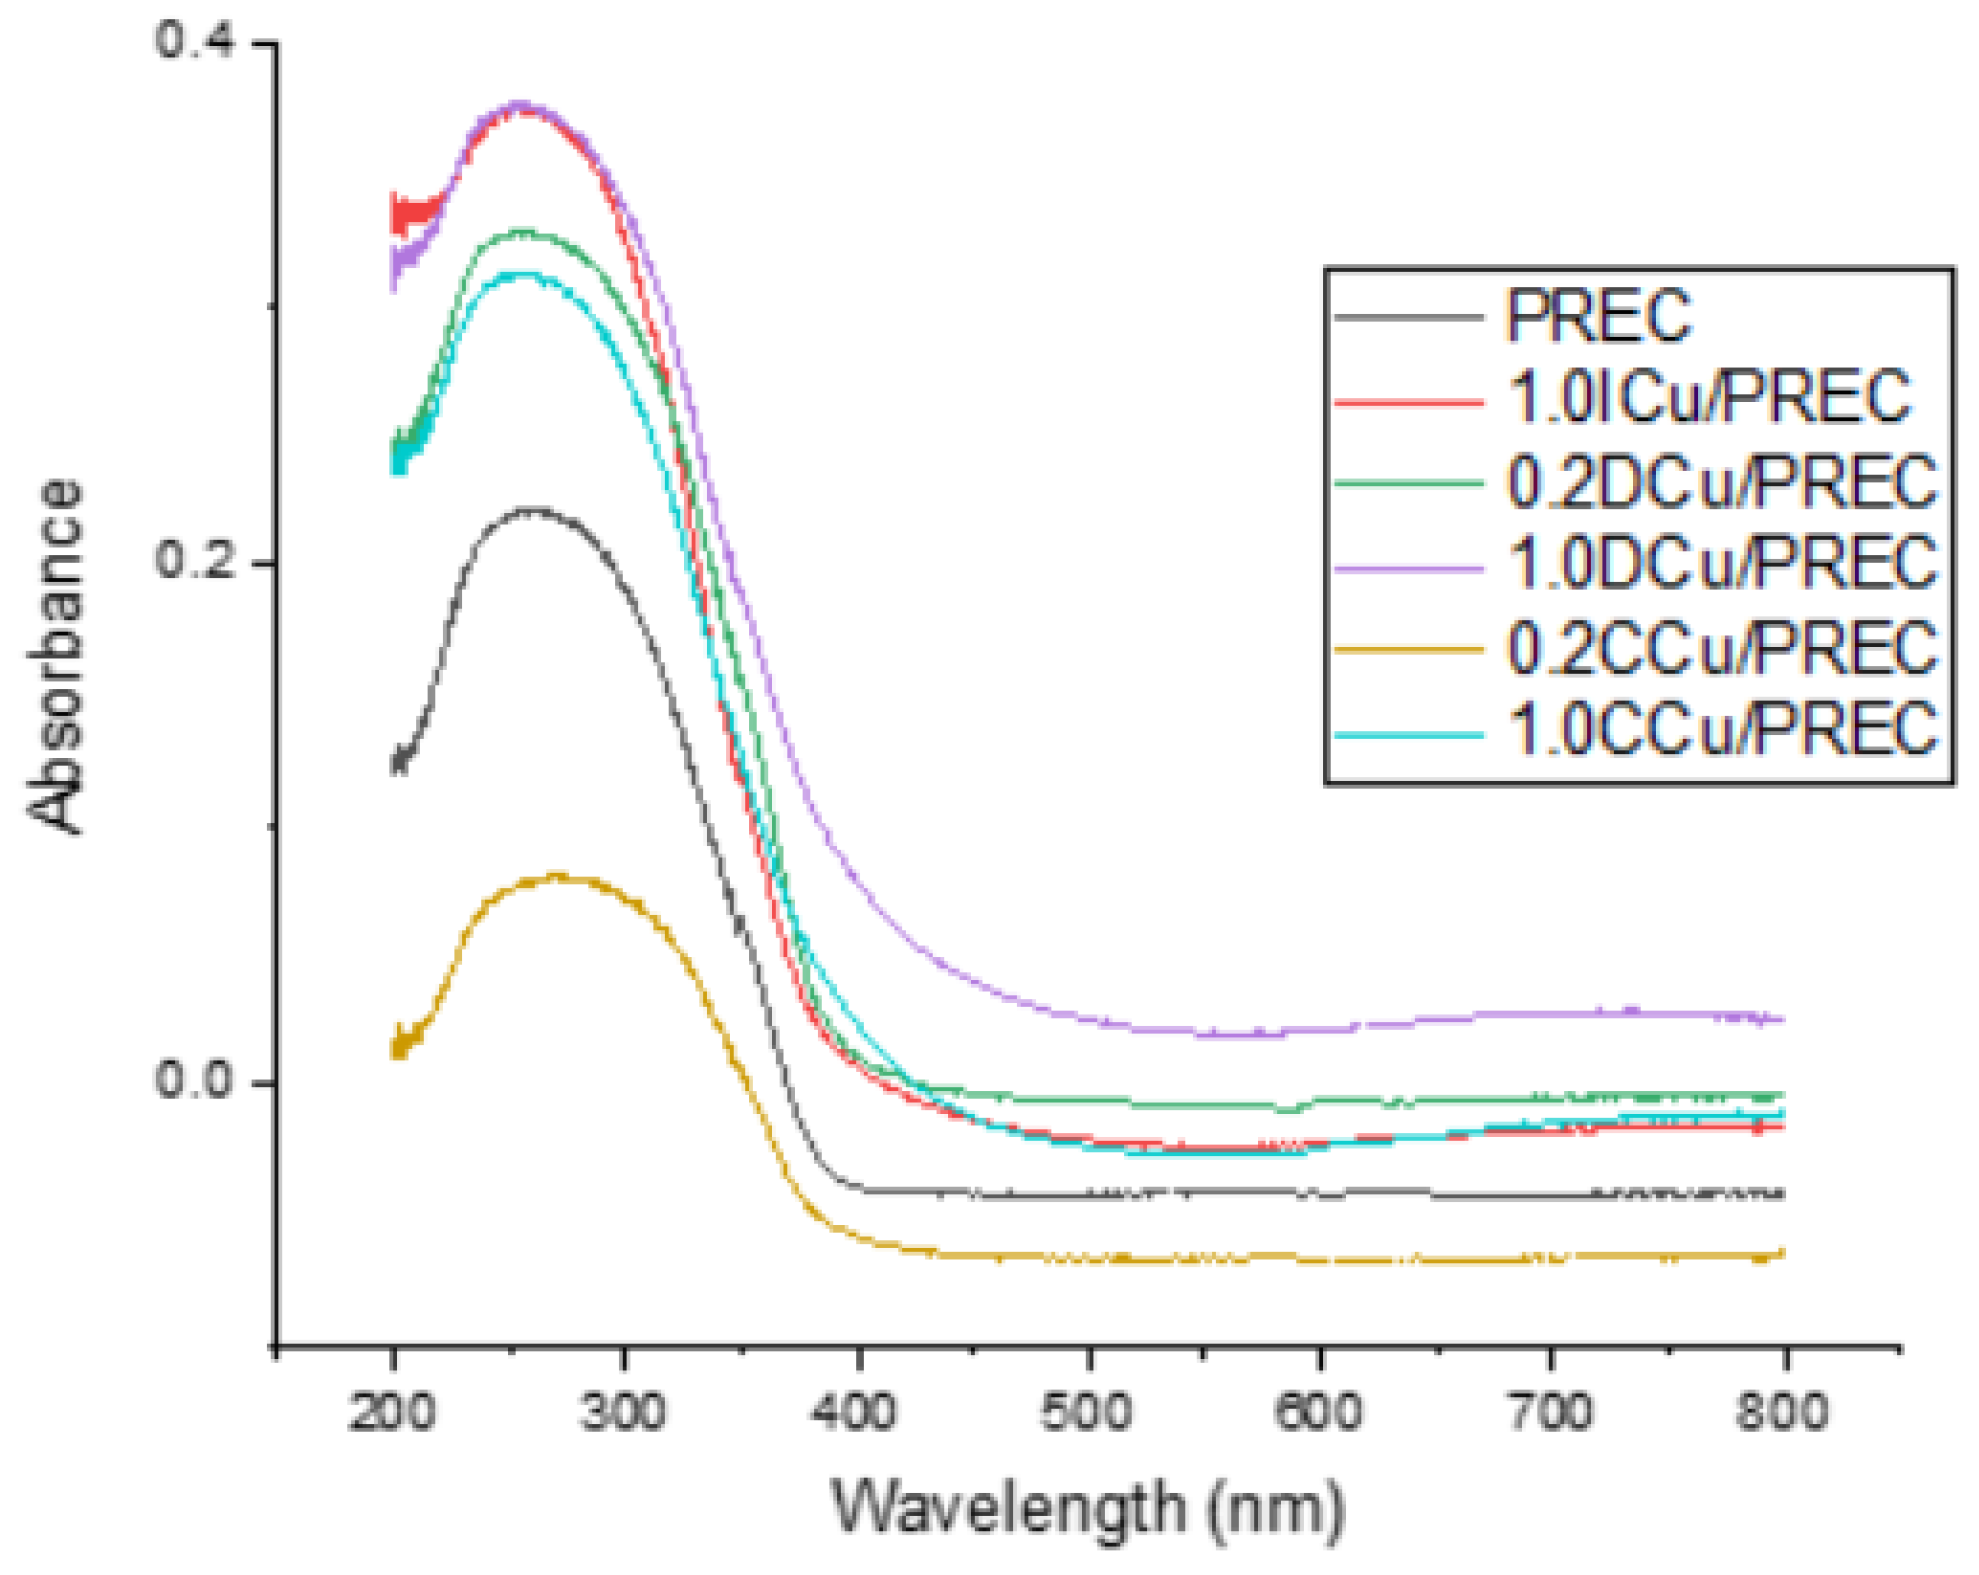
Finally, the DR-UV-Vis patterns of selected samples are reported in Figure 6. The absorption edge of the Cu-loaded catalysts slightly shifted towards the visible region of the spectrum, particularly in the case of the two PC prepared samples at the highest loading. In addition, a small absorption feature centered around 750 nm was evident in the spectra of the samples loaded with 1 wt % CuO. The band gap of the samples was calculated through the Tauc plot and was found essentially similar for all the samples. As the tests were carried out under UV light irradiation, this point is not fully significant to interpret the present activity data.
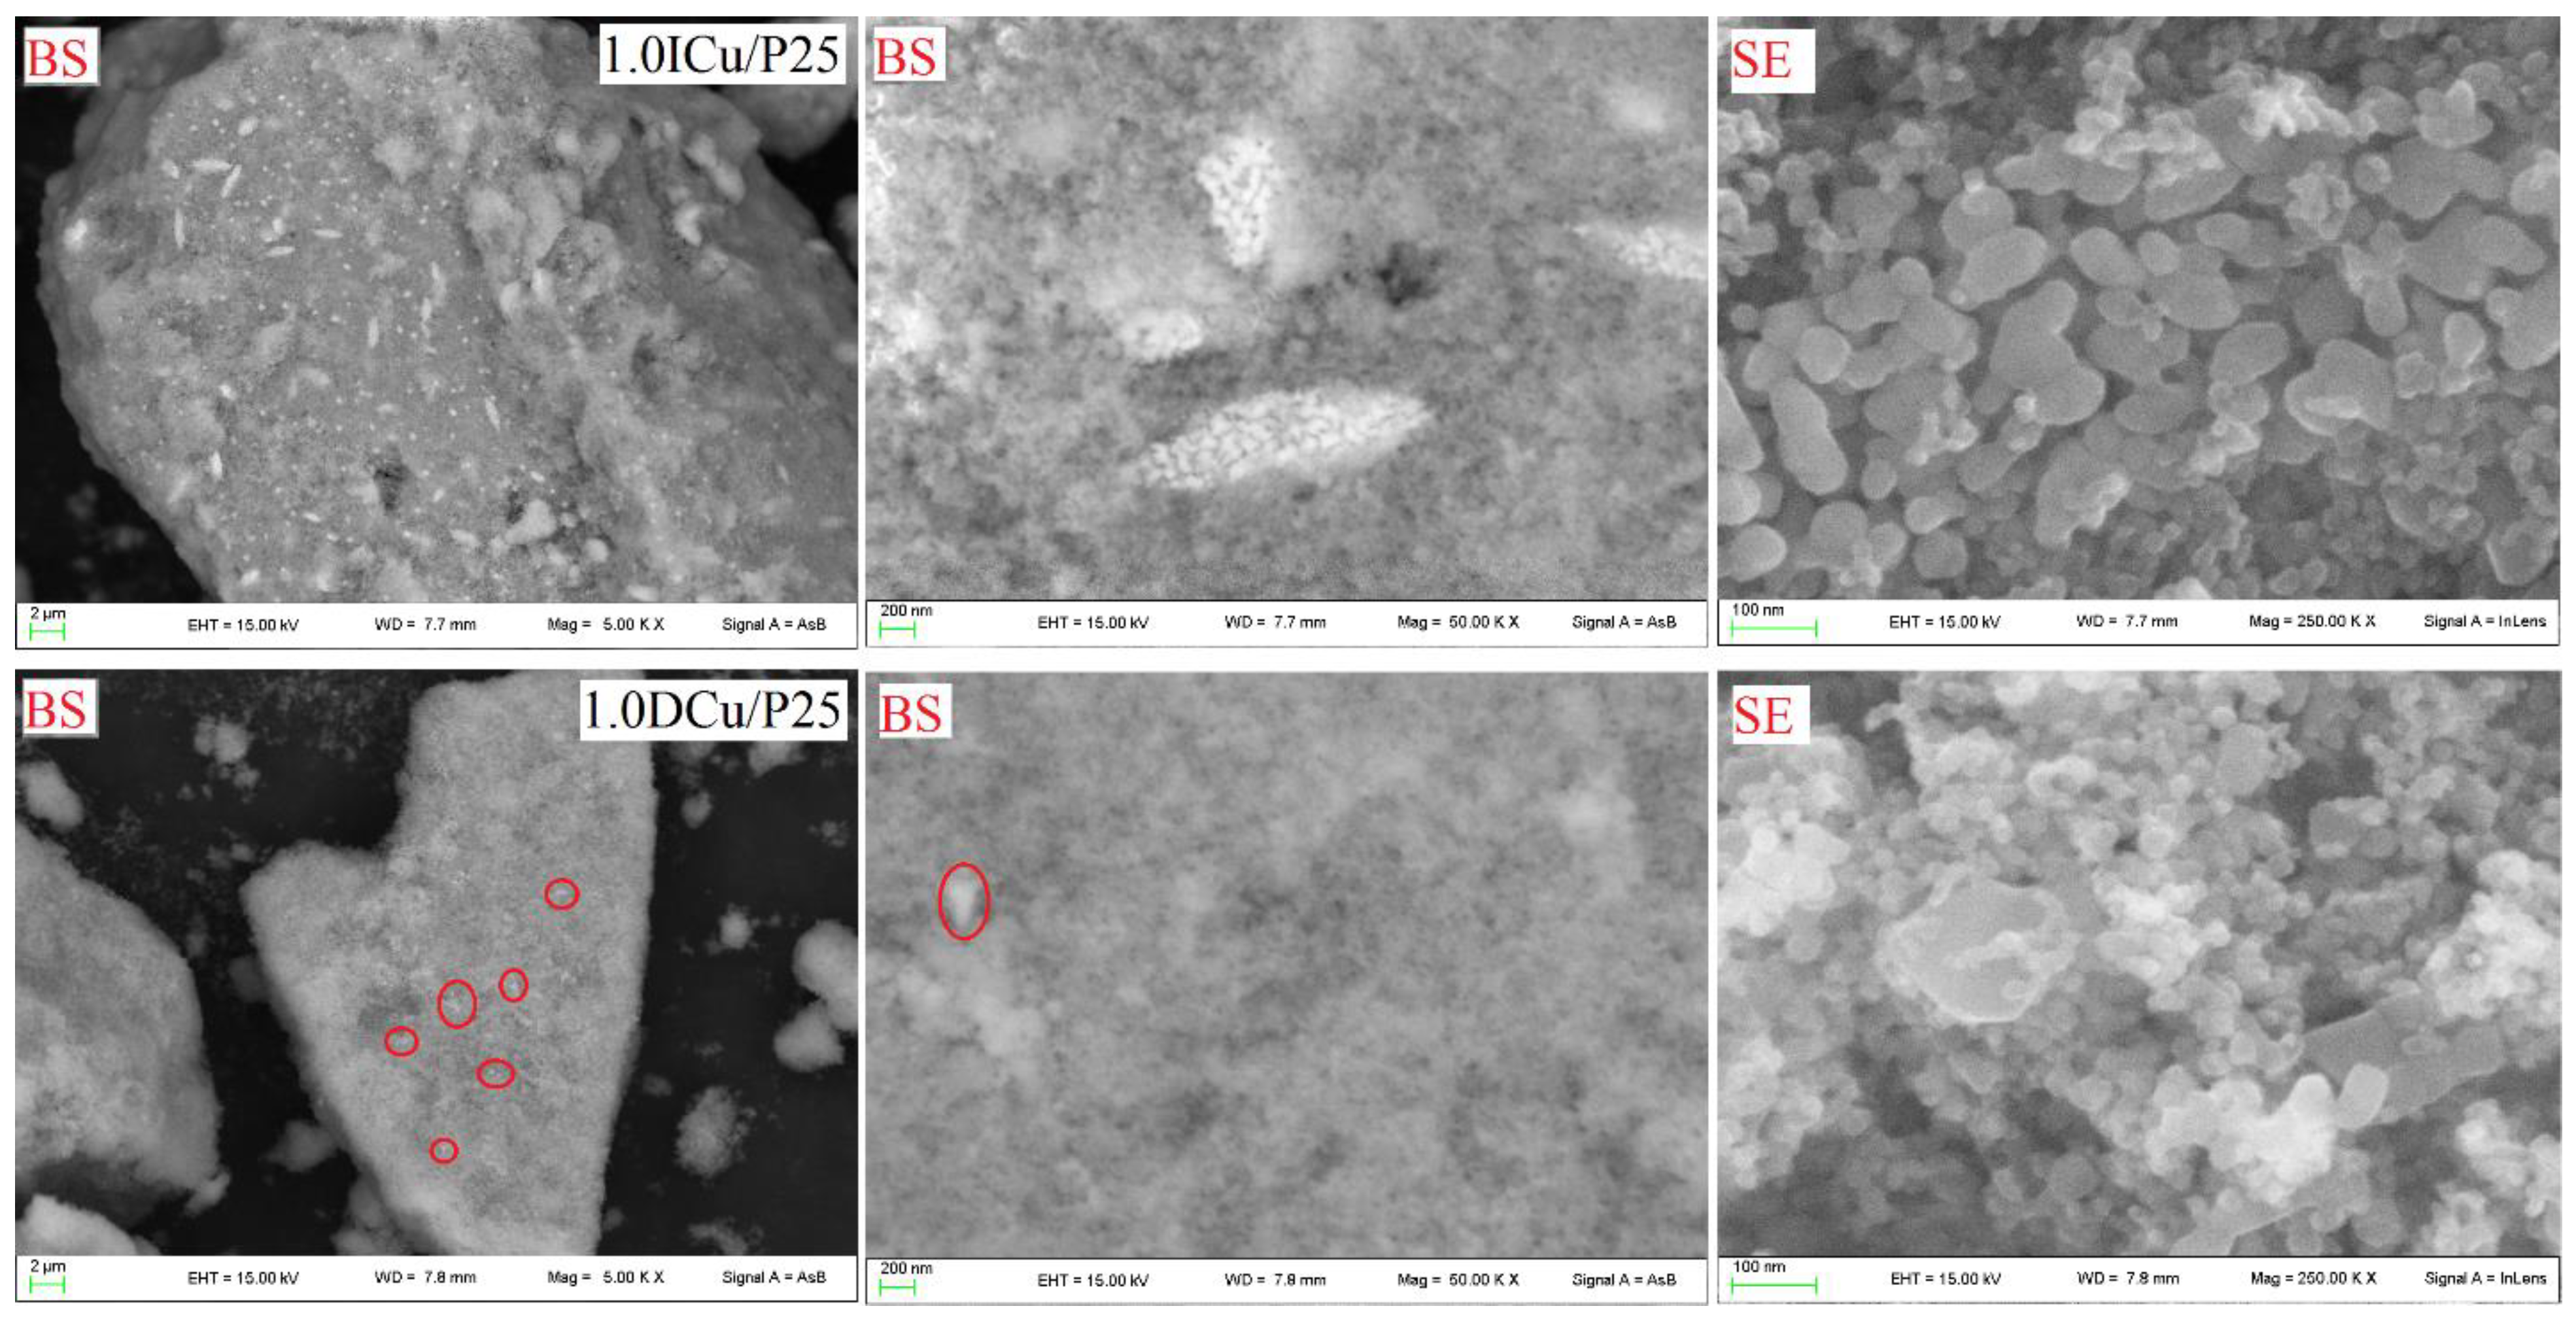
Finally, Figure 7 reports some significant SEM micrographs, monitoring secondary electrons (SE) or backscattered (BS) ones. From the SEM-SE images one can infer the nanometric size of the materials, maintained after the CuO deposition around 50 nm, with a wide array of smaller nanoparticles (ca. 20 nm). The BS electrons have lower resolution, but put in evidence the different density of the elements composing the sample. Heavier elements, like Cu, with respect to the matrix, TiO2, backscatter more electrons and thus appear as brighter zones. The catalyst prepared by impregnation led to less uniform dispersion of CuO, disposing fine nanoparticles in aisles over the TiO2 semiconductor. By contrast, hardly distinguishable CuO nanoparticles are much better dispersed when using propandiol as PC agent. Considering that, from the XRD patterns, no separate phase of metal oxide else than TiO2 could be detected, their particle size should be lower than the XRD detection limit (<5.0 nm).
Overall the PC procedure allowed us to achieve a very high dispersion of CuO, as already highlighted elsewhere for these samples, where CuO clusters were hardly distinguishable even by using High Resolution Transmission Electron Microscopy (HR-TEM) [34].
2.2. Catalytic Activity
All the activity tests have been carried out at native pH of the solution (ca. 5.6). Based on ζ-potential measurement, the point of zero charge of the P25 sample resulted 6.5, suggesting a slight positive charge of the surface under the operating conditions [41]. Furthermore, dynamic light scattering (DLS) showed that the average size of suspended particles ranged negligibly from 126 to 135 when passing from pH 3.5 to 11 [42].
The results of activity testing are reported in Table 2.
2.3. Bare Titania Samples
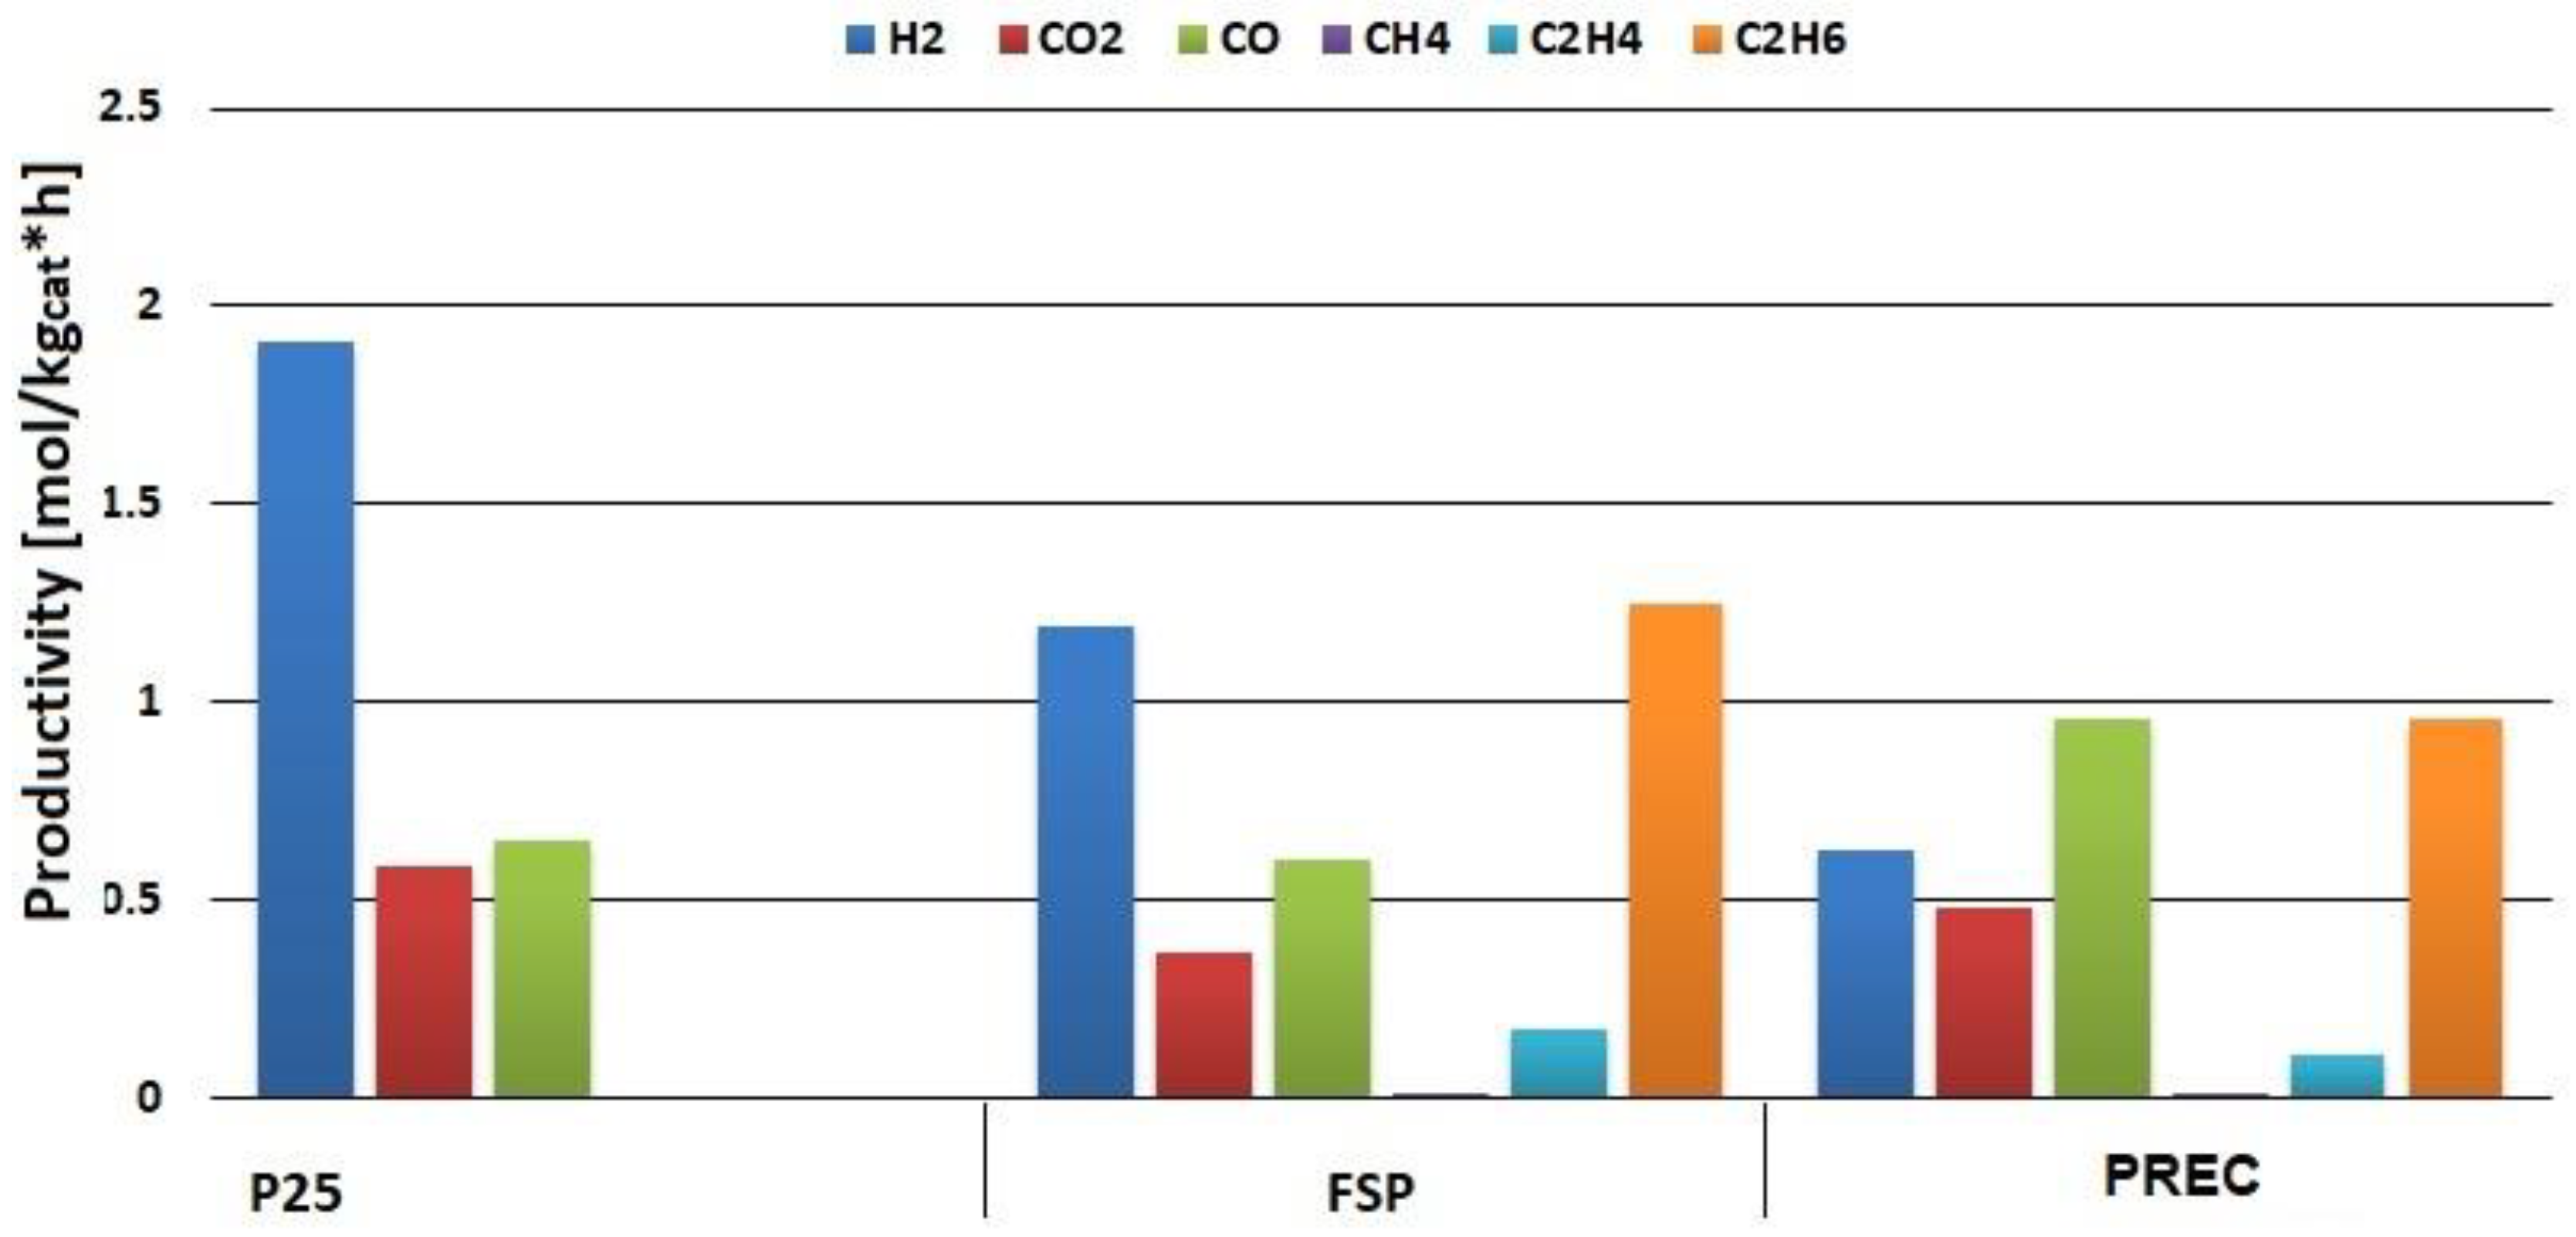
The productivity of hydrogen and other gases formed during the PR of glucose on the different bare titania samples is plotted in Figure 8.
The productivity of H2 decreased with increasing SSA of the semiconductors, passing from the PREC (114 m2/g), to FSP (67 m2/g) and to P25 (44 m2/g). According to Song et al. [43], TiO2 nanoparticles with higher surface area tend to agglomerate easily in aqueous solution due to the high surface energy. Another important feature was the absence of any byproduct in the gas phase except for COx for P25, while ethane, ethylene and traces of methane were observed with the PREC and FSP samples. These byproducts can derive from desorption of adsorbed intermediates once form stable volatile species, which is a faster process than their further conversion over these samples.
The conversion of the organic material followed the same trend of hydrogen productivity, but it should be underlined that a precise speciation of all the intermediates and products in the liquid phase has not been attempted due to the huge number of compounds (differing for C-chain length and oxidation state), possibly deriving from this reaction, each in possibly limited amount. The method used for a rough quantification of the conversion of organics was the evaluation of the chemical oxygen demand (COD). The method has an intrinsic limit due to the fact than the average carbon oxidation state of glucose is known, but the one of the intermediates of reaction is not known a priori. Thus, the translation of the oxidant consumption into a carbon conversion is based on the assumption that only glucose is titrated, i.e., all the organic compounds are assimilated to glucose. This is true for the measurement of C content at time zero, while it is only an approximation for the sample after 5 h PR reaction. This justified the deviations in C balance that tend to overestimate the C consumption, up to 10% (Table 2).
Furthermore, hydrogen productivity increased when passing from the sample obtained by precipitation, which is constituted of a pure Anatase, to mixed phase ones. Indeed, both the P25 and the FSP catalysts were prepared through a similar procedure, resulting similarly constituted of dense nanoparticles with similar mixed Anatase/Rutile phase composition (67–80% Anatase, higher for P25, the remaining portion being Rutile). As the interface between the two titania phases is known to favor the charge separation, the higher activity exhibited by the mixed phase samples (FSP and P25) is therefore explained [44,45].
Li et al. [46], studied the influence of Anatase-Rutile phase structure on hydrogen productivity, tuning the calcination temperature in catalyst preparation. Their observations are in fair agreement with this study. Accordingly, the higher the calcination temperature, the higher the conversion of Anatase phase into Rutile modification and the lower the surface area.
The C balance was computed considering the apparent conversion measured through COD, the amount of C-containing compounds in the gas phase and the residual organics present on the surface of the recovered catalyst, measured by TGA analysis.
For instance, according to TGA analysis performed on P25 powder left in an aqueous glucose solution for 18 h, a 5% loss of weight was measured due to surface adsorption of glucose. Furthermore, to qualitatively assess the nature of the adsorbed species, some IR spectra were recorded and compared with pure glucose. The results are provided in Figure 9. The P25 powder as such was compared with the filtered P25 sample obtained after the PR reaction.
The IR spectrum of the catalyst before reaction shows the typical feature of P25. The main bands can be observed near 3400 cm−1 (this band is very broad) and 1600 cm−1. Both these absorptions are due to the adsorbed water on the surface of the material exposed to the air. Other bands observed at lower frequencies can be assigned to impurities present from the preparation of the material. By comparison of the spectra before and after the reaction, the main difference can be observed in the spectral range between 3600–3000 cm−1. This is the region of OH stretching, so a possible interpretation could be that bands due to OH stretching of small amounts sugar are overlapped to hydroxyl bands of water. Moreover, near 2300 cm−1 a weak new band seems present. At these frequencies falls the stretching of CO2. Consequently, we cannot suggest the presence of carbon dioxide adsorbed on the surface of the catalyst as a product.
This analysis confirms that there is no major surface adsorption of reactant and intermediates, as quantified by TGA. Thus, the P25 sample seems able to convert rapidly the surface adsorbed species and to lead to full conversion of the reactant to H2 and COx. On the contrary, as described in Figure 8, incomplete conversion of the C2 intermediates occurred in the case of PREC and FSP, due to an overall lower activity, though without significantly higher amount of species remaining adsorbed over the surface (ca. 5 wt % from TGA also for these samples).
2.4. Metal-loaded Titania Samples
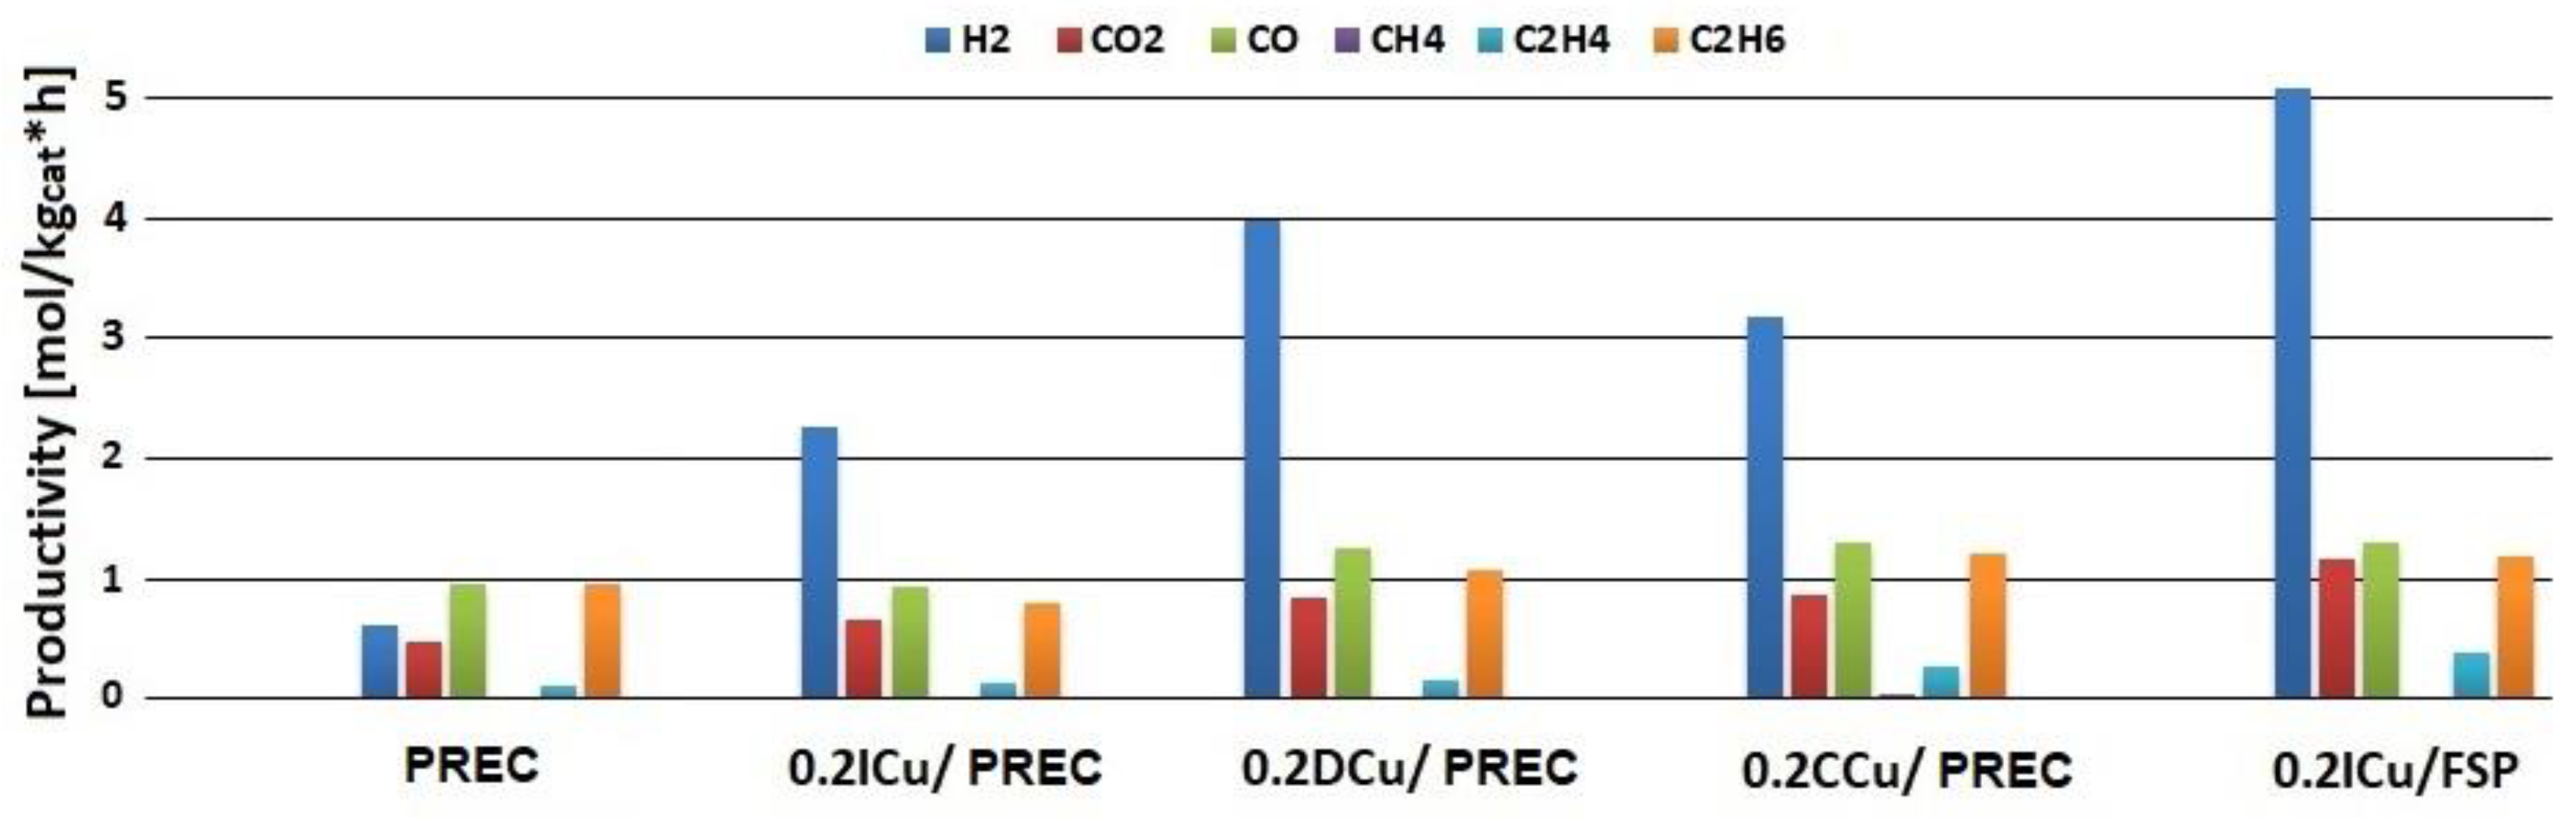
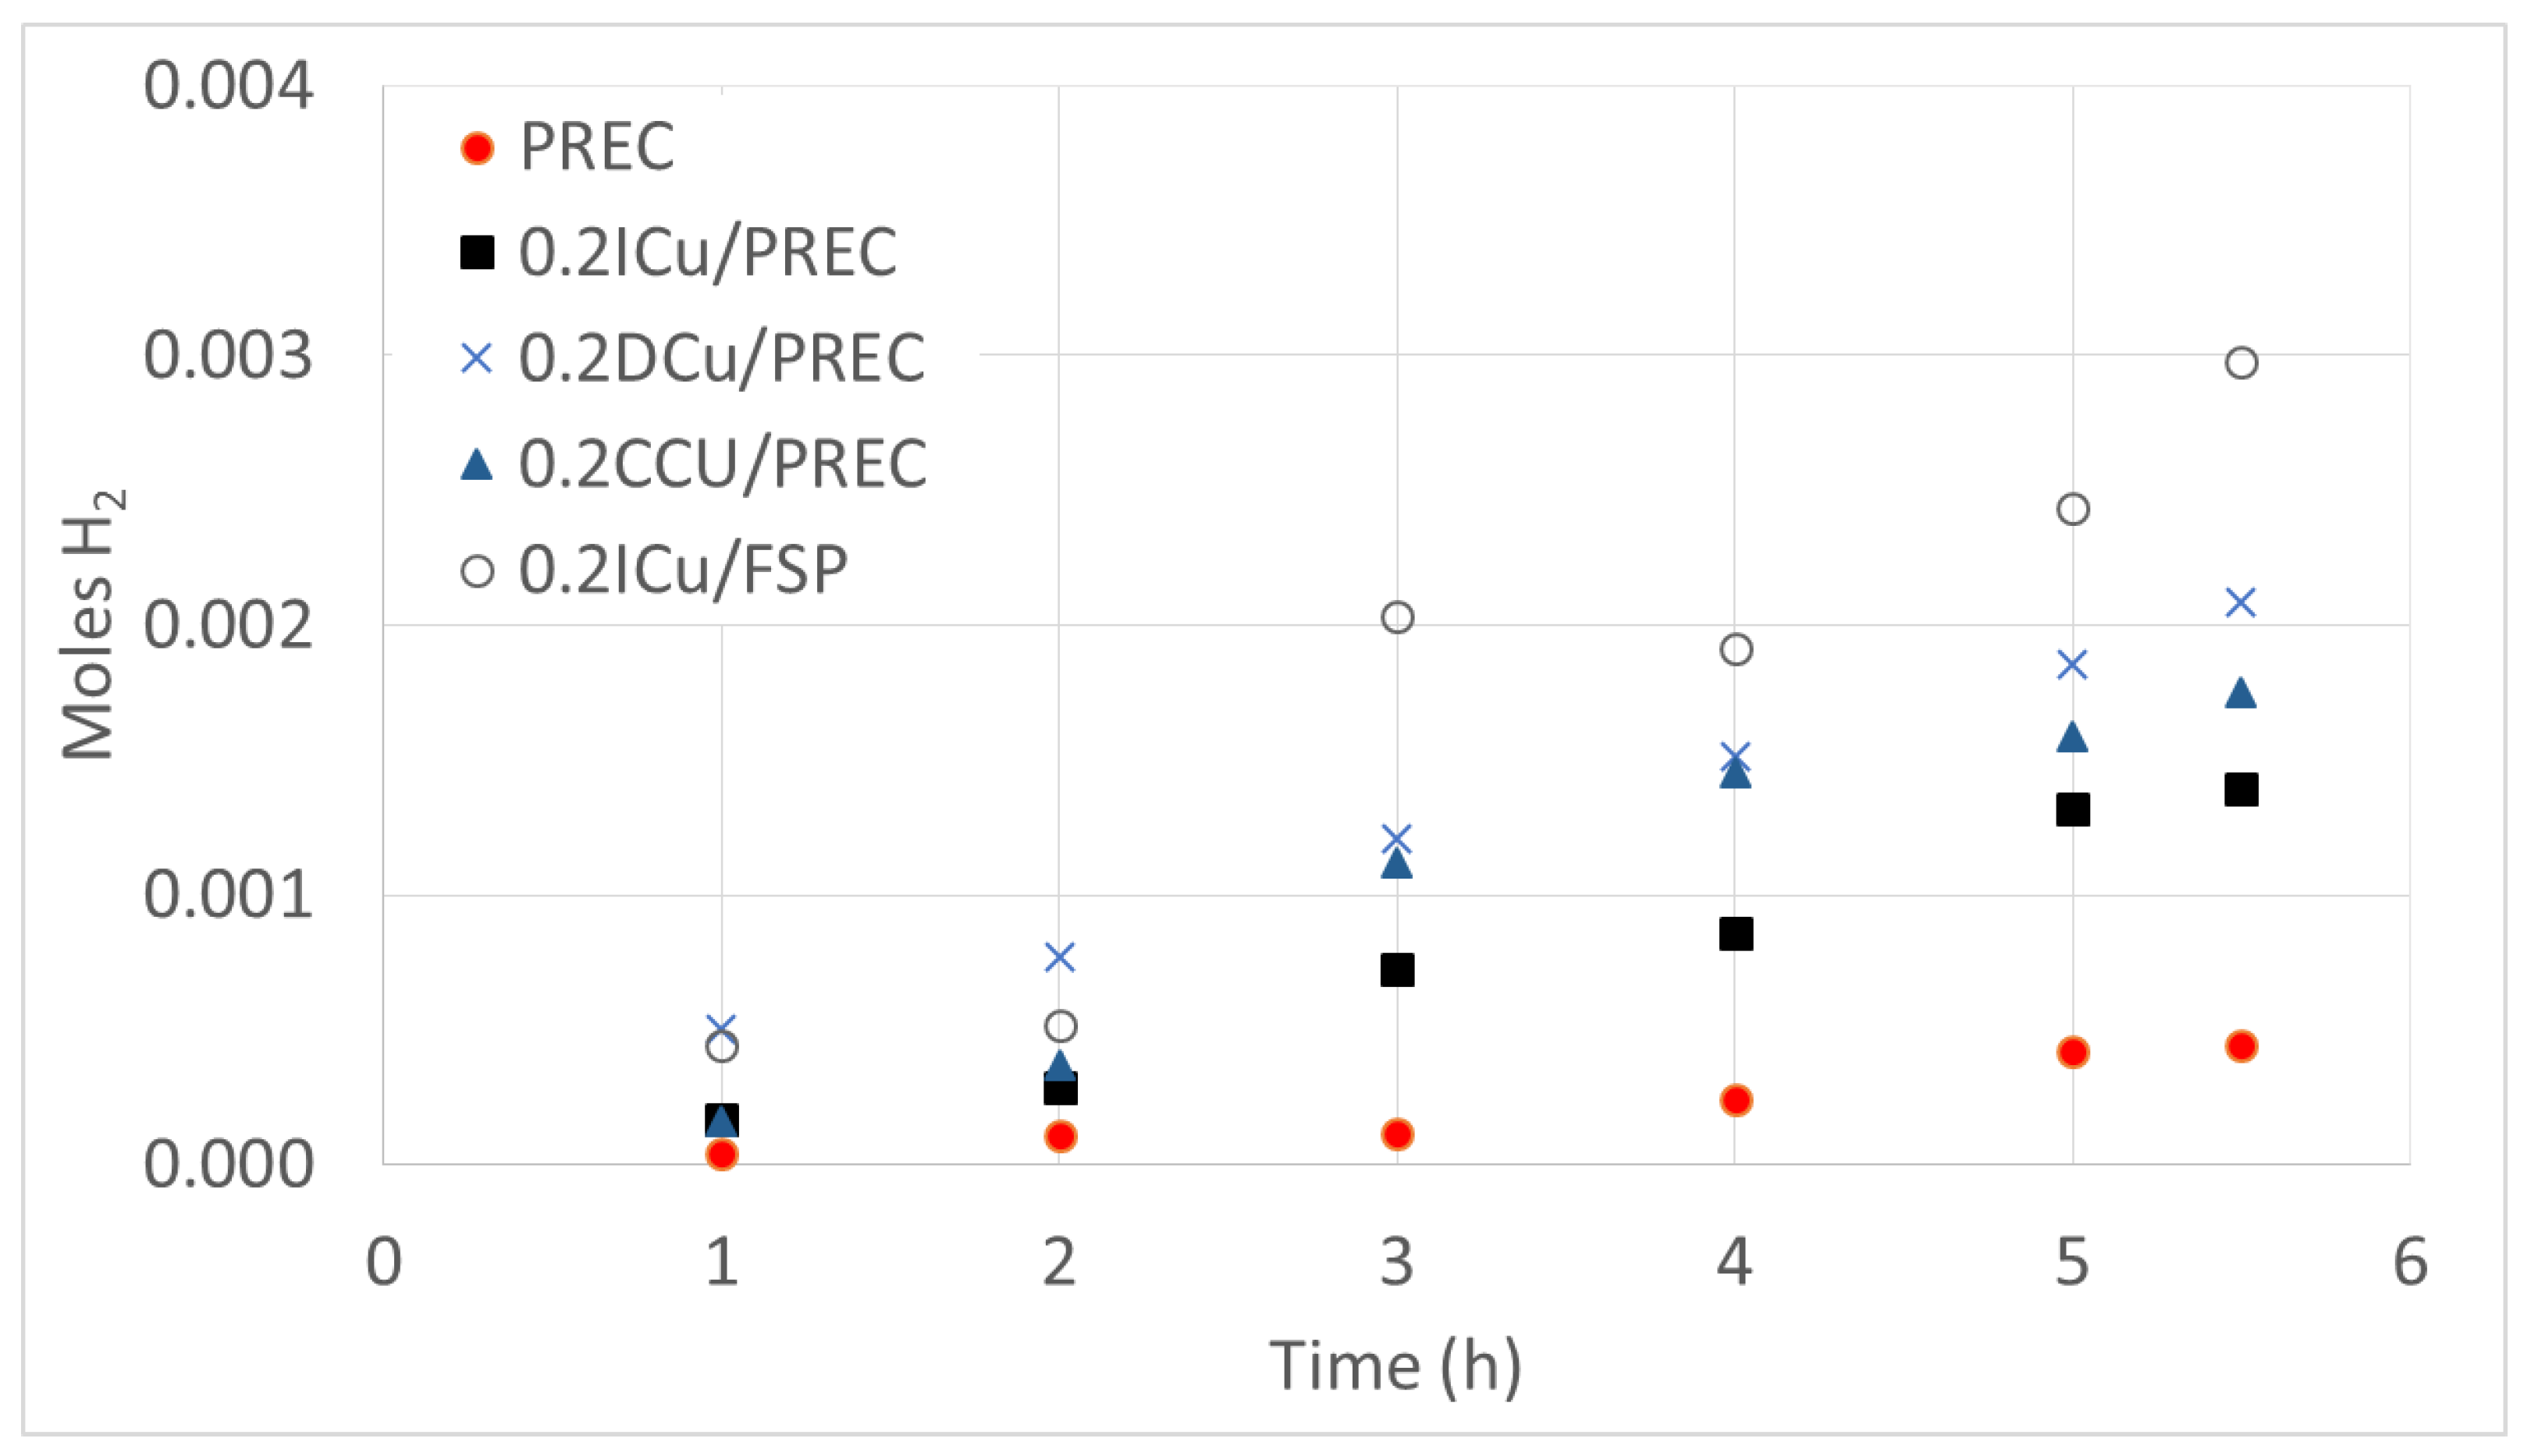
When 0.2 wt % CuO was loaded on different TiO2 samples, PREC and FSP, the H2 productivity increased by five to six times, as shown in Table 2. In particular comparing Figure 10 and Figure 11 the H2 productivity followed the order: PC with 1,3-propanediol (D–Cu: 3.98 mol/kgcat h) > PC with citric acid (C–Cu: 3.18 mol/kgcat. h) > impregnation (I–Cu: 2.26 mol/kgcat. h).
These results suggest that the high dispersion [47] achieved by the PC method and the role played by the organic ligands in promoting the formation of “narrow-sized” materials [20] have a beneficial effect on H2 production. Even higher productivity was achieved with the FSP-based sample (0.2ICu/FSP) sample, leading to 5.07 mol/kgcat h, mainly given to the intrinsically higher activity of the FSP photocatalyst with respect to PREC.
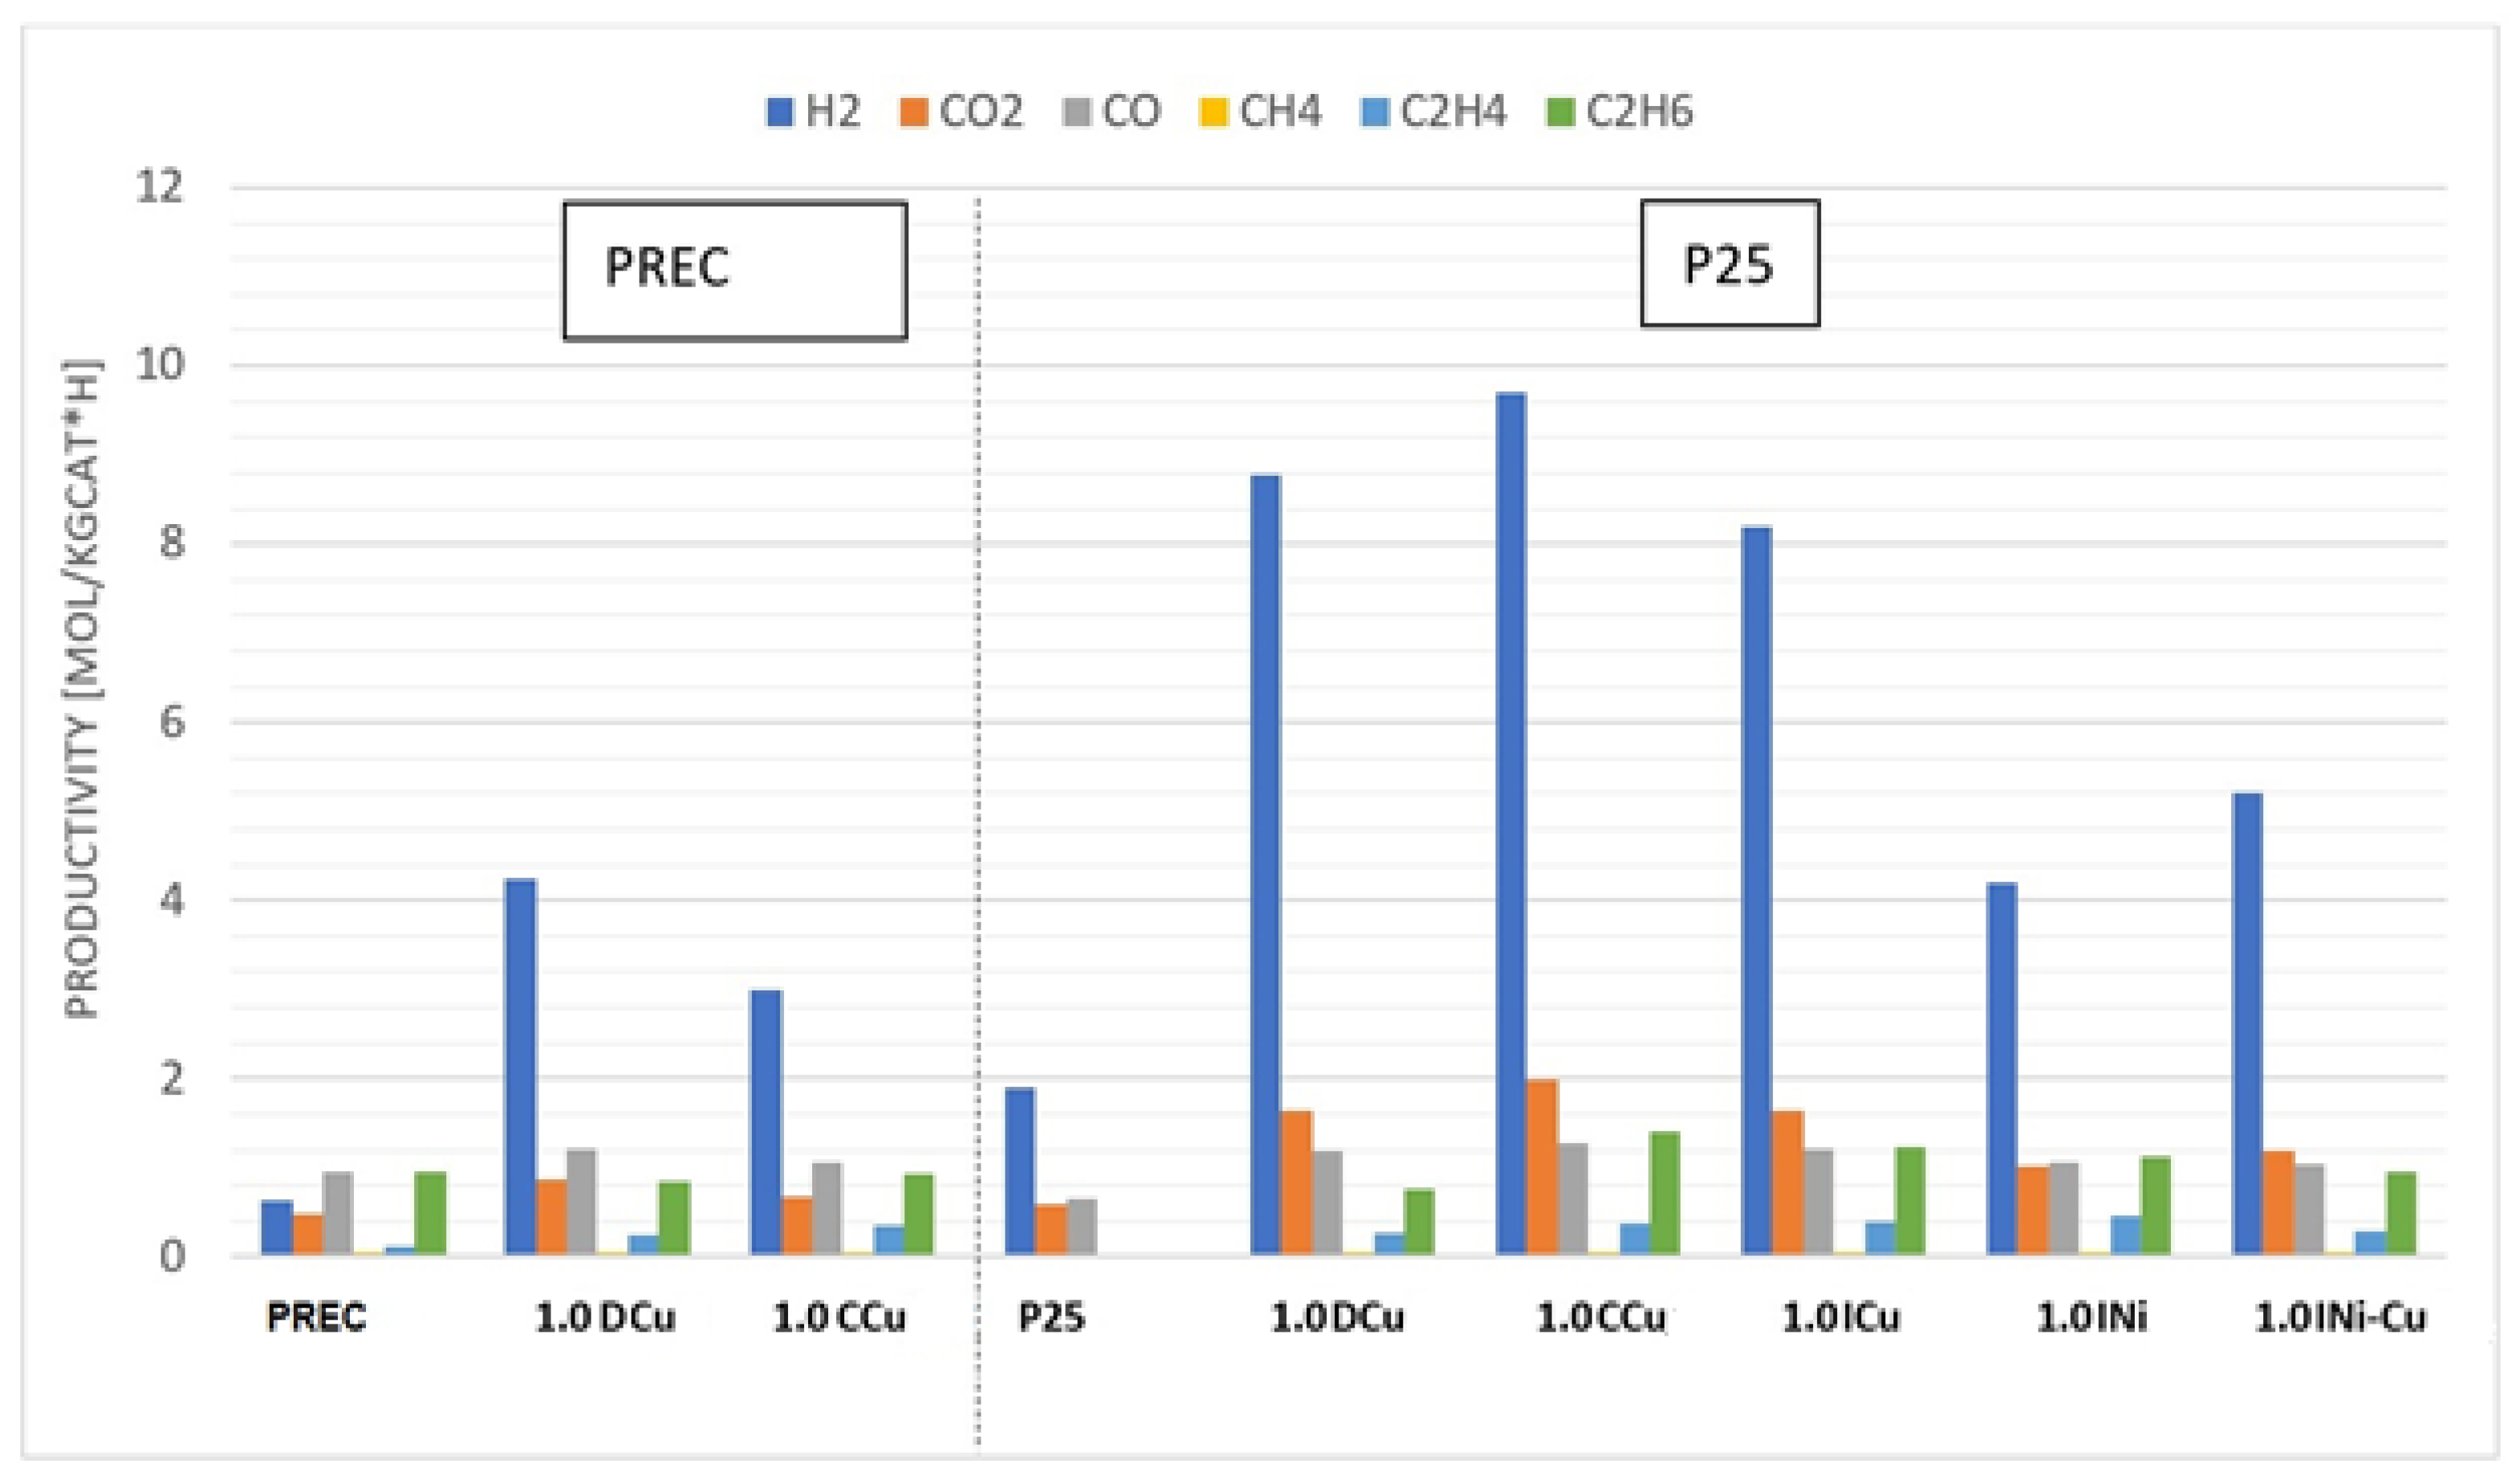
A further slight increase of productivity has been observed by increasing the CuO loading to 1 wt % (Figure 12) by precipitation with 1,3-propanediol (4.24 mol/kgcat h).
Therefore, CuO addition demonstrated a good strategy to improve activity, through better charge separation, for single-phase titania (PREC samples).
However, since the best-performing TiO2 was P25, a set of samples loaded with CuO (1 wt %) by the three different methods has been compared (Figure 12). Once again, the PC method led to the best results (8.78 or 9.71 mol/kgcat h for the samples prepared by the D and C methods, respectively, Table 2). As evidenced from TPR analyses, the higher reducibility (lower reduction temperature) of CuO on P25 can explain this huge improvement of photoactivity. Focusing deeply on the three synthetic procedures for the PREC series, the D and, in particular, C samples, perform slightly better than the I sample. Contrary to P25-based samples, the reducibility of CuO species (Figure 4b) seems to be the same, regardless of the copper introduction technique. However, on I-Cu/PREC samples, the copper being introduced on unannealed Ti(OH)4, it is likely that copper has been partially buried within TiO2 by cation substitution [38], as also evidenced by the significant alteration of SSA. This phenomenon eventually affords fewer available surface Cu active sites.
Furthermore, compared to pristine P25 and PREC samples, the Cu-loaded catalysts exhibited a slight increase of CO2 yield with respect to CO. This may be related to the overall improvement of activity upon Cu addition, which pushes forward the oxidation of the organic substrate.
The increase of activity after Cu loading led to the appearance of ethane and ethylene also in the case of Cu/P25 samples, though in a more limited amount with respect to H2, the main product.
On the contrary, NiO did not prove an efficient cocatalyst as such, in contrast with what was reported in previous studies [8,48], leading to almost half the H2 productivity with respect to the homologous CuO-loaded sample. It has been reported that NiO-based cocatalyst is less effective than metallic Ni to effectively run the reaction [49], while the opposite holds for CuO. This finding not only could explain the poor observed activity, but also makes more difficult the management of the right oxidation state for the two cocatalysts, since CuO is by far more reducible than NiO. Some activity increase has been observed for the heterobimetallic formulation, though it is unsatisfactory with respect to the singly promoted Cu-based sample. No specific synergy between the two metals was observed, the activity seeming mainly additive. Therefore, the possible small amount of intermetallic species noticed in the TPS plays a minor role.
2.5. Basic Cost Assessment
The estimation of H2 production cost through the proposed method and materials has been done by considering the rough cost of the catalyst needed for one test, based on the raw materials quotations on the market. As the cost of production we considered the electrical energy to feed the UV lamps for 5 h and the cost of raw glucose. The investments for the photoreactor and products separation have not been included since the research is too preliminary to design and quote these items, but they are considered the same for the different catalysts. Notice, however, that the separation or purification can be in principle unnecessary, using the produced gas as such. When a high concentration of C2 species is present, they enhance the heating power of the mixture, suggesting the use as fuel for combustion [32]. Otherwise, the reformate mix can be used in high temperature fuel cells, such as the molten carbonate or the solid oxide ones, where CO does not represent a problem.
The results have been compared with the H2 market price (mp) for the most interesting catalytic systems we tested or developed until now: bare P25, 1.0 wt % Cu/P25 and a 0.1 mol % Pt/P25, as reported elsewhere [32,50]. The highest value of hydrogen productivity was obtained with 0.1 mol % Pt/P25 (14.70 mol/kgcat h), which is a considerably high production rate with respect to previous studies [8,10,11,12]. However, the addition of Pt implies an investment cost, which may not be recommended to set up an emerging technology. Therefore, this high-productivity catalyst was compared with the best-performing catalyst of the present work, loaded with CuO and with unpromoted commercial titania.
Remarkably, by comparing the cost of H2 production, the Cu-loaded sample was the most economical option, as well as the more environmentally friendly, with respect to the Pt-loaded one. According to this very preliminary assessment, the major contribution for the final cost is given by the electric power and by the cocatalyst cost. Therefore, the cost of H2 production for bare P25 and metal-loaded P25 samples have been calculated and the results have been reported in Table 3. Since the cost of the catalyst is significant per single test, we have repeated the same calculation by assuming one month’s continuous operation (24 h, 30 days). No data are available at the moment on continuous flow operation for prolonged time, but this fixes a minimum target for feasibility. This assumes the development of a continuous process in which the catalyst is either recycled in daily batch procedures, or, more conveniently, immobilized over a support allowing semi-continuous operation, provided the demonstration of recyclability or operation for such a time, which will be the next step of this investigation. In this way, the operating costs become predominant, though a non-negligible effect of the catalyst cost is also visible. Under such conditions (last column in Table 3), the hydrogen production cost roughly follows the productivity scale, but balances the improvement of productivity with the cost of the co-catalyst.
Different alternative options are available to produce H2 from biomass, as alternative to the conventional methane–steam reforming route. Examples are biomass gasification, the production from specific algae, biomass anaerobic fermentation to biogas and its subsequent dry reforming (catalysts based mainly on Ni and Pt supported on Al2O3), biomass fermentation to bioethanol, pyrolysis to bio-oil and their subsequent steam reforming to reformate gas (catalysts based mainly on Pt, Pd, Ir, Rh, Ni and Co, supported over poorly acid supports, e.g., SiO2, TiO2 or base-promoted Al2O3). Completely different options are based on other renewables, e.g., exploiting wind, solar or nuclear generated electricity for water electrolysis, or again the direct photocatalytic water splitting or the presently considered photoreforming of biomass-derived compounds (mainly over noble metal promoted titania photocatalysts). All these technologies have different degree of maturity and perspective costs.
Compared to the cost of production of hydrogen by steam–methane reforming (2.27–2.08 $/kg, with or without carbon capture technologies, respectively), different values for the market price of renewable H2 have been recently proposed. For instance, power-to-gas processes have been proposed for the conversion of renewable electricity to H2. A price of 3.23 Euro/kg has been estimated for small-scale production [51]. Solar photovoltaic electrolysis (5.28–23.27 $/kg), wind-driven electrolysis (5.89–6.03 $/kg) or nuclear electrolysis (4.17–7.00 $/kg) are considered other viable options [52,53,54]. Considering one month’s production with either CuO or Pt promoted catalysts, one order of magnitude increase of productivity may be sufficient to make this option economically feasible. Since the electricity cost here becomes dominant, the possibility to exploit free solar radiation is a further key for the sustainability of the system. Therefore, investigation for reducing the final production cost by reducing the price of the catalyst (through the use of non-noble cocatalysts) and providing less expensive input energy is a prerequisite for the economic justification and the massive use of hydrogen derived from this approach in the future.
3. Materials and Methods
3.1. Photocatalysts
All the photocatalysts employed were based on TiO2 as pure titania prepared by different methods and as titania-supported CuO and NiO systems.
Three different types of TiO2 have been used in the tests: i) commercial Degussa (Evonik) Aeroxide TiO2, labeled P25; ii) TiO2 prepared by precipitation, labeled PREC; iii) TiO2 synthesized by flame spray pyrolysis, labeled FSP.
TiO2 PREC was synthesized by a precipitation method, one of the most suitable from a large-scale application perspective, from a 1.2 M TiOSO4∙xH2SO4∙yH2O solution and NaOH at constant pH 7. The as-obtained suspension, was then aged at 60 °C for 20 h, filtered and air-dried affording Ti(OH)4. The TiO2 PREC was finally obtained by annealing of Ti(OH)4 in air flow at 400 °C for 1 h [55].
FSP samples were obtained by means of lab-developed device [56,57], composed of a burner which feeds simultaneously the solution of the titania precursor (Titanium isopropoxide, Sigma Aldrich, St. Louis, MO, USA, pur. 97%, 0.4 M dissolved in o-xylene/propionic acid, 1:1 v/v, Sigma Aldrich, pur. 97%) and 5 L/min of oxygen. The liquid solution was constantly fed to the burner (2.5 mL/min) through a syringe pump. A controlled pressure drop at the burner nozzle was set at 1.5 bar.
Cu was loaded with two different metal loadings, 0.2% w/w and 1.0% w/w and on the three different types of titanium dioxide (P25, PREC and FSP) by two different methods. Table 4 provides a list of the different catalysts and methods of preparation with related symbols.
The incipient wetness impregnation technique (I) is a consolidated, simple, economical and sustainable methodology, and is therefore suitable for the scalability of the procedure. An aqueous solution of Cu(NO3)2∙3H2O was contacted with the noncalcined Ti(OH)4. The amount of copper introduced was 0.2 wt % and 1.0 wt % (sample codes include the loading). The samples were finally annealed in air flow at 400 °C for 4 h, longer than for the other metal-modified samples in this paper, to allow the conversion of amorphous Ti(OH)4 into crystalline TiO2 [55]. The same procedure and CuO loading was applied for impregnation on P25 and FSP, while NiO was loaded on P25 from a Ni(NO3)2∙6H2O aqueous solution (1.0% wt) and 0.5 wt % Cu + 0.5 wt % Ni from the same precursors for the heterobimetallic samples. All the P25 and FSP impregnated samples were finally annealed in air flow at 400 °C for 1 h.
Precipitation with organic complexes (PC) was used to load Cu over the photocatalysts. This method provides the introduction of the metallic species with a high dispersion [47] and a high reducibility [34], thanks to the gradual precipitation allowed by the presence of the organic ligand, leading to narrow sized particles [20]. The two different ligands were 1,3-propanediol (samples code “D”) and citric acid (samples code “C”). The metal-loaded catalysts were prepared according to an already reported procedure [34]: PREC and P25 TiO2 were firstly dispersed in deionized water. An aqueous solution of copper and the organic complex was prepared by dissolution of Cu(NO3)2∙3H2O and the stoichiometric amount of organic complex needed for the formation of the copper complex (molar ratio 3:1 for 1,3-propanediol and 2:1 for citric acid) was added. After stirring at room temperature, to allow the binding among metal ions and ligands, the as-obtained precursors solution was added to the aqueous dispersion of titania. Copper hydroxide (Cu(OH)2) was then precipitated by dropping a 0.5 M solution of NaOH up to pH 12; after aging at room temperature, then washing and drying, the samples were calcined in air flow at 400 °C for 1 h.
3.2. Characterization
The actual amount of Cu and Ni was determined, after dissolution of the samples in boiling aqua regia, by flame atomic adsorption spectroscopy (FAAS) using a PerkinElmer Analyst 100 (Waltham, MA, USA). Quantitative determination was performed through a calibration curve with Cu and Ni standard solutions.
X-Ray Diffraction (XRD) patterns were obtained with a Philips PW 1729 diffractometer (Malvern Panalytical Ltd, Malvern, UK) using Cu Kα (Ni-filtered) radiation in the 2θ = 10°–70° range (step size 0.02°; time per step 1.25 s). Particle sizes (D) were calculated according to Scherrer equation D = Kλ/β cosθ, where K is a shape constant equal to 0.9, λ the wavelength of the X-ray used, β the effective line width of the observed X-ray reflection. The correction for instrumental broadening was applied after background subtraction and curve-fitting procedures on the assumption of Gaussian-Lorentzian peak profiles.
Raman spectra were collected on powder samples at room temperature in back-scattering geometry with an inVia Renishaw spectrometer (Renishaw S.p.A., Turin, IT) equipped with an air-cooled Charge Coupled Device (CCD) detector and edge filters. A 488.0 nm emission line from an Ar+ ion laser was focused on the sample by a Leica DLML microscope using 5 × or 20 × objectives. The power of the incident beam was about 4 mW. The spectral resolution was 3 cm−1 and spectra were calibrated using the 520.5 cm-1 line of a silicon wafer. Data analysis included baseline removal and curve fitting, using a Gauss-Lorentz cross-product function by Peakfit 4.12 software (Peakfit 4.12, Systat Software Inc., San Jose, CA, USA, 2007, AISN Software).
N2 adsorption–desorption isotherms at −196 °C were performed using a Micromeritics TriStar II Plus analyzer (Norcross, GA, USA) to obtain information on the surface properties. All samples were previously outgassed at 200 °C for 2 h. The mesopore volume was measured as the adsorbed amount of N2 after capillary condensation. The surface area was evaluated using the standard Brunauer-Emmet-Teller (BET) equation [58] and the pore size distribution was obtained using the Barret-Joyner-Halenda (BJH) method applied to the isotherm desorption branch [59].
Temperature-programmed reduction (TPR) experiments were carried out on a lab-made equipment. Each sample (50 mg) was heated at 10 °C min−1 from r.t. to 800 °C in a 5 vol % H2/Ar mixtures (40 mL min−1 STP). The outlet gases were analyzed by a Gow-Mac TCD (Bethlehem, PA, USA). A magnesium perchlorate trap was used to stop H2O.
Diffuse reflectance (DR) UV-Vis spectra of samples were measured on a Cary 5000 UV-Vis-NIR spectrophotometer (Varian, Palo Alto, CA, USA) in the range of 200–800 nm.
Both thermogravimetric (TG) and differential thermogravimetric (DTG) analysis of pure P25 and P25 after contact with aqueous glucose solution overnight were performed on 10 mg sample powder, heating from room temperature up to 500 °C, under Ar flow (55 ml min−1), with the temperature ramp of 10 °C min−1, by a Mettler-Toledo TGA/DSC 2 Star® instrument (Mettler-Toledo S.p.A., Milan, IT).
The Infrared Spectroscopy (ATR) analysis of P25 powder as such and after the PR reaction (filtered and dried) was obtained by a means of a Nicolet iS10 instrument (Thermo Fisher Scientific Inc., Waltham, MA, USA). Spectra were recorded at resolution <2 cm−1, measuring transmission in 16 scans in the region from 4000 to 1000 cm−1.
Scanning electron microscopy (SEM) was carried out using a FE-SEM LEO 1525 ZEISS (Jena, DE). The scanning electron microscope was equipped with a Bruker Quantax EDX detector. The acceleration potential voltage was maintained at 15 keV and measurements were carried out using AsB detector (Angle selective Backscattered detector) and In-lens detector. Samples were deposited on conductive carbon adhesive tape and analyzed without metallization.
3.3. Activity Testing
The description of the photoreactor is reported elsewhere [60,61,62,63,64,65,66]. The total inner volume and net capacity are respectively 1.7 and 1.3 L. A cooling/heating jacked thermostatically controls the inner temperature, checked by a thermocouple. The reaction mixture is kept under stirring by means of a magnetic stirrer placed below the reactor. A gas inlet line is used to pressurize the reactor and to remove air. The gas and liquid outlet are used to sample the gas and liquid phases, respectively.
A 125 W medium-pressure Hg vapor lamp provides the UV radiation (range of emission wavelengths from 254 nm to 364 nm). The lamp is introduced axially in the middle of the reactor. Periodic measurement of the irradiance is done through a radiometer and ranged between 153 and 171 W/m2.
The optimum operating conditions were set based on several screening tests conditions [32,50,67]: 80 °C, 4 bar, glucose concentration 5g/L, photocatalyst concentration 0.25 g/L.
The reactor was filled with 1.2 L of Milli-Q water and added with glucose and the catalyst. The whole system was closed and kept under vigorous stirring (400 rpm) at constant temperature (23 °C) for 18 h to obtain a stable suspension and to ensure diffusion and surface adsorption of the reactant. Before starting the irradiation of the reaction mixture, the system was outgassed with nitrogen flow at a pressure of 8 bar for 15 min and the headspace was constantly monitored by gas chromatography to ensure air elimination. The liquid sample for the analysis of the solution at t0 was then collected. The temperature was raised to 80 °C while reducing the pressure at 4 bar. After turning on the irradiation the kinetic test started. The typical duration of each reaction was 5 h. Gas samples were analyzed by Gas Chromatography (GC) every hour. At the end of the test, the lamp has been switched off and three liquid samples (t5) have been collected for analysis.
4. Conclusions
This study demonstrates the production of hydrogen from biomass-derived compounds by photoreforming of an aqueous glucose solution over TiO2-based catalysts, case-loaded with CuO or NiO nanoparticles. The results reveal the competitive H2 production with TiO2 loaded with non-noble Cu metal. All the catalysts have been synthesized with the most suitable methods for a large-scale application, e.g., precipitation with organic complexes and impregnation.
An increase of H2 productivity has been observed after addition of Cu to TiO2 P25 increasing the CuO loading to 1 wt % by the PC method, which results in better metal dispersion on the catalysts surface, with a more effective electron sequestration effect. Among the TiO2-based catalysts with the same Cu loading, P25 showed the best results.
On the contrary, NiO did not prove as effective promoter as CuO, either as a single cocatalyst or in heterobimetallic formulations.
Finally, considering the economic perspective of production of H2 through photoreforming of hydrocarbons, some additional tests have been performed considering a very active Pt cocatalyst as a reference. Although the Pt-loaded catalyst showed higher H2 production than CuO, the CuO-loaded sample proved less expensive itself due to the lower price of the source precursor, with a higher potential for further scale up. On a monthly production basis, both Pt-loaded and CuO-added photocatalysts may be viable options, needing an enhancement of ca. one order of magnitude of productivity to become competitive with rival technologies of hydrogen production from renewables.
Author Contributions
Conceptualization, F.M., D.G. and I.R.; Data curation, D.Z., D.P. and I.R.; Formal analysis, E.B.; Funding acquisition, G.R., M.S. and D.G.; Investigation, E.B., D.Z., D.P. and A.D.M.; Methodology, D.P.; Project administration, G.R., M.S. and D.G.; Resources, M.S., D.G. and I.R.; Supervision, F.M., D.G. and I.R.; Writing—original draft, E.B.; Writing—review & editing, G.R., D.G. and I.R. All authors have read and agreed to the published version of the manuscript.
Funding
This research was funded by MIUR, PRIN2015 programme, grant number 20153T4REF.
Acknowledgments
The authors are grateful to the MoS graduating students Andrea Villa and Federico Sellerio for their experimental efforts.
Conflicts of Interest
The authors declare no conflict of interest. The funders had no role in the design of the study; in the collection, analyses, or interpretation of data; in the writing of the manuscript, or in the decision to publish the results.
References
- Kawai, T.; Sakata, T. Conversion of carbohydrate into hydrogen fuel by a photocatalytic process. Nature 1980, 286, 474–476. [Google Scholar] [CrossRef]
- Daskalaki, V.M.; Kondarides, D.I. Efficient production of hydrogen by photo-induced reforming of glycerol at ambient conditions. Catal. Today 2009, 144, 75–80. [Google Scholar] [CrossRef]
- Luo, Z.J.N.; Shi, H.; Cao, F.; Xiao, T.; Edwards, P.P. Photo-catalytic conversion of oxygenated hydrocarbons to hydrogen over heteroatom-doped TiO2catalysts. Int. J. Hydrog. Energy 2009, 34, 125–129. [Google Scholar] [CrossRef]
- Kida, T.; Guan, G.; Yamada, N.; Ma, T.; Kimura, K.; Yoshida, A. Hydrogen production from sewage sludge solubilized in hot-compressed water using photocatalyst under light irradiation. Int. J. Hydrog. Energy 2004, 29, 269–274. [Google Scholar] [CrossRef]
- Colmenares, J.C.; Magdziarz, A.; Aramendia, M.A.; Marinas, A.; Marinas, J.M.; Urbano, F.J.; Navio, J.A. Influence of the strong metal support interaction effect (SMSI) of Pt/TiO2 and Pd/TiO2 systems in the photocatalytic biohydrogen production from glucose solution. Catal. Commun. 2011, 16, 1–6. [Google Scholar] [CrossRef]
- Rossetti, I. Hydrogen production by photoreforming of renewable substrates. ISRN Chem. Eng. 2012, 2012, 1–21. [Google Scholar] [CrossRef] [Green Version]
- Christoforidis, K.C.; Fornasiero, P. Photocatalytic Hydrogen Production: A Rift into the Future Energy Supply. ChemCatChem 2017, 9, 1523–1544. [Google Scholar] [CrossRef] [Green Version]
- Caravaca, A.; Jones, W.; Hardacre, C.; Bowker, M. H2 production by the photocatalytic reforming of cellulose and raw biomass using Ni, Pd, Pt and Au on titania. Proc. R. Soc. A 2016, 472, 20160054. [Google Scholar] [CrossRef] [Green Version]
- Huang, Y.-B.; Fu, Y. Hydrolysis of cellulose to glucose by solid acid catalysts. Green Chem. 2013, 15, 1095–1111. [Google Scholar] [CrossRef]
- Fu, X.; Long, J.; Wang, X.; Leung, D.Y.C.; Ding, Z.; Wu, L.; Zhang, Z.; Li, Z.; Fu, X. Photocatalytic reforming of biomass: A systematic study of hydrogen evolution from glucose solution. Int. J. Hydrog. Energy 2008, 33, 6484–6491. [Google Scholar] [CrossRef]
- Gomathisankar, P.; Kawamura, T.; Katsumata, H.; Suzuki, T.; Kaneco, S. Photocatalytic hydrogen production from aqueous methanol solution using titanium dioxide with the aid of simultaneous metal deposition. Energy Sources Part A Recover. Util. Environ. Eff. 2016, 38, 110–116. [Google Scholar] [CrossRef]
- Bellardita, M.; García-López, E.I.; Marcì, G.; Palmisano, L. Photocatalytic formation of H2 and value-added chemicals in aqueous glucose (Pt)-TiO2suspension. Int. J. Hydrog. Energy 2016, 41, 5934–5947. [Google Scholar] [CrossRef]
- Zhou, B.; Song, J.; Zhou, H.; Wu, T.; Han, B. Using the hydrogen and oxygen in water directly for hydrogenation reactions and glucose oxidation by photocatalysis. Chem. Sci. 2016, 7, 463–468. [Google Scholar] [CrossRef] [PubMed] [Green Version]
- Ma, Y.; Wang, X.; Jia, Y.; Chen, X.; Han, H.; Li, C. Titanium Dioxide-Based Nanomaterials for Photocatalytic Fuel Generations. Chem. Rev. 2014, 114, 9987–10043. [Google Scholar] [CrossRef] [PubMed]
- Linsebigler, A.L.; Lu, G.; Yates, J.T. Photocatalysis on TiO2 Surfaces: Principles, Mechanisms, and Selected Results. Chem. Rev. 1995, 95, 735–758. [Google Scholar] [CrossRef]
- Subramanian, V.; Wolf, E.E.; Kamat, P.V. Catalysis with TiO2/Gold Nanocomposites. Effect of Metal Particle Size on the Fermi Level Equilibration. J. Am. Chem. Soc. 2004, 126, 4943–4950. [Google Scholar] [CrossRef] [PubMed]
- Tanaka, A.; Keiji, H.; Kominami, H. Visible-Light-Induced Hydrogen and Oxygen Formation over Pt/Au/WO3 Photocatalyst Utilizing Two Types of Photoabsorption Due to Surface Plasmon Resonance and Band-Gap Excitation. J. Am. Chem. Soc. 2014, 136, 586−589. [Google Scholar] [CrossRef]
- Clarizia, L.; Spasiano, D.; di Somma, I.; Marotta, R.; Andreozzi, R.; Dionysiou, D.D. Copper modified-TiO2catalysts for hydrogen generation through photoreforming of organics. A short review. Int. J. Hydrog. Energy 2014, 39, 16812–16831. [Google Scholar] [CrossRef]
- Sun, S.; Wang, W.; Zhang, L.; Shang, M.; Wang, L. Ag@C core/shell nanocomposite as a highly efficient plasmonic photocatalyst. Catal. Commun. 2009, 11, 290–293. [Google Scholar] [CrossRef]
- Chen, W.-T.; Jovic, V.; Sun-Waterhouse, D.; Idriss, H.; Waterhouse, G.I.N. The role of CuO in promoting photocatalytic hydrogen production over TiO2. Int. J. Hydrog. Energy 2013, 38, 15036–15048. [Google Scholar] [CrossRef]
- Ampelli, C.; Genovese, C.; Passalacqua, R.; Perathoner, S.; Centi, G. A gas-phase reactor powered by solar energy and ethanol for H2 production. Appl. Therm. Eng. 2014, 70, 1270–1275. [Google Scholar] [CrossRef]
- Jung, M.; Hart, J.N.; Boensch, D.; Scott, J.; Ng, Y.H.; Amal, R. Hydrogen evolution via glycerol photoreforming over Cu–Pt nanoalloys on TiO2. Appl. Catal. A 2016, 518, 221–230. [Google Scholar] [CrossRef]
- Puga, A.V. Review-Photocatalytic production of hydrogen from biomass-derived feedstocks. Coord. Chem. 2016, 315, 1–66. [Google Scholar] [CrossRef]
- Kwon, J.-D.; Kwon, S.H.; Jung, T.-H.; Nam, K.-S.; Chung, K.-B.; Kim, D.-H.; Park, J.S. Controlled growth and properties of p-type cuprous oxide films by plasma-enhanced atomic layer deposition at low temperature. Appl. Surf. Sci. 2013, 285, 373–379. [Google Scholar] [CrossRef]
- Montini, T.; Gombac, V.; Sordelli, L.; Delgado, J.J.; Chen, X.; Adami, G.; Fornasiero, P. Nanostructured Cu/TiO2 Photocatalysts for H2 Production from Ethanol and Glycerol Aqueous Solutions. ChemCatChem 2011, 3, 574–577. [Google Scholar] [CrossRef]
- Chiarello, G.L.; Forni, L.; Selli, E. Photocatalytic hydrogen production by liquid- and gas-phase reforming of CH3OH over flame-made TiO2 and Au/TiO2. Catal. Today 2009, 144, 69–74. [Google Scholar] [CrossRef]
- Yu, J.; Hai, Y.; Jaroniec, M. Photocatalytic hydrogen production over CuO-modified titania. J. Colloid Interface Sci. 2011, 375, 223–228. [Google Scholar] [CrossRef] [PubMed]
- Bandara, J.; Udawatta, C.P.K.; Rajapakse, C.S.K. Highly stable CuO incorporated TiO2 catalyst for photocatalytic hydrogen production from H2O. Photobiol. Sci. 2005, 4, 857–861. [Google Scholar] [CrossRef]
- Davda, R.R.; Shabaker, J.W.; Huber, G.W.; Cortright, R.D.; Dumesic, J.A. A review of catalytic issues and process conditions for renewable hydrogen and alkanes by aqueous-phase reforming of oxygenated hydrocarbons over supported metal catalysts. Appl. Catal. B Environ. 2005, 56, 171–186. [Google Scholar] [CrossRef]
- Olivo, A.; Zanardo, D.; Ghedini, E.; Menegazzo, F.; Signoretto, M. Solar Fuels by Heterogeneous Photocatalysis: From Understanding Chemical Bases to Process Development. Chem. Eng. 2018, 2, 42. [Google Scholar] [CrossRef] [Green Version]
- Santo, V.D.; Gallo, A.; Naldoni, A.; Guidotti, M.; Psaro, R. Bimetallic heterogeneous catalysts for hydrogen production. Catal. Today 2012, 197, 190. [Google Scholar] [CrossRef]
- Ramis, G.; Bahadori, E.; Rossetti, I. Photoreactors design for hydrogen production. Chem. Eng. Trans. 2019, 74, 481–486. [Google Scholar] [CrossRef]
- Rossetti, I.; Bahadori, E.; Tripodi, A.; Villa, A.; Prati, L.; Ramis, G. Conceptual design and feasibility assessment of photoreactors for solar energy storage. Sol. Energy 2018, 172, 225–231. [Google Scholar] [CrossRef]
- Zanardo, D.; Ghedini, E.; Menegazzo, F.; Cattaruzza, E.; Manzoli, M.; Cruciani, G.; Signoretto, M. Titanium dioxide-based nanocomposites for enhanced gas-phase photodehydrogenation. Materials (Basel) 2019, 12, 3093. [Google Scholar] [CrossRef] [PubMed] [Green Version]
- Yu, J.G.; Low, J.X.; Xiao, W.; Zhou, P.; Jaroniec, M. Enhanced photocatalytic CO₂-reduction activity of anatase TiO₂ by coexposed {001} and {101} facets. J. Am. Chem. Soc. Am. Chem. Soc. 2014, 136, 8839−8842. [Google Scholar]
- Zhang, J.; Li, M.; Feng, Z.; Chen, J.; Li, C. UV Raman Spectroscopic Study on TiO2. I. Phase Transformation at the Surface and in the Bulk. J. Phys. Chem. B 2006, 110, 927−935. [Google Scholar] [CrossRef]
- Bahadori, E.; Rapf, M.; di Michele, A.; Rossetti, I. Photochemical vs. photocatalytic azo-dye removal in a pilot free-surface reactor: Is the catalyst effective? Sep. Purif. Technol. 2020, 237, 116320. [Google Scholar] [CrossRef]
- Nair, J.; Nair, P.; Mizukami, F.; Oosawa, Y.; Okubo, T. Microstructure and phase transformation behavior of doped nanostructured titania. Mater. Res. Bull. 1999, 34, 1275–1290. [Google Scholar] [CrossRef]
- Yoong, L.S.; Chong, F.; Dutta, B. Development of copper-doped TiO2 photocatalyst for hydrogen production under visible light. Energy 2009, 34, 1652–1661. [Google Scholar] [CrossRef]
- Boccuzzi, F.; Chiorino, A.; Martra, G.; Gargano, M.; Ravasio, N.; Carrozzini, B. Preparation, Characterization, and Activity of Cu/TiO2 Catalysts I. Influence of the Preparation Method on the Dispersion of Copper in Cu/TiO2. J. Catal. 1997, 165, 129–139. [Google Scholar] [CrossRef]
- Bahadori, E.; Tripodi, A.; Ramis, G.; Rossetti, I. Semi-Batch Photocatalytic Reduction of Nitrates: Role of Process Conditions and Cocatalysts. ChemCatChem 2019, 11, 4642–4652. [Google Scholar] [CrossRef]
- Bahadori, E.; Conte, F.; Tripodi, A.; Ramis, G.; Rossetti, I. Semi-batch selective photocatalytic oxidation of ammonia: Unravelling the effect of reaction conditions and metal cocatalysts. Chem. Eng. J. submitted.
- Cai, X.; Wang, C.; Chen, Y.; Cheng, Z.; Shu, R.; Zhang, J.; Bu, E.; Liao, M.; Song, Q. A novel approach for enhancing hydrogen production from bio-glycerol photoreforming by improving colloidal dispersion stability. Sci. Total Envrion. 2018, 627, 1464–1472. [Google Scholar] [CrossRef] [PubMed]
- Hurum, D.C.; Agrios, A.G.; Gray, K.A.; Rajh, T.; Thurnauer, M.C. Explaining the Enhanced Photocatalytic Activity of Degussa P25 Mixed-Phase TiO2 Using EPR. J. Phys. Chem. B 2003, 107, 4545–4549. [Google Scholar] [CrossRef]
- Hurum, D.C.; Gray, K.A.; Rajh, T.; Thurnauer, M.C. Recombination pathways in the Degussa P25 formulation of TiO2: Surface versus lattice mechanisms. J. Phys. Chem. B 2005, 109, 977–980. [Google Scholar] [CrossRef]
- Xu, Q.; Ma, Y.; Zhang, J.; Wang, X.; Feng, Z.; Li, C. Enhancing hydrogen production activity and suppressing CO formation from photocatalytic biomass reforming on Pt/TiO2 by optimizing anatase-rutile phase structure. J. Catal. 2011, 278, 329–335. [Google Scholar] [CrossRef]
- Schwarz, J.A.; Contescu, C.; Contescu, A. Methods for Preparation of Catalytic Materials. Chem. Rev. 1995, 95, 477–510. [Google Scholar] [CrossRef]
- Wu, G.; Chen, T.; Zhou, G.; Zong, X.; Li, C. H2 production with low CO selectivity from photocatalytic reforming of glucose on metal/TiO2 catalysts. Sci. China Ser. B Chem. 2008, 51, 97–100. [Google Scholar] [CrossRef]
- Chen, W.-T.; Chan, A.; Sun-Waterhouse, D.; Moriga, T.; Idriss, H.; Waterhouse, G.I.N. Ni/TiO2: A promising low-cost photocatalytic system for solar H2 production from ethanol–water mixtures. J. Catal. 2015, 326, 43–53. [Google Scholar] [CrossRef]
- Ramis, G.; Bahadori, E.; Rossetti, I. Design of efficient photocatalytic processes for the production of hydrogen from biomass derived substrates. Int. J. Hydrog. Energy 2020, in press. [Google Scholar] [CrossRef]
- Glenk, G.; Reichelstein, S. Economics of converting renewable power to hydrogen. Nat. Energy 2019, 4, 216–222. [Google Scholar] [CrossRef]
- Compagnoni, M.; Mostafavi, E.; Tripodi, A.; Mahinpey, N.; Rossetti, I. Techno-economic analysis of a bioethanol to hydrogen centralized plant. Energy Fuels 2017, 31, 12988–12996. [Google Scholar] [CrossRef]
- Compagnoni, M.; Tripodi, A.; Mostafavi, E.; Mahinpey, N.; Rossetti, I. Hydrogen Production by Steam Reforming of Bio-ethanol: Process Design and Economic Assessment; Tagungsbericht; DGMK: Hamburg, Germany, 2017. [Google Scholar]
- Calise, F.; D’Accadia, M.D.; Santarelli, M.; Lanzini, A.; Ferrero, D. Solar Hydrogen Production. Processes, Systems and Technologies; Elsevier: Amsterdam, The Netherlands, 2019. [Google Scholar] [CrossRef]
- Olivo, A.; Trevisan, V.; Ghedini, E.; Pinna, F.; Bianchi, C.L.; Naldoni, A.; Cruciani, G.; Signoretto, M. CO2 photoreduction with water: Catalyst and process investigation. J. CO2 Util. 2015, 12, 86–94. [Google Scholar] [CrossRef]
- Compagnoni, M.; Lasso, J.; di Michele, A.I.; Rossetti, I. Catalysis Science & Technology Flame-pyrolysis-prepared catalysts for the steam reforming of ethanol. Catal. Sci. Technol. 2016, 6, 6247–6256. [Google Scholar] [CrossRef]
- Chiarello, G.L.; Rossetti, I.; Forni, L. Flame-spray pyrolysis preparation of perovskites for methane catalytic combustion. J. Catal. 2005, 236, 251–261. [Google Scholar] [CrossRef]
- Brunauer, S.; Emmett, P.H.; Teller, E. Adsorption of Gases in Multimolecular Layers. J. Am. Chem. Soc. 1938, 60, 309–319. [Google Scholar] [CrossRef]
- Barrett, E.P.; Joyner, L.S.; Halenda, P.P. The Determination of Pore Volume and Area Distributions in Porous Substances. I. Computations from Nitrogen Isotherms. J. Am. Chem. Soc. 1951, 73, 373–380. [Google Scholar] [CrossRef]
- Bahadori, E.; Tripodi, A.; Villa, A.; Pirola, C.; Prati, L.; Ramis, G.; Rossetti, I. High Pressure Photoreduction of CO2: Effect of Catalyst Formulation, Hole Scavenger Addition and Operating Conditions. Catalysts 2018, 8, 430. [Google Scholar] [CrossRef] [Green Version]
- Rossetti, I.; Villa, A.; Pirola, C.; Prati, L.; Ramis, G. A novel high-pressure photoreactor for CO2 photoconversion to fuels. RSC Adv. 2014, 4, 28883–28885. [Google Scholar] [CrossRef] [Green Version]
- Compagnoni, M.; Ramis, G.; Freyria, F.S.; Armandi, M.; Bonelli, B.; Rossetti, I. Innovative photoreactors for unconventional photocatalytic processes: The photoreduction of CO2 and the photo-oxidation of ammonia. Rend. Lincei 2017, 28, 151–158. [Google Scholar] [CrossRef]
- Bahdori, E.; Tripodi, A.; Villa, A.; Pirola, C.; Prati, L.; Ramis, G.; Dimitratos, N.; Wang, D.; Rossetti, I. High pressure CO2 photoreduction using Au/TiO2: Unravelling the effect of the cocatalyst and of the titania polymorph. Catal. Sci. Technol. 2019, 9, 2253–2265. [Google Scholar] [CrossRef]
- Olivo, A.; Ghedini, E.; Signoretto, M.; Compagnoni, M.; Rossetti, I. Liquid vs. gas phase CO2 photoreduction process: Which is the effect of the reaction medium? Energies 2017, 10, 1394. [Google Scholar] [CrossRef] [Green Version]
- Galli, F.; Compagnoni, M.; Vitali, D.; Pirola, C.; Bianchi, C.L.; Villa, A.; Prati, L.; Rossetti, I. CO2 photoreduction at high pressure to both gas and liquid products over titanium dioxide. Appl. Catal. B Environ. 2017, 200, 386–391. [Google Scholar] [CrossRef]
- Rossetti, I.; Villa, A.; Compagnoni, M.; Prati, L.; Ramis, G.; Pirola, C.; Bianchi, C.L.; Wang, W.; Wang, D. CO2 photoconversion to fuels under high pressure: Effect of TiO2 phase and of unconventional reaction conditions. Catal. Sci. Technol. 2015, 5, 4481–4487. [Google Scholar] [CrossRef]
- Rossetti, I.; Bahadori, E.; Tripodi, A.; Ramis, G. Modelling of Photoreactors for Water Treatment. Chem. Eng. Trans. 2019, 74, 289–294. [Google Scholar] [CrossRef]
Figure 1.
X-ray diffraction (XRD) patterns of samples based on TiO2 P25: (a) 1.0CCu/P25; (b) 1.0DCu/P25;.(c) 1.0ICu/P25; # TiO2 Anatase (JCPDS, card. 21-1272); * TiO2 Rutile (JCPDS, card 21-1276).
Figure 1.
X-ray diffraction (XRD) patterns of samples based on TiO2 P25: (a) 1.0CCu/P25; (b) 1.0DCu/P25;.(c) 1.0ICu/P25; # TiO2 Anatase (JCPDS, card. 21-1272); * TiO2 Rutile (JCPDS, card 21-1276).

Figure 2.
Representative Raman spectra of the Cu/P25 samples: (a) 1.0ICu/P25; (b) 1.0DCu/P25. And (c) 1.0CCu/P25. Inset: Raman spectra of different 1.0DCu/P25 particles (b1, b2). A, TiO2 Anatase; R, TiO2 Rutile.
Figure 2.
Representative Raman spectra of the Cu/P25 samples: (a) 1.0ICu/P25; (b) 1.0DCu/P25. And (c) 1.0CCu/P25. Inset: Raman spectra of different 1.0DCu/P25 particles (b1, b2). A, TiO2 Anatase; R, TiO2 Rutile.

Figure 3.
N2 isotherms at −196 °C of (a) PREC and (b) P25 (full squares) and FSP (hollow triangles) samples.
Figure 3.
N2 isotherms at −196 °C of (a) PREC and (b) P25 (full squares) and FSP (hollow triangles) samples.

Figure 4.
Temperature programmed reduction (TPR) analysis of selected samples: 0.2 wt % (a) and 1 wt % (b).
Figure 4.
Temperature programmed reduction (TPR) analysis of selected samples: 0.2 wt % (a) and 1 wt % (b).

Figure 5.
(a) TPR analysis of the samples made of TiO2 P25 loaded with various impregnated oxides at 1.0 wt % total metal loading; (b) CuO introduced by various techniques at 1.0 wt %.
Figure 5.
(a) TPR analysis of the samples made of TiO2 P25 loaded with various impregnated oxides at 1.0 wt % total metal loading; (b) CuO introduced by various techniques at 1.0 wt %.

Figure 6.
Diffuse reflectance (DR) UV-Vis analysis for Cu-loaded samples.

Figure 7.
Scanning electron microscope (SEM) micrographs of 1.0ICu/P25 (top) and 1.0DCu/P25 (bottom). In each line, the first two pictures report Back Scattered (BS) electrons (marker 2 μm and 200 nm), the last reports Secondary Electrons (SE) (marker size 100 nm).
Figure 7.
Scanning electron microscope (SEM) micrographs of 1.0ICu/P25 (top) and 1.0DCu/P25 (bottom). In each line, the first two pictures report Back Scattered (BS) electrons (marker 2 μm and 200 nm), the last reports Secondary Electrons (SE) (marker size 100 nm).

Figure 8.
Productivity of gas products of three different bare titania in the photoreforming (PR) of glucose.
Figure 8.
Productivity of gas products of three different bare titania in the photoreforming (PR) of glucose.

Figure 9.
Attenuated Total Reflectance Fourier-Transform Infrared Spectroscopy (ATR-FT-IR) spectra of (a) P25 powder before reaction, (b) P25 analyzed after the PR reaction.
Figure 9.
Attenuated Total Reflectance Fourier-Transform Infrared Spectroscopy (ATR-FT-IR) spectra of (a) P25 powder before reaction, (b) P25 analyzed after the PR reaction.

Figure 10.
Productivity of various gas phase products with 0.2 wt % CuO loaded on PREC and FSP by different methods (I, D and C).
Figure 10.
Productivity of various gas phase products with 0.2 wt % CuO loaded on PREC and FSP by different methods (I, D and C).

Figure 11.
Cumulative hydrogen production (moles) comparison vs. time with 0.2 wt % CuO loaded on PREC and FSP by different methods (I, D and C).
Figure 11.
Cumulative hydrogen production (moles) comparison vs. time with 0.2 wt % CuO loaded on PREC and FSP by different methods (I, D and C).

Figure 12.
Productivity of various gas phase products obtained with 1 wt % CuO loaded by different methods (I, D and C) over PREC and P25.
Figure 12.
Productivity of various gas phase products obtained with 1 wt % CuO loaded by different methods (I, D and C) over PREC and P25.


Table 1.
Main physical-chemical properties of photocatalysts.
| Sample | Metal Loading (wt %) | Anatase/Rutile | SBET (m2/g) | Total Pore Volume (cm3/g) |
|---|---|---|---|---|
| P25 | - | 78/22 | 45 | 0.11 |
| FSP | - | 65/35 | 67 | 0.14 |
| PREC | - | 100/0 | 114 | 0.45 |
| 0.2ICu/PREC | 0.15 | 100/0 | 151 | 0.27 |
| 1.0ICu/PREC | 0.49 | 100/0 | 89 | 0.17 |
| 0.2DCu/PREC | 0.15 | 100/0 | 118 | 0.23 |
| 1.0DCu/PREC | 0.86 | 100/0 | 118 | 0.23 |
| 0.2CCu/PREC | 0.16 | 100/0 | 108 | 0.27 |
| 1.0CCu/PREC | 0.85 | 100/0 | 116 | 0.22 |
| 1.0DCu/P25 | 0.98 | 85.2/14.8 | 42 a | - |
| 1.0CCu/P25 | 0.99 | 85/15 | 43 a | - |
| 1.0ICu/P25 | 0.93 | 85/15 | 42 a | - |
| 1.0INi/P25 | 0.71 | - | - | - |
| 0.5ICu0.5Ni/P25 | 0.50 (Cu) 0.38 (Ni) | - | - | - |
| 0.2ICu/FSP | - | 65/35 | 72 | 0.15 |
a SBET values as reported in [34].
Table 2.
Catalytic activity results for the photoreforming of glucose.
| Catalyst | H2 Productivity (mol/h kgcat) | COD% 1 | C Bal. % 2 | C bal. (TGA) % 3 |
|---|---|---|---|---|
| P25 | 1.91 | 20.3 | 81 | 85 |
| 1.0DCu/P25 | 8.78 | 19.5 | 84 | 88 |
| 1.0CCu/P25 | 9.71 | 30.6 | 75 | 79 |
| 1.0ICu/P25 | 8.20 | 30.8 | 74 | 78 |
| 1.0INi/P25 | 4.20 | 26.1 | 78 | 82 |
| 0.5ICu0.5Ni/P25 | 5.21 | 26.1 | 77 | 82 |
| PREC | 0.62 | 5.7 | 96 | 100 |
| 0.2ICu/PREC | 2.26 | 15.5 | 87 | 91 |
| 1.0ICu/PREC | 3.26 | 65.4 | 38 | 42 |
| 0.2DCu/PREC | 3.98 | 13.2 | 90 | 95 |
| 1.0DCu/PREC | 4.24 | - | 106 | 110 |
| 0.2CCu/PREC | 3.18 | 0.3 | 104 | 108 |
| 1.0CCu/PREC | 2.99 | 2.5 | 101 | 105 |
| FSP | 1.20 | 8.5 | 94 | 99 |
| 0.2ICu/FSP | 5.07 | 0.8 | 103 | 108 |
1 Conversion of organic compounds determined from Chemical Oxygen Demand (COD) analysis on the initial theoretical amount of glucose. 2 Carbon balances by considering the conversions obtained from COD. 3 Carbon balance by considering the COD and the adsorbed amount of glucose onto the catalyst surface, as detected by Thermo-Gravimetric Analysis (TGA).
Table 3.
Cost referred to one kilogram of produced hydrogen for a single 5 h test or assuming continuous production for 30 days.
Table 3.
Cost referred to one kilogram of produced hydrogen for a single 5 h test or assuming continuous production for 30 days.
| Catalyst | Cost for 5 h of Test (euro) | Cost of H2 Production for 5 h Test (euro/kg) | Cost of H2 Production for 30 d, 24 h (euro/kg) |
|---|---|---|---|
| P25 | 0.0028 | 486 | 388 |
| Cu/P25 | 0.0118 | 402 | 78 |
| Pt/P25 | 0.0388 | 873 | 56 |
Table 4.
Catalysts and their related chemical precursors.
| Catalyst | Method |
|---|---|
| P25 | Commercial nanostructured TiO2 (Evonik) |
| PREC | TiO2 by precipitation with NaOH (pH = 7, constant) |
| FSP | TiO2 by flame spray pyrolysis |
| ICu/PREC | CuO added by impregnation on PREC |
| DCu/PREC | CuO added by PC on PREC with 1,3-propandiol |
| CCu/PREC | CuO added by PC on PREC with citric acid |
| DCu/P25 | CuO added by PC on P25 with 1,3-propandiol |
| CCu/P25 | CuO added by PC on P25 with citric acid |
| ICu/P25 | CuO added by impregnation on P25 |
| INi/P25 | NiO added by impregnation on P25 |
| INi-Cu/P25 | CuO and NiO added by impregnation on P25 |
| ICu/FSP | CuO added by impregnation on FSP |
© 2020 by the authors. Licensee MDPI, Basel, Switzerland. This article is an open access article distributed under the terms and conditions of the Creative Commons Attribution (CC BY) license (http://creativecommons.org/licenses/by/4.0/).
Share and Cite
MDPI and ACS Style
Bahadori, E.; Ramis, G.; Zanardo, D.; Menegazzo, F.; Signoretto, M.; Gazzoli, D.; Pietrogiacomi, D.; Michele, A.D.; Rossetti, I. Photoreforming of Glucose over CuO/TiO2. Catalysts 2020, 10, 477. https://doi.org/10.3390/catal10050477
AMA Style
Bahadori E, Ramis G, Zanardo D, Menegazzo F, Signoretto M, Gazzoli D, Pietrogiacomi D, Michele AD, Rossetti I. Photoreforming of Glucose over CuO/TiO2. Catalysts. 2020; 10(5):477. https://doi.org/10.3390/catal10050477
Chicago/Turabian StyleBahadori, Elnaz, Gianguido Ramis, Danny Zanardo, Federica Menegazzo, Michela Signoretto, Delia Gazzoli, Daniela Pietrogiacomi, Alessandro Di Michele, and Ilenia Rossetti. 2020. "Photoreforming of Glucose over CuO/TiO2" Catalysts 10, no. 5: 477. https://doi.org/10.3390/catal10050477
Note that from the first issue of 2016, this journal uses article numbers instead of page numbers. See further details here.