Article

Electrochemical Sensing of Caffeic Acid Using Gold Nanoparticles Embedded in Poly(3,4-ethylenedioxythiophene) Layer by Sinusoidal Voltage Procedure

1
Department of Chemistry and Geological Sciences, University of Modena and Reggio Emilia, Via G. Campi 103, 41125 Modena, Italy
2
Faculty of Electrical Engineering, University Politehnica of Bucharest, 313 Splaiul Independentei Street, 060042 Bucharest, Romania
3
Department of Inorganic Chemistry, Physical Chemistry and Electrochemistry, Faculty of Applied Chemistry and Materials Science, University Politehnica of Bucharest, 1–7 Polizu Street, 011061 Bucharest, Romania
4
Institute of Physical Chemistry “Ilie Murgulescu” of the Romanian Academy, Department of Electrochemistry – Corrosion and Molten Salts, 202 Splaiul Independentei, 060021 Bucharest, Romania
5
Department of Analytical Chemistry and Environmental Engineering, Faculty of Applied Chemistry and Materials Science, University Politehnica of Bucharest, 1-7 Polizu Street, 011061 Bucharest, Romania
*
Author to whom correspondence should be addressed.
Chemosensors 2019, 7(4), 65; https://doi.org/10.3390/chemosensors7040065
Submission received: 30 October 2019 / Revised: 4 December 2019 / Accepted: 11 December 2019 / Published: 12 December 2019
(This article belongs to the Special Issue Voltammperometric Sensors)

Abstract

:
The increasing demand for sensitive electrochemical sensors in various medical and industrial applications promotes the fabrication of novel sensing materials with improved electrocatalytic and analytical performances. This work deals with the development of a composite material based on gold nanoparticles (AuNPs) embedded in poly(3,4-ethylenedioxythiophene) (PEDOT) layer for electrochemical determination of caffeic acid (CA). CA is a phenolic compound with excellent antioxidant properties that is present in vegetables, fruits, and alcoholic and non-alcoholic beverages. Its analytical quantification is of great interest in food production monitoring and healthcare applications. Therefore, the development of sensitive analytical devices for CA monitoring is required. The AuNPs have been prepared in situ onto PEDOT coated glassy carbon electrode (GC) by means of an innovative procedure consisting on the use of a sinusoidal voltage (SV) superimposed on a constant potential. The physico-chemical properties of the PEDOT-AuNPs composite material were investigated by a range of techniques including cyclic voltammetry, electrochemical quartz crystal microbalance, and scanning electron microscopy. The glassy carbon electrode/poly(3,4-ethylenedioxythiophene)-gold nanoparticles-sinusoidal voltage (GC/PEDOT-AuNPs-SV) sensor exhibited good analytical performance toward the CA quantification with a linear response over a wide concentration range from 10 µM to 1 mM. In addition, the proposed GC/PEDOT-AuNPs-SV sensor was successfully applied in the determination of total polyphenols content expressed as equivalents of CA in juice samples.

1. Introduction

Caffeic acid (CA) or 3,4-dihydroxycinnamic acid is a phenolic acid with anti-oxidant and anti-inflammatory properties that is found in several plants and fruits, as well as in alcoholic and non-alcoholic beverages. The quantification of CA is of major importance in the food industry during the production of various beverages and in pharmaceutical formulations for dietary supplements [1,2]. Several analytical and instrumental methods and techniques have been applied in the assessment of polyphenolic compounds in various fruits, vegetables, and beverages including the Folin-Ciocalteu procedure [3], high performance liquid chromatography, capillary electrophoresis, spectrophotometry, and mass spectrometry [4]. During recent years, electrochemical methods have been increasingly applied in the detection and quantification of polyphenolics due to peculiar features like simplicity, rapidity, high sensitivity, low detection limits, possibility of miniaturization, and the ability to perform thought chemical analysis with a minor sample treatment or through direct measurements in real samples [5,6,7,8,9,10]. Proposed electrochemical methods for the monitoring of polyphenols were based initially on the use of platinum [11] or carbon [7,8,12,13] electrodes, but the fouling problems associated with oxidation of the target analytes onto the electrode surface have underpinned the development of various modified electrodes with improved selectivity and sensitivity toward polyphenolic compounds [14,15]. Among the modifiers, poly(3,4-ethylenedioxythiophene) (PEDOT), an intrinsically conducting polymer, has received great attention thanks to properties such as good electrochemical stability in aqueous solutions, high electrical conductivity, and antifouling properties [16,17,18]. Aiming to improve the sensitivity of the analytical measurements, various inorganic fillers, mainly metal nanoparticles of Pt and Au, have been incorporated within conducting polymers and PEDOT layers by means of chemical and electrochemical methods [19,20].
In this work, the incorporation of Au nanoparticles (AuNPs) within the PEDOT layer by means of an innovative procedure based on sinusoidal voltage (SV) is presented; the developed electrochemical sensor has been used for caffeic acid determination. The SV procedure was already successfully applied in the electrodeposition of Pt nanoparticles and PEDOT layers onto various electrode substrates, including microelectrode arrays, for electrochemical sensors and biosensors preparation [21,22,23,24,25,26,27,28]. However, to the best of our knowledge, the use of SV procedure in the electrodeposition of AuNPs is firstly reported here. The SV procedure is applied in the preparation of the AuNPs aiming to improve their morphological, electrochemical, and/or electrocatalytic properties. The morphology and the electrochemical properties of the PEDOT-AuNPs-SV material have been characterized by scanning electron microscopy (SEM) and electrochemical methods. The obtained PEDOT-AuNPs-SV based sensor has been applied in the determination of caffeic acid in synthetic samples and its analytical performance has been investigated. Finally, the proposed sensor was used in the estimation of the total polyphenols content, expressed as CA equivalents, of apple and peaches juices.

2. Materials and Methods

All chemicals were of analytical reagent grade. Aqueous solutions were prepared using double distilled water. The phosphate buffer solutions (PBS) were prepared by using appropriate amounts of KH2PO4 (Riedel-deHaen) and K2HPO4 (Sigma-Aldrich), and the pH was adjusted at the desired value by adding 0.1 M HCl (Sigma-Aldrich) or 0.1 M NaOH (Sigma-Aldrich) solutions. Caffeic acid (Sigma-Aldrich) solutions were prepared daily using PBS, pH 7. The electrochemical measurements were performed with a potentiostat/galvanostat Autolab model 302N (Eco Chemie, Utrecht, The Netherlands), coupled to a PC running the GPES software, in a three electrodes configuration at room temperature. The working electrode was a glassy carbon disk electrode (diameter of 3 mm, Metrohm), a glassy carbon rod (Metrohm) was used as counter electrode, and a Ag/AgCl/KCl (3M) electrode, (Metrohm), served as reference electrode. The electrodes were placed in an electrochemical cell (Metrohm) inside a Faraday cage. The aqueous solutions were bubbled with Ar (5.0, Linde, Romania) before the start of the experiments, whereas an Ar blanket was maintained over the solutions during the entire duration of the measurements.
The glassy carbon electrode/poly(3,4-ethylenedioxythiophene)-gold nanoparticles GC/PEDOT-AuNPs modified electrodes were obtained in two steps: firstly, the PEDOT coating was prepared onto GC electrode surface by sinusoidal voltage method; secondly, the AuNPs were deposited onto GC/PEDOT modified electrodes by drop-casting of chemically synthesized AuNPs, and/or by sinusoidal voltage electrodeposition from the NaAuCl4 precursor containing solution, respectively.
Consequently, the GC/PEDOT modified electrodes were prepared from an aqueous solution containing 10 mM 3,4-ethylenedioxythiophene (EDOT) (Sigma-Aldrich) in 0.1 M PBS, pH 7, by sinusoidal voltage method: a sinusoidal wave tension with amplitude (Esin) of 0.25 V (root mean square, rms) and frequency (f) of 50 mHz was superimposed over a constant potential (Edc) of +0.6 V, for a deposition time of 600 s.
Finally, the fabrication of GC/PEDOT-AuNPs modified electrodes was achieved by means of two approaches:
  • drop-casting: an aliquot of 10 µL of AuNPs solution, prepared previously via chemical method [29], were dropped onto GC/PEDOT electrode surface. The modified electrode, GC/PEDOT-AuNPs-dc, was kept overnight in the laboratory to dry and used the next day.
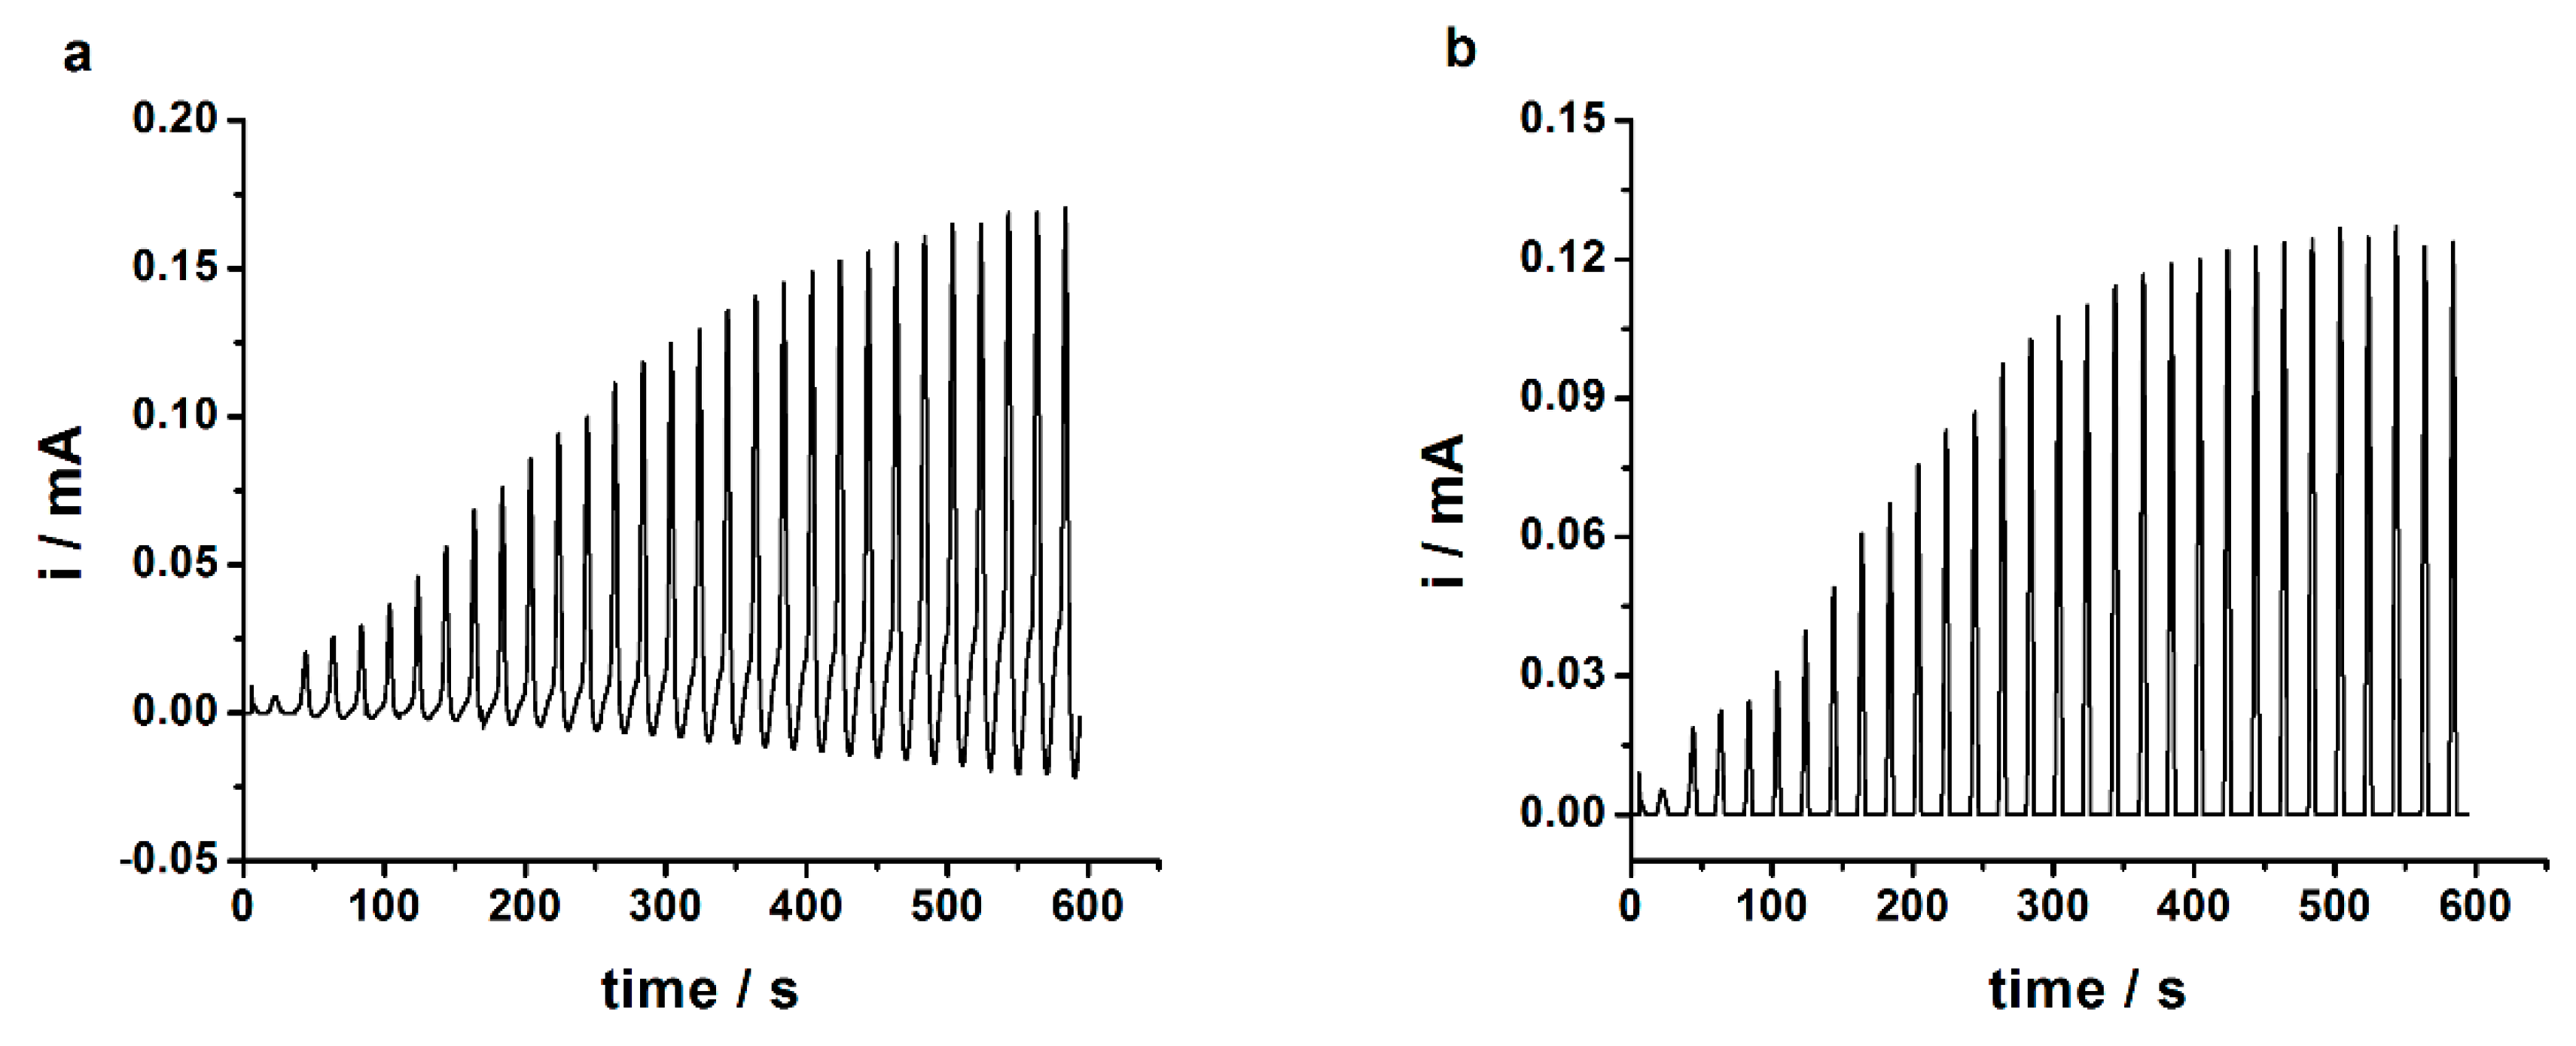
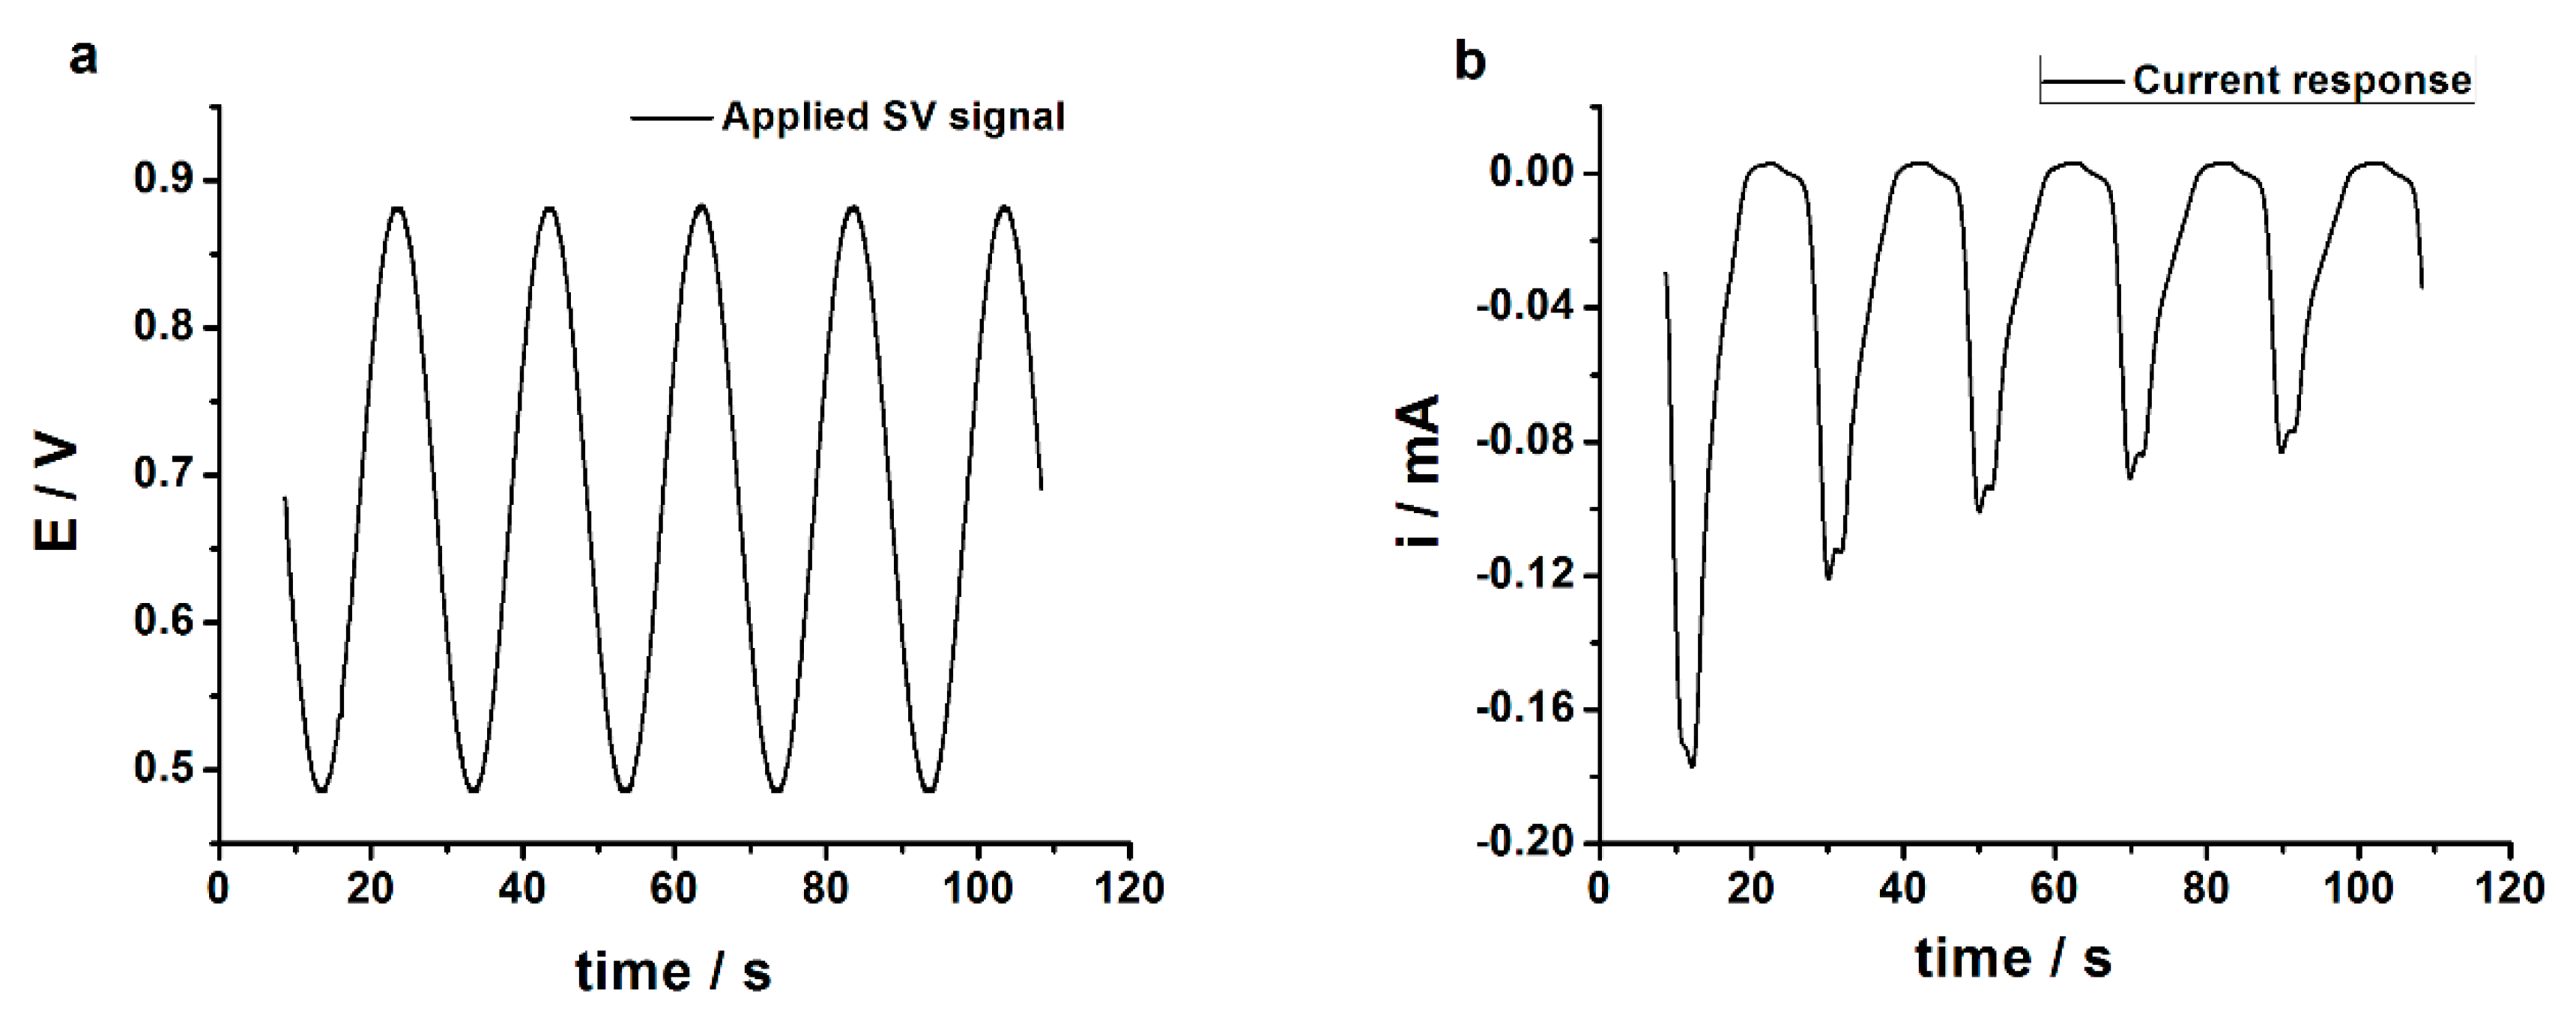
  • sinusoidal voltage deposition of AuNPs onto the GC/PEDOT electrode surface from a solution containing 5 mM NaAuCl4 (Alfa Aesar 99.99%) and 0.5 M H2SO4 (Merck), using the following parameters: Edc = +0.7 V; Esin = 0.20 V, f = 50 mHz; tdep = 100 s. The optimization of the electrochemical parameters was carried out using these values: Edc values of 0.6; 0.7; 0.8 V; Esin of 0.20 and 0.35 V; frequency of 50 and 500 mHz; tdep of 45, 100, and 300 s. The obtained modified electrode is referred to as GC/PEDOT-AuNPs-SV.
For the sake of comparison, the AuNPs were also electrodeposited onto GC/PEDOT electrode by potentiostatic method; that is, by applying a constant potential of +0.50 V for 100 s deposition time, from an aqueous solution containing 5 mM NaAuCl4 and 0.5 M H2SO4. This modified electrode is referred to as GC/PEDOT-AuNPs-POT.
The electrochemical characterization of GC/PEDOT-AuNPs sensors was carried out in 5 mM K3Fe(CN)6 (Sigma-Aldrich), 0.1 M LiClO4 (Sigma-Aldrich) aqueous solution, and/or in PBS by cyclic voltammetry (CV).
The SV preparation procedure was also applied in combination with the electrochemical quartz crystal microbalance measurements (EQCM). The EQCM measurements were performed using a Maxtek RQCM microbalance (Inficon, Syracuse, NY, USA). The working EQCM electrodes were AT-cut crystals of 5 MHz and 25.4 mm diameter, covered with Au layer. The electrochemically active area was of 1.37 cm2. The frequency changes of the working EQCM electrodes were measured simultaneously with the application of the sinusoidal voltage signal during the preparation of PEDOT and PEDOT-AuNPs coatings, respectively.
Scanning electron microscopy analysis was carried out using a TESCAN Vega 3 LMH scanning electron microscope (TESCAN, Brno, Czech Republic), in high vacuum.
Analysis of apple juice using the prepared GC/PEDOT-AuNPs electrochemical sensors was done using the standard addition method. The polyphenol content of juice samples was expressed as caffeic acid equivalents. The juice real samples were analyzed by using the following standard addition protocol: 2 mL of apple juice were added into 18 mL of phosphate buffer (pH 7) into the electrochemical cell and the CV response of the sensor was recorded. Afterwards, several aliquots of standard caffeic acid solution were added into the electrochemical cell to produce final concentration of the standard analyte of 100, 200, and 300 µM, respectively. After each standard addition, the CV response of the sensor was measured. The measurements were made in triplicate. Before the addition of 2 mL juice into the cell, the blank measurement in phosphate buffer solution was performed. The anodic peak currents were measured and plotted against the added caffeic acid concentrations. The polyphenol content expressed as caffeic acid was obtained from the corresponding calibration plot by extrapolation.

3. Results and Discussion

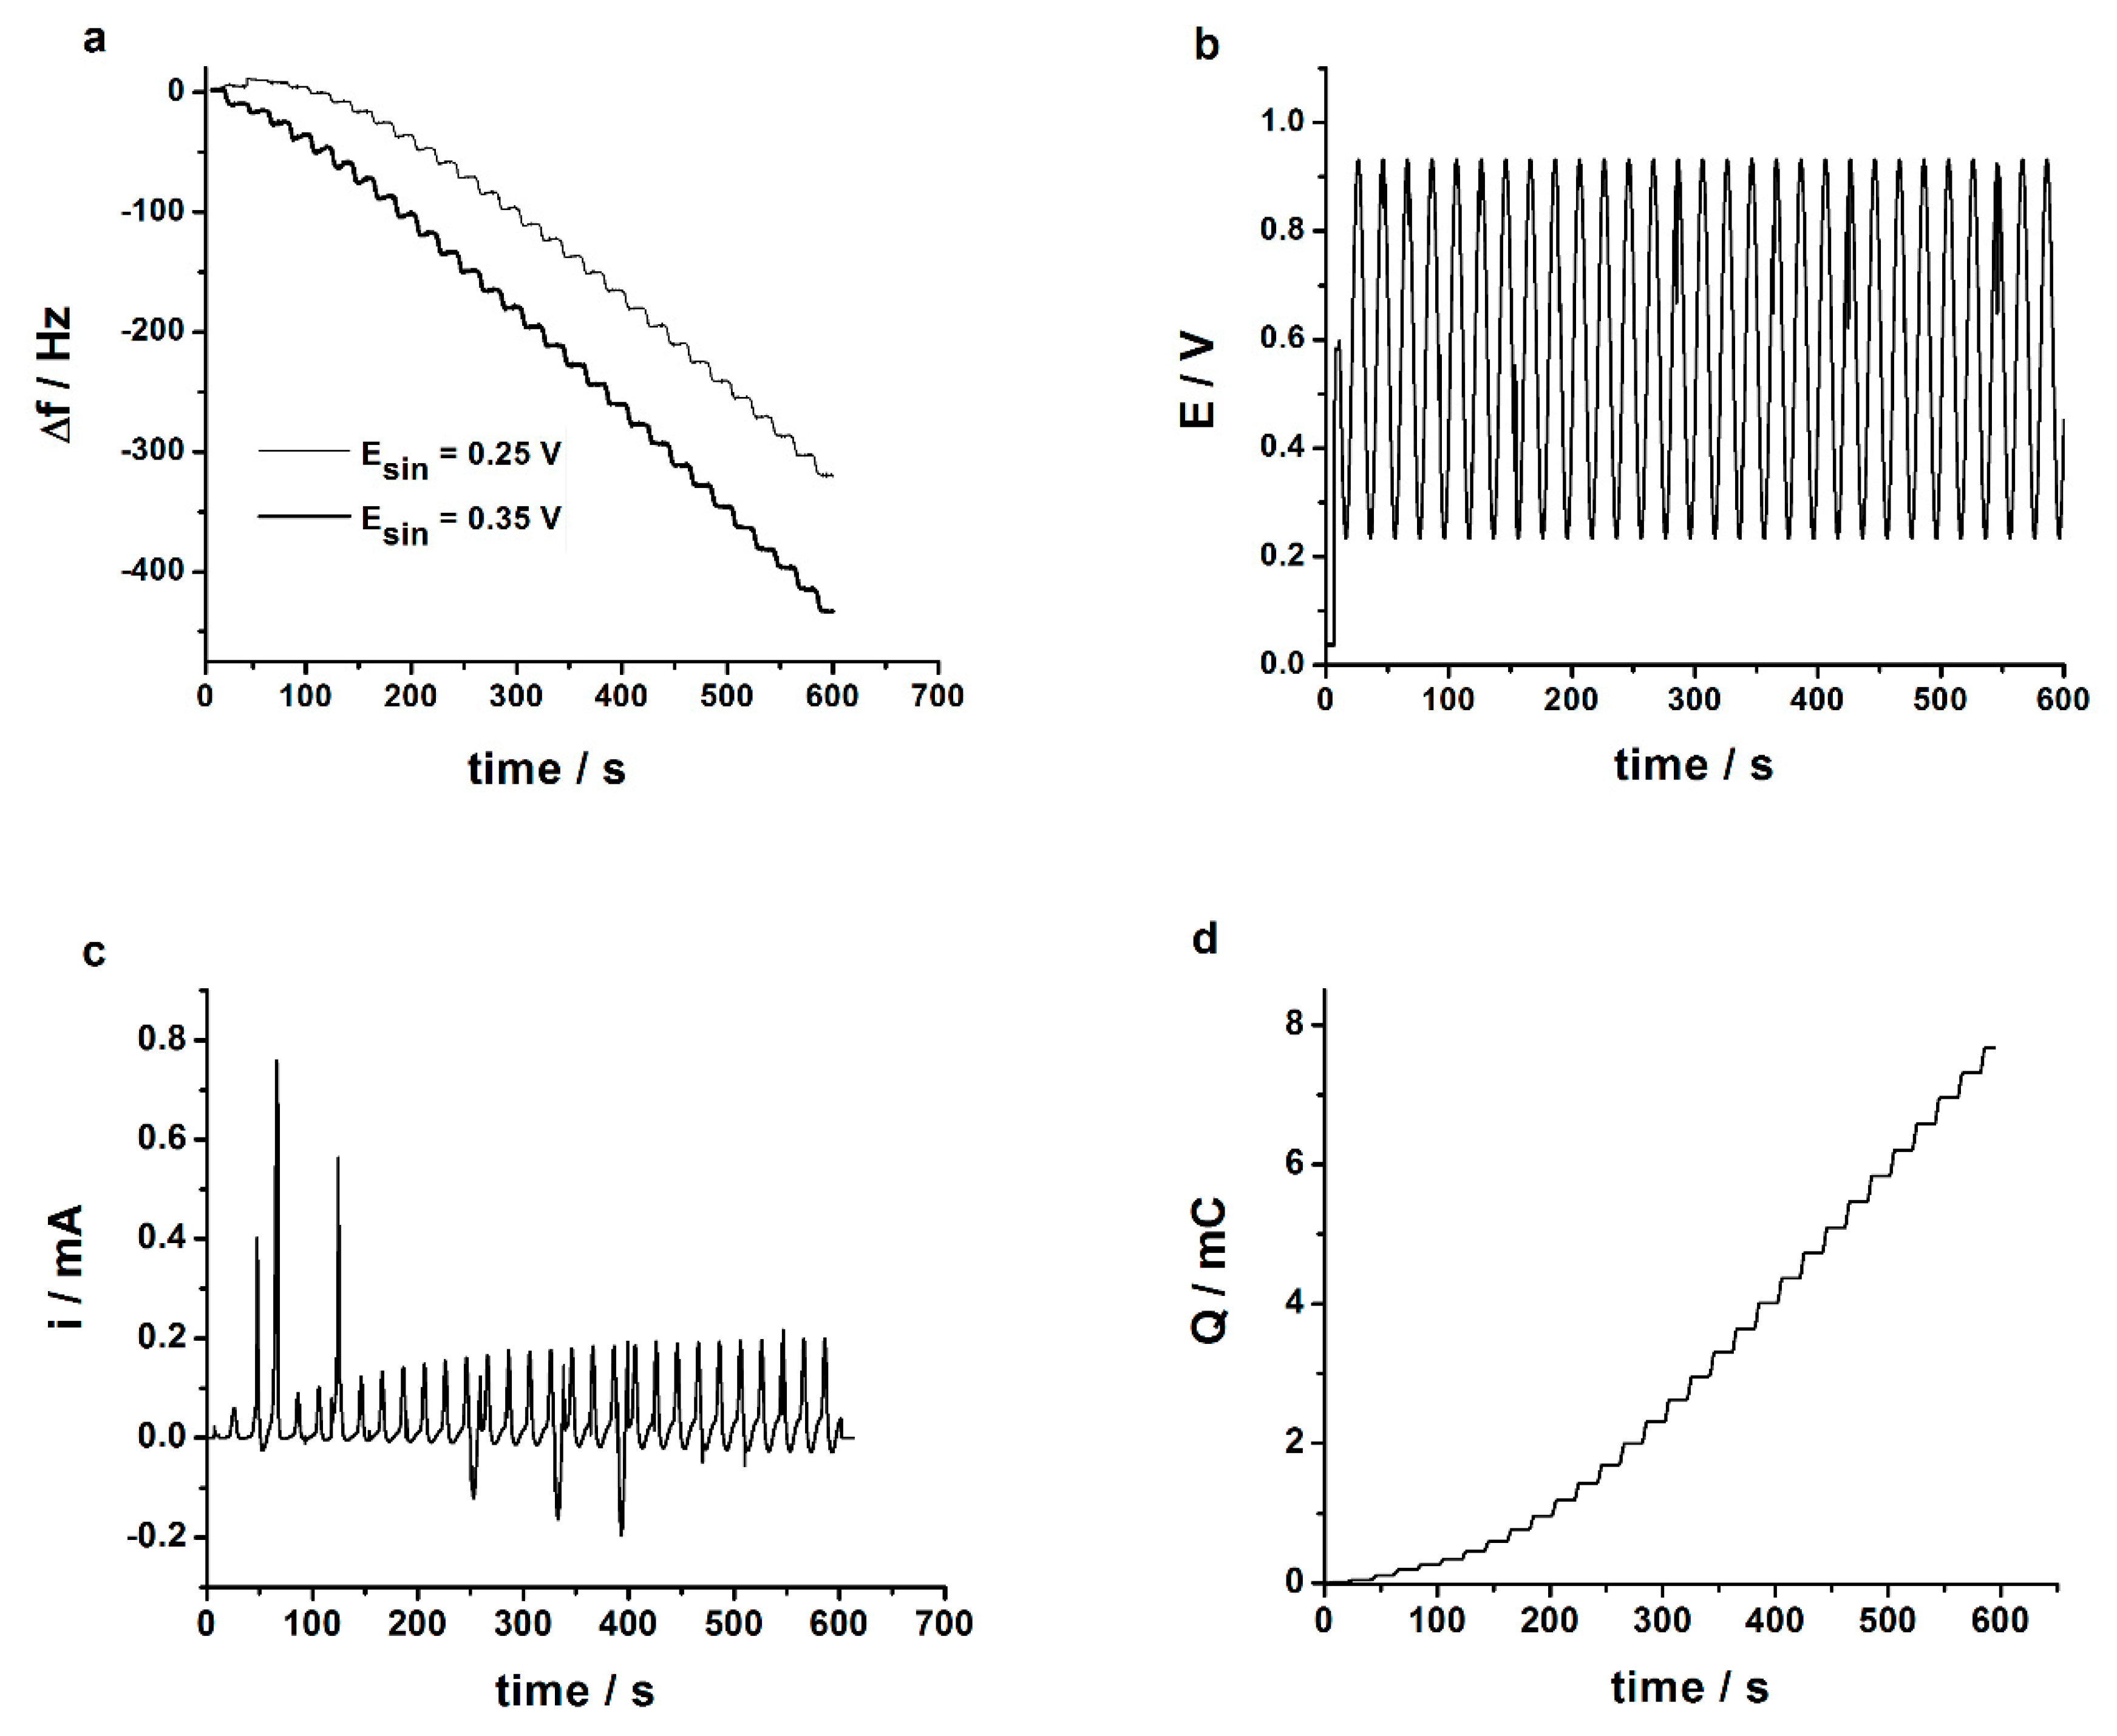
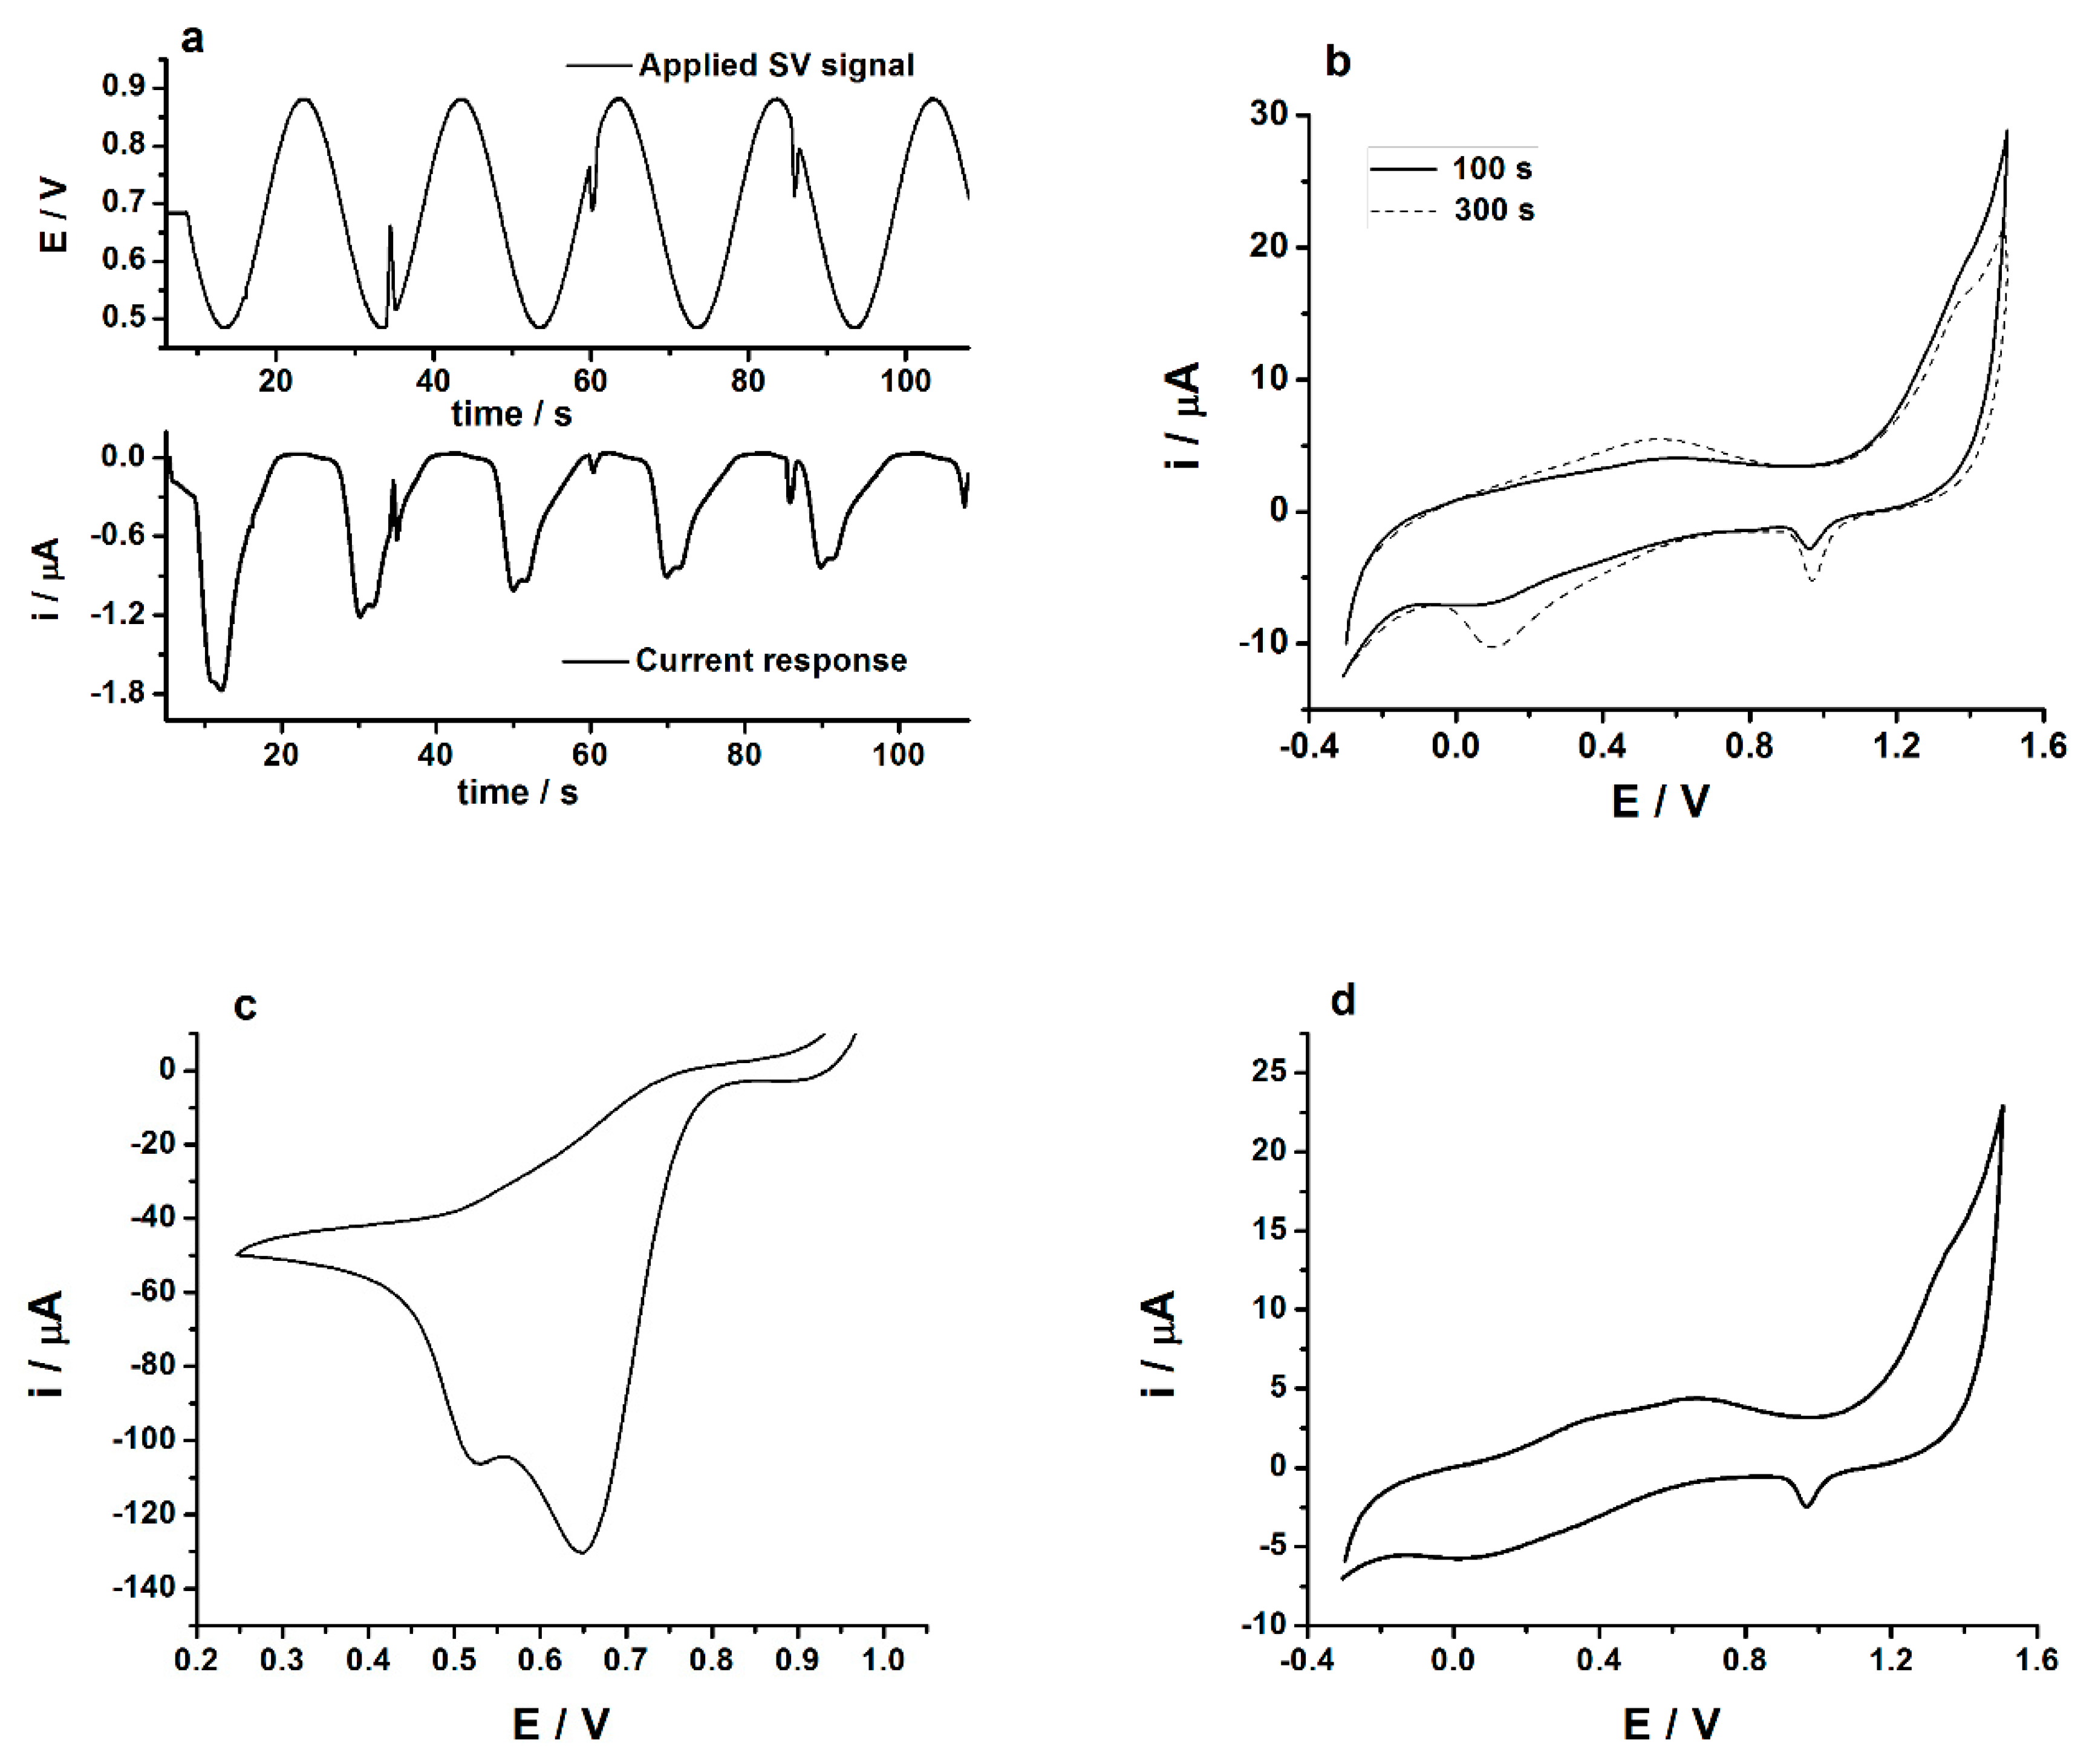
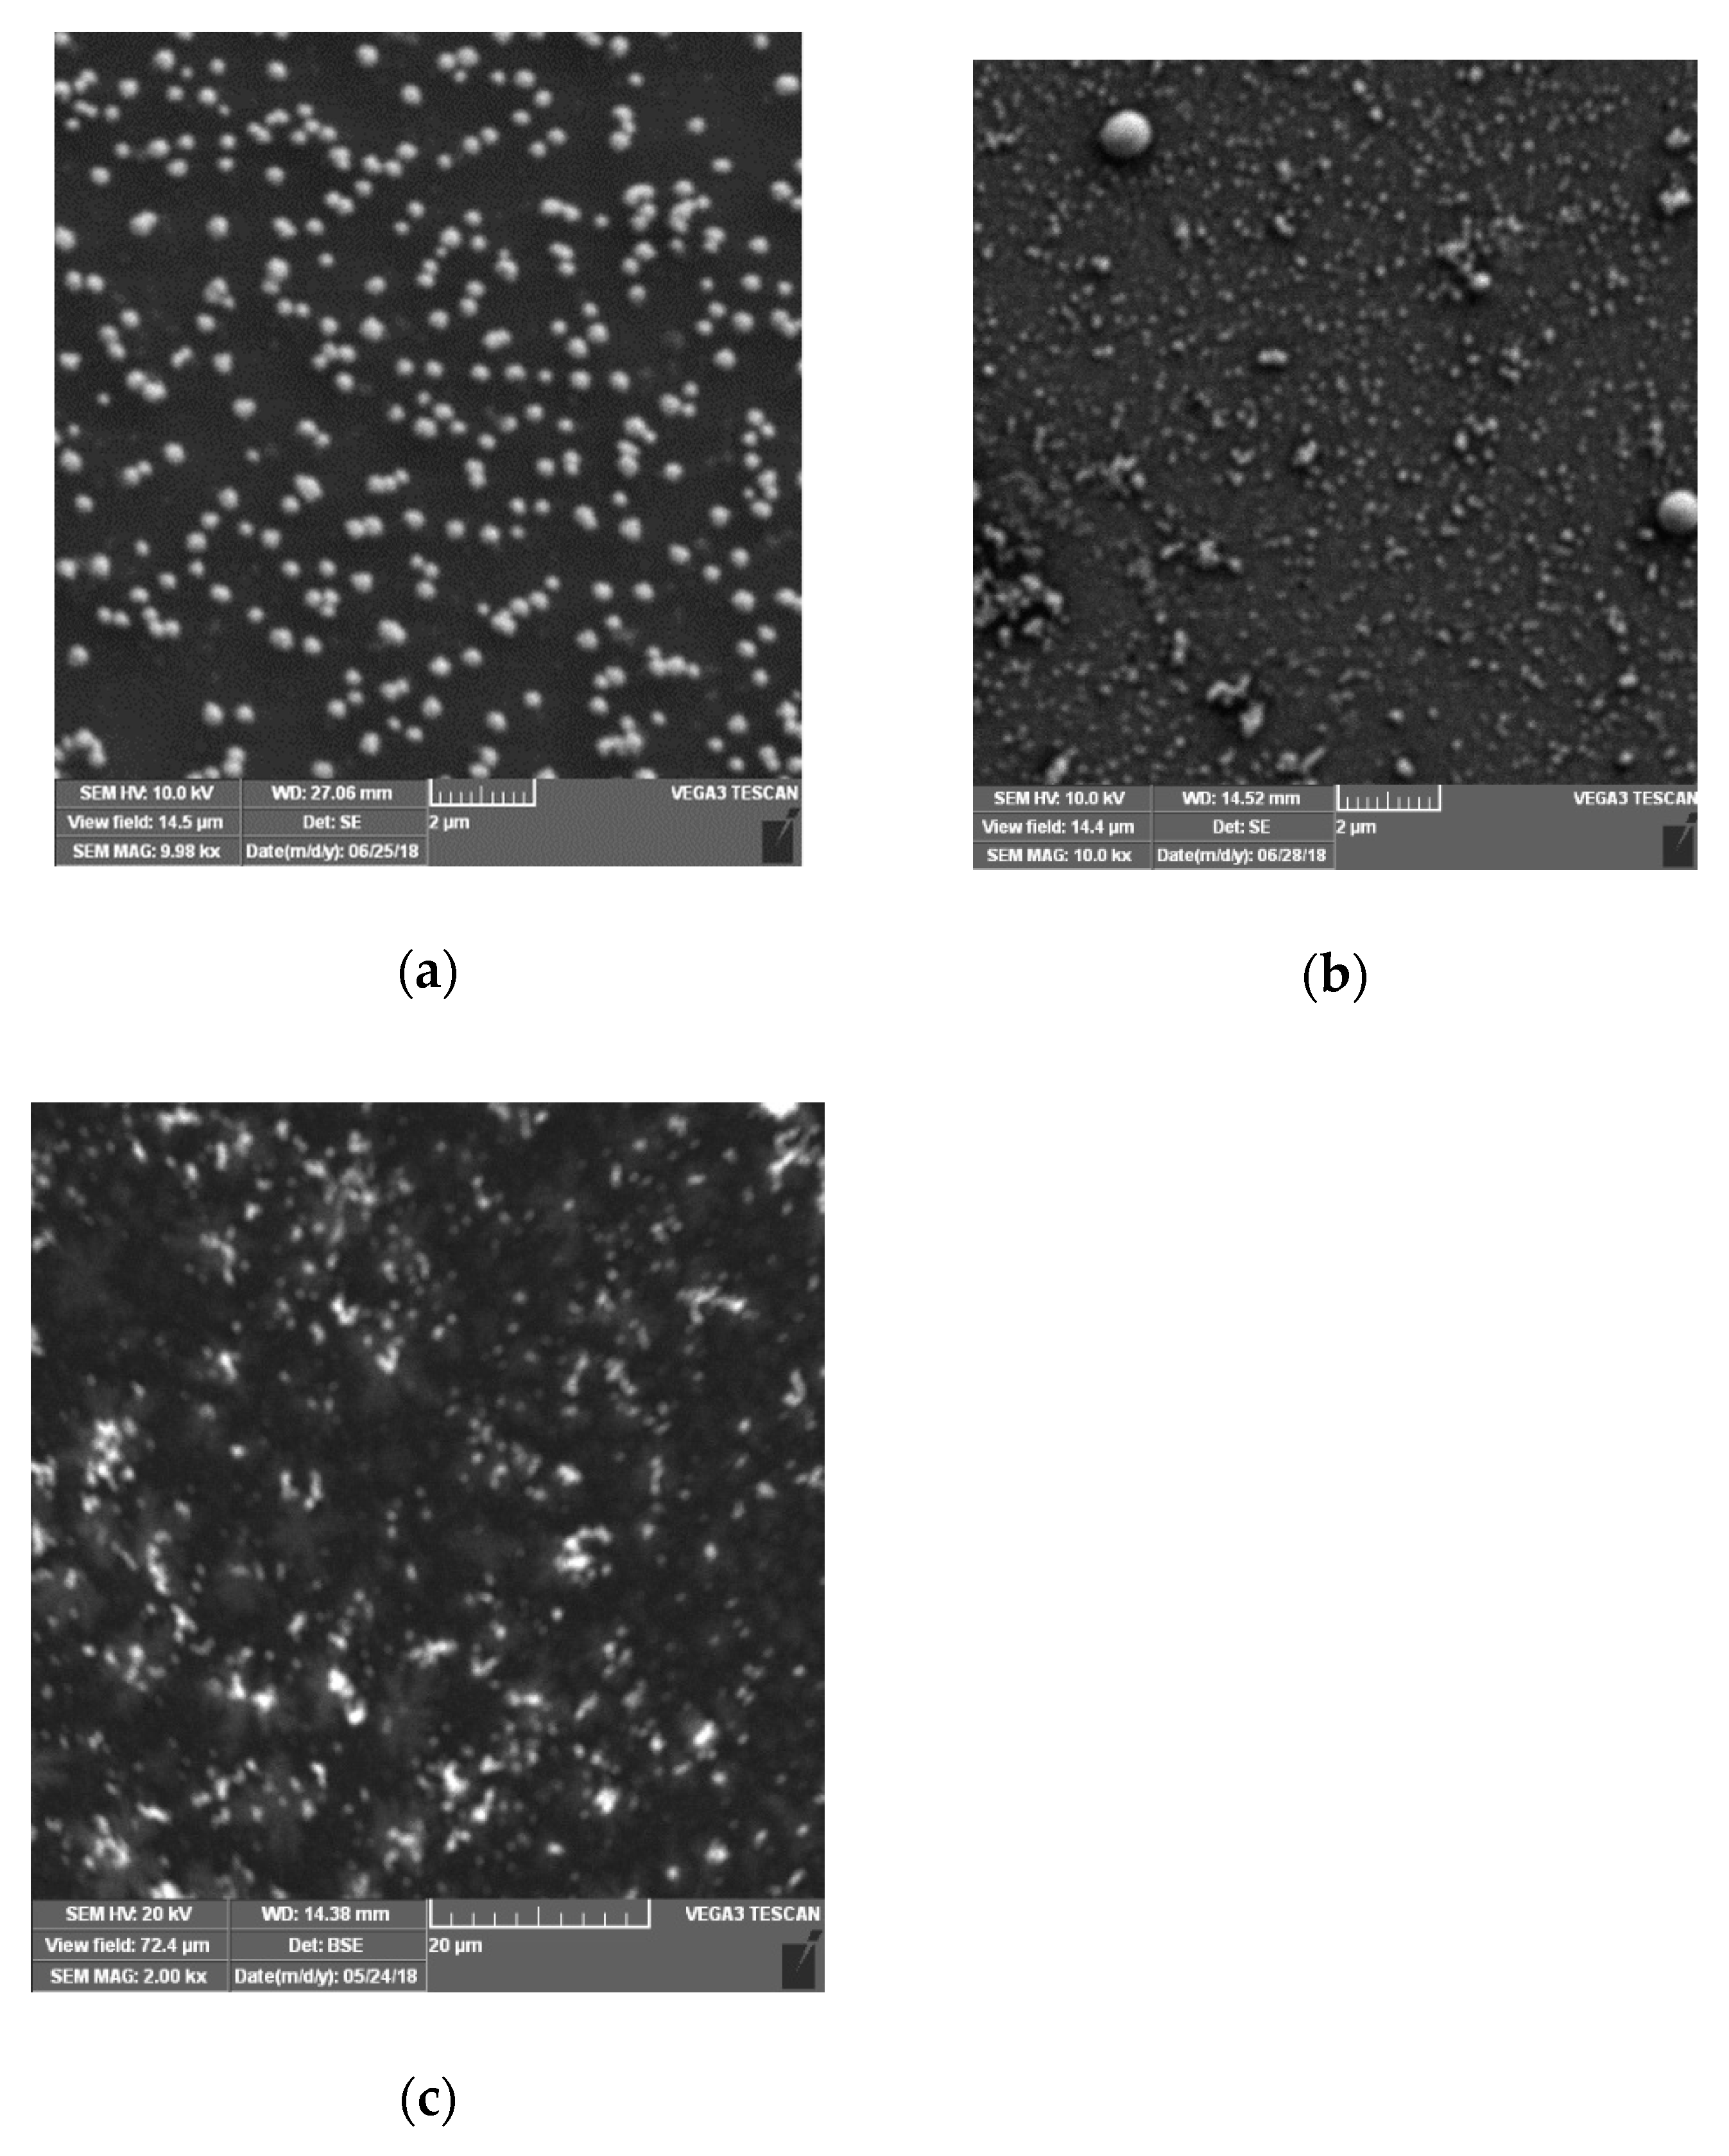
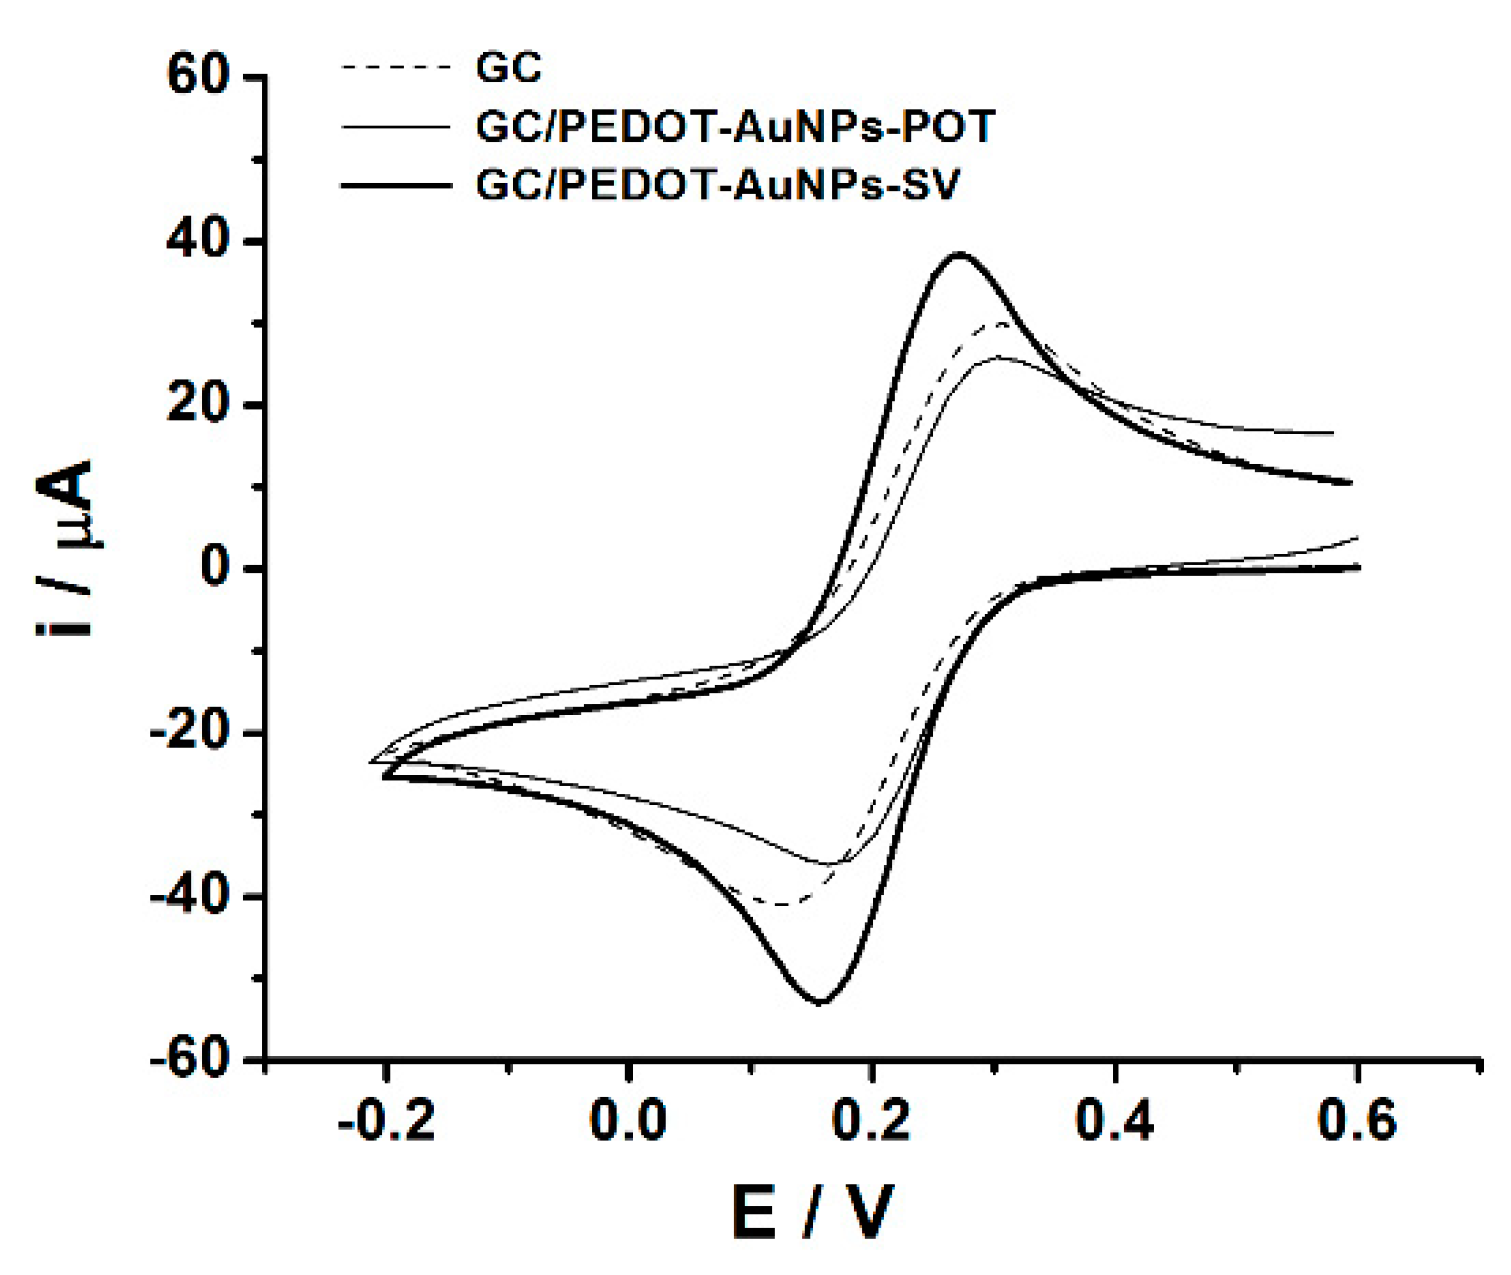
3.1. Electrochemical Preparation and Characterization of PEDOT-AuNPs Based Sensors

The poly(3,4-ethylenedioxythiophene)-gold nanoparticles-sinusoidal voltage (PEDOT-AuNPs-SV) based sensor was prepared in two steps: firstly, the poly(3,4-ethylenedioxythiophene) (PEDOT) layer was electrodeposited onto glassy carbon (GC) electrode surface by using the novel SV method, and secondly, the AuNPs were in-situ electrodeposited onto the glassy carbon electrode/poly(3,4-ethylenedioxythiophene) (GC/PEDOT) electrode surface by means of SV method. Figure 1a shows the electrochemical quartz crystal microbalance (EQCM) frequency signal recorded during the electrodeposition of the PEDOT layer onto the gold-quartz crystal microbalance (Au-QCM) electrode using the SV procedure at two different amplitudes of the applied sinusoidal wave tension. The applied sinusoidal wave tension with an amplitude of 0.25 V is displayed in Figure 1b. The resulting current response is depicted in Figure 1c.
The staircase feature of the EQCM frequency variation during the electrodeposition of the 3,4-ethylenedioxythiophene (EDOT) layer (see Figure 1a) attests that the electropolymerization process of the EDOT monomer is taking place during the application of the anodic part of the sinusoidal wave tension with respect to the constant potential of +0.60 V, i.e., the electropolymerization process occurs in a potential region comprised between 0.80 to 0.95 and back to 0.80 V. The response displayed in Figure 1c had a sinusoidal shape and followed the trend of the applied SV signal, both positive and negative currents being recorded. The positive currents correspond to the anodic part of the SV tension signal (Figure 1b), while the negative currents were due to the cathodic counterpart of the SV signal with respect to the constant potential of +0.60 V. The current signal was filtered, taking into account that only the anodic part of the applied SV signal in the range of 0.80 to 0.95 and back to 0.80 V could be used in the electrodeposition of the PEDOT layer. Also, the small noises (transient currents) were filtered with a moving average procedure. The filtered current response was integrated according to the procedure described in Appendix A. To the filtered current response (see Figure A1 from Appendix A), a positive threshold was applied in order to integrate the current. The obtained electrical charge is displayed in Figure 1d. It is important to note that the shape of the electrical charge vs. time plot obtained from the integrated current response is similar to that of the frequency change (Δf) of the QCM electrode, attesting to the sinusoidal character of the electropolymerization process of the EDOT monomer via the SV procedure. In Figure 1d it can be observed that a charge of ca. 7.6 mC (i.e., 5.5 mC cm−2) was used in the electrodeposition of the PEDOT layer, assuming a 100% electropolymerization efficiency.
The amount of the electrodeposited PEDOT layer can be estimated using the Sauerbrey equation [30], which relates the frequency change (Δf) of the crystal resonator with the amount of deposited mass (Δm):
Δf = −2f02 Δm/nA (ρ μ)1/2
where f0 is the resonant frequency of the QCM crystal resonator and Δm is the mass change (g). The other parameters have their usual significance: n is the harmonic number of the oscillation (n = 1), A is the Au-QCM electrode surface active area (A = 1.37 cm2), ρ stands for the density of quartz (ρ = 2.648 g cm−3), and μ represents the shear modulus of quartz (μ = 2.947 × 10¹¹ g cm−1 s−2). The decrease of the frequency change reflects the deposition of the PEDOT layer onto the Au-QCM electrode surface. Considering that the PEDOT layer can be regarded as a rigid deposit according to the validity of the Sauerbrey equation, then the amount of the electrodeposited polymer can be computed. In the case of the SV signal with 0.25 V (rms) amplitude, the amount of PEDOT is 5.5 (±0.2) µg cm−2. When a larger amplitude of 0.35 V (rms) is used, the electrodeposited amount of PEDOT is 7.4 (±0.3) µg cm−2. However, the larger amplitude results in the application of electropolymerization potential values of ca. +1.1 V, and the over-oxidation of the electrodeposited polymer layer may take place if the potential value exceeds 0.95 V. Therefore, the amplitude of 0.25 V (rms) of the sin wave was applied consequently for the electrodeposition of PEDOT layers onto the GC electrode surface.
The AuNPs have been electrodeposited in-situ onto GC/PEDOT electrode surfaces by means of the SV procedure from aqueous solutions containing the metallic precursor NaAuCl4 by considering two different deposition intervals; namely, 100 and 300 s. Figure 2a shows the applied SV signal (top) and the relevant current response (bottom) recorded during the electrodeposition of AuNPs on top of the GC/PEDOT modified electrode. The small noise registered in the SV and current response signals was filtered, the resulting waveform signals of which are depicted in Appendix A (Figure A2). The characterization of the GC/PEDOT-AuNPs modified electrodes was performed in 0.5 M H2SO4 aqueous solution using the cyclic voltammetry (CV) method, and the obtained CV traces are depicted in Figure 2b.
The presence of AuNPs onto the PEDOT layers is demonstrated by the cathodic peak located at ca. +1.0 V (see Figure 2b), which is ascribed to the reduction of the gold oxide formed during the anodic, forward, potential scan. This cathodic peak current increases in intensity for deposition time of 300 s, but the appearance of a second cathodic peak at ca. +0.12 V could be ascribed to the formation of a bulky gold structure. The electrodeposition of AuNPs by SV for times lower than 100 s resulted in the decrease of the cathodic peak located at +1.0 V. For higher frequency of 500 mHz, the electrodeposition of AuNPs is not effective due to the small duration time of the sinusoidal wave compared to a 50 mHz frequency value. Consequently, a time of 100 s was used in the electrodeposition of AuNPs by SV procedure. The selection of the d.c. potential value used in the SV procedure for AuNPs preparation was based upon the cyclic voltammogram recorded in an aqueous solution containing 5 mM NaAuCl4 and 0.5 M H2SO4 (see Figure 2c). There are two cathodic peaks located at ca. +0.65 V and +0.50 V, respectively, which are related to the reduction processes of Au3+ precursor to Au1+, and Au1+ to Au0, respectively. The application of a SV signal with an amplitude of 0.20 V over the d.c. potential of +0.70 will result in the in-situ electrodeposition of Au nanoparticles onto the GC/PEDOT electrode surface. In addition to this, the successful electrodeposition of the AuNPs by means of the potentiodynamic method—i.e., cyclic voltammetry—is confirmed by the measurement performed in 0.5 M H2SO4 aqueous solution using the cyclic voltammetry method (see Figure 2d), when a cathodic peak could be observed at ca. +1.0 V ascribed to the reduction of the gold oxide formed in the forward anodic scan.
Alternatively, the AuNPs were also electrodeposited onto the GC/PEDOT electrode by potentiostatic method from an aqueous solution containing 5 mM NaAuCl4 and 0.5 M H2SO4. In this case, a constant potential of +0.50 V was applied for a deposition time of 100 s. The electrodeposition of AuNPs by potentiostatic method can provide a useful comparison between this method and the SV procedure in terms of the morphology of the obtained nanoparticles. Finally, the deposition of chemically synthesized AuNPs has also been attempted by following a procedure successfully proposed for the electrocatalytic oxidation of glucose [31].
The morphology of the AuNPs prepared by SV, potentiostatic, and drop casting methods was investigated by using scanning electron microscopy (SEM) (see Figure 3).
The AuNPs electrodeposited by SV method display a regular size distribution (with average diameter of ca. 330 nm) and a homogeneous dispersion onto the PEDOT layer (see Figure 3a), compared to the irregular shapes and inhomogeneous distribution of the AuNPs obtained by the classical potentiostatic method (see Figure 3b). The SEM image of the AuNPs deposited via drop casting also shows irregular shape and inhomogeneous distribution of the nanoparticles (see Figure 3c). These findings demonstrate the capability of the SV method to provide a homogeneous distribution of the electrodeposited nanoparticles, and support the interest in applying this method during the development of the proposed electrochemical sensor.
Finally, the good conductivity of all the obtained PEDOT-AuNPs coatings was ascertained by testing the electrochemical response of a soluble redox probe, i.e., K3Fe(CN)6, showing, in any case, a peak-to-peak separation close to 60 mV (see Figure A3 from Appendix A).

3.2. Electrochemical Behavior of Caffeic Acid at the GC/PEDOT-AuNPs-SV Sensor

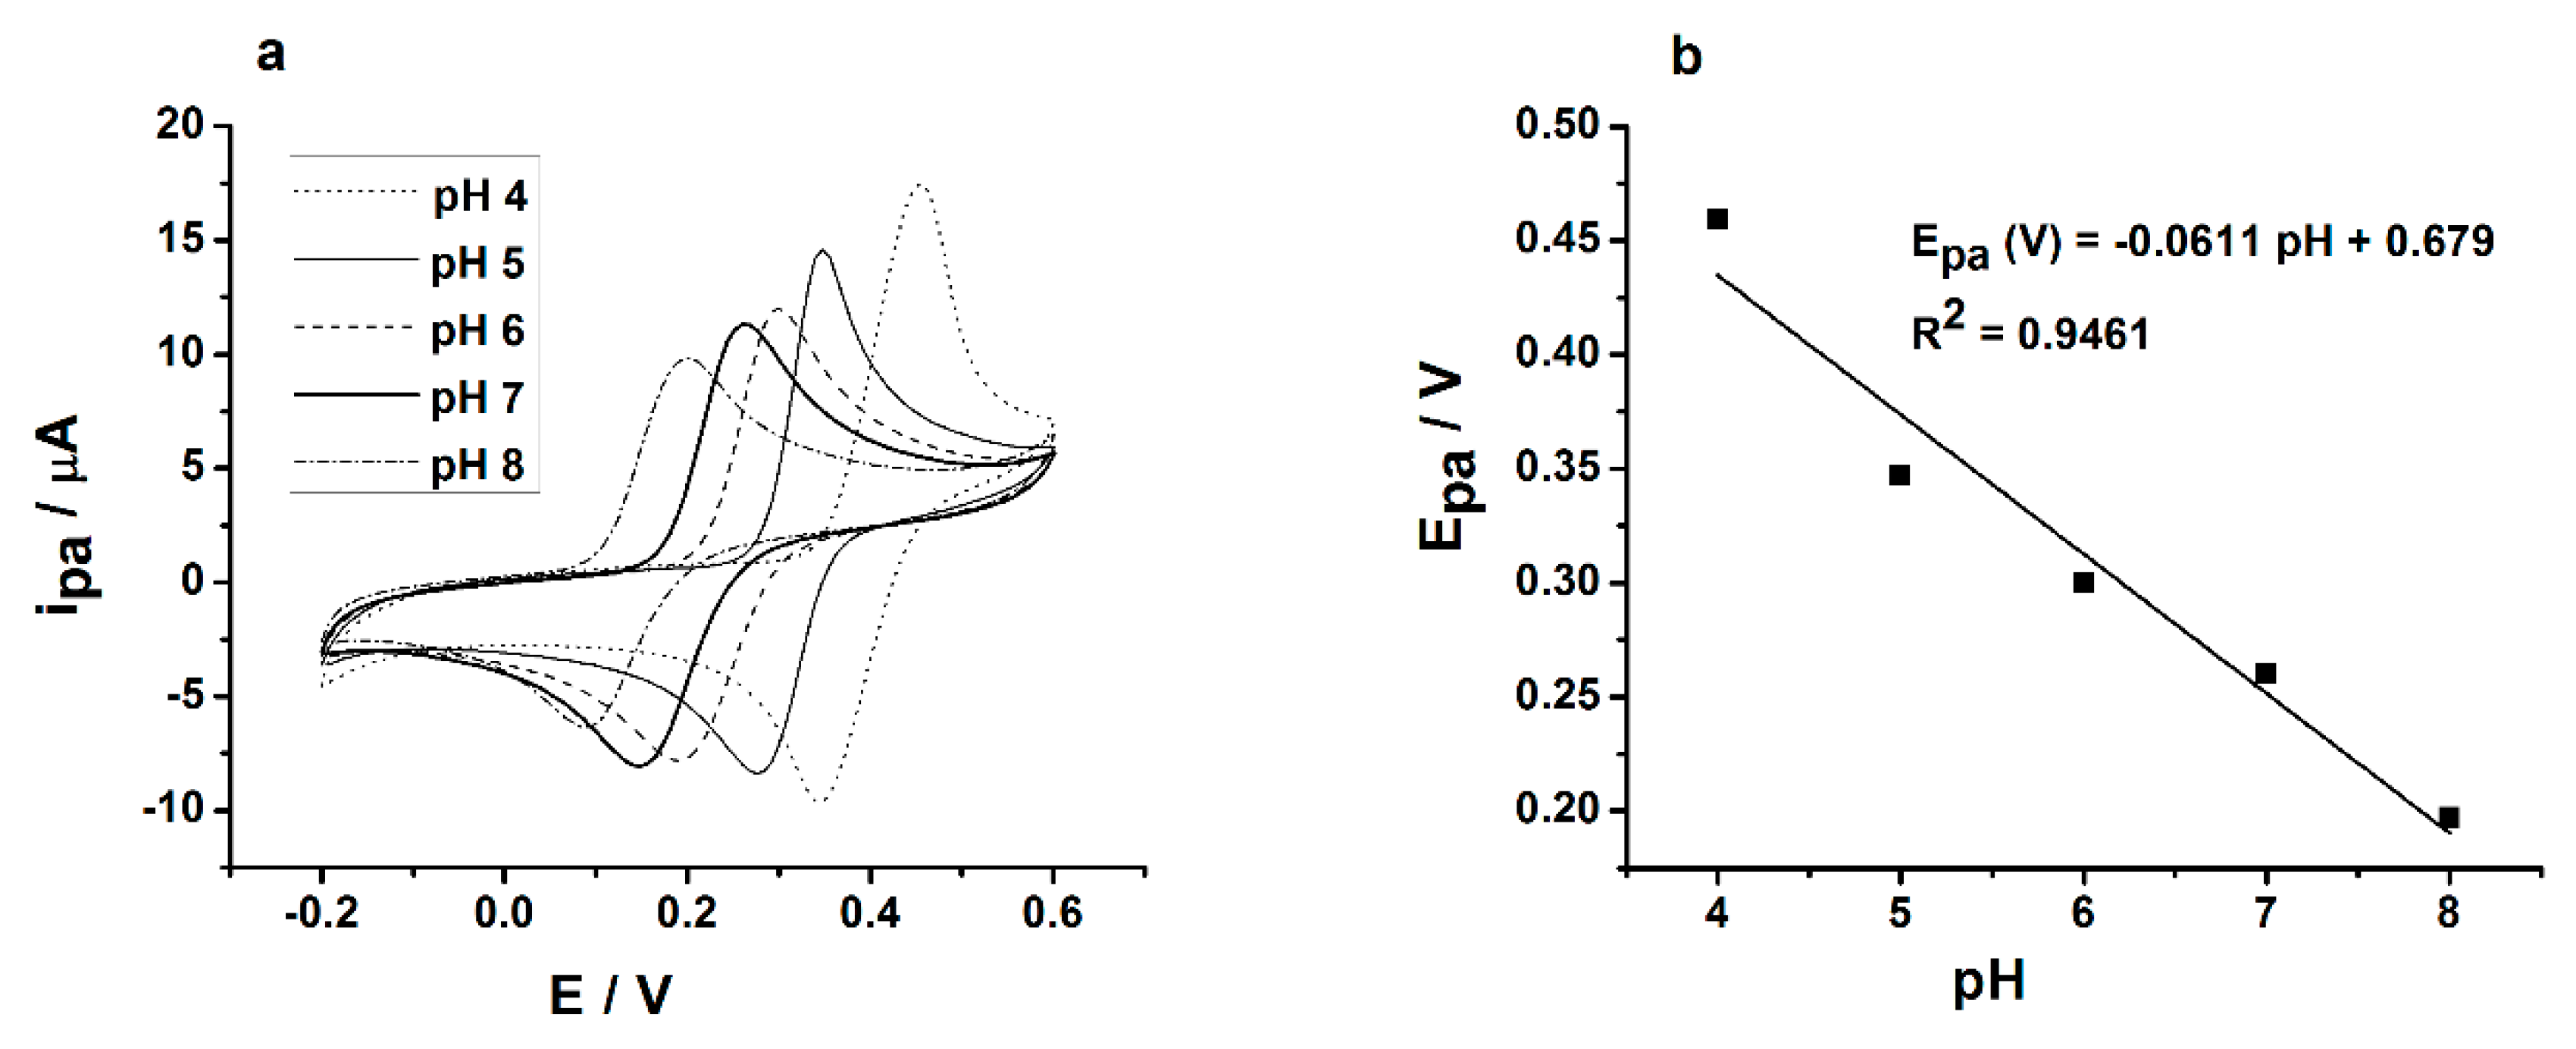
Influence of pH on Caffeic Acid Determination

The influence of pH on the CA oxidation at the GC/PEDOT-AuNPs-SV sensor was investigated in an aqueous solution for pH values ranging from 4 to 8. Figure 4a displays the cyclic voltammograms registered at the GC/PEDOT-AuNPs-SV sensor whereas the dependence of the CA oxidation anodic peak potential on pH is depicted in Figure 4b. The anodic peak potential is shifting toward less positive values with the increase of pH attesting that the electron transfer process during CA oxidation is accompanied by the transfer of protons. The slope of the dependence of the anodic peak potential versus the pH of solution is of 61.1 mV/pH unit, a value close to the theoretical one of 59.2 mV/pH unit; this finding suggests that there are the same numbers of electrons and protons involved in the electrochemical oxidation process of CA. According to literature reports [32], the CA oxidation involves the transfer of two electrons; consequently, there is a two electrons/two protons electrochemical process. Even if the anodic peak current for pH 7 is not the maximum one in the investigated range of pH 4 to 8, the analytical applications and the assesment of the sensor’s performance were carried out in aqueous solutions at pH 7, which is a pH value favored for food and biomedical samples analysis. Furthermore, the proposed electrochemical sensor displayed the best stability in buffered solutions of pH 7.

3.3. Analytical Applications of GC/PEDOT-AuNPs-SV Sensor

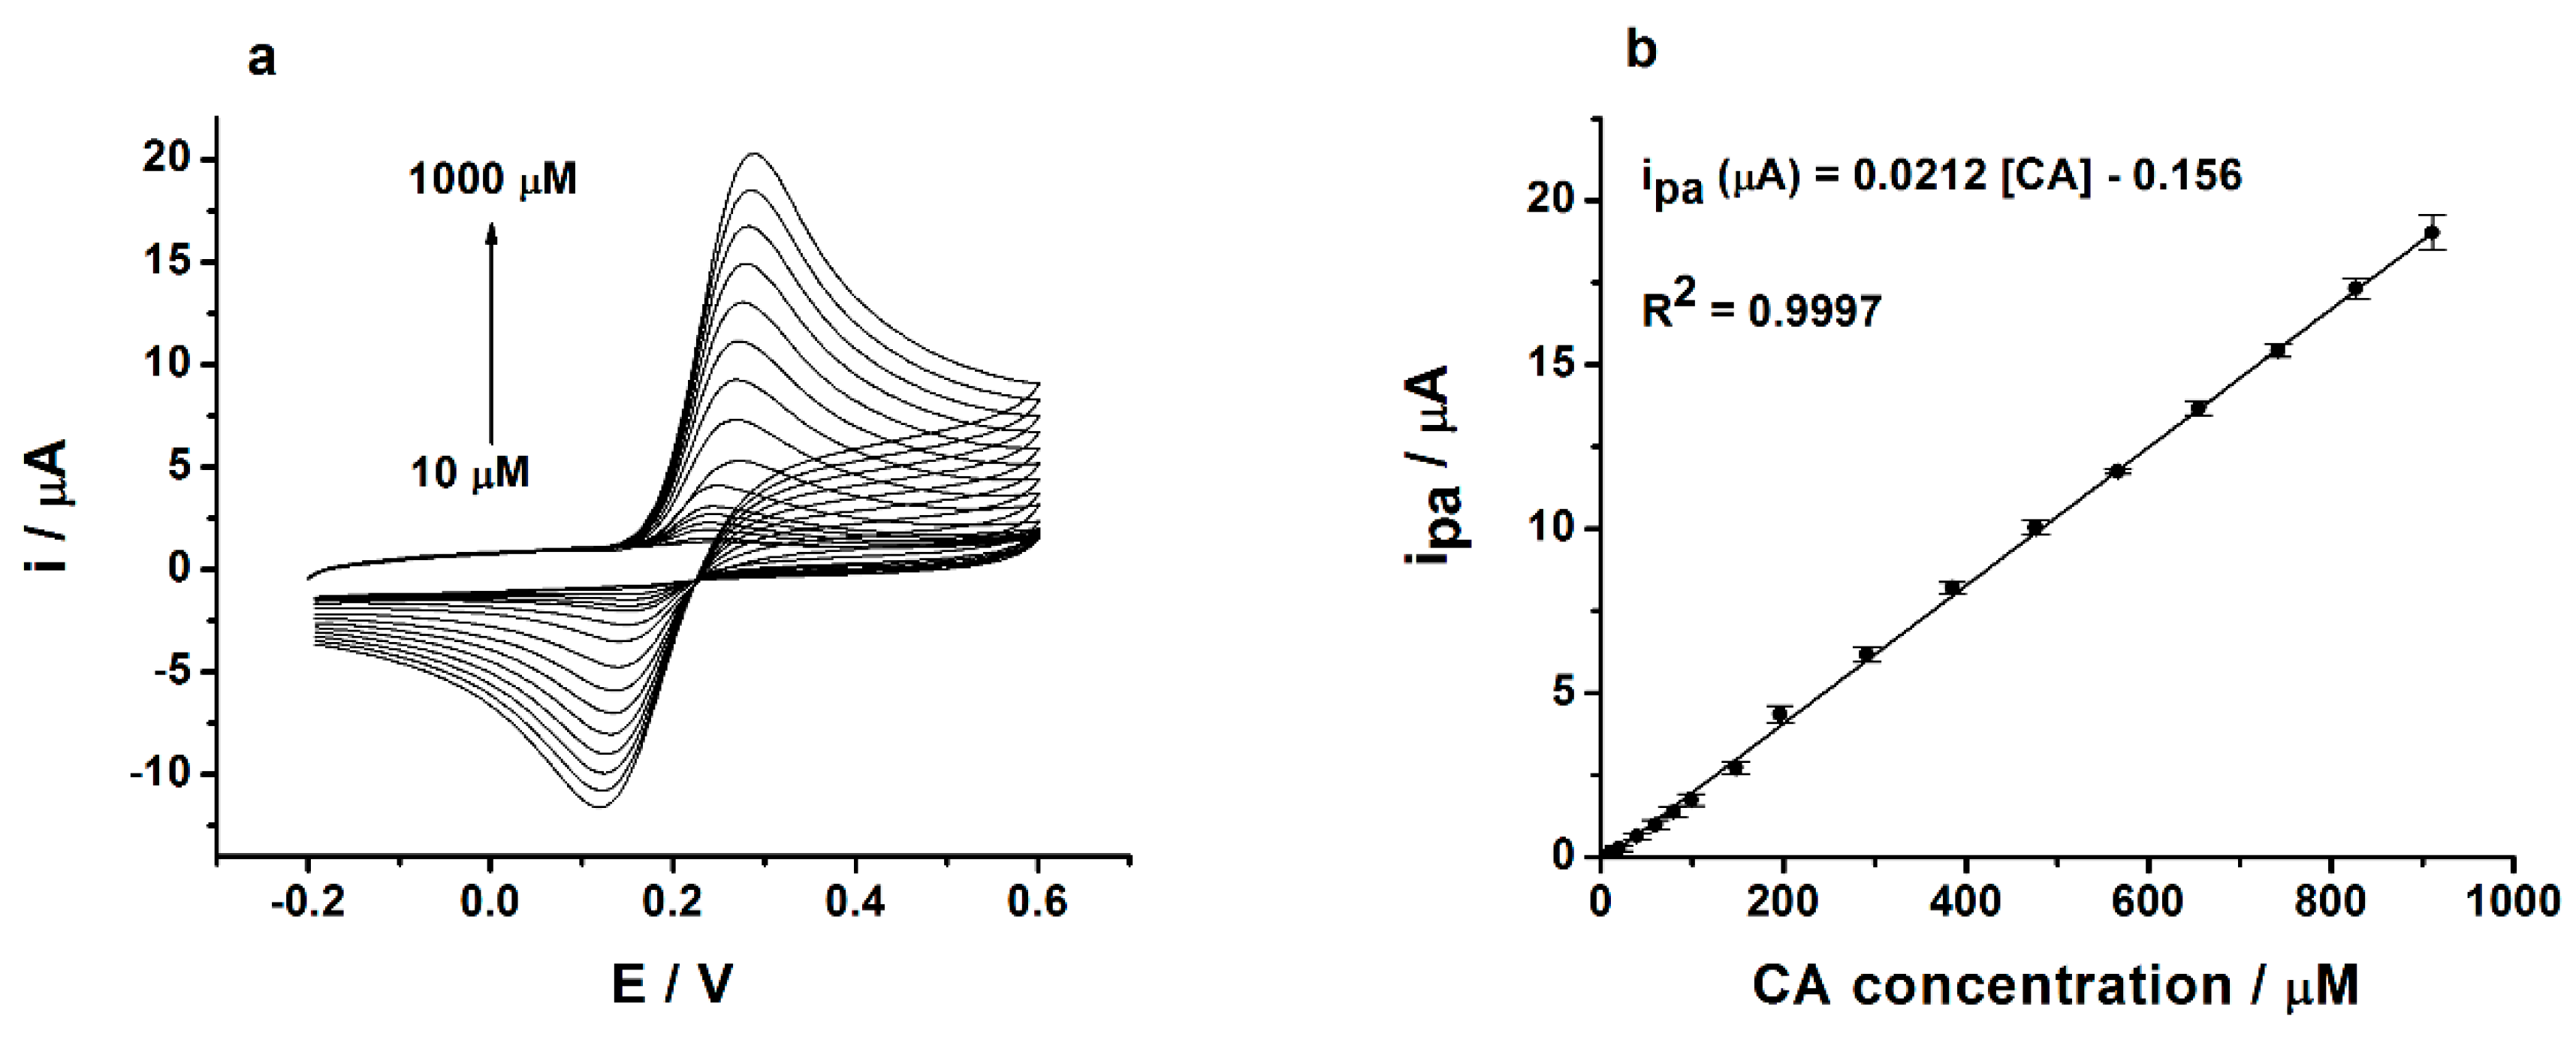
3.3.1. Analytical Performances of GC/PEDOT-AuNPs-SV Sensor

The electrochemical behavior of caffeic acid (CA) has been investigated by cyclic voltammetry in an aqueous buffered solution of pH 7 at the glassy carbon electrode/poly(3,4-ethylenedioxythiophene)-gold nanoparticles-sinusoidal voltage (GC/PEDOT-AuNPs-SV) sensor at various concentrations of the analyte. The cyclic voltammetry (CV) traces depicted in Figure 5a reveal a linear increase of the anodic peak current with the CA concentration in the range of 10 to 1000 µM. This behavior attests to the analytical performance of the PEDOT-AuNPs-SV sensing layer toward the CA oxidation in a buffered aqueous solution.
The limit of detection (LOD) was estimated according to the following criterion: 3 s/m, where s is the standard deviation of the blank (n = 5), and m is the slope of the calibration plot, i.e., anodic peak current versus CA concentration dependence. In the case of the GC/PEDOT-AuNPs-SV sensor, a LOD value of 4.24 (±0.12) µM for CA was obtained. The sensitivity of this sensor computed from the calibration plot (see Figure 5b) was 0.39 µA cm−2 µM−1. This sensitivity value was derived using the electroactive area of the sensor determined by cyclic voltammetry in the presence of K3Fe(CN)6. The reproducibility of the sensor’s SV preparation procedure was evaluated by measuring the responses of three independent sensors over the entire calibration range of 10 μM to 1 mM CA. The relative standard deviation (RSD%) of the slopes of the calibration plots was of 5.2%, attesting to good reproducibility of the SV preparation procedure. For comparison, the LOD for a GC/PEDOT-AuNPs-dc sensor was of 6.4 µM, which is higher than that of the SV-based sensor. Finally, analytical performances of the proposed SV-based sensor are comparable with those previously published in the literature (see Table 1), the analytical linear response range being wider than others, and supporting the development of this kind of sensor and its further use in real samples analysis.

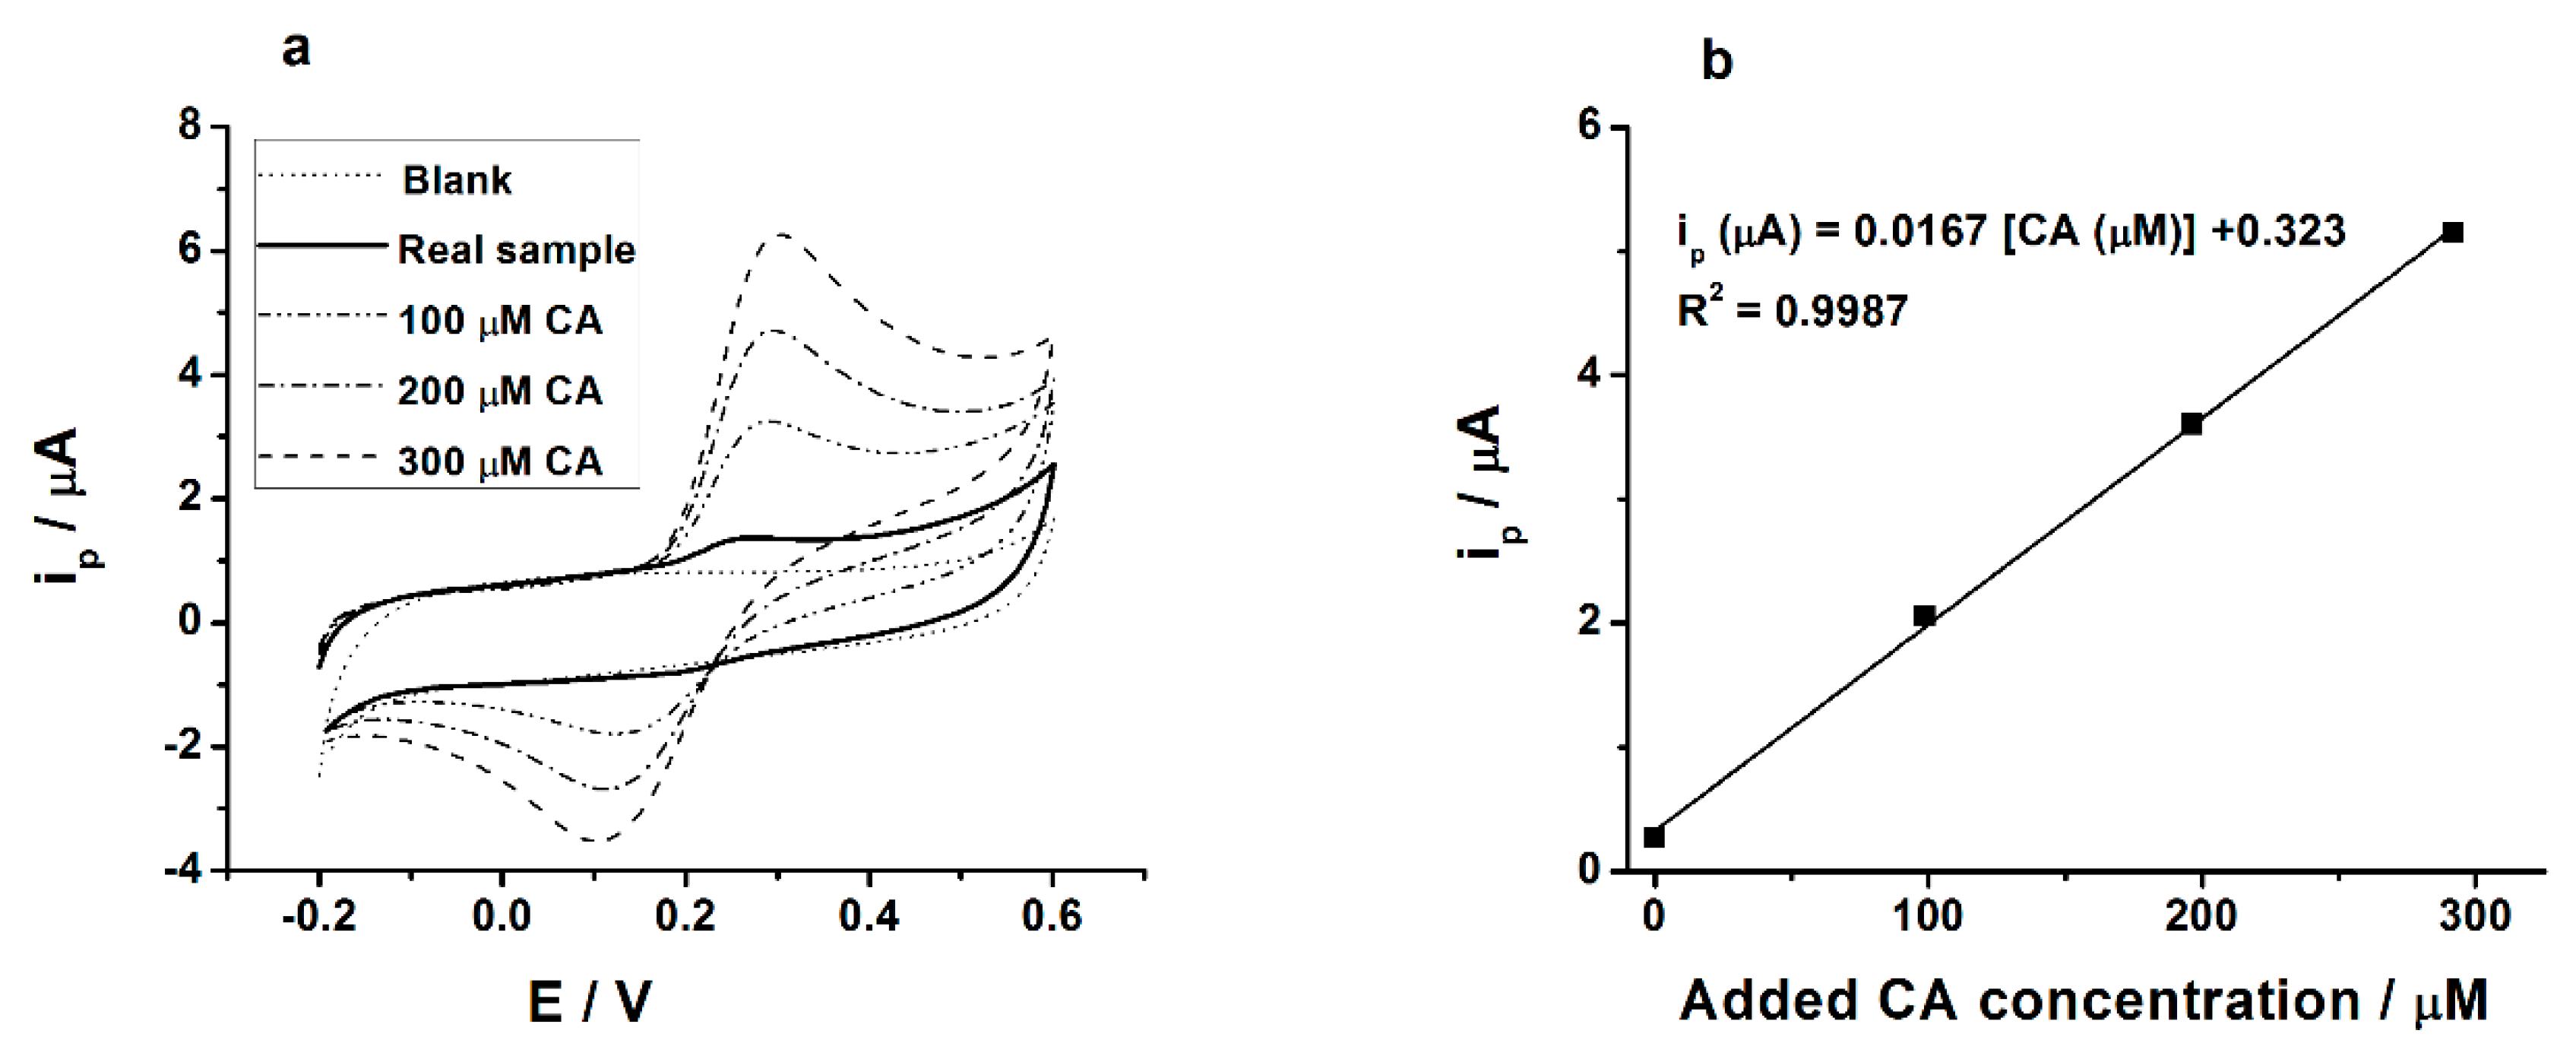
3.3.2. Real Samples Analysis

The glassy carbon electrode/poly(3,4-ethylenedioxythiophene)-gold nanoparticles-sinusoidal voltage (GC/PEDOT-AuNPs-SV) sensor has been applied in the analysis of real samples like peaches and apple juices to estimate the total polyphenols content expressed as equivalents of caffeic acid. The real sample analysis was performed under the standard addition protocol. Figure 6a displays the cyclic voltammograms recorded at the GC/PEDOT-AuNPs-SV sensor for the peach juice sample and several additions of standard CA solution. The dependence of the anodic peak current on added caffeic acid (CA) concentrations is depicted in Figure 6b.
The total polyphenols content expressed as equivalents of CA was estimated from the standard addition plot taking into consideration that the dilution factor and a value of 34.8 mg/L was obtained. For apple juice, the total polyphenols content was of 314.7 mg/L. These total polyphenol content values are similar to those obtained by chromatographic methods [37,38,39] and demonstrate the possibility to successfully apply these electrochemical sensors in the analysis of real samples with complex composition.

4. Conclusions

The aim of this work lies in the development of an electrochemical sensor for caffeic acid determination using an innovative technique based on the use of sinusoidal voltage (SV) for the electrodeposition of AuNPs on poly(3,4-ethylenedioxythiophene) (PEDOT)-modified electrodes. This method is firstly applied here for in-situ electrodeposition of AuNPs within conducting polymer layers. The successful electrodeposition of AuNPs by using the SV method was confirmed by scanning electron microscopy and cyclic voltammetry measurements. The analytical performances of the glassy carbon electrode/poly(3,4-ethylenedioxythiophene)-gold nanoparticles-sinusoidal voltage (GC/PEDOT-AuNPs-SV) based sensor toward caffeic acid have been investigated in aqueous buffered solutions. A linear response of the sensor towards caffeic acid over a wide concentration range, comprised between 10 µM and 1 mM, was obtained. The value of the limit of detection was of 4.24 (±0.12) µM caffeic acid, attesting to the capability of the proposed sensor to detect low concentrations of the analyte. The GC/PEDOT-AuNPs-SV sensor was successfully applied in the determination of the total polyphenols content in real samples like apple and peach juices with good reproducibility.

Author Contributions

Conceptualization, L.P., C.Z. and S.L.; Data curation, D.B., F.T., C.M. and S.L.; Formal analysis, L.P., C.Z., F.T., S.V.P., S.D.G., C.L. and S.L.; Investigation, D.B., C.M. and S.L.; Methodology, L.P., C.Z., F.T. and S.L.; Project administration, S.L.; Resources, S.L.; Software, S.V.P. and S.D.G.; Supervision, L.P., C.Z. and S.L.; Validation, L.P. and S.L.; Visualization, S.D.G., C.L. and S.L.; Writing—original draft, S.L.; Writing—review & editing, L.P., C.Z., F.T., S.D.G., C.M., C.L. and S.L.

Funding

This research received no external funding.

Acknowledgments

D.B. acknowledges the Erasmus+ fellowship from the University of Modena and Reggio Emilia to support the 4-months research stage at the Department of Analytical Chemistry and Environmental Engineering, the University Politehnica of Bucharest.

Conflicts of Interest

The authors declare no conflict of interest.

Appendix A

1. Method to Calculate Electric Charge from Electric Current Waveforms.
In the time domain, actual value of the electric charge is given by the following equation, where i is the electric current:
q ( t ) = t i ( τ ) d τ
In the discreet time domain, Equation (A1) changes in (A2), considering T as sampling period and n the actual index in discreet time:
q ( n T ) = T j = 0 n 1 i ( j T )
Equation (A2) reveals that electric charge accumulates in time and mai be calculated from measured samples of electric current at any point in time. The average electric current to the same index n may be calculated using formula:
I a v g ( n T ) = 1 n · j = 0 n 1 i ( j T )
Combining Equations (A2) and (A3) one obtains the charge equation as a function of average current:
q ( n T ) = T · n · I a v g ( n T )
The total amount of electric charge in the process may be calculated for n = N , where N is the total number of electric current samples acquired during the experiment:
q t o t a l = T · N · I a v g t o t a l
Consequently, the obtained filtered current and the threshold current, i.e., as a response of the SV applied signal in the potential domain from 0.80 to 0.95 back to 0.80 V, are depicted in Figure A1.
Figure A1. (a) The filtered current response corresponding to the original registered current depicted in Figure 1c. (b) The threshold current response used in the determination of the electrical charge depicted in Figure 1d.
Chemosensors 07 00065 g0a1
Figure A2. (a) The filtered waveform signal corresponding to the SV applied signal depicted in Figure 2a, top panel. (b) The filtered waveform signal related to the current response depicted in Figure 2a, bottom panel.
Chemosensors 07 00065 g0a2
Figure A3. Cyclic voltammograms recorded at GC (dashed line), GC/PEDOT-AuNPs-POT (thin solid line), and GC/PEDOT-AuNPs-SV (thick solid line) electrodes in aqueous solution containing 5 mM K3Fe(CN)6, 0.1M LiClO4. Potential scan rate: 50 mV s−1.
Chemosensors 07 00065 g0a3

References

  1. Shahidi, F.; Ambigaipalan, P. Phenolics and polyphenolics in foods, beverages and spices: Antioxidant activity and health effects—A review. J. Funct. Foods 2015, 18, 820–897. [Google Scholar] [CrossRef]
  2. Scalbert, A.; Williamson, G. Dietary intake and bioavailability of polyphenols. J. Nutr. 2000, 130, 2073S–2085S. [Google Scholar] [CrossRef] [PubMed]
  3. Singleton, V.L.; Orthofer, R.; Lamuela-Raventos, R.M. [14] Analysis of total phenols and other oxidation substrates and antioxidants by means of folin-ciocalteu reagent. Methods Enzymol. 1999, 299, 152–178. [Google Scholar] [CrossRef]
  4. Escarpa, A.; Gonzalez, M.C. An overview of analytical chemistry of phenolic compounds in foods. Crit. Rev. Anal. Chem. 2001, 31, 57–139. [Google Scholar] [CrossRef]
  5. Kilmartin, P.A. Electrochemistry applied to the analysis of wine: A mini-review. Electrochem. Commun. 2016, 67, 39–42. [Google Scholar] [CrossRef]
  6. Arribas, A.S.; Martinez-Fernandez, M.; Chicharro, M. The role of electroanalytical techniques in analysis of polyphenols in wine. Trends Anal. Chem. 2012, 34, 78–96. [Google Scholar] [CrossRef]
  7. Makhotkina, O.; Kilmartin, P.A. The use of cyclic voltammetry for wine analysis: Determination of polyphenols and free sulfur dioxide. Anal. Chim. Acta 2010, 668, 155–165. [Google Scholar] [CrossRef]
  8. Janeiro, P.; Oliveira Brett, A.M. Redox behavior of anthocyanins present in Vitis vinifera L. Electroanalysis 2007, 19, 1779–1786. [Google Scholar] [CrossRef] [Green Version]
  9. Ziyatdinova, G.; Kozlova, E.; Budnikov, H. Chronocoulometry of wine on multi-walled carbon nanotube modified electrode: Antioxidant capacity assay. Food Chem. 2016, 196, 405–410. [Google Scholar] [CrossRef]
  10. Chattopadhyay, S.; Sarkar, P.; Chudhury, U.R. Estimation of tea polyphenols by differential pulse voltammetry with electrodes modified by tyrosinase extracted from crude sources. J. Electrochem. Soc. 2015, 162, B101–B108. [Google Scholar] [CrossRef]
  11. Kilmartin, P.A.; Zou, H. The effect of electrode material on themeasured redox potential of red and white wines. Electroanalysis 2001, 13, 1347–1350. [Google Scholar] [CrossRef]
  12. Dhroso, A.; Laschi, S.; Marrazza, G.; Mascini, M. A fast electrochemical technique for characterization of phenolic content in wine. Anal. Lett. 2010, 43, 1190–1198. [Google Scholar] [CrossRef]
  13. Šeruga, M.; Novak, I.; Jakobek, L. Determination of polyphenols content and antioxidant activity of some red wines by differential pulse voltammetry, HPLC and spectrophotometric methods. Food Chem. 2011, 124, 1208–1216. [Google Scholar] [CrossRef]
  14. Photinon, K.; Chalermchart, Y.; Khanongnuch, C.; Wang, S.-H.; Liu, C.-C. A thick-film sensor as a novel device for determination of polyphenols and their antioxidant capacity in white wine. Sensors 2010, 10, 1670–1678. [Google Scholar] [CrossRef] [PubMed]
  15. Souza, L.P.; Calegari, F.; Francyelle, A.J.G.; Marcolino, L.H.; Bergamini, M.F. Determination of the antioxidant capacity in wine samples using a carbon nanotube modified electrode. J. Agric. Food Chem. 2011, 59, 7620–7625. [Google Scholar] [CrossRef] [PubMed]
  16. Pigani, L.; Foca, G.; Ionescu, K.; Martina, V.; Ulrici, A.; Terzi, F.; Vignali, M.; Zanardi, C.; Seeber, R. Amperometric sensors based on poly(3,4-ethylenedioxythiophene)-modified electrodes: Discrimination of white wines. Anal. Chim. Acta 2008, 614, 213–222. [Google Scholar] [CrossRef]
  17. Türke, A.; Fischer, W.-J.; Beaumont, N.; Kilmartin, P.A. Electrochemistry of sulfur dioxide, polyphenols and ascorbic acid at poly(3,4-ethylenedioxythiophene) modified electrodes. Electrochim. Acta 2012, 60, 184–192. [Google Scholar] [CrossRef]
  18. Bianchini, C.; Curulli, A.; Pasquali, M.; Zane, D. Determination of caffeic acid in wine using PEDOT film modified electrode. Food Chem. 2014, 156, 81–86. [Google Scholar] [CrossRef]
  19. Kokulnathan, T.; Raja, N.; Chen, S.-M.; Liao, W.-C. Nanomolar electrochemical detection of caffeic acid in fortified wine samples based on gold/palladium nanoparticles decorated graphene flakes. J. Colloid Interface Sci. 2017, 501, 77–85. [Google Scholar] [CrossRef]
  20. Sakthivel, M.; Ramaraj, S.; Chen, S.-M.; Dinesh, B.; Ramasamy, H.V.; Lee, Y.S. Entrapment of bimetallic CoFeSe2 nanosphere on functionalized carbon nanofiber for selective and sensitive electrochemical detection of caffeic acid in wine samples. Anal. Chim. Acta 2018, 1006, 22–32. [Google Scholar] [CrossRef]
  21. Lupu, S.; Lakard, B.; Hihn, J.Y.; Dejeu, J. Novel in situ electrochemical deposition of platinum nanoparticles by sinusoidal voltages on conducting polymer films. Synth. Met. 2012, 162, 193–198. [Google Scholar] [CrossRef] [Green Version]
  22. Lupu, S.; del Campo, F.J.; Muñoz, F.X. Sinusoidal voltage electrodeposition and characterization of conducting polymers on gold microelectrode arrays. J. Electroanal. Chem. 2012, 687, 71–78. [Google Scholar] [CrossRef]
  23. Lupu, S.; Lete, C.; Balaure, P.C.; Caval, D.I.; Mihailciuc, C.; Lakard, B.; Hihn, J.-Y.; del Campo, F.J. Development of amperometric biosensors based on nanostructured tyrosinase-conducting polymer composite electrodes. Sensors 2013, 13, 6759–6774. [Google Scholar] [CrossRef] [PubMed] [Green Version]
  24. Lupu, S.; Lete, C.; Balaure, P.C.; del Campo, F.J.; Muñoz, X.F.; Lakard, B.; Hihn, J.-Y. In situ electrodeposition of biocomposite materials by sinusoidal voltages on microelectrodes array for tyrosinase based amperometric biosensor development. Sens. Actuators B Chem. 2013, 181, 136–143. [Google Scholar] [CrossRef]
  25. Lete, C.; Lupu, S.; Lakard, B.; Hihn, J.-Y.; del Campo, F.J. Multi-analyte determination of dopamine and catechol at single-walled carbon nanotubes—Conducting polymer—Tyrosinase based electrochemical biosensors. J. Electroanal. Chem. 2015, 744, 53–61. [Google Scholar] [CrossRef]
  26. Lupu, S.; Lete, C.; del Campo, F.J. Dopamine electroanalysis using electrochemical biosensors prepared by a sinusoidal voltages method. Electroanalysis 2015, 27, 1649–1659. [Google Scholar] [CrossRef]
  27. Lete, C.; Lakard, B.; Hihn, J.-Y.; del Campo, F.J.; Lupu, S. Use of sinusoidal voltages with fixed frequency in the preparation of tyrosinase based electrochemical biosensors for dopamine electroanalysis. Sens. Actuators B Chem. 2017, 240, 801–809. [Google Scholar] [CrossRef]
  28. Lete, C.; Marin, M.; Anghel, E.M.; Preda, L.; Matei, C.; Lupu, S. Sinusoidal voltage electrodeposition of PEDOT-Prussian blue nanoparticles composite and its application to amperometric sensing of H2O2 in human blood. Mater. Sci. Eng. C 2019, 102, 661–669. [Google Scholar] [CrossRef]
  29. Turkevich, J.; Stevenson, P.C.; Hillier, J. A Study of the nucleation and growth processes in the synthesis of colloidal gold. Discuss. Faraday Soc. 1951, 11, 55–75. [Google Scholar] [CrossRef]
  30. Inzelt, G. Electrochemical quartz crystal nanobalance. In Electroanalytical Methods, 2nd ed.; Scholz, F., Ed.; Springer: Berlin, Germany, 2010; Volume 10, pp. 257–270. [Google Scholar]
  31. Terzi, F.; Zanfrognini, B.; Zanardi, C.; Pigani, L.; Seeber, R. Poly(3,4-ethylenedioxythiophene)/Au-nanoparticles composite as electrode coating suitable for electrocatalytic oxidation. Electrochim. Acta 2011, 56, 3575–3579. [Google Scholar] [CrossRef]
  32. Giacomelli, C.; Ckless, K.; Galato, D.; Miranda, F.S.; Spinelli, A. Electrochemistry of caffeic acid aqueous solutions with pH 2.0 to 8.5. J. Braz. Chem. Soc. 2002, 13, 332–338. [Google Scholar] [CrossRef] [Green Version]
  33. Martín, M.G.; Rodríguez-Méndez, M.L.; de Saja, J.A. Films of lutetium bisphthalocyanine nanowires as electrochemical sensors. Langmuir 2010, 26, 19217–19224. [Google Scholar] [CrossRef] [PubMed]
  34. Tyszczuk, K.; Skalska-Kamińska, A.; Woźniak, A. Voltammetric method using a lead film electrode for the determination of caffeic acid in a plant material. Food Chem. 2011, 125, 1498–1503. [Google Scholar] [CrossRef]
  35. Liu, Z.; Xu, J.; Yue, R.; Yang, T.; Gao, L. Facile one-pot synthesis of Au-PEDOT/rGO nanocomposite for highly sensitive detection of caffeic acid in red wine sample. Electrochim. Acta 2016, 196, 1–12. [Google Scholar] [CrossRef]
  36. Zhang, Y.; Liu, Y.; He, J.; Pang, P.; Gao, Y.; Hu, Q. Electrochemical behavior of caffeic acid assayed with gold nanoparticles/graphene nanosheets modified glassy carbon electrode. Electroanalysis 2013, 25, 1230–1236. [Google Scholar] [CrossRef]
  37. Kahle, K.; Kraus, M.; Richling, E. Polyphenol profiles of apple juices. Mol. Nutr. Food Res. 2005, 49, 797–806. [Google Scholar] [CrossRef]
  38. Vrhovsek, U.; Rigo, A.; Tonon, D.; Mattivi, F. Quantitation of polyphenols in different apple varieties. J. Agric. Food Chem. 2004, 52, 6532–6538. [Google Scholar] [CrossRef]
  39. Hyson, D. A comprehensive review of apples and apple components and their relationship to human health. Adv. Nutr. 2011, 2, 408–420. [Google Scholar] [CrossRef]
Figure 1. (a) Crystal resonator frequency change recorded during the sinusoidal voltage (SV) electrodeposition of poly(3,4-ethylenedioxythiophene) (PEDOT) layers onto gold-quartz crystal microbalance (Au-QCM) electrode from aqueous solution containing 10 mM 3,4-ethylenedioxythiophene and 0.1 M phosphate buffer of pH 7. Experimental parameters: Edc = +0.60 V; sin wave tension with frequency of 50 mHz, amplitudes Esin of 0.25 and 0.35 V, respectively; tdep = 600 s; (b) The SV tension applied during the electrodeposition of PEDOT onto Au-QCM electrode surface. Experimental parameters: Edc = +0.60 V, f = 50 mHz, Esin = 0.25 V (rms). (c) The current response recorded during the application of the SV tension with f = 50 mHz, Esin = 0.25 V (rms). (d) The integrated current response, the electrical charge, for the applied SV tension with f = 50 mHz, Esin = 0.25 V (rms).
Chemosensors 07 00065 g001
Figure 2. (a) Sinusoidal voltage (SV) electrodeposition of gold-nanoparticles (AuNPs) onto glassy carbon/poly(3,4-ethylenedioxythiophene) (GC/PEDOT) modified electrode from aqueous solution containing 5 mM NaAuCl4 and 0.5 M H2SO4. Experimental parameters: top panel, applied SV signal with Edc = +0.7 V; Esin = 0.20 V, f = 50 mHz; tdep = 100 s; bottom panel, the current response of the system; (b) The cyclic voltammograms registered in 0.5 M H2SO4 aqueous solution at GC/PEDOT-AuNPs-SV modified electrodes obtained by electrodeposition of AuNPs using the SV procedure for deposition times of 100, and 300 s, respectively. Potential scan rate: 50 mV s−1; (c) The electrodeposition of AuNPs onto GC/PEDOT electrode by cyclic voltammetry from an aqueous solution containing 5 mM NaAuCl4 and 0.5 M H2SO4. Potential scan rate: 70 mV s−1; Potential scans: 2; (d) Cyclic voltammogram recorded at GC/PEDOT-AuNPs electrode in aqueous solution containing 0.5 M H2SO4. AuNPs were electrodeposited by cyclic voltammetry method as described in part (c) of this figure. Potential scan rate: 100 mV s−1.
Chemosensors 07 00065 g002
Figure 3. SEM images of AuNPs electrodeposited by (a) sinusoidal voltage, (b) potentiostatic, and (c) drop casting methods onto glassy carbon/poly(3,4-ethylenedioxytiophene) (GC/PEDOT) electrodes.
Chemosensors 07 00065 g003
Figure 4. Influence of pH on caffeic acid (CA) oxidation: (a) The cyclic voltammograms registered at the glassy carbon electrode/poly(3,4-ethylenedioxythiophene)-gold nanoparticles-sinusoidal voltage (GC/PEDOT-AuNPs-SV) sensor in aqueous solutions with various pH values containing 0.5 mM CA. Potential scan rate: 50 mV s−1; (b) The dependence of the CA oxidation anodic peak potential on pH.
Chemosensors 07 00065 g004
Figure 5. (a) The cyclic voltammograms recorded at the glassy carbon electrode/poly(3,4-ethylenedioxythiophene)-gold nanoparticles-sinusoidal voltage (GC/PEDOT-AuNPs-SV) sensor in 0.1 M phosphate buffer solution (PBS) of pH 7 containing various CA concentrations ranging from 10 to 1000 µM. Potential scan rate: 50 mV s−1; (b) The calibration plot for the GC/PEDOT-AuNPs-SV sensor.
Chemosensors 07 00065 g005
Figure 6. (a) Cyclic voltammograms recorded at glassy carbon electrode/poly(3,4-ethylenedioxythiophene)-gold nanoparticles-sinusoidal voltage (GC/PEDOT-AuNPs-SV) sensor for the analysis of a peach juice sample by standard addition method. Potential scan rate: 50 mV s−1; (b) The corresponding calibration plot.
Chemosensors 07 00065 g006
Table 1. Comparison of the analytical performances of various sensors for caffeic acid.
ElectrodeLinear Response Range (M)LOD (M)Ref.
Lutetium bisphthalocyanine nanowires6 × 10−5 to 5 × 10−43.12 × 10−5[33]
Lead film electrode1 × 10−8 to 5 × 10−74 × 10−9[34]
Gold-poly(3,4-ethylenedioxythiophene/ reduced graphene oxide (Au–PEDOT/rGO)1 × 10−8 – 4.6 × 10−74 × 10−9[35]
glassy carbon electrode modified with gold nanoparticles and graphene nanosheet (GCE/AuNP-GN)5 × 10−7 to 5 × 10−55 × 10−8[36]
glassy carbon electrode/poly(3,4-ethylenedioxythiophene)-gold nanoparticles-sinusoidal voltage (GC/PEDOT-AuNPs-SV)1 × 10−5 to 1 × 10−34.24× 10−6This work

