Calcium Ethoxide as Consolidant for Porous Limestones: Influence of the Solvent
by
 ,
,
Martina Zuena
1,2,*, 
Elisabetta Zendri
2, 
Dória Costa
3,
José Delgado-Rodrigues
3,
Naida El Habra
4 and 
Patrizia Tomasin
4 1
Department of Molecular Science and Nanosystem, Ca’ Foscari University of Venice, 30170 Venezia Mestre, Italy
2
Department of Environmental Sciences, Informatics and Statistics, Ca’ Foscari University of Venice, Via Torino 155, 30170 Venezia Mestre, Italy
3
National Laboratory of Civil Engineering, Avenida do Brasil, 101, 1700-066 Lisbon, Portugal
4
CNR-ICMATE, Institute of Condensed Matter Chemistry and Technologies for Energy, Corso Stati Uniti 4, 35127 Padova, Italy
*
Author to whom correspondence should be addressed.
Coatings 2019, 9(2), 83; https://doi.org/10.3390/coatings9020083
Submission received: 29 November 2018
/
Revised: 16 January 2019
/
Accepted: 28 January 2019
/
Published: 30 January 2019
(This article belongs to the Collection Surface and Interface Science and Engineering for the Society of the Future)
Abstract
:Calcium ethoxide nanosuspension, a consolidating product developed during the European Nanomatch project, is here modified by adding two different solvents, 2-butanol and n-butylacetate, chosen for their different boiling points with respect to ethanol, the solvent employed in a previous work to dilute the original product. Fourier transform infrared spectroscopy (µFT-IR) was used to understand how the presence of these new solvents can influence the kinetics of the carbonation process and the pathway reaction. Furthermore, coatings derived from nanosuspensions were maintained for specific time intervals at controlled relative humidity conditions (RH = 50% and RH = 90%); the formed mineralogical phases were characterized by µFT-IR and X-ray diffraction (XRD). Results indicate that the used solvents can influence the kinetic and reaction pathways, while the phases formed at the end of the carbonation process are influenced by both solvents and RH conditions. The effectiveness of calcium ethoxide based product diluted in 2-butanol and n-butylacetate as limestone consolidants was evaluated with drilling resistance measurement system (DRMS) and ultrasound pulse velocity (UPV). The impact on color coordinates was also assessed. The results were compared with those obtained with the same product diluted in ethanol and a commercial nanolime. The use of these solvents gave different and better results in terms of efficacy.
Keywords:
limestone; calcium ethoxide; 2-butanol; n-butylacetate; consolidant; compatibility; efficacy; DRMS; UPV1. Introduction
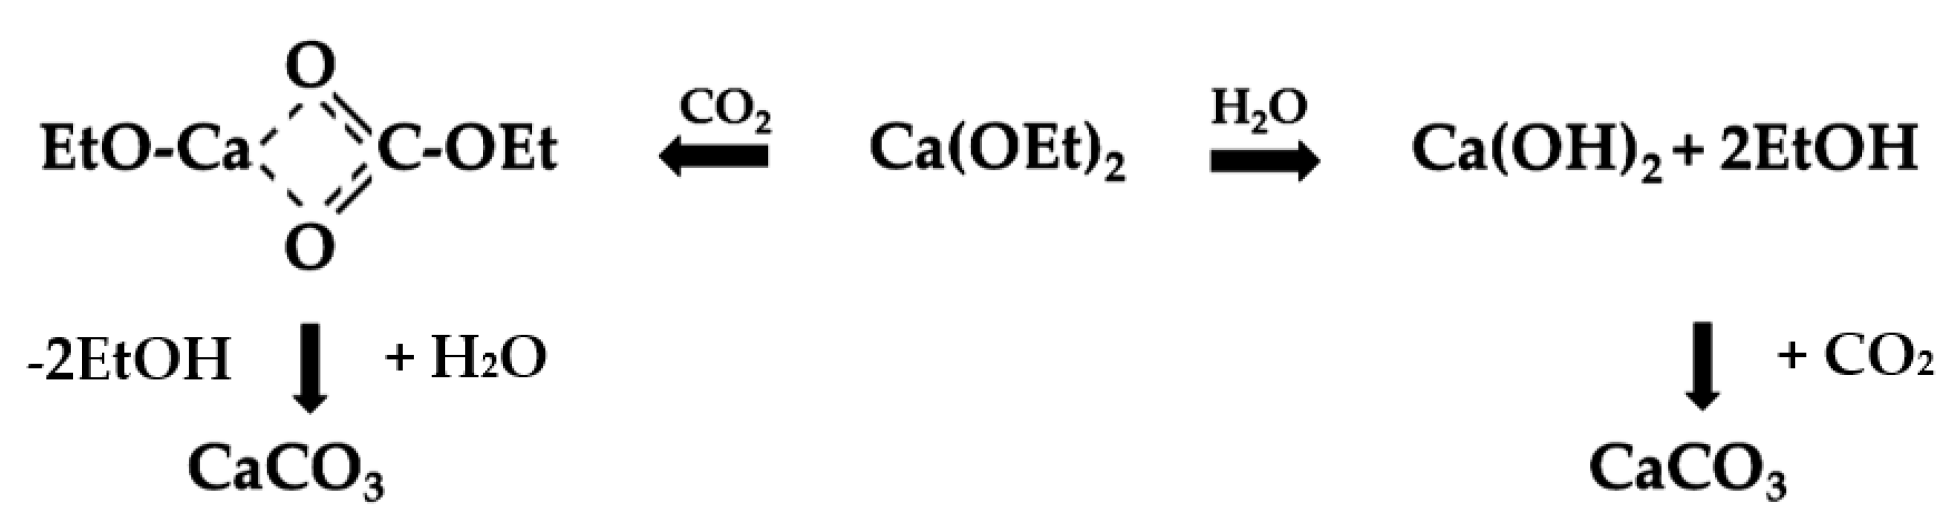
Consolidation of limestone is an important topic in the field of Cultural Heritage. The deterioration processes that affect these types of stones are well studied and the results have promoted the research of different consolidation agents. During the years, several organic and inorganic products have been developed to answer to different needs of consolidation in terms of type of material and surrounding environment. Organic treatments, such as polymers, have been traditionally used; however, even if they have a good penetration capacity, they show an insufficient compatibility with the substrates and significant changes due to environmental conditions which compromise their long lasting performance and efficacy [1,2,3]. Inorganic treatments are more compatible with stone materials but, in some cases, their solubility leads to a low amount of applied product and a scarce penetration depth, and consequently an unsatisfactory strengthening effect [4,5]. With the aim to develop more compatible, efficient, and stable consolidation treatments, during the European collaborative project NANOMATCH (Nano-systems for the conservation of immoveable and moveable polymaterial Cultural Heritage in a changing environment) different calcium alkoxides, including calcium ethoxide Ca(OEt)2, were synthesized and applied as consolidating agents for carbonate supports [6,7,8]. These products are considered a promising alternative to traditional treatments for the consolidation of limestone, since they meet one of the key requirements in the field of conservation of Cultural Heritage, such as the chemical affinity with the support. Actually, calcium alkoxides dissolved in a correct organic solvent penetrate the porous substrate and form calcium carbonate inside the pores through a carbonation process. This process involves the reaction with carbon dioxide and water molecules and can follow two different ways [7,9,10,11]. The first pathway involves an insertion of carbon dioxide molecule inside the Ca-O bond of the ethoxide, formation of an alkyl carbonate as intermediate, hydrolysis and alcohol elimination. The second one involves the hydrolysis of the ethoxide with the formation of calcium hydroxide, which subsequently carbonates. Scheme 1 reports these possible reaction pathways for calcium ethoxide.
The study of the carbonation process of a calcium ethoxide nanosuspension, in terms of kinetics, reaction pathway, and evaluation of mineralogical phases formed at the end of this reaction, has been reported in a recent work [12]. Several works demonstrated that the carbonation process, the stability of the nanosuspension, the penetration into a support, and thus the consolidation effect of calcium-based products, are influenced by the carrier solvent [6,13,14]. Therefore, the present study aims at modifying the original calcium ethoxide nanosuspension by diluting it in two solvents, 2-butanol and n-butylacetate, which present different chemical characteristics namely their boiling points. Actually, a solvent with a lower volatility could lead to a better penetration of the product because of slower evaporation. The new obtained products were firstly characterized to understand if the presence of a different solvent may affect the kinetic and reaction pathway of the carbonation process and the mineralogical phases formed at the end of this reaction. Precisely, the carbonation process can lead to the formation of different polymorphs: two hydrated crystalline phases (monohydrocalcite, CaCO3∙H2O and ikaite, CaCO3 6H2O), three anhydrous crystalline polymorphs (vaterite, aragonite and calcite), and an amorphous phase (amorphous calcium carbonate, ACC) [15]. The obtained results were compared with those achieved by calcium ethoxide diluted in ethanol and a reference product, CaLoSil E50, already discussed in the previous work [12]. Furthermore, the performance—compatibility and efficacy—of these two products as consolidating agents was tested on three limestones by employing ultrasound pulse velocity, drilling resistance measurement system, and colorimetric measurements. These results were compared with those obtained with calcium ethoxide diluted in ethanol and the reference product, not reported in the previous work. This work revealed important information regarding the influence of environmental conditions and type of solvent on the carbonation process of calcium ethoxide and therefore, on its potential as consolidating treatment for carbonate supports.
2. Materials and Methods
Calcium ethoxide is produced by ABCR labs (Forcarei, Spain) as a nanosuspension in ethanol and tetrahydrofuran 1:3 (v/v) mixture. It presents an average particle dimension of 295 nm [12] and an initial calcium concentration of 46.5 g/L. The product was diluted in ethanol to reach a calcium concentration of 20 g/L, chosen in a previous study as a good compromise between compatibility and consolidation efficacy [6]. The study of kinetic and reaction pathway and end-formed crystalline phases of this product were reported in [12] and compared with a reference product currently on the market, CaLoSil E50. This product is a nanosuspension of Ca(OH)2 nanoparticles (50–250 nm) in ethanol, manufactured by IBZ-Salzchemie (Freiberg, Germany) [16]. Since the initial calcium concentration of this nanosuspension was 27.05 g/L, the product was diluted in ethanol to reach a calcium concentration of 20 g/L.
In the current work, the original nanosuspension of calcium ethoxide was diluted in 2-butanol and n-butylacetate to reach a calcium concentration of 20 g/L. The obtained products are labelled as 2BU and NBU, respectively. The kinetic, the reaction pathway, and the crystalline phases formed at the end of the carbonation process of these products were compared with those obtained with calcium ethoxide diluted in ethanol, labelled as ETA and CaLoSil E50, labelled as CAL, already reported in [12]. Instead, results regarding the compatibility and efficacy of all products as consolidating agents are discussed in the current work. Several properties of the employed solvents are reported in Table S1 in Supplementary Materials.
Fourier transform infrared spectroscopy (µFT-IR) analysis was used to evaluate the kinetic and reaction pathway, by analyzing a small drop of the solution put on a glass slide, from the beginning of the analysis until two weeks later. This analysis was performed continuously in the first 30 min and at specific time intervals till two weeks later. This analysis was carried out at laboratory temperature and humidity conditions. Furthermore, products’ coating on glass slide kept in desiccators at different relative humidity (RH; 50% and 90%) and controlled temperature (20–22 °C), were analyzed to evaluate the mineralogical phases formed after two weeks, one month and three months. µFT-IR spectra, recorded in reflectance mode in the 4000–650 cm−1 range, with a resolution of 4 cm−1, were collected by a Nicolet microscope connected to a Nicolet 560 FT-IR (Thermofisher scientific, Waltham, MA, USA) system. The obtained spectra are shown in transmittance mode and baseline corrected. To create the RH condition, a saturated solution of a specific salt (calcium nitrate for 50% RH and potassium nitrate for 90% RH [17]) was left in the desiccators. The CO2 inside the desiccators was left to balance with CO2 of the atmosphere before closing it. A relative humidity sensor (Oregon Scientific™ Wireless Weather Station BAR388HG, Portland, OR, USA) was used to monitor the RH conditions.
X-ray diffraction (XRD) was employed to supplement µFT-IR analysis regarding the mineralogical phases identification of the product’s coating maintained at different RH% for two weeks, one month and three months. XRD measurements were performed with a Philips PW3020 powder diffractometer (Nederlandse Philips Bedrijven B.V., Eindhoven, The Netherlands) operating at 40 kV and 30 mA. All spectra were collected in the 10°–70° 2θ range and with a step size of 0.02°. Phase identification was performed with the support of the 2002 ICDD database.
Three limestones with different type and porosity values, previously subjected to an ageing process involving thermal cycles [18], were selected to test the effectiveness of all products as consolidating agents.
Open porosity of samples was determined after the ageing process by evaluating porosity accessible to water. Samples were firstly dried in the oven at 60 ± 5 °C till a constant weight was reached, put under vacuum conditions (for 24 h), immersed (for 24 h), and then immersed again while maintained at atmospheric pressure (for 24 h) [19].
Lecce stone with a final open porosity of 27% is a porous limestone with a golden honey hue. It is extracted near the city of Lecce and is composed primarily of calcium carbonate which binds together minerals such as phosphates, feldspars, quartz and microfossils of marine organisms [20]. Noto stone is a calcarenite with a pale cream color from the south-eastern part of Sicily [21] with a 32% final open porosity. Vicenza stone is a limestone with a heterogeneous structure composed of calcium carbonate and fragments of echinoderms, bryozoans, foraminifera and a small percentage of quartz grain [22]. This stone presents a final open porosity of 29%.
Two application procedures of the products were adopted: by brushing till saturation (AP1) and absorption by capillarity (AP2). For the first type of procedure, the application was stopped when the surface remains wet for 1 min. For the second application procedure, samples were placed on glass rods in contact with the consolidating products and were left to absorb the products by capillarity for 90 min. Previous tests where the samples were left in contact with the consolidation treatments were performed: the time interval which avoided the carbonation and precipitation in solution of the products was 90 min. To avoid the formation of superficial deposits, the surfaces left in contact with the product were cleaned immediately after the end of the application with the same solvent used to prepare the consolidating product.
For all the application procedures and treatments, the amount of dry matter retained (kg/m2) was calculated by weighing the samples before and one month after the treatment in dry conditions. For application AP1, two samples for each solvent were analyzed and therefore, the results are reported as a range of two values.
Drilling resistance measurement system (DRMS) and ultrasound pulse velocity (UPV) were adopted to study the penetration of products and the consolidation effect. Colorimetric measurements were performed to understand their visual impact, by evaluating the possible changes of the surface color coordinates. A high color change of the surface with a ΔE* > 5 is considered aesthetically incompatible for a consolidating treatment [23]. For these tests, samples of 5 × 5 × 5 cm3 were used.
A DRMS by Sint Technology s.r.l (Calenzano, Italy) was used. Data from treated and untreated stones were acquired from the same mock-ups, on opposite surfaces (untreated and treated ones). The operating conditions were kept constant during the analysis: penetration rate of 10 mm/min, target penetration depth of 10–15 mm in accordance with the type of limestone and advancing rotational speed of 300 rpm.
The UPV profile was obtained by measuring the velocities by the direct transmission method using a pulse generator (G. Steinkamp BP-7, Laboratory for Applied Physics, Bremen, Germany) coupled to exponential transducers. UPV measurements were performed in profile, from the treated face to the opposite one, using a step size of 5 mm. Results are expressed as the average of three measurements performed on each point. The profiles were determined on the same sample before and after treatment.
Colorimetric data were taken by using an x-Rite spectrophotometer, model SP 68 (X-Rite Incorporated, Grand Rapids, MI, USA). This instrument has a xenon lamp and the measurement area is 3.14 cm2. It was set to measure the reflectance with the specular component included. Data were acquired in accordance with the NORMAL 43/93 [24] and the CIEL* a* b* space. The visual impact of the treatments was evaluated by using total color difference ΔE*.
3. Results and Discussion
3.1. Study of Carbonation Process
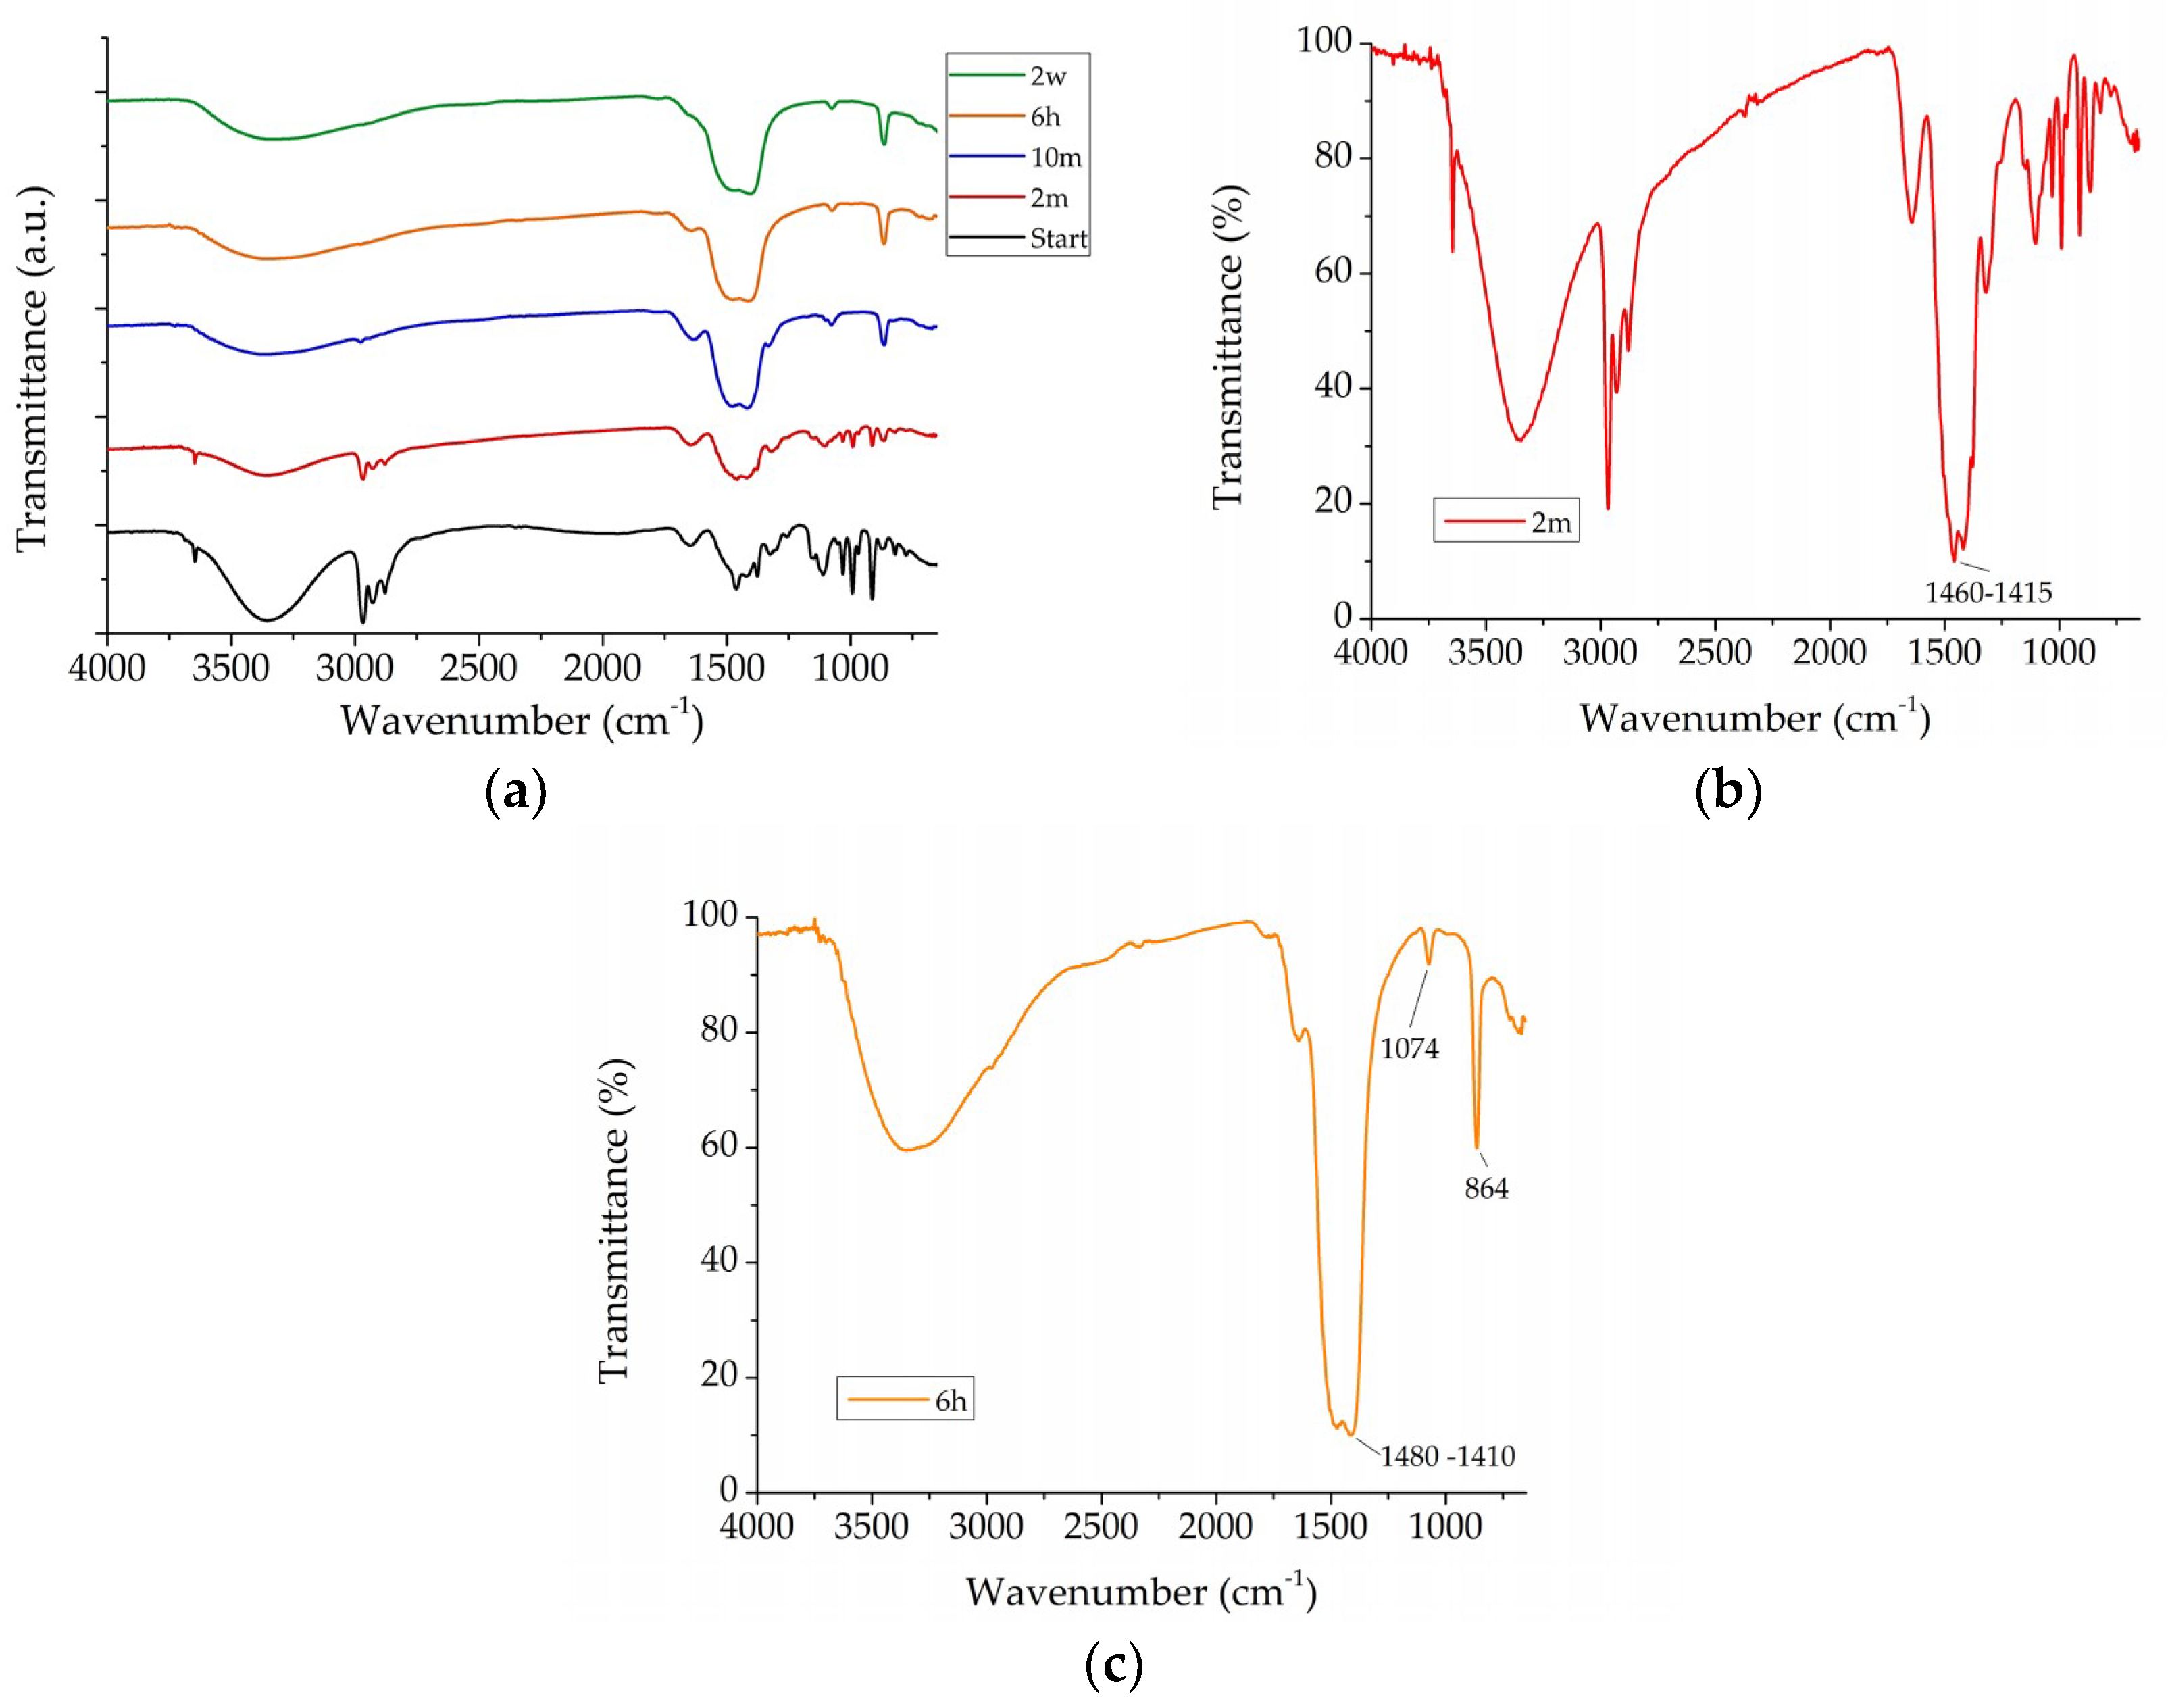
The entire progress of the kinetic of carbonation process for 2BU is reported in Figure 1a. The formation of calcium carbonate starts after two minutes as shown by the presence of absorption peaks in the region between 1460 and 1415 cm−1 (asymmetric stretching mode υ3 of carbonate ion), (Figure 1b) [15,25]. Furthermore, also a peak at 3645 cm−1 related to O–H stretching [26], [10] is present at the beginning of the reaction (Figure 1b). After six hours, the peak related to O–H stretching is no longer present and only peaks related to calcium carbonate are evident: 1480–1410, 1074 (symmetric stretching mode υ1 of carbonate ion) and 864 cm−1 (out of plane bending mode υ2 of carbonate ion) (Figure 1c) [27]. After two weeks, only amorphous calcium carbonate (ACC) is present with the characteristic absorption peak at 864 cm−1 (green spectrum in Figure 1a) [28,29].
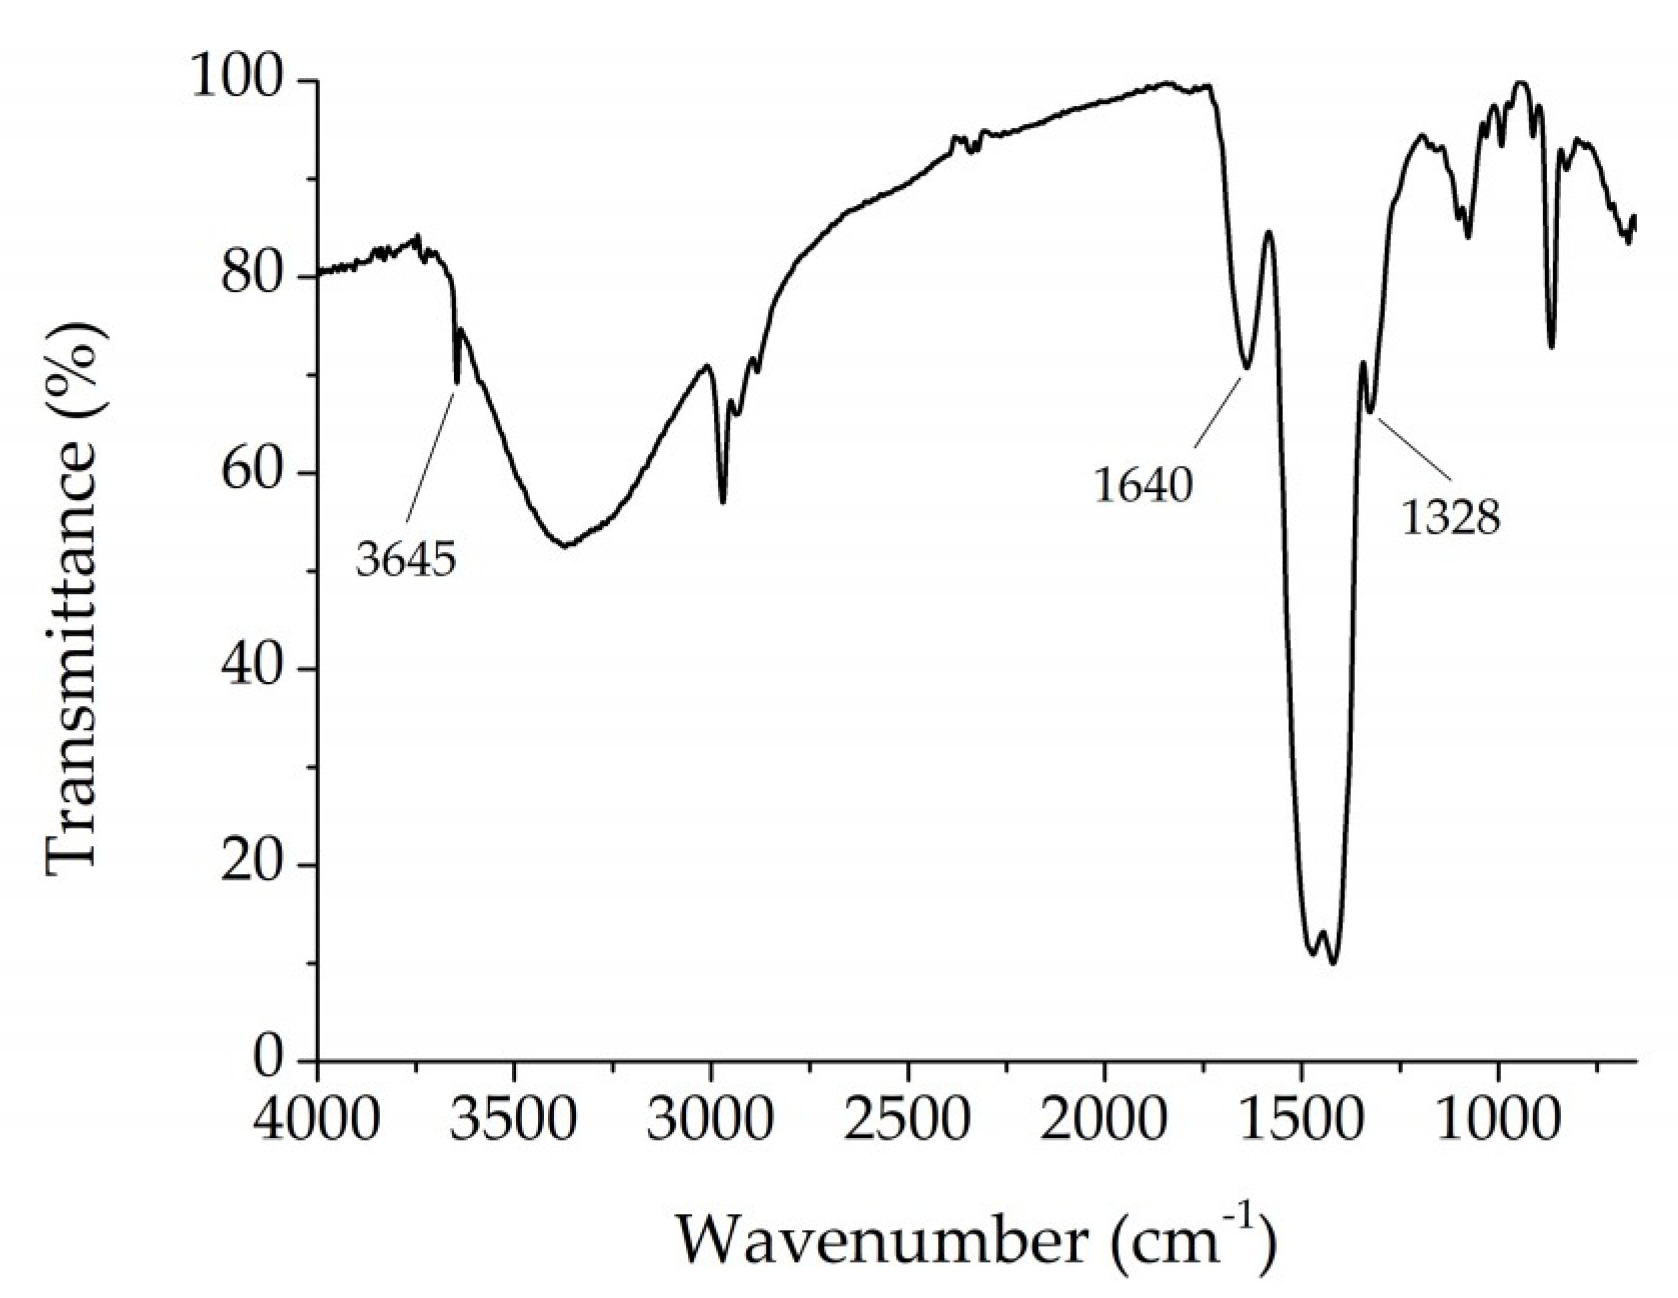
As observed for ETA [12], the followed reaction pathway involves the insertion of CO2 inside Ca–O bond as testified by the bands at 1640 and 1328 cm−1 which disappear in a few minutes, attributed to asymmetrical and symmetrical stretching of CH3CH2OCO2 groups, respectively (Figure 2) [11,30]. For both 2BU and ETA, a second reaction pathway occurs as shown by the peak at 3645 cm−1 associated with O–H stretching of portlandite, Ca(OH)2. This peak, looking at the orange spectrum in Figure 1c, disappears after six hours, while for ETA it is still presents after two weeks. This factor indicates a faster carbonation process of 2BU compared to ETA [12].
Therefore, the difference between ETA and 2BU is related to the duration of the carbonation process since it is still ongoing for ETA after two weeks, while it is complete for 2BU.
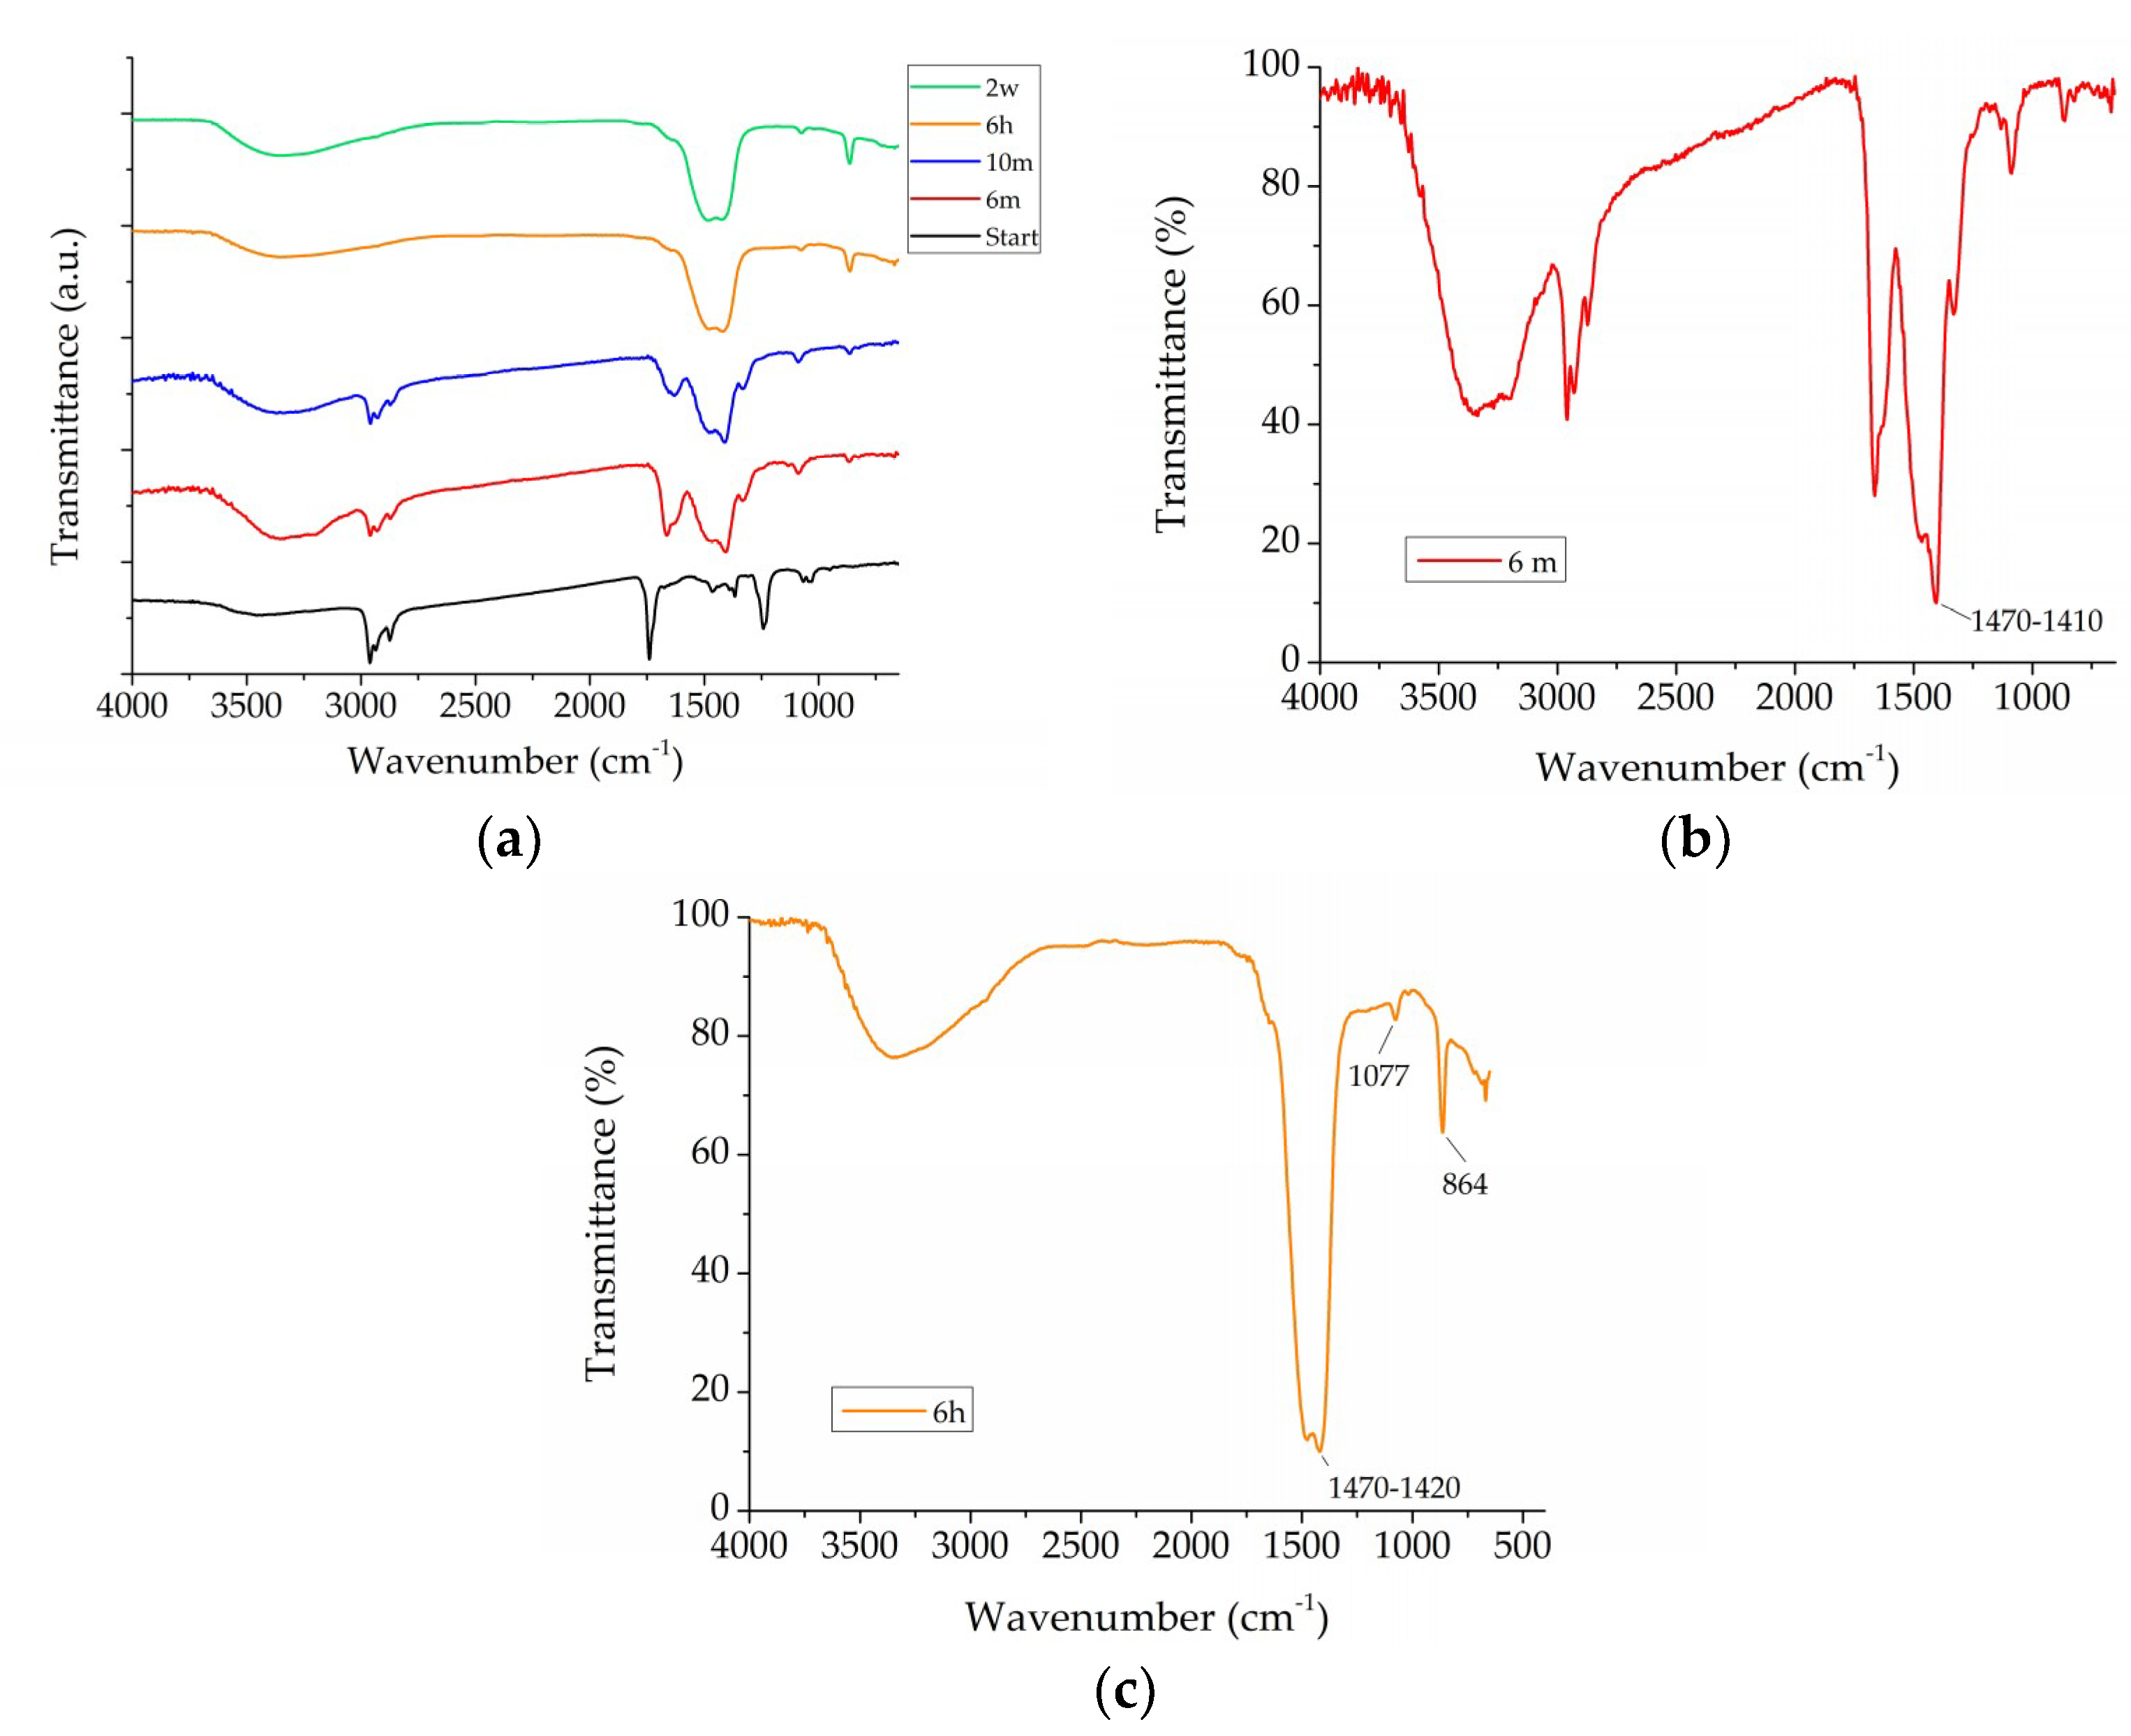
Figure 3a reports all the kinetic processes obtained with NBU. Differently from the alcohols (ethanol and 2-butanol), the presence of n-butylacetate delays the beginning of the carbonation process. Actually, a first broadband in the region between 1470 and 1410 cm−1 occurs only after six minutes from the beginning of the reaction (Figure 3b). This delay at the beginning of the carbonation process may be explained by the lower miscibility with water of n-butylacetate and the higher boiling point compared to the other used solvents.
After six hours (Figure 3c), peaks related to carbonate ion are clearly present: 1470–1420, 1077, 864 cm−1. Additionally, in this case, the final calcium carbonate is amorphous with the characteristic absorption peak at 864 cm−1 and the broadband between 2700 and 3600 cm−1 related to O–H stretching, corresponding to structural water within ACC.
In the case of NBU, only one reaction pathway occurs, shown by the presence of vibrational peaks at 1634 and 1328 cm−1. The lack of the peak at 3645 cm−1 related to the formation of portlandite clearly highlighted the difference of reaction pathway of the product diluted in alcohols (Figure 4).
Consequently, results regarding the kinetic pathway show how both alcohols—ethanol [12] and 2-butanol—lead to the formation of the first peaks related to calcium carbonate after two minutes, while the presence of n-butylacetate delays this process allowing the formation of characteristic calcium carbonate peaks after six minutes from the beginning of the reaction. All products lead to the formation of amorphous calcium carbonate. Furthermore, a difference between two alcohols regarding the kinetic of the carbonation process is evident. In fact, it ends after two weeks for 2BU, while it is not concluded for Ca(OEt)2 diluted in ethanol [12]. The study of the reaction pathway highlights how both carbonation pathways occur for the alcohols: (1) insertion of CO2 inside the Ca–O bond of Ca(OEt)2 and a consequent formation of ethyl carbonate derivative, which is then transformed in CaCO3 through hydrolysis and alcohol elimination, and (2) hydrolysis of Ca(OEt)2 to form Ca(OH)2, which finally carbonates. Instead, for calcium ethoxide diluted in n-butylacetate, only the first reaction pathway takes place. This difference, together with the delay in carbonation with respect to the alcohols, may be related to the type of solvent which presents a lower miscibility with water which controls the presence of OH groups available.
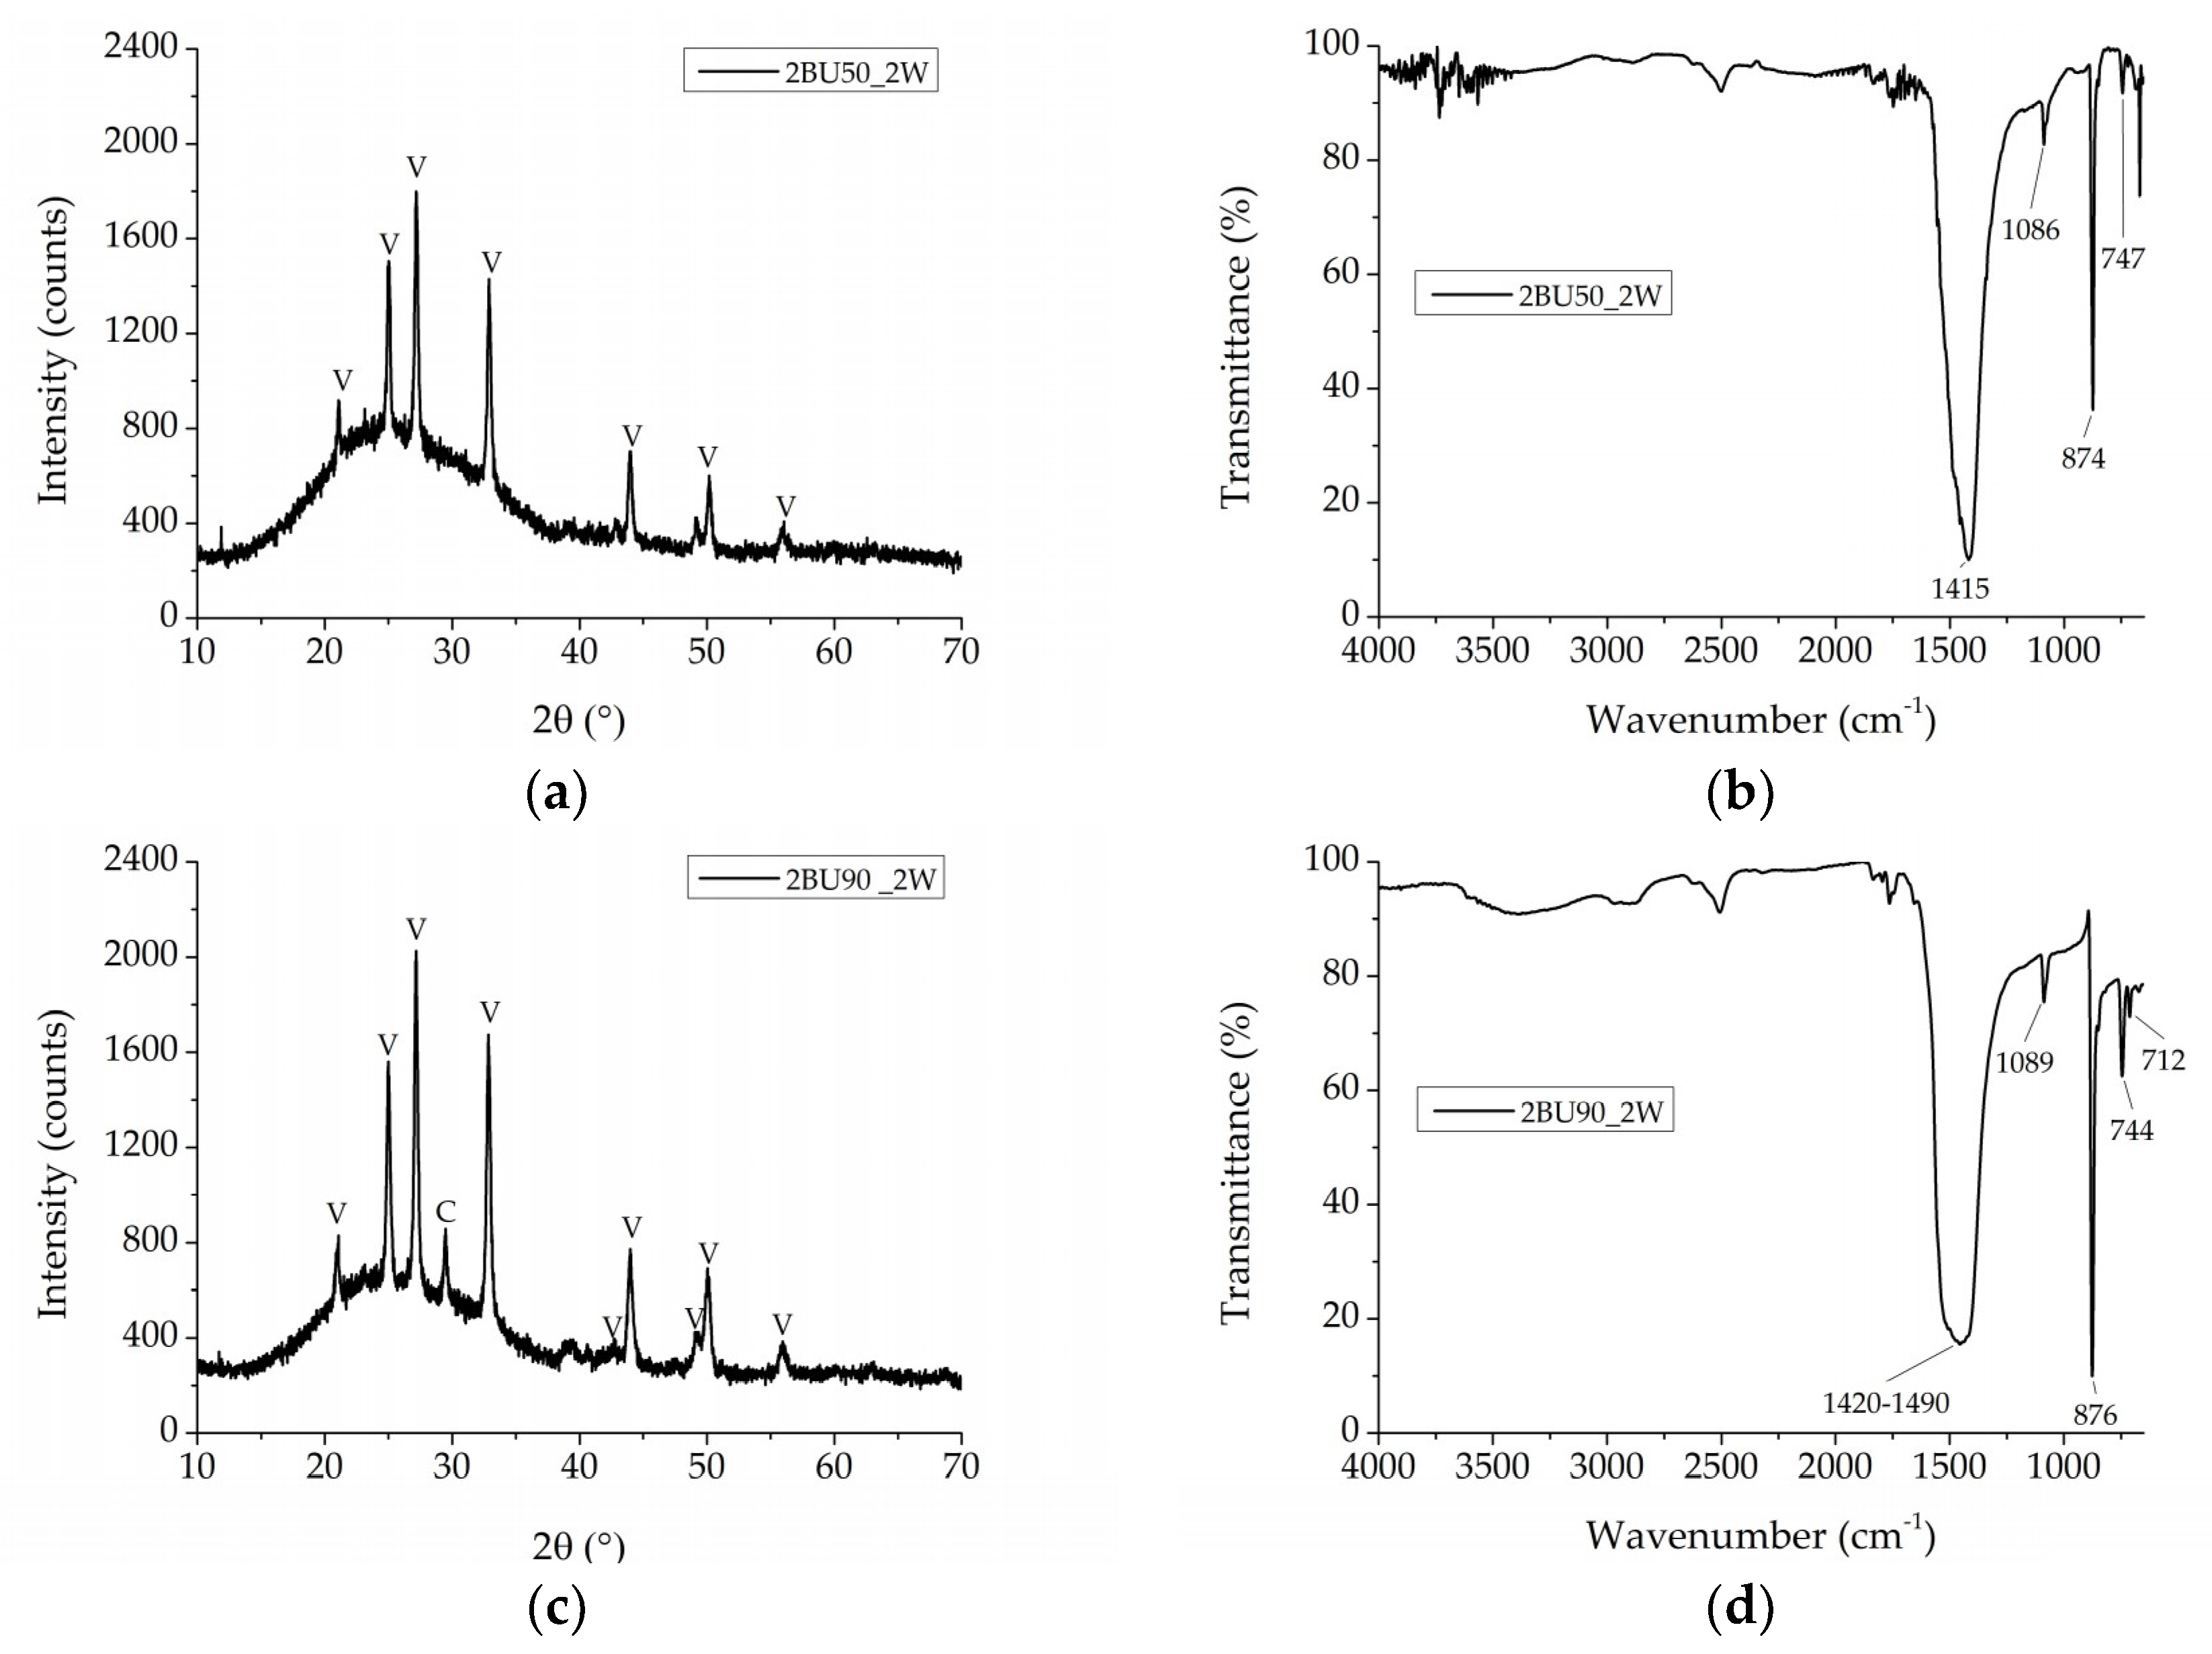
XRD and µFT-IR results regarding 2BU coating after two weeks exposed to 50% and 90% RH conditions, are illustrated in Figure 5. XRD shows that vaterite, with a hexagonal structure is the main phase for both 50% and 90% relative humidity conditions (main reflections at 2θ = 27.18° and 27.15°, respectively, ICDD 00-033-0268), as shown in Figure 5a,c.
µFT-IR measurements confirm these results showing the characteristic vibrational peaks of vaterite at 747 cm−1 at 50% RH (Figure 5b). The formation of calcite as a minor phase with rhombohedral structure and principal reflection at 2θ = 29.45° (ICDD 01-072-1214) is present only for 90% RH value condition (Figure 5c) as confirmed by µFT-IR results which show typical calcite peaks at 876 and 712 cm−1 exclusively at 90% RH (Figure 5d).
By comparing these results with ETA [12], also for 2BU the formation of calcite occurs at a higher value of RH%. Instead, differently from ETA after two weeks at 50% and 90%, in this case portlandite is not present confirming the kinetic results and showing that the carbonation process is already concluded after two weeks. However, as for Ca(OEt)2 diluted in ethanol, the final calcium carbonate phase is not amorphous, probably due to the constant RH condition maintained during all the tests [29].
XRD results obtained after one month and three months confirm that vaterite at 50% RH and both vaterite and calcite at a 90% RH are still present. The characteristic vibrational peaks acquired by µFT-IR at both relative humidity conditions are consistent with XRD results.
Concluding this analysis, differently from ETA [12], 2BU coating characterization shows that after two weeks the carbonation process ends, confirming the kinetic results. Peaks related to portlandite are not detected by XRD and µFT-IR for both RH% conditions at this stage. After one month and three months, ETA and 2BU show the same results, vaterite at 50% RH and vaterite and calcite at 90% RH. Additionally, in this case, vaterite is formed at both relative humidity conditions, while calcite is formed only at 90% RH, probably because the higher content of water allows the process of dissolution of vaterite and crystallization of calcite [31,32,33]. The prevalence of vaterite at 50% RH can be ascribed to the presence of alcohols which, as reported by Manoli et al. [34], influences the morphology of the vaterite precipitation crystals stabilizing this phase and preventing the transformation to the more thermodynamically stable calcite. Therefore, despite vaterite is the most thermodynamically unstable polymorph of calcium carbonate, in terms of crystallization it is kinetically the most favored polymorph in all relative humidity conditions [35,36,37].
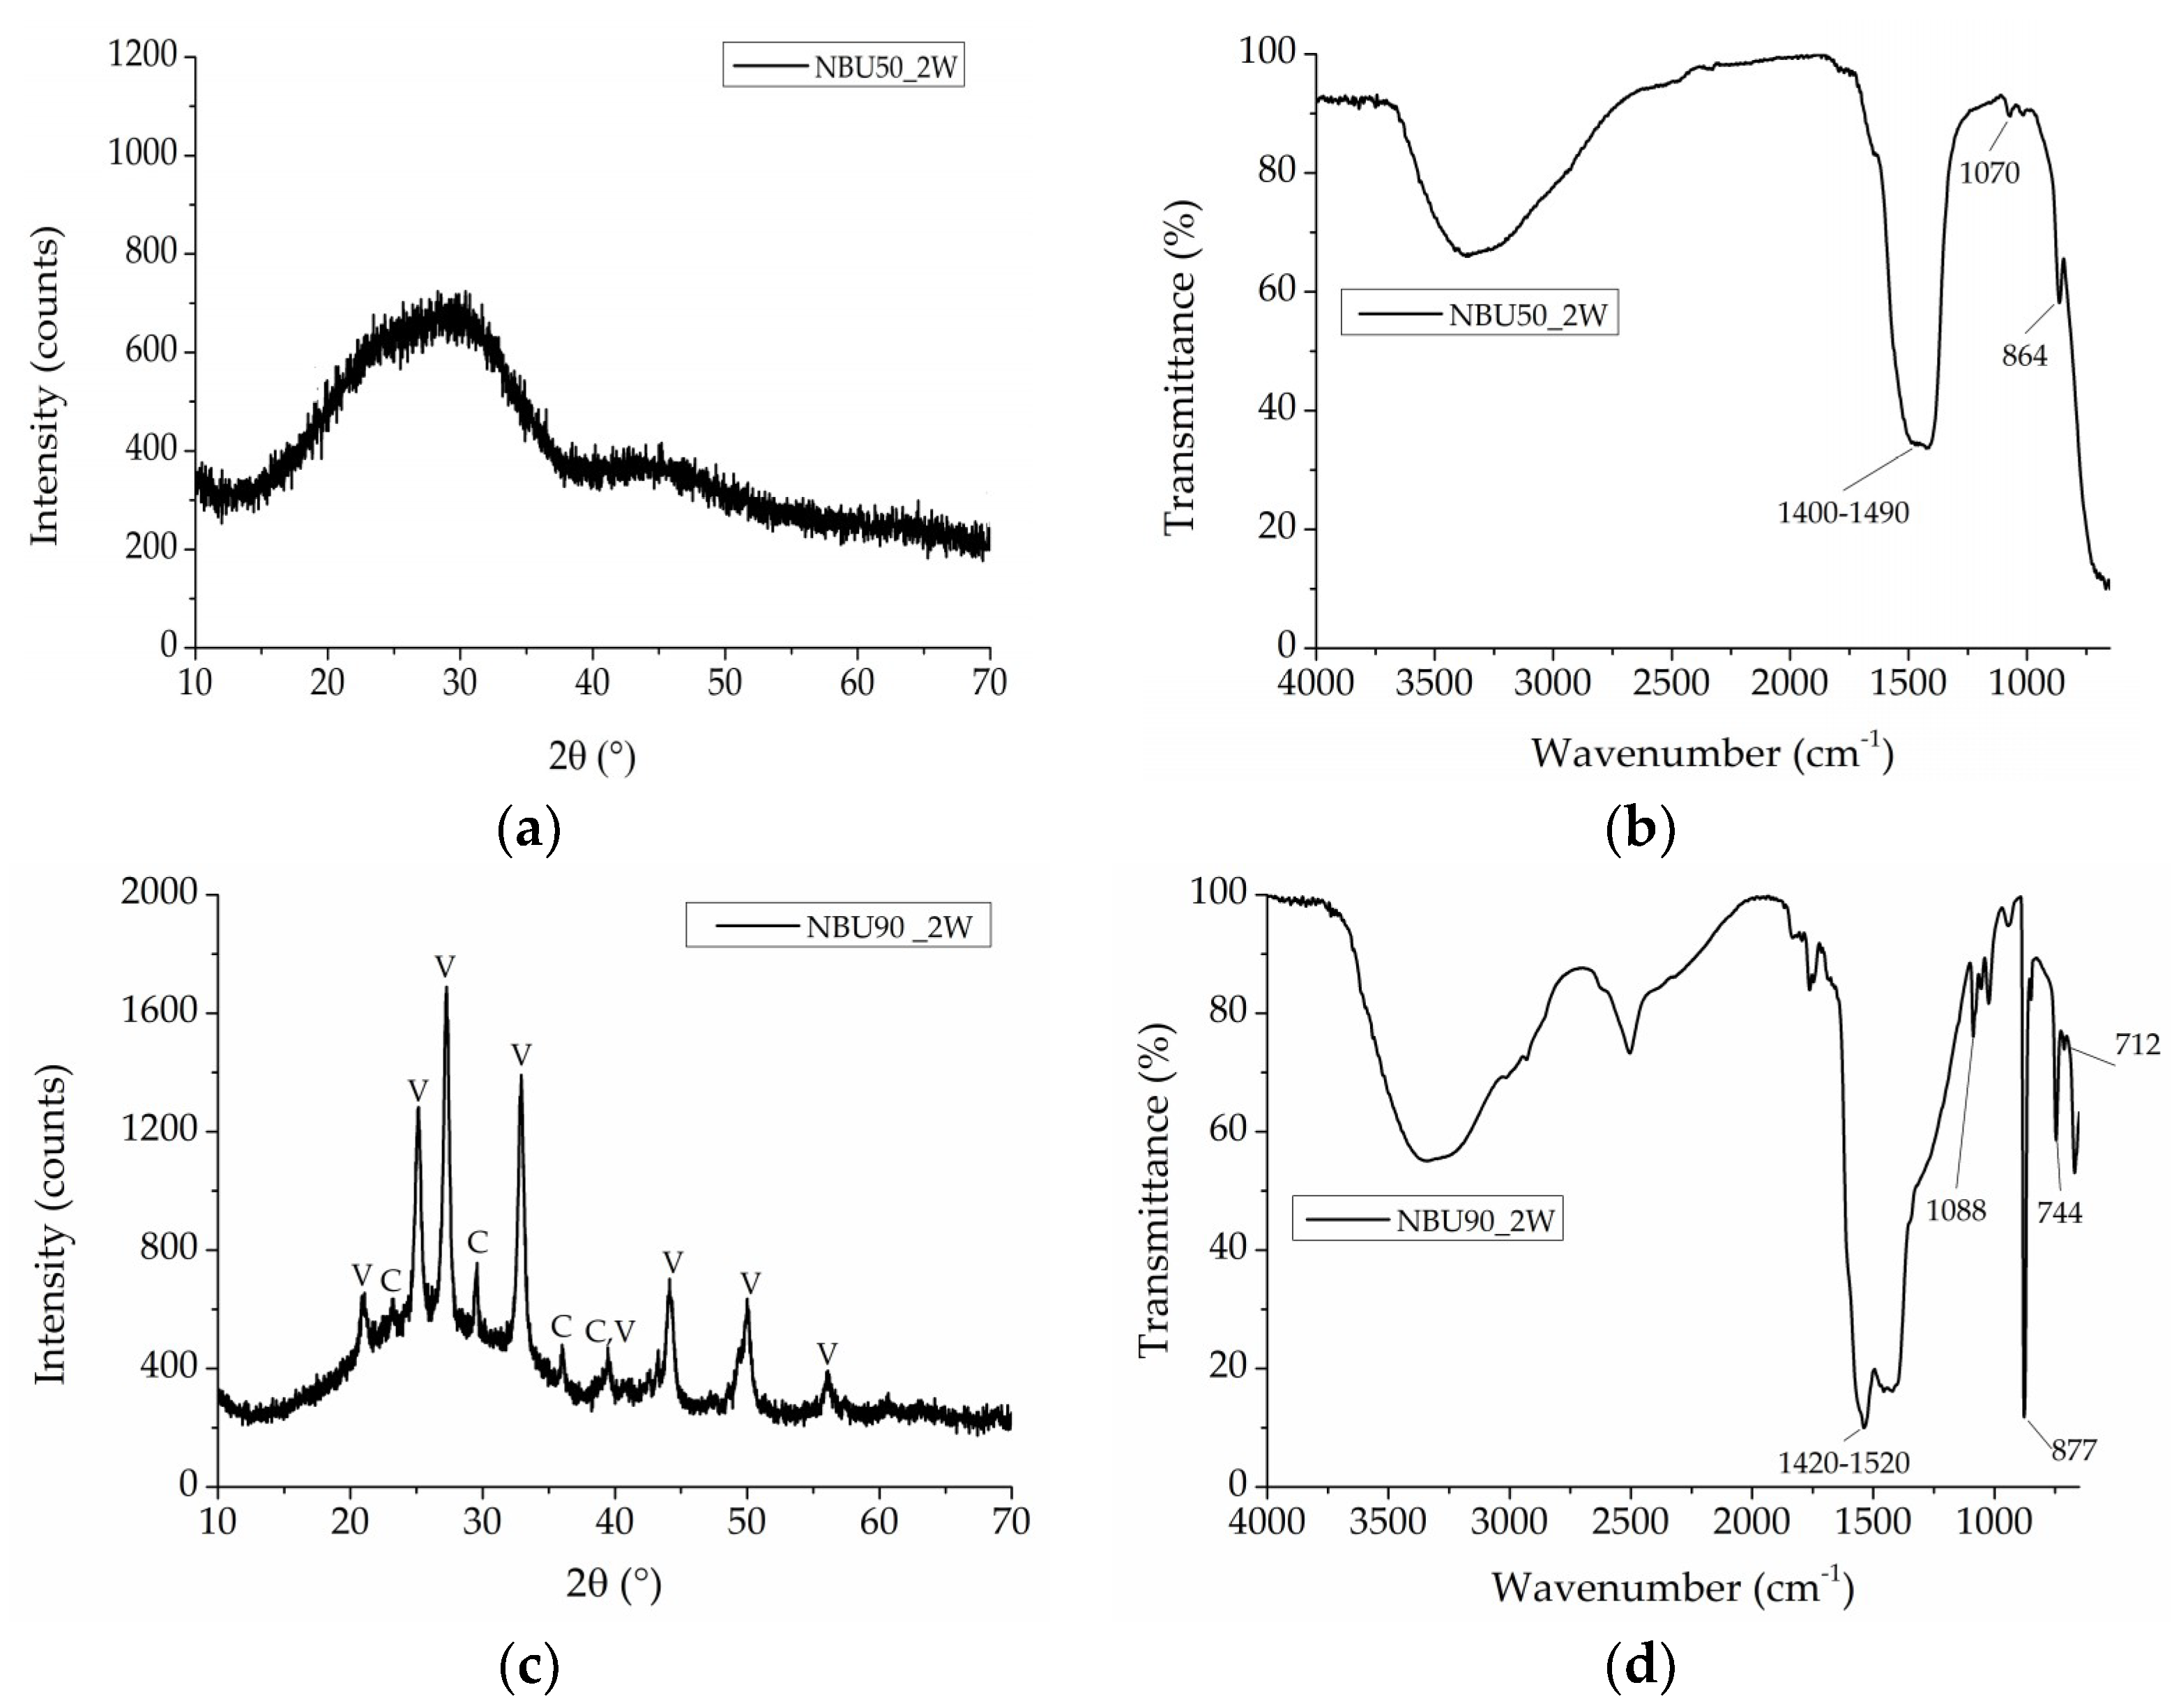
The use of n-butylacetate produces different results with respect to the alcohols. After two weeks at 50% RH, XRD of NBU shows the presence of an amorphous phase (Figure 6a) in accordance with µFT-IR analysis where peaks related to ACC (1490–1400, 1070, 864 cm−1) are evident (Figure 6b). Such a result differs from those obtained for ETA and 2BU solvents for which a constant condition of RH% led to the formation of a crystalline polymorph. Therefore, the amorphous phase could be related to the different properties of this solvent, in particular its higher boiling point and its lower miscibility with water, which delays the formation of crystalline calcium carbonate polymorphs. The diffractogram obtained at 90% RH (Figure 6c) shows a crystalline phase related to both vaterite (ICDD 00-033-0268) and calcite phases (ICDD 01-072-1214). These results are confirmed by µFT-IR analysis (Figure 6d).
After one month, the results confirm the presence of an amorphous phase at 50% RH, while at 90% only vaterite is present.
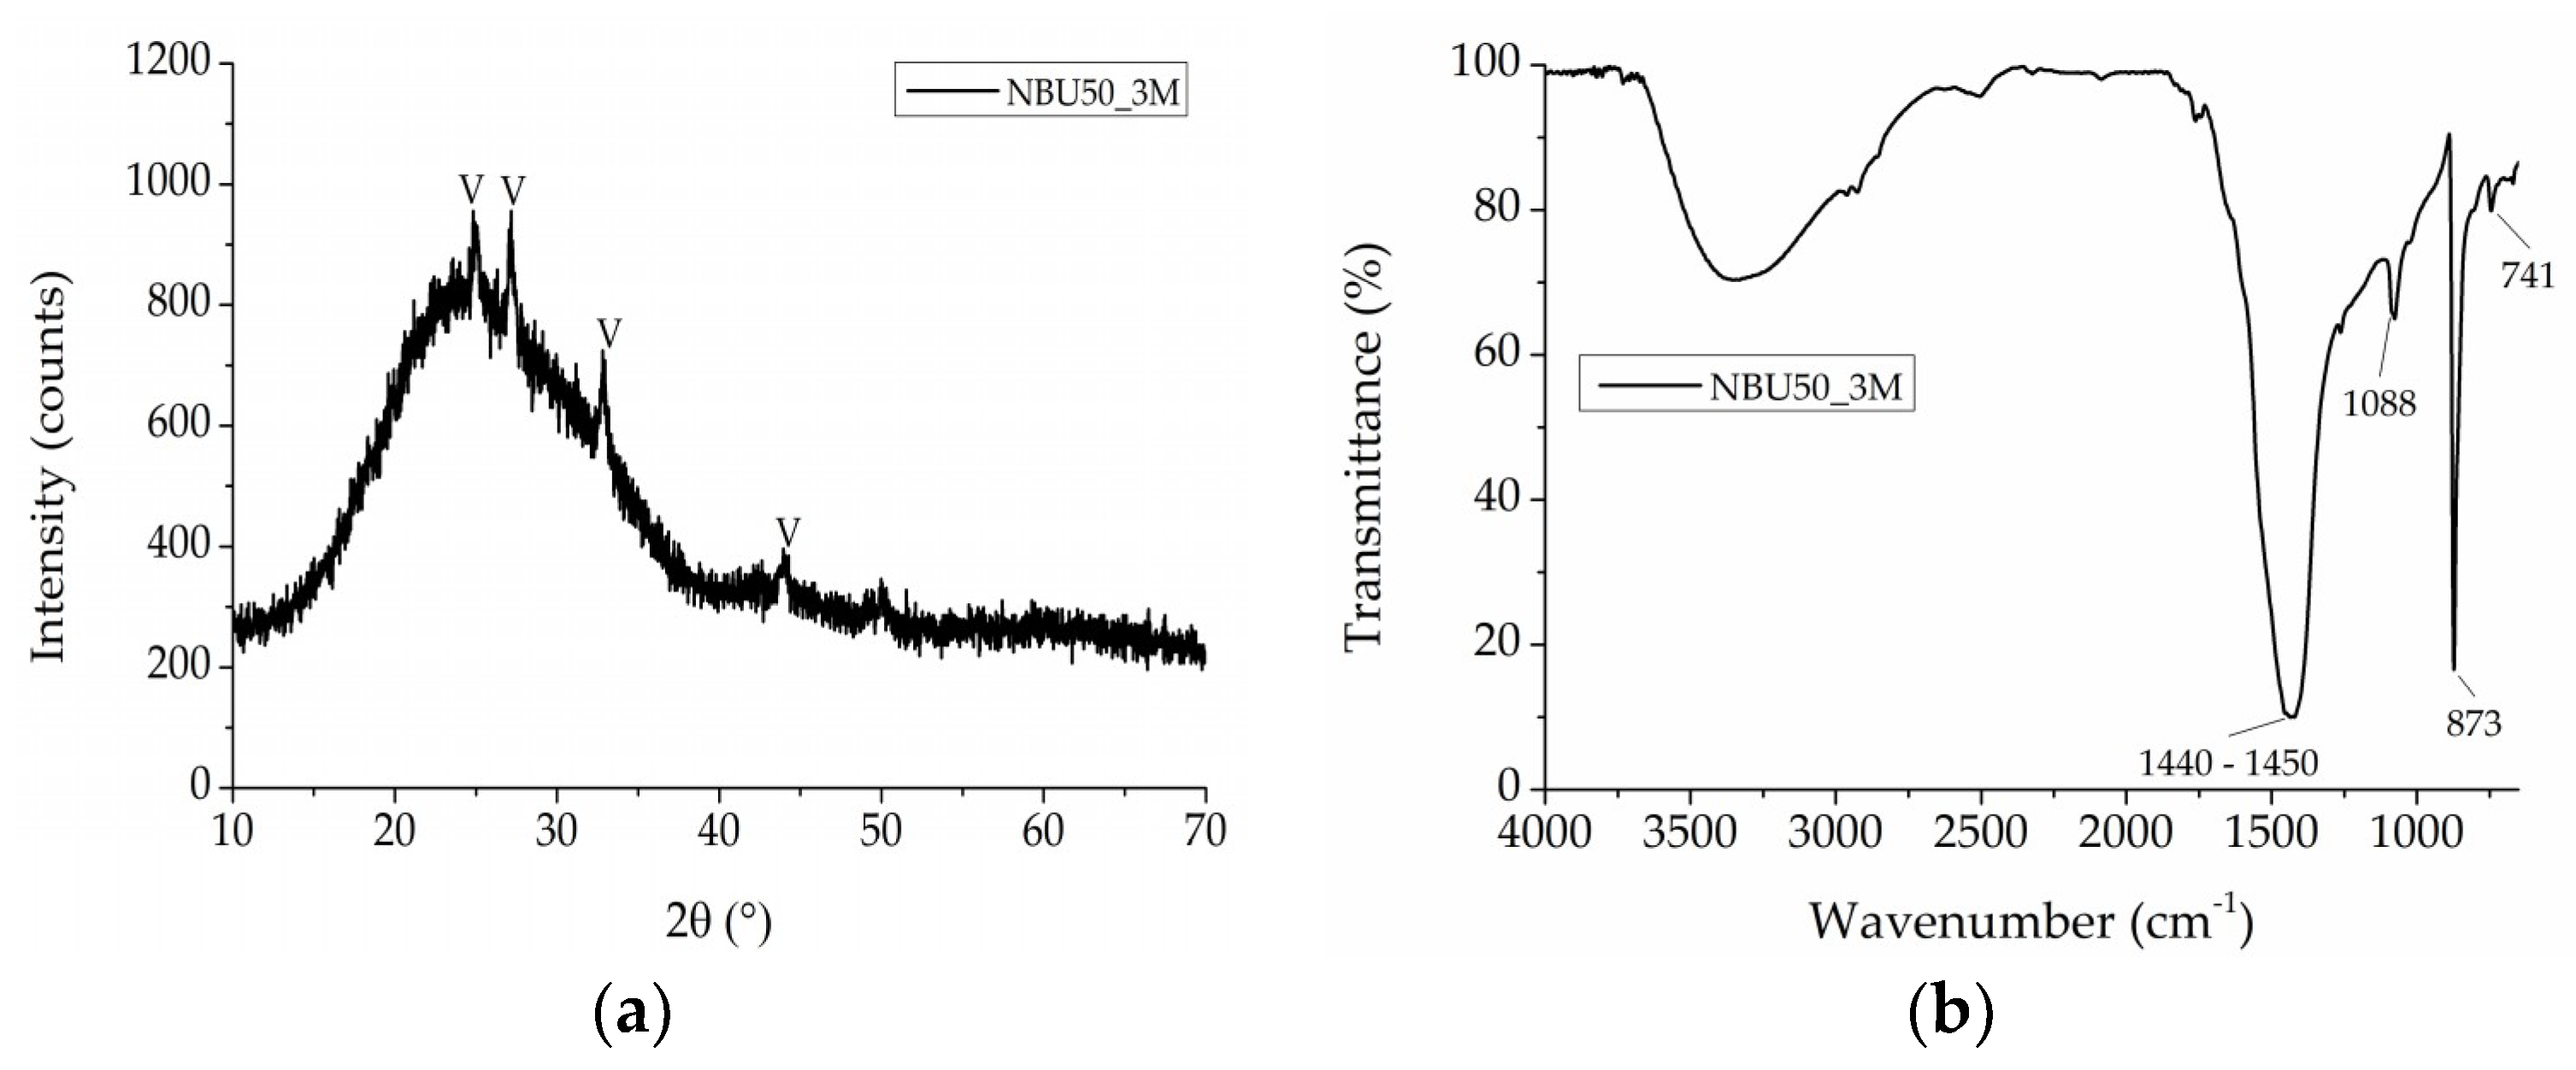
After three months an initial formation of crystalline vaterite phase (ICDD 00-033-0268) is shown for an RH value of 50% (Figure 7a) and confirmed by µFT-IR analysis, with the characteristic vibrational peak at 873 cm−1 (Figure 7b). This set of results suggest that the formation of crystalline phases of calcium carbonate is more likely when a constant value of RH% is considered, but the crystallization process is slower when compared with the use of ethanol and 2-butanol. This effect may be due to a delay of the carbonation process related to the properties of n-butylacetate.
Results at 90% RH after three months remain constant in respect to those obtained after one month. In fact, only the presence of vaterite is confirmed by both XRD and µFT-IR analyses. By concluding, the presence of amorphous calcium carbonate at 50% RH after two weeks and one month, obtained from the coating analysis of Ca(OEt)2 nanosuspension diluted in n-butylacetate, could be related to the properties of the solvent which delays the formation of a crystalline phases despite a constant value of RH%. On the contrary, a higher value of RH% promotes the formation of a crystalline phase.
The results regarding the coating investigation obtained in the previous work for CaLoSil [12] show that only aragonite is present at 50% RH, while a higher value of relative humidity (90%) leads to the formation of different crystalline phases: calcite and vaterite. Such results are different from 2BU and NBU.
All the obtained results, for all products, RH% conditions and time intervals, are reported in Table S2 (Supplementary Materials). Furthermore, Table S3 (Supplementary Materials) shows a summary of the main vibrational bands associated to calcium carbonate polymorphs identified by µFT-IR.
3.2. Consolidation of Limestone
3.2.1. Lecce Stone
Table S4 in Supplementary Materials reports the data regarding the amount of dry matter retained after one month for samples treated with both types of application procedures and for all treatments. While for ETA and NBU, both application procedures lead to a similar quantity of dry matter retained, for CAL, the application AP2 leads to a larger amount of dry matter retained and for 2BU application AP2 leads to a lower amount of dry matter retained.
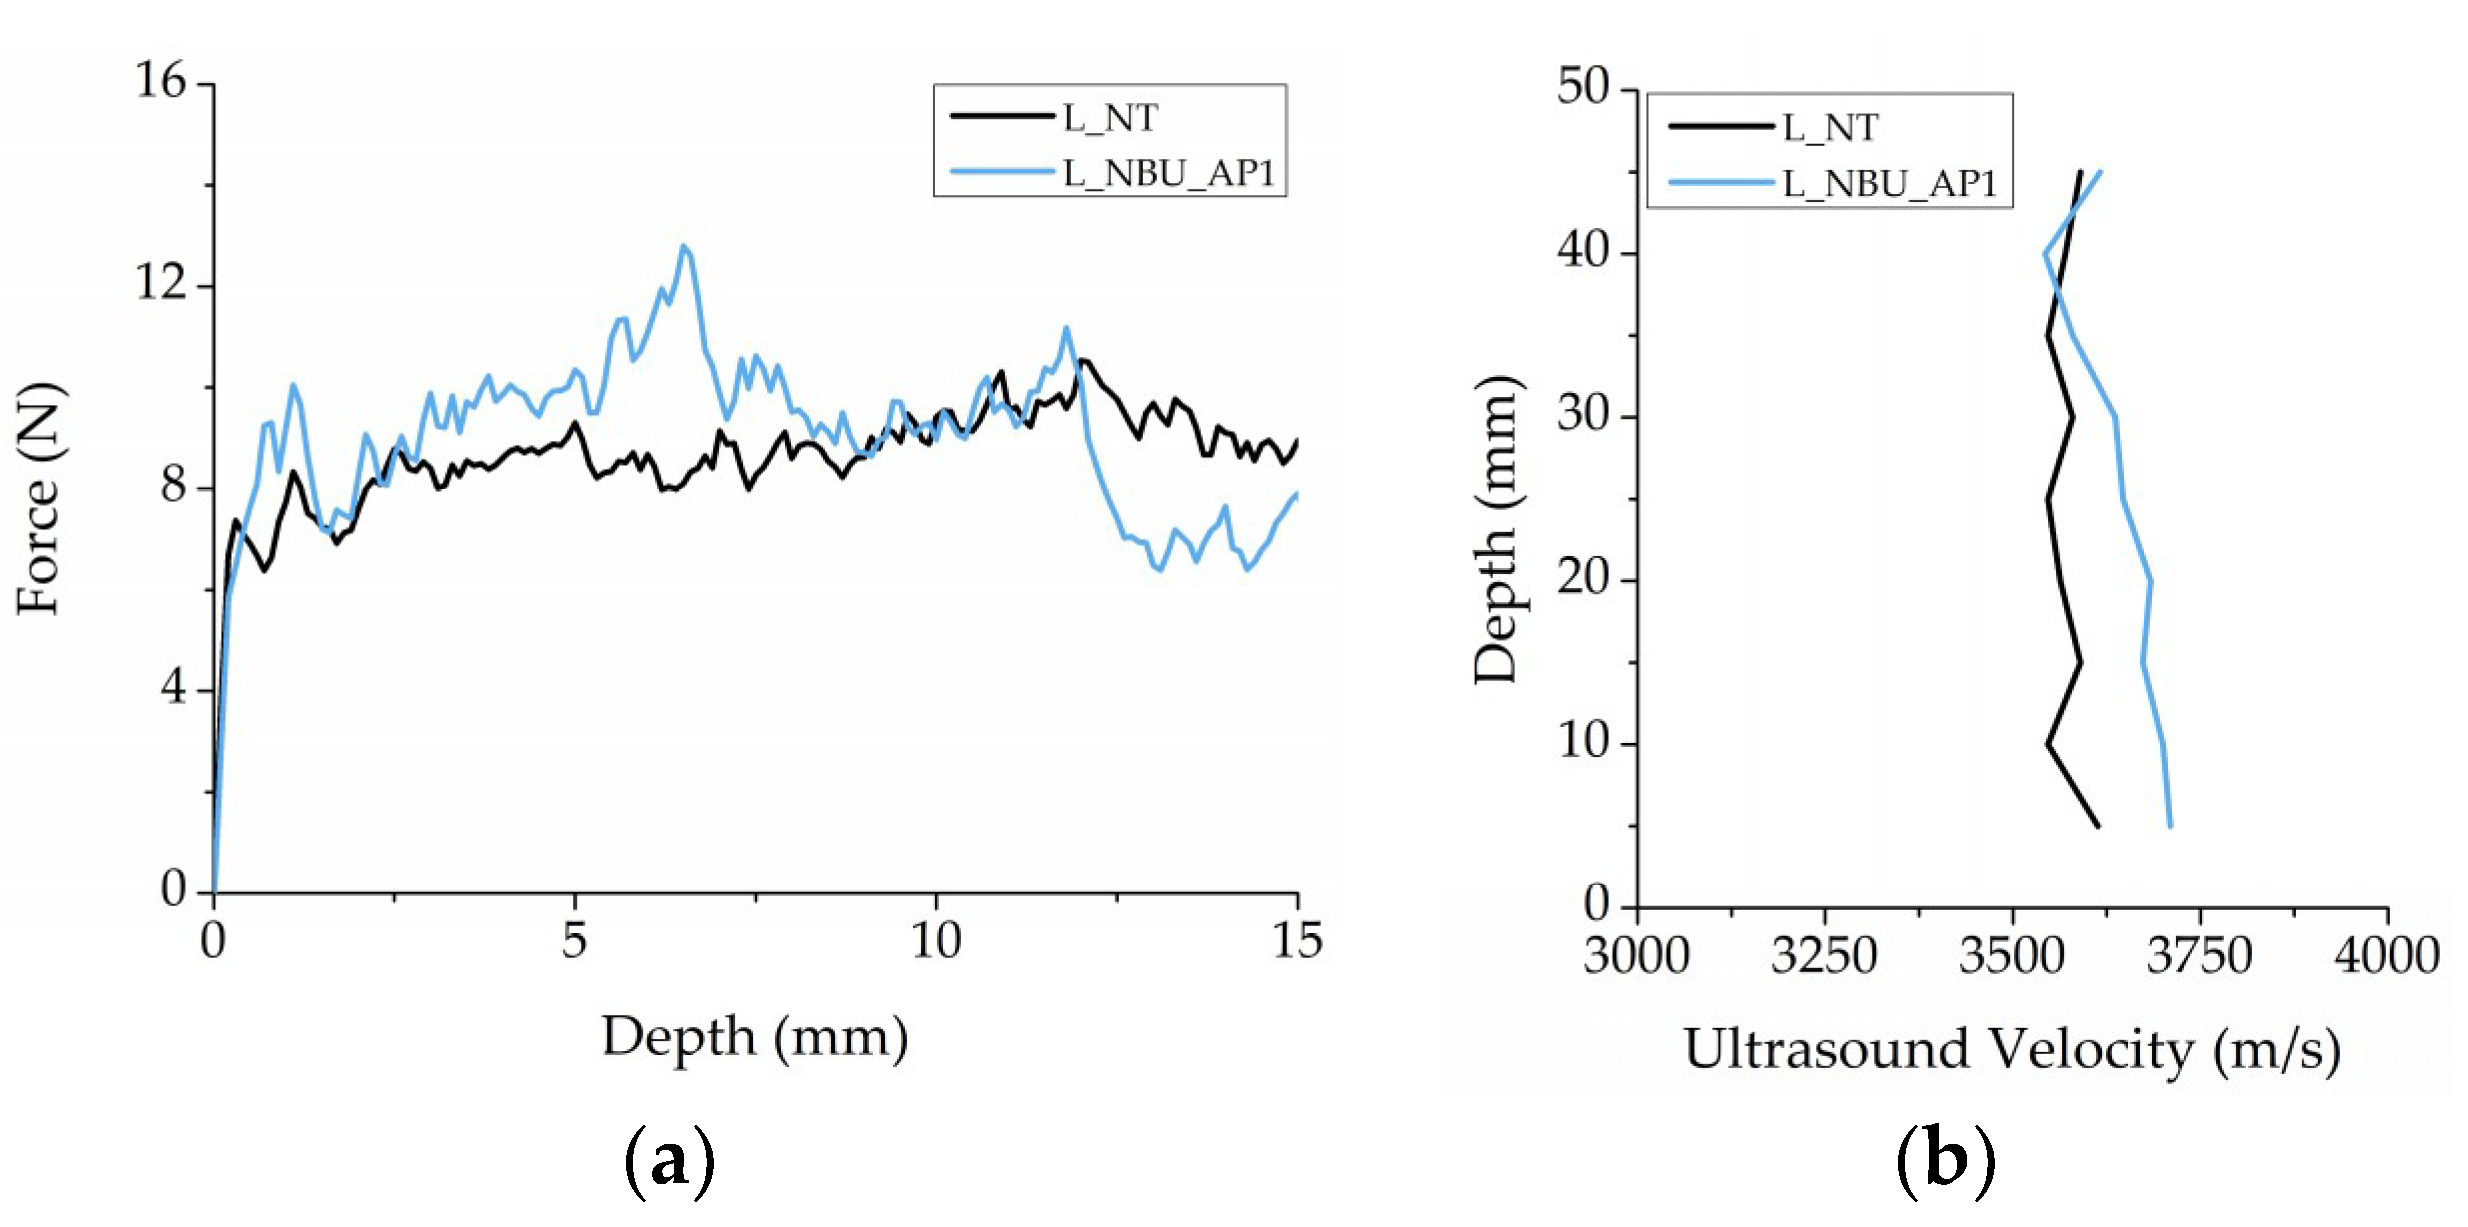
Drilling tests of treatments applied with AP1 procedure show that NBU is the product which leads to a better penetration inside the samples by inducing an increase of stone resistance from a mean value of 8.3 ± 1.1 N for the untreated part to 9.4 ± 1.6 N for the treated one, allowing to conclude a penetration depth of about 9 mm (Figure 8a). Penetration depth is lower respect to that one indicated by UPV profile which indicates an increase of ultrasound velocity in the first mm from the treated surface (Figure 8b and Table S5, Supplementary Materials).
DRMS and UPV results concerning treatments ETA, 2BU and CAL are reported in Supplementary Materials (Figures S1–S3, respectively). For these treatments, no consolidation effect is observed.
Regarding the colorimetric measurements, only ETA shows a ΔE* < 5, the limit value for an acceptable color change of the surface in terms of visual impact (Table S6, Supplementary Materials) [23].
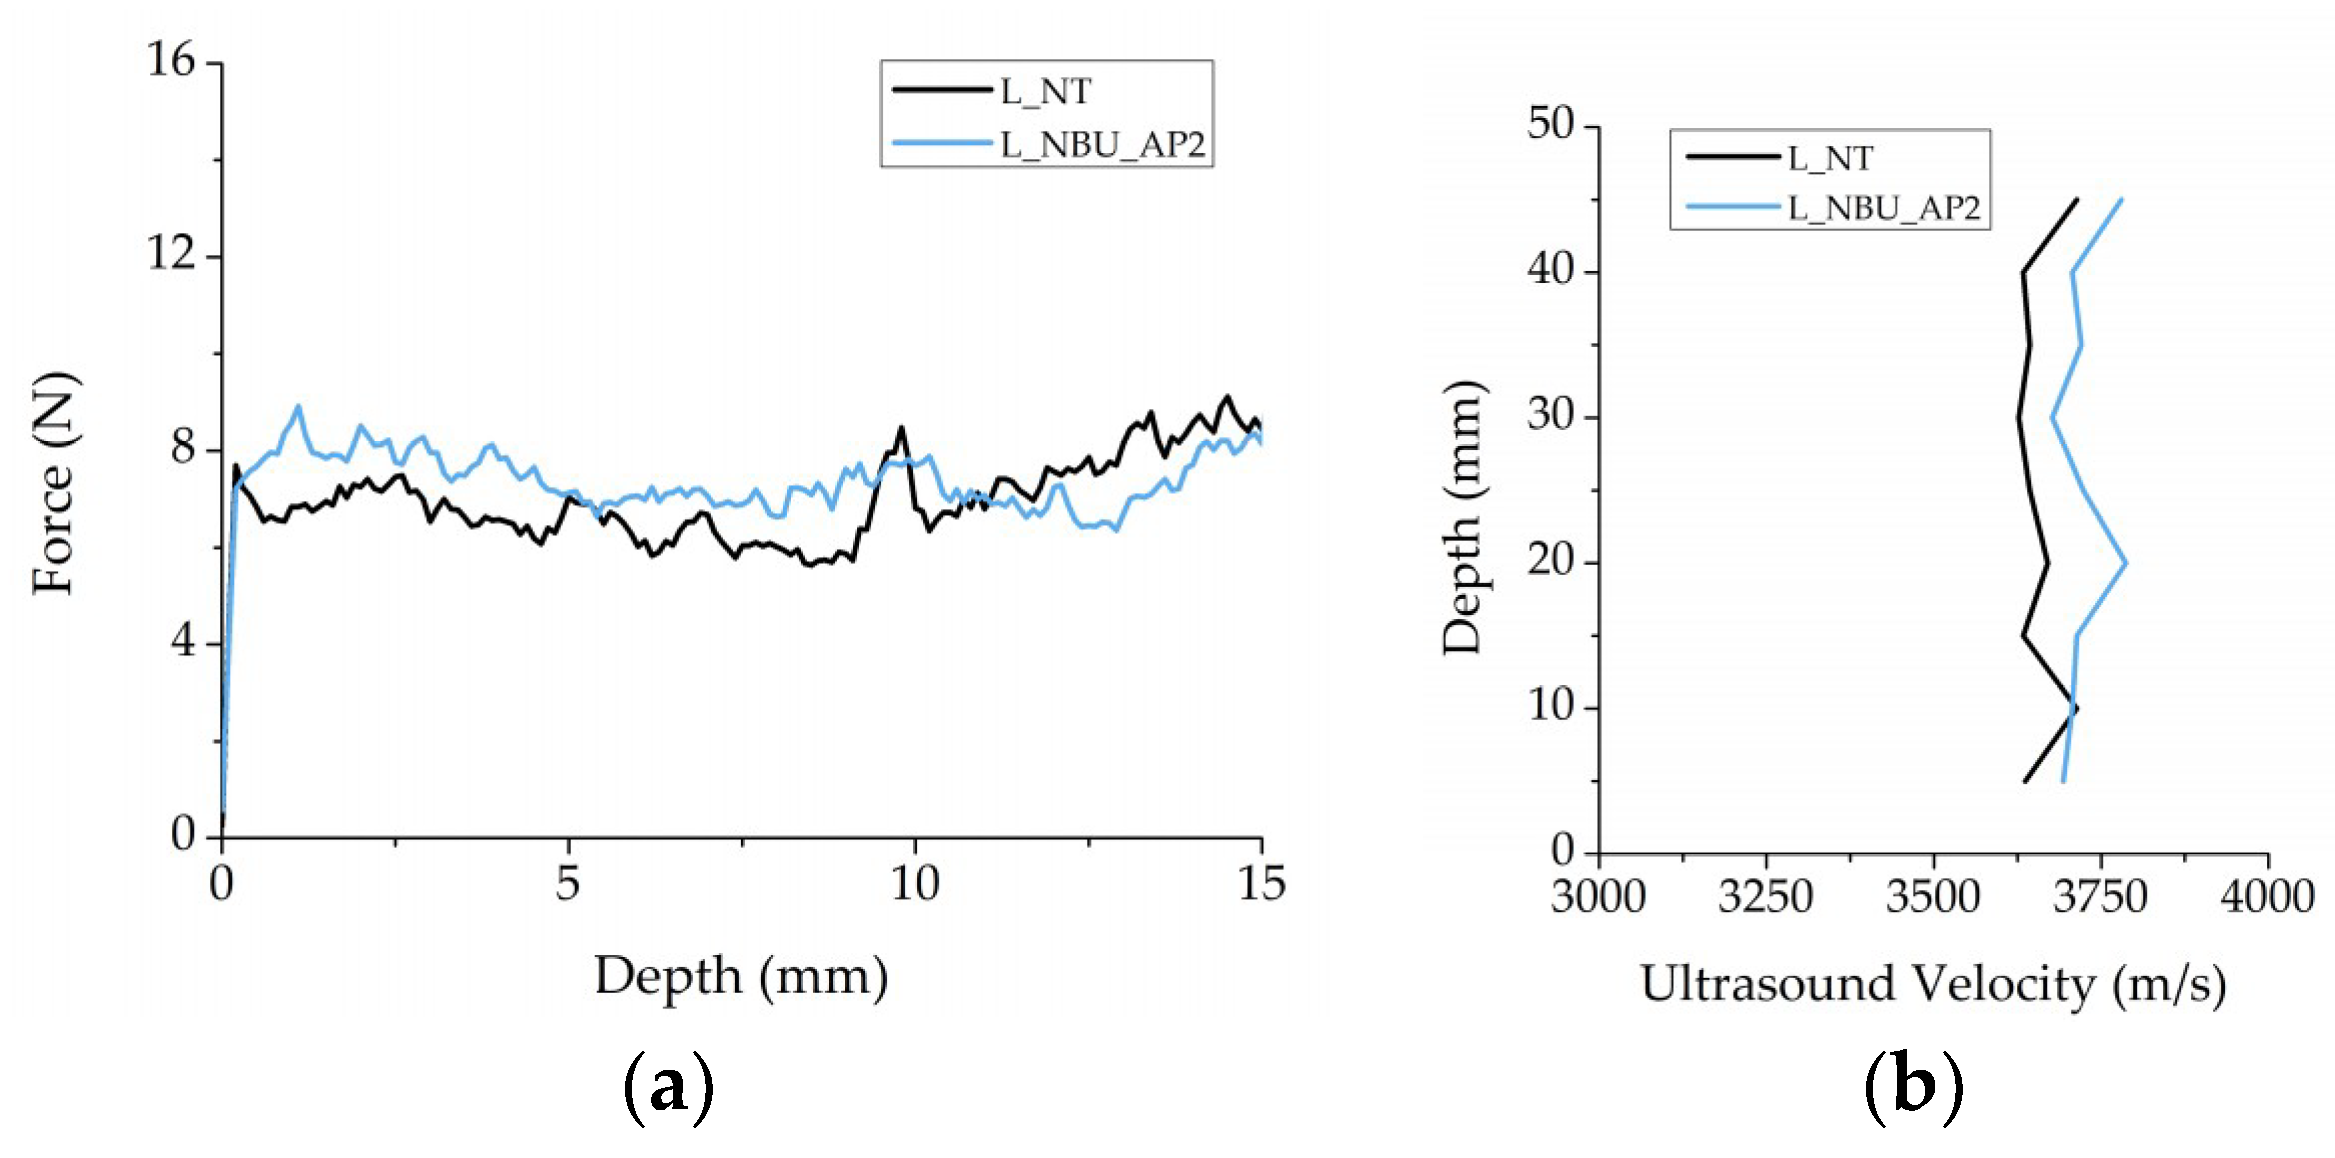
DRMS data regarding the application AP2 show that NBU causes an increase of stone resistance from 6.6 ± 0.8 N to 7.4 ± 0.9 N in the first 10 mm from the treated surface (Figure 9a). This treatment causes also a small increase of UPV between 5 and 10 mm from the treated surface (Figure 9b and Table S5).
By treating samples with ETA, 2BU and CAL there is no consistent variation (Figures S4–S6, respectively in Supplementary Materials).
As for the application by brushing till saturation, the procedure AP2 leads to an excessive change of surface color for all types of treatments (Table S6).
Making a comparison between applications by brushing till saturation and absorption by capillarity, it can be seen that NBU is the product with the higher penetration ability. This result could be related to the higher boiling point of the solvent which delays the carbonation process and leads to a better impregnation of the nanosuspension.
3.2.2. Noto Stone
The amount of dry matter retained after one month from the application shows a greater quantity of dry matter retained inside the samples with AP2, with respect to AP1 (Table S4).
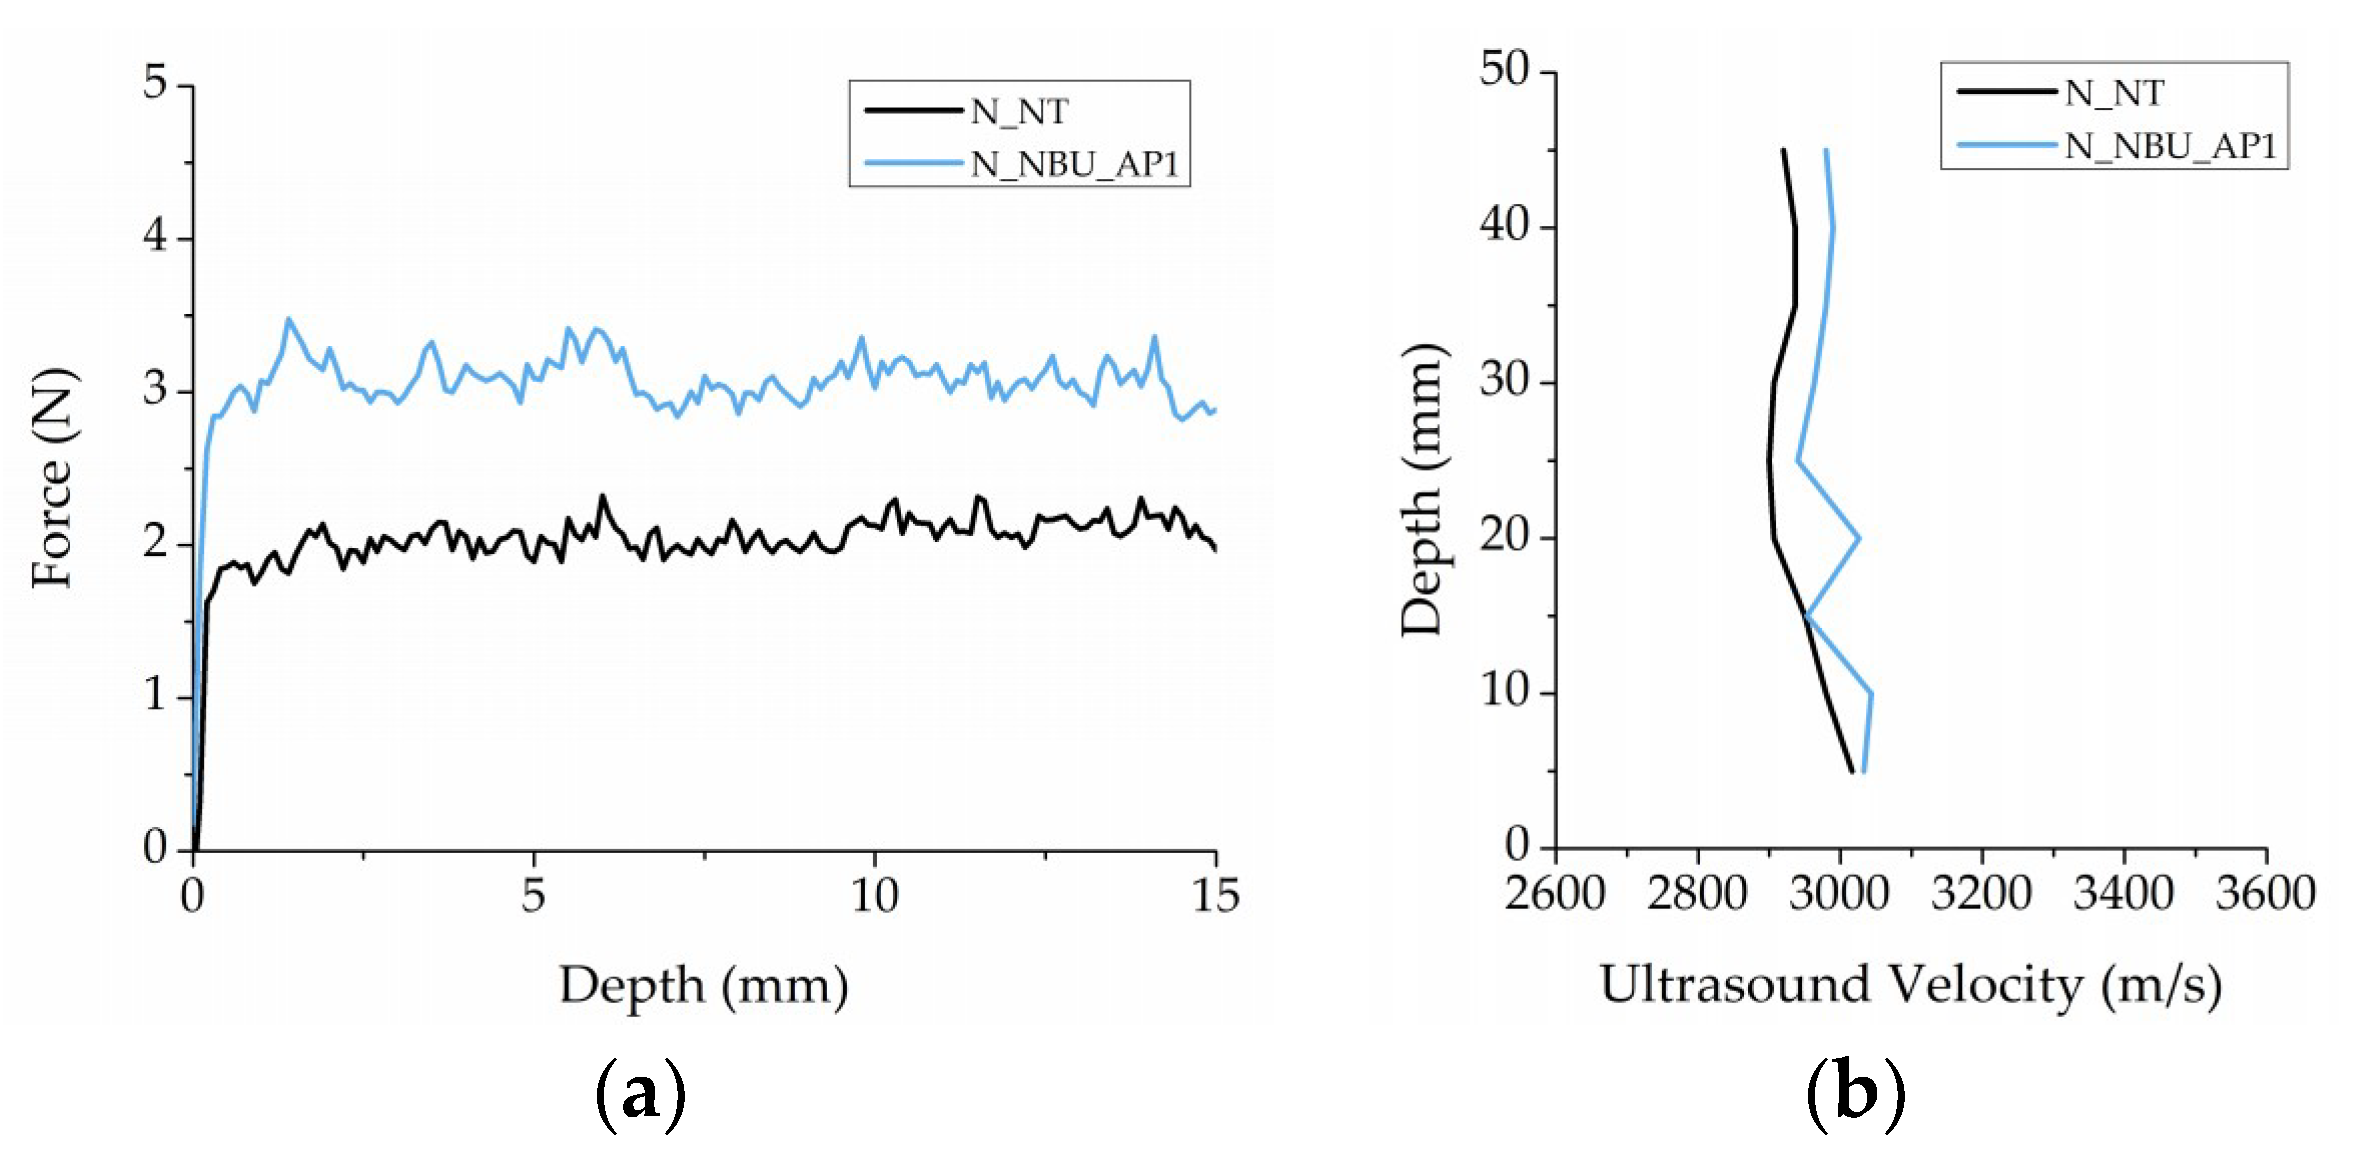
Starting with application AP1, DRMS values indicate that NBU was able to consolidate until 15 mm in depth, with increments in the drilling resistance somewhat higher than 1N (Figure 10a). UPV values of the treated sample are higher all along the specimen length, but the larger uncertainty associated with the UPV values precludes to extract a conclusive validation (Figure 10b and Table S7, Supplementary Materials). All the other treatment combinations show no evident consolidation effect (Figures S7–S9, Supplementary Materials).
Color measurements show that only the product ETA remains in an acceptable change of ΔE* (Table S6).
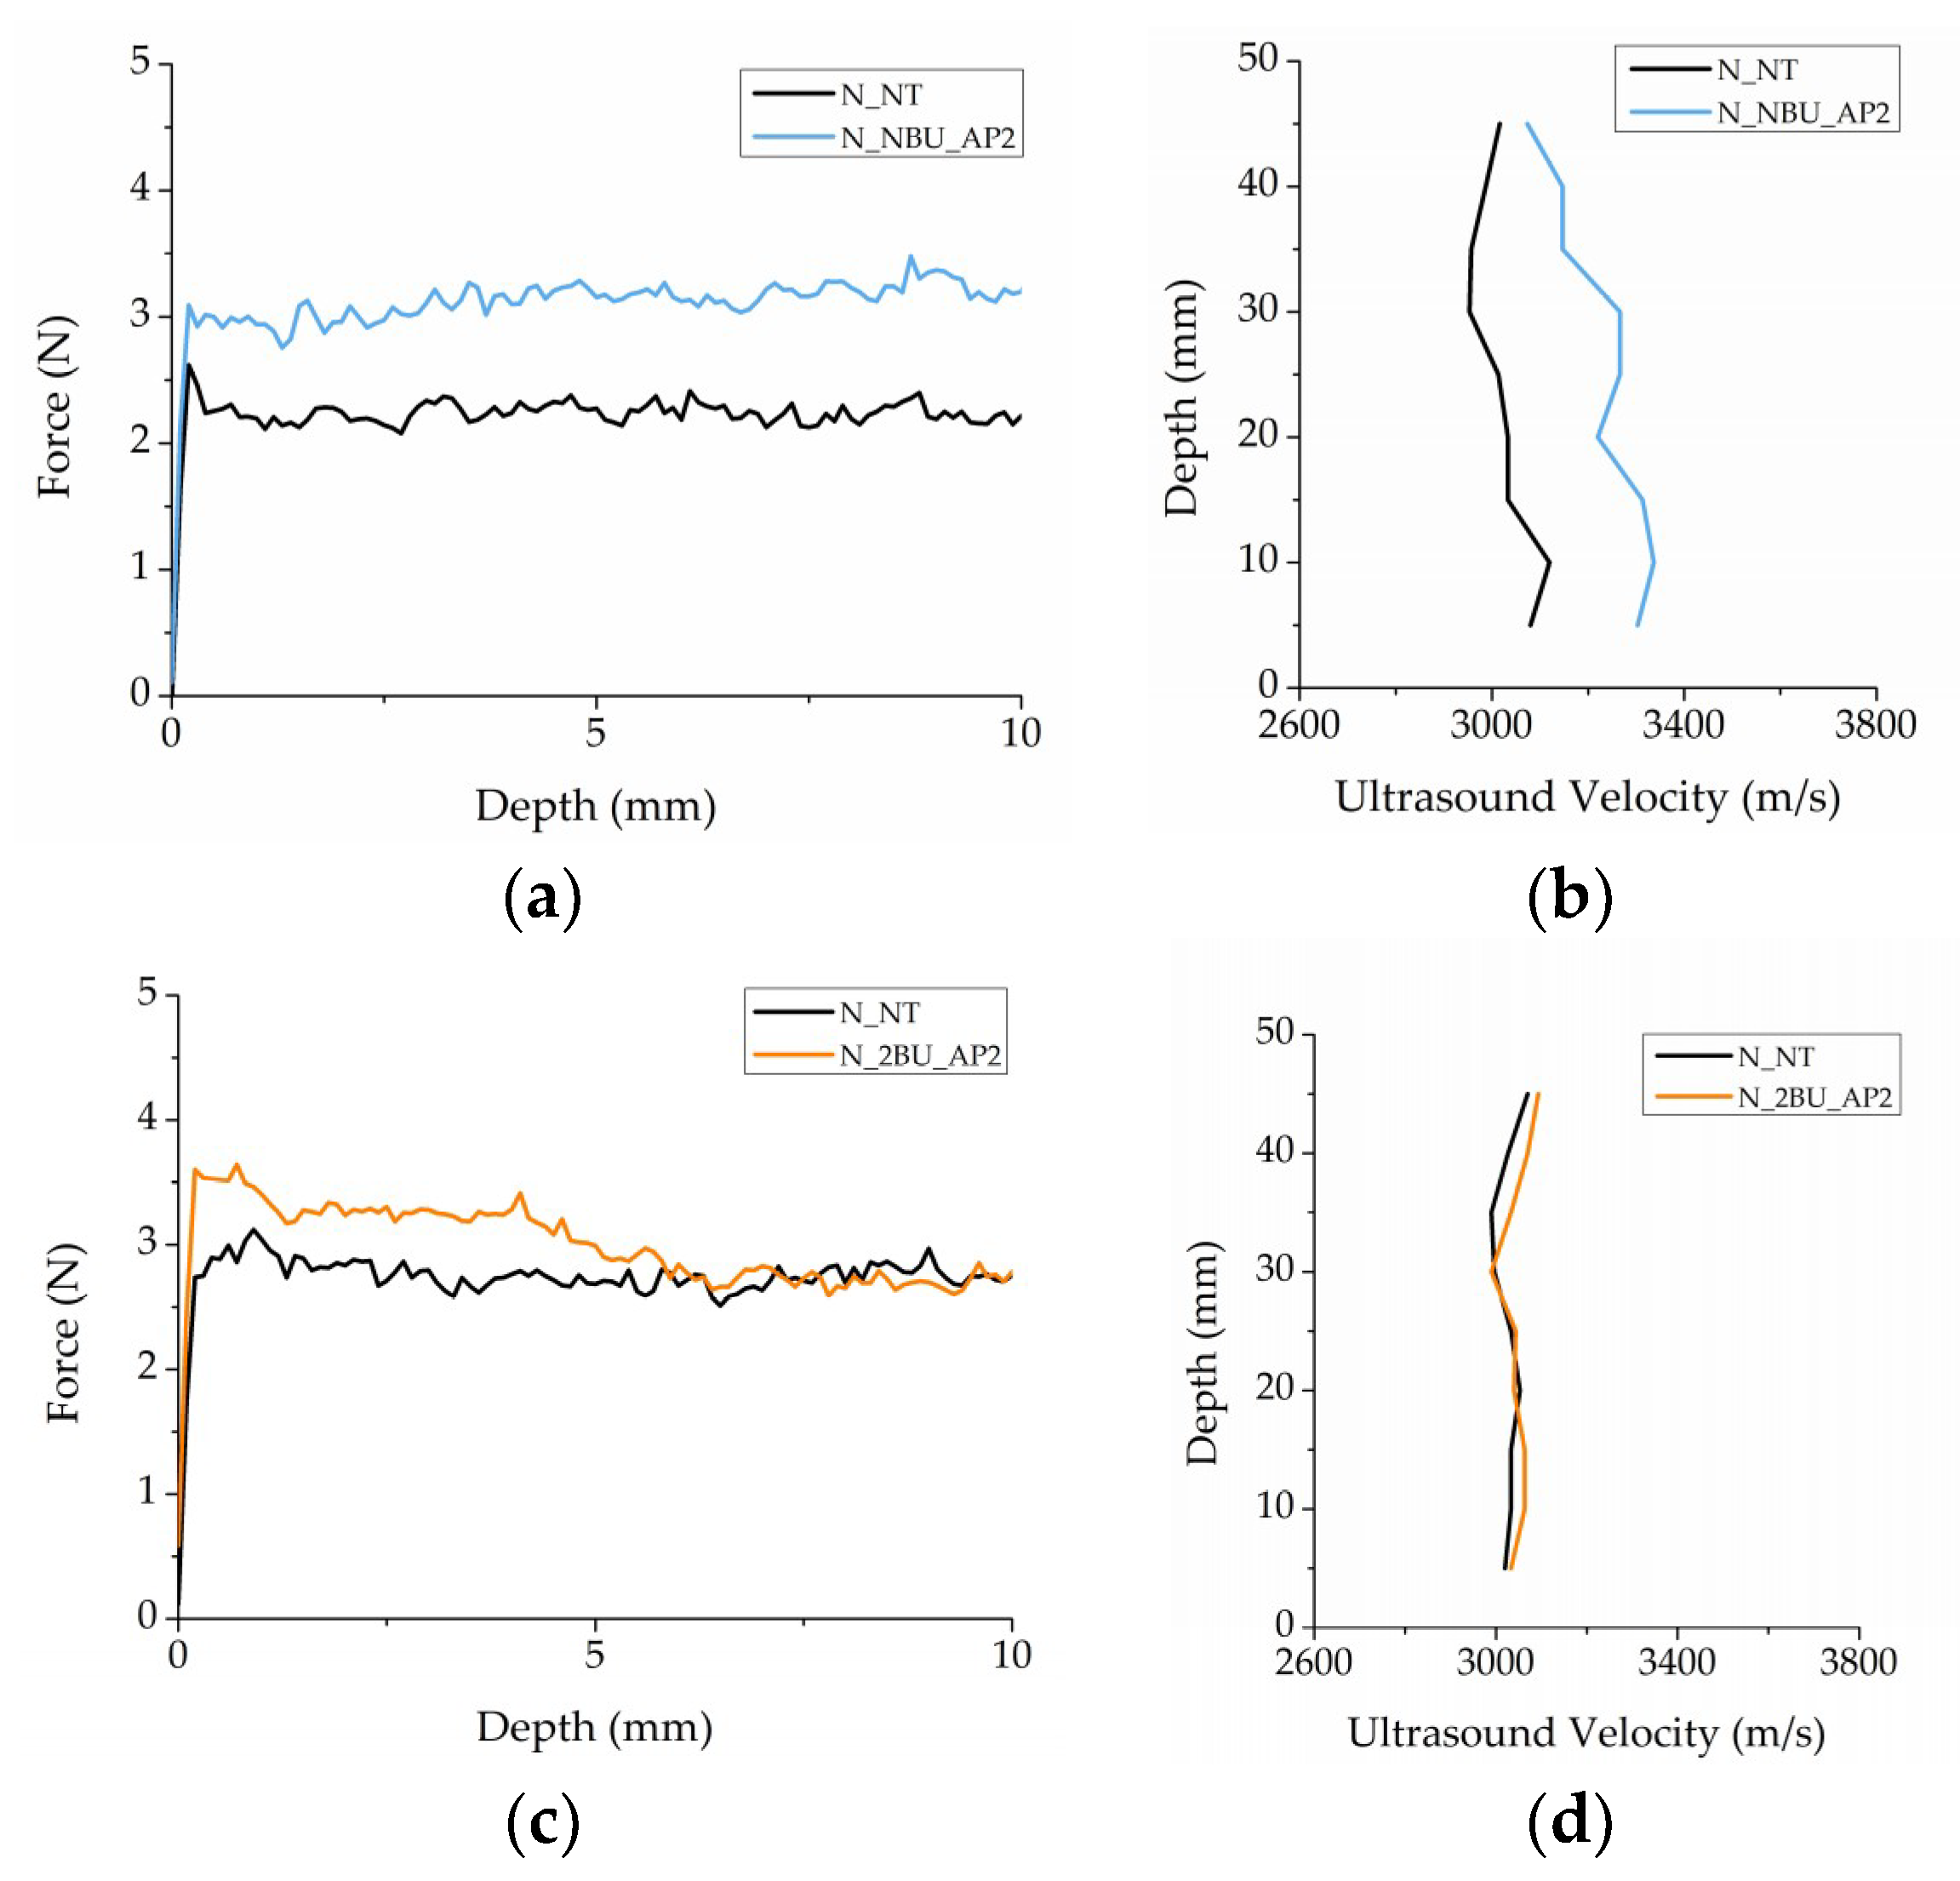
Treatment by capillarity (AP2) induces a clear increase in drilling resistance with NBU through the entire drilled length from 2.2 ± 0.2 N to 3.1 ± 0.3 N in the first 10 mm (Figure 11a), while 2BU and ETA induce a slight increase in the first 5 mm only (Figure 11c,e, respectively). UPV values (Table S7) seem to support the first case (Figure 11b) while are inconclusive for 2BU (Figure 11d) and ETA (Figure 11f), because data acquired by this measurement starts 5 mm below the surface due to the fact that measurement in the first millimeters sometimes is affected by the presence of the border.
The sample treated with CAL gave no evident consolidation effect (Figure S10).
Regarding the visual impact, for this type of application procedure all treatments lead to ΔE* value higher than the acceptable limit (Table S6).
From these results, we may conclude that Ca(OEt)2 nanosuspension diluted in n-butylacetate (NBU) performed better in Noto stone than the other tested alternatives. Despite samples treated with 2BU show the higher quantity of dry matter retained with the AP2 procedure, a weak consolidating effect is evidenced only in the first millimeters with an increase of about 0.5 N (from 2.7 ± 0.4 N to 3.2 ± 0.4 N) detected with DRMS for the first 5 mm. Therefore, it is possible that the product penetrates only for this distance.
3.2.3. Vicenza Stone
Data concerning the quantity of dry matter retained after one month show that the application AP2 leads to a major quantity of product with respect to AP1 for all calcium ethoxide nanosuspension based treatments in comparison with CAL (Table S4).
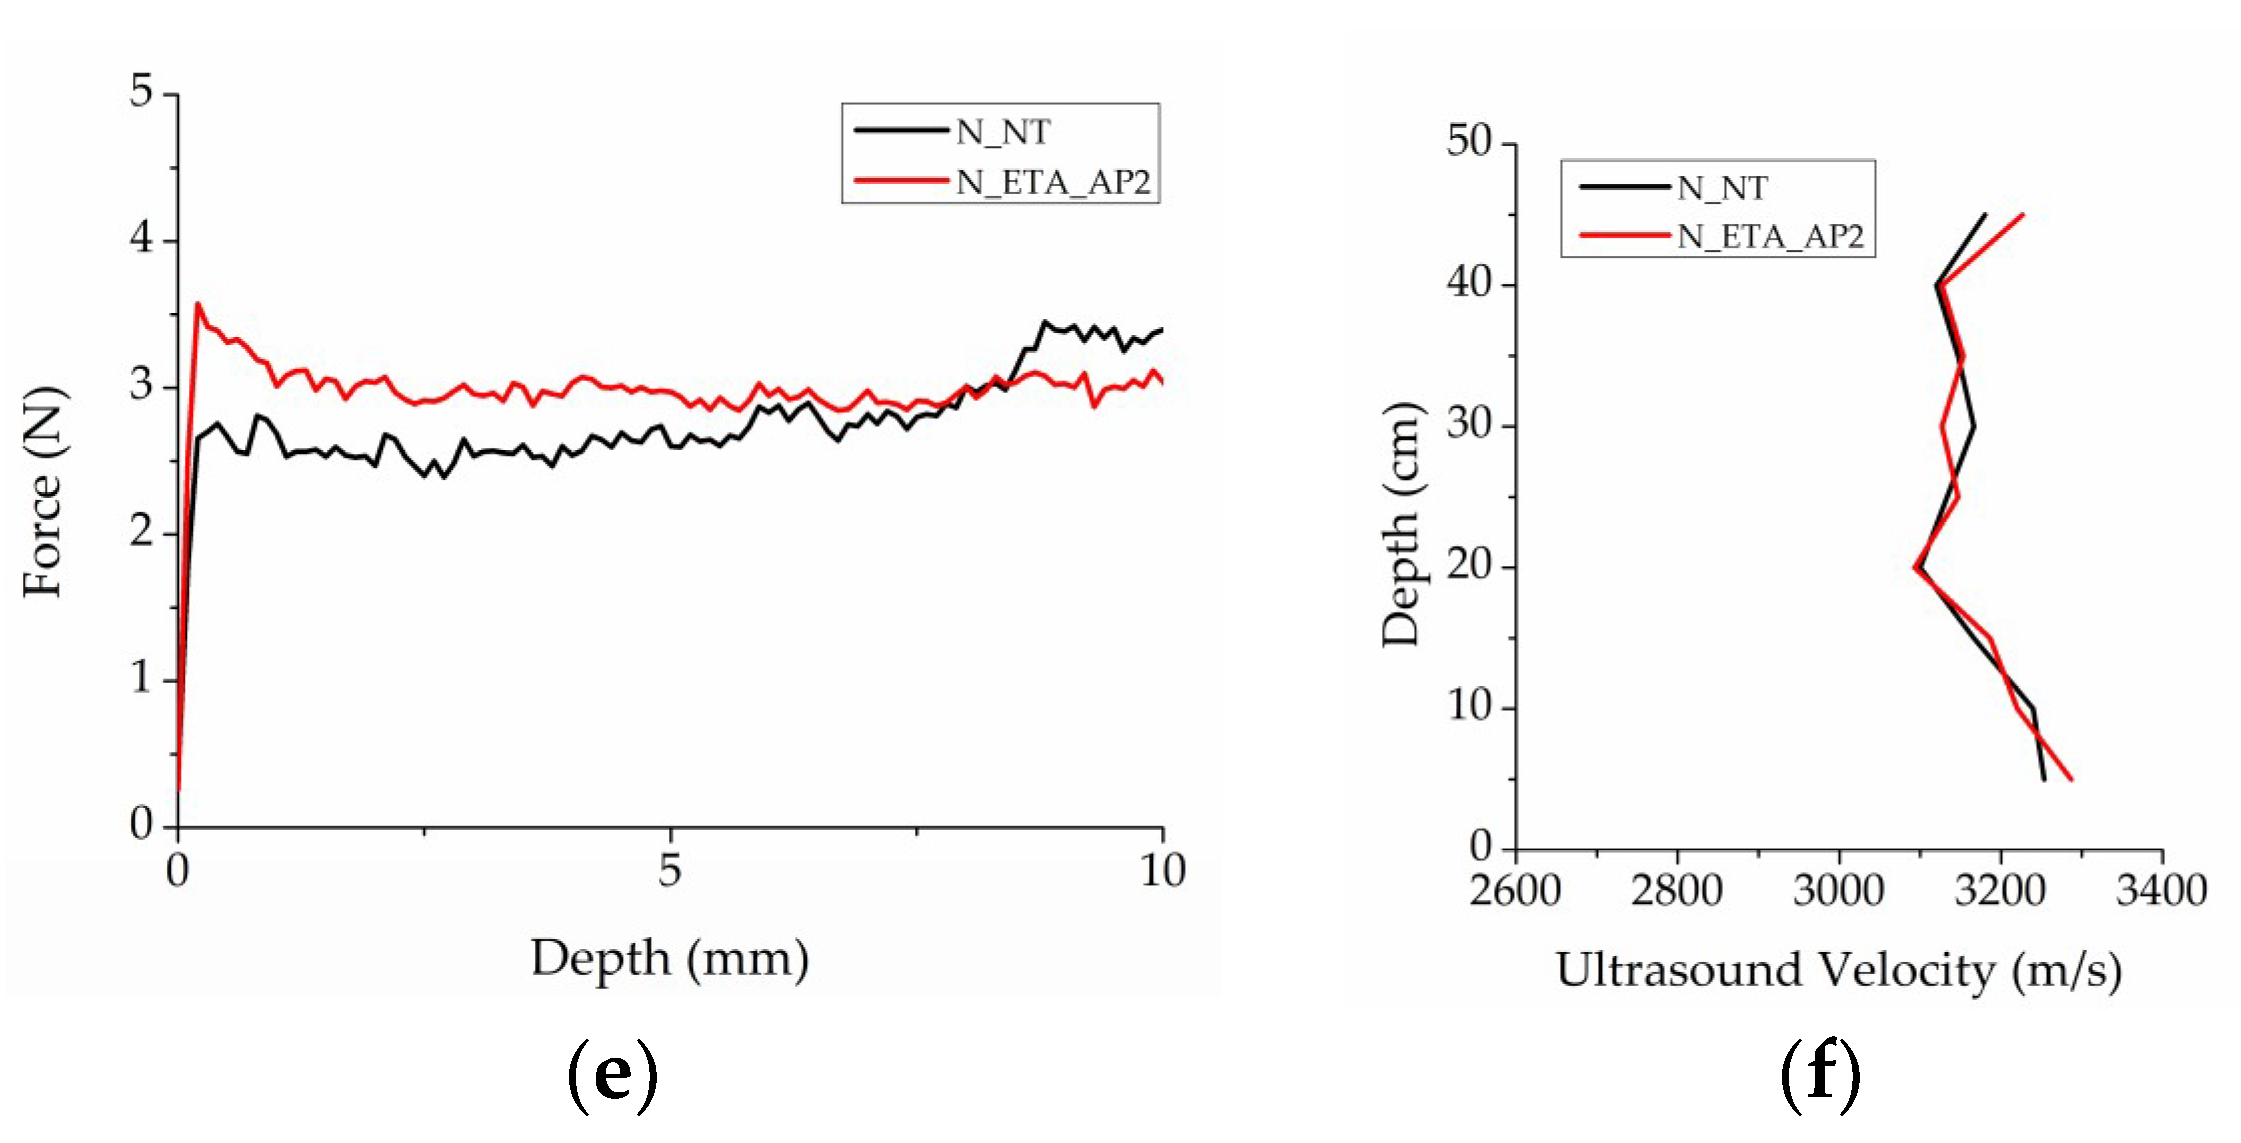
Starting from the application procedures AP1, DRMS shows a small penetration inside the treated samples for stone treated with 2BU (Figure 12a). UPV results partly confirms this result (Figure 12b and Table S8, Supplementary Materials). This product corresponds also to the treatment which causes a higher color variation of the surface (Table S6). Results concerning ETA, NBU and CAL are reported in Figures S11–S13 in Supplementary Materials, respectively, and do not show a concrete consolidation effect.
With this type of application procedure, only CAL induces a color change over the acceptable limit.
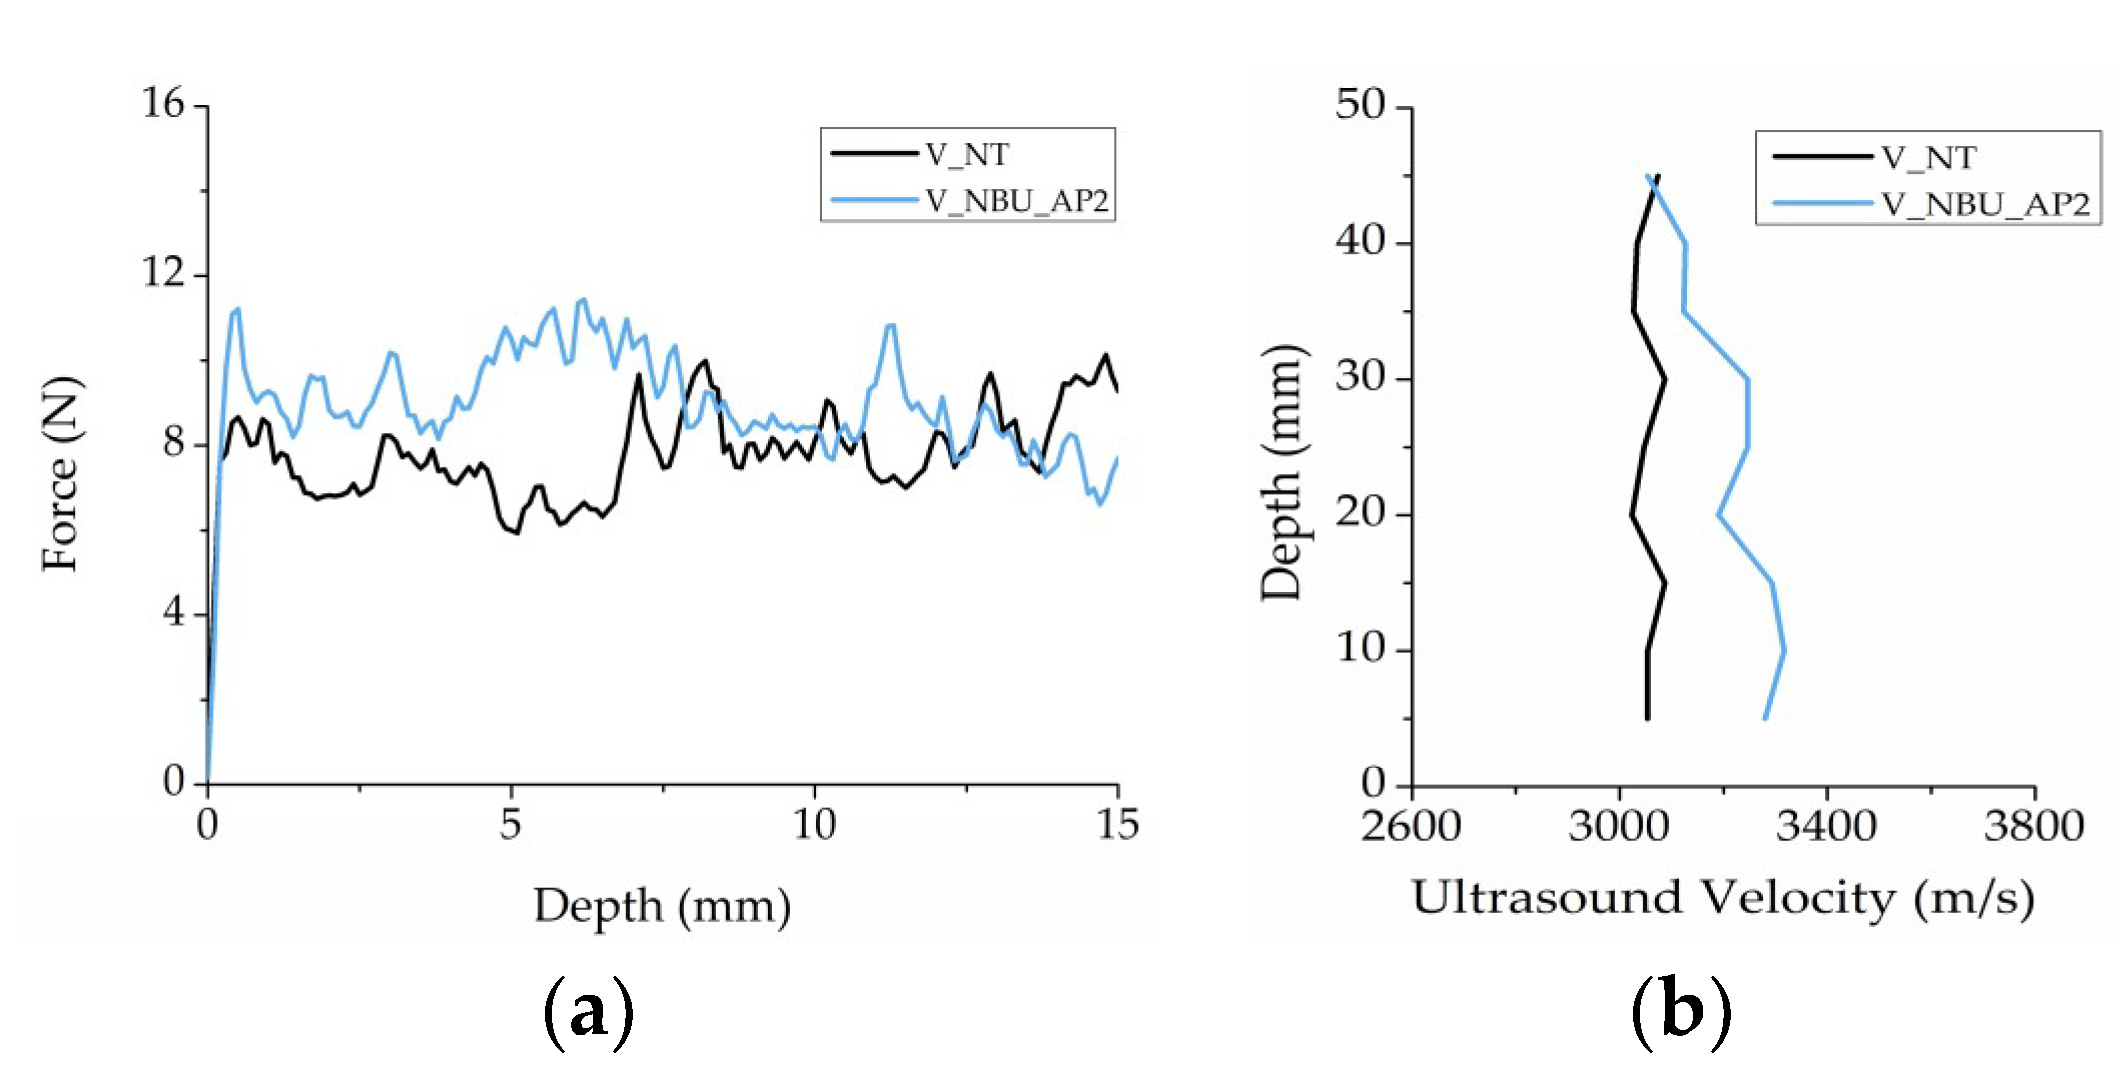
Moving to AP2 procedure, Figure 13a reports DRMS results for NBU treatment and shows that this treatment leads to a good penetration inside the stone in the first 8 mm leading to an increase in stone resistance from 7.3 ± 1.2 N to 9.4 ± 1.6 N (Figure 13a). UPV measurements confirm this behavior of NBU which seems to penetrate several centimeters inside the stone (Figure 13b and Table S8). Results concerning other treatments (ETA, 2BU and CAL) are reported in Figures S14–S16 in Supplementary Materials and show how they do not lead to a consolidating action.
Looking at the color measurements, also in this case only the reference product (CAL) leads to a ΔE* value higher than 5. In fact, all treatments based on Ca(OEt)2 nanosuspension remained in an acceptable range (Table S6).
4. Conclusions
The research concerned the study of a new consolidation product, Ca(OEt)2 nanosuspension in ethanol/tetrahydrofuran, modified by the addition of different solvents to understand how they could influence some characteristics of the original product such as kinetic and reaction pathway, the formation of crystalline phases at the end of carbonation process and the consolidation effect. Ethanol, 2-butanoland n-butylacetate were the tested solvents.
Regarding the kinetic process evaluated in contact with air and without any contact with the stone itself, n-butylacetate is the solvent that mostly delayed the conversion of calcium ethoxide to calcium carbonate, probably due to its higher boiling point and lower miscibility with water. µFT-IR analysis shows that peaks related to calcium carbonate appear after two minutes when 2-butanol and ethanol are used, and after six minutes for n-butylacetate, counted from the beginning of the carbonation reaction. Therefore, the type of solvent plays an effective role in the control of carbonation rate, with lower vapor pressure (slow evaporation) leading to slower carbonation rate.
Carbonation reaction may follow two different pathways: (a) insertion of carbon dioxide molecules inside the Ca–O bond of the ethoxide, with formation of alkyl carbonate as intermediate, followed by hydrolysis and alcohol elimination; (b) hydrolysis of the ethoxide with the formation of calcium hydroxide, which carbonates after. Results show that alcohols and n-butylacetate have distinct impacts. Indeed, while alcohols follow both reaction pathways, with n-butylacetate only the first mechanism occurs. This is probably due to the lower miscibility of n-butylacetate with water and therefore to the lower availability of OH groups. However, it should be noted that carbonation is quite a complex process and other factors can intervene, such as the presence of impurities, of other ions, temperature, and CO2 concentration.
Coating analysis shows that the carbonation process always lead to the formation of vaterite, the most kinetically favoured calcium carbonate compound, in all relative humidity conditions. Formation of calcite is favored by high relative humidity conditions.
The penetration depth reached by the Ca(OEt)2 diluted in ethanol, 2-butanol, n-butyalcetate and a reference product, applied on three limestones with two application procedures, was evaluated with DRMS and UPV. The results show that Ca(OEt)2 can better penetrate inside the considered supports by using n-butylacetate and 2-butanol as carrier solvents with different results according to the treated stones. Instead, Ca(OEt)2 diluted in ethanol and the reference product gave the worst results in terms of penetration. Therefore, the higher boiling point of the solvent seems to be an important parameter to permit a better penetration of the treatments based on Ca(OEt)2 nanosuspension. This behavior agrees with a study described by Borsoi et al. [14] which highlights that to improve the penetration depth and the effectiveness of a lime nanosuspension in stones with different porosity, a compromise between the stability of the nanosuspension and the evaporation rate of the used solvent must be reached. Regarding the aesthetical compatibility, the visual impact results under acceptable value only for Vicenza stone, therefore it depends mostly on the treated support rather than the used solvent. Finally, even if the used stones present a different type and value of porosity, no evident correlations are shown between a better consolidation effect and the porosity of the stones.
Supplementary Materials
The following are available online at https://www.mdpi.com/2079-6412/9/2/83/s1, Table S1: Properties of the employed solvent, Table S2: Summary of coating results of all products, for all RH% conditions and all time intervals, Table S3: Summary of the main vibrational bands associated to calcium carbonate polymorphs identified in this study by µFT-IR. Spectral range 700–1100 cm−1, Table S4: Amount of dry matter retained after one month for all stones treated with both application procedures and all products, Table S5: Ultrasound pulse velocity values obtained from Lecce stone before and after treatment. The depth profile is expressed from treated (5 mm) to not treated surface (45 mm), Table S6: Chromatic variation after both types of application procedures, for all stones treated with all products, Table S7: Ultrasound pulse velocity values obtained from Noto stone before and after treatment. The depth profile is expressed from treated (5 mm) to not treated surface (45 mm), Table S8: Ultrasound pulse velocity values obtained from Vicenza stone before and after treatment. The depth profile is expressed from treated (5 mm) to not treated surface (45 mm), Figure S1: Lecce stone treated with ETA applied by brushing till saturation AP1 (L_ETA_AP1), Figure S2: Lecce stone treated with 2BU applied by brushing till saturation AP1 (L_2BU_AP1), Figure S3: Lecce stone treated with CAL applied by brushing till saturation AP1 (L_CAL_AP1), Figure S4: Lecce stone treated with ETA applied through absorption by capillarity AP2 (L_ETA_AP2), Figure S5: Lecce stone treated with 2BU applied through absorption by capillarity AP2 (L_2BU_AP2), Figure S6: Lecce stone treated with CAL applied through absorption by capillarity AP2 (L_CAL_AP2), Figure S7: Noto stone treated with ETA applied by brushing till saturation AP1 (N_ETA_AP1), Figure S8: Noto stone treated with 2BU applied by brushing till saturation AP1 (N_2BU_AP1), Figure S9: Noto stone treated with CAL applied by brushing till saturation AP1 (N_CAL_AP1), Figure S10: Noto stone treated with CAL applied through absorption by capillarity AP2 (N_CAL_AP2), Figure S11: Vicenza stone treated with ETA applied by brushing till saturation AP1 (V_ETA_AP1), Figure S12: Vicenza stone treated with NBU applied by brushing till saturation AP1 (V_NBU_AP1), Figure S13: Vicenza stone treated with CAL applied by brushing till saturation AP1 (V_CAL_AP1), Figure S14: Vicenza stone treated with ETA applied through absorption by capillarity AP2 (V_ETA_AP2), Figure S15: Vicenza stone treated with 2BU applied through absorption by capillarity AP2 (V_2BU_AP2), Figure S16. Vicenza stone treated with CAL applied through absorption by capillarity AP2 (V_CAL_AP2).
Author Contributions
Conceptualization, M.Z., E.Z. and P.T.; Methodology, all.; Software, M.Z., D.C. and N.E.H.; Validation, all.; Formal Analysis, M.Z., D.C. and N.E.H.; Investigation, all; Resources, E.Z., P.T., D.C. and J.D.-R.; Data Curation, all; Writing-Original Draft Preparation, M.Z.; Writing-Review & Editing, all.; Visualization, M.Z.; Supervision, E.Z., P.T., D.C. and J.D.-R.; Project Administration, E.Z. and P.T.; Funding Acquisition, E.Z. and P.T.
Funding
This research received no external funding.
Acknowledgments
The Nanomatch Project (Nano-systems for the conservation of immovable and moveable polymaterial Cultural Heritage in a changing environment FP7/2007-2013) has received funding from the European Union’s Seventh Program for research, technological development and demonstration under grant agreement [No. 283182]. Stefano Legnaioli for the support in statistical elaboration.
Conflicts of Interest
The authors declare no conflict of interest.
References
- Favaro, M.; Mendichi, R.; Ossola, F.; Russo, U.; Simon, S.; Tomasin, P.; Vigato, P.A. Evaluation of polymers for conservation treatments of outdoor exposed stone monuments. Part I: Photo-oxidative weathering. Polym. Degrad. Stab. 2006, 91, 3083–3096. [Google Scholar] [CrossRef]
- Favaro, M.; Mendichi, R.; Ossola, F.; Simon, S.; Tomasin, P.; Vigato, P.A. Evaluation of polymers for conservation treatments of outdoor exposed stone monuments. Part II: Photo-oxidative and salt-induced weathering of acrylic-silicone mixtures. Polym. Degrad. Stab. 2007, 92, 335–351. [Google Scholar] [CrossRef]
- Cappitelli, F.; Principi, P.; Pedrazzani, R.; Toniolo, L.; Sorlini, C. Bacterial and fungal deterioration of the Milan Cathedral marble treated with protective synthetic resins. Sci. Total Environ. 2007, 385, 172–181. [Google Scholar] [CrossRef] [PubMed]
- Pozo-Antonio, J.S.; Otero, J.; Alonso, P.; Mas, X. Nanolime- and nanosilica-based consolidants applied on heated granite and limestone: Effectiveness and durability. Constr. Build. Mater. 2019, 201, 852–870. [Google Scholar] [CrossRef]
- D’Armada, P.; Hirst, E. Nano-Lime for Consolidation of Plaster and Stone Nano-Lime for Consolidation of Plaster and Stone. J. Archit. Conserv. 2012, 18, 63–80. [Google Scholar] [CrossRef]
- Final Report Summary—NANOMATCH (Nano-Systems for the Conservation of Immoveable and Moveable Polymaterial Cultural Heritage in a Changing Environment). Available online: http://cordis.europa.eu/result/rcn/163221_en.html (accessed on 28 January 2019).
- Natali, I.; Tomasin, P.; Becherini, F.; Bernardi, A.; Ciantelli, C.; Favaro, M.; Favoni, O.; Pérez, V.J.F.; Olteanu, I.D.; Dolores, M.; et al. Innovative consolidating products for stone materials: Field exposure tests as a valid approach for assessing durability. Herit. Sci. 2015, 3, 6. [Google Scholar] [CrossRef]
- Bourguignon, E.; Tomasin, P.; Detalle, V.; Vallet, J.; Labouré, M.; Olteanu, I.; Chiurato, M.A.; Bernardi, A.; Becherini, F. Calcium alkoxides as alternative consolidants for wall paintings: Evaluation of their performance in laboratory and on site, on model and original samples, in comparison to conventional products. J. Cult. Herit. 2017, 29, 54–66. [Google Scholar] [CrossRef]
- Favaro, M.; Chiurato, M.; Tomasin, P.; Ossola, F.; El Habra, N.; Svensson, I.; Beckers, E.; Bernardi, A. Calcium and magnesium alkoxides for conservation treatment of stone and wood in built heritage. In Built Heritage 2013 Monitoring Conservation Management; Springer: Cham, Switzerland, 2013; pp. 1296–1303. [Google Scholar]
- Ossola, F.; Tomasin, P.; De Zorzi, C.; El Habra, N.; Chiurato, M.; Favaro, M. New Calcium Alkoxides for Consolidation of Carbonate Rocks. Influence of Precursors’ characteristics on morphology, crystalline phase and consolidation effects. New J. Chem. 2012, 36, 2618–2624. [Google Scholar] [CrossRef]
- Favaro, M.; Tomasin, P.; Ossola, F.; Vigato, P.A. A novel approach to consolidation of historical limestone: the calcium alkoxides. Appl. Organomet. Chem. 2008, 22, 698–704. [Google Scholar] [CrossRef]
- Zuena, M.; Tomasin, P.; Costa, D.; Delgado-Rodrigues, J.; Zendri, E. Study of Calcium Ethoxide as a New Product for Conservation of Historical Limestone. Coating 2018, 8, 103. [Google Scholar] [CrossRef]
- Favaro, M.; Chiurato, M.; Tomasin, P.; Ossola, F.; El Habra, N.; Brianese, N.; Svensson, I.; Beckers, E.; Perez, V.J.F.; Romero Sánchez, M.D.; et al. Alkaline earth alkoxides for conservation treatment of stone and wood in built heritage. In Proceedings of the 3rd European Workshop on Cultural Heritage Preservation, EWCHP 2013, Bolzano, Italy, 16–18 September 2013; pp. 105–111. [Google Scholar]
- Borsoi, G.; Lubelli, B.; van Hees, R.; Veiga, R.; Silva, A.S.; Colla, L.; Fedele, L.; Tomasin, P. Effect of solvent on nanolime transport within limestone: How to improve in-depth deposition. Colloids Surf. A Physicochem. Eng. Asp. 2016, 497, 171–181. [Google Scholar] [CrossRef]
- Gopi, S.; Subramanian, V.K.; Palanisamy, K. Aragonite–calcite–vaterite: A temperature influenced sequential polymorphic transformation of CaCO3 in the presence of DTPA. Mater. Res. Bull. 2013, 48, 1906–1912. [Google Scholar] [CrossRef]
- CaLoSiL®. Colloidal Nano-Particles of Lime for Stone and Plaster Consolidation. Available online: https://ibz-freiberg.de/downloads/pdf/produkte/tm/eng/CaLoSiL_E_IP_NP.pdf (accessed on 28 January 2019).
- Greenspan, L. Humidity fixed points of binary saturated aqueous solutions. J. Res. Natl. Bur. Stand. Sect. A Phys. Chem. 1977, 81A, 89–96. [Google Scholar] [CrossRef]
- Rodríguez Gordillo, J.; Sáez Pérez, M.P. Comportamiento físico del mármol blanco de Macael (España) por oscilación térmica de bajo y medio rango Performance of Spanish white Macael marble exposed to narrow- and medium-range temperature cycling. Materiales de Construcción 2010, 60, 127–141. (In Spanish) [Google Scholar]
- RILEM—Commission 25 PEM Protection et érosion des Monuments (1980)—“Essais recommandés pour mesurer l’ álteration des pierres et évaluer l’ efficacité des méthodes de traitement”. Matériaux de Constructions 1980, 13, 216–220. (In Spanish)
- D’Agostino, D. Moisture dynamics in an historical masonry structure: The Cathedral of Lecce (South Italy). Build. Environ. 2013, 63, 122–133. [Google Scholar] [CrossRef]
- Bergamonti, L.; Alfieri, I.; Lorenzi, A.; Predieri, G.; Barone, G.; Gemelli, G.; Mazzoleni, P.; Raneri, S.; Bersani, D.; Lottici, P.P. Nanocrystalline TiO2 coatings by sol–gel: Photocatalytic activity on Pietra di Noto biocalcarenite. J. Sol. Gel Sci. Technol. 2015, 75, 141–151. [Google Scholar] [CrossRef]
- Scrivano, S.; Gaggero, L.; Aguilar, J.G. Porosity characterization of fresh and altered stones by ultrasound velocity and mercury intrusion porosimetry. Geophys. Res. Abstr. 2016, 18, 9418. [Google Scholar]
- Delgado Rodrigues, J.; Grossi, A. Indicators and ratings for the compatibility assessment of conservation actions. J. Cult. Herit. 2007, 8, 32–43. [Google Scholar] [CrossRef]
- NORMAL 43/93 Misure Colorimetriche di Superfici Opache (Italian Normative on Stone Material-Colorimetric Measurement of Opaque Surfaces); Commissione Beni Culturali UNI NORMAL: Rome, Italy, 1994.
- Essabir, H.; Bensalah, M.O.; Rodrigue, D.; Bouhfid, R.; Qaiss, A.E.K. A comparison between bio and mineral calcium carbonate on the properties of polypropylene composites. Constr. Build. Mater. 2017, 134, 549–555. [Google Scholar] [CrossRef]
- Ropret, P.; Legan, L.; Retko, K.; Špec, T.; Pondelak, A.; Škrlep, L.; Sever Škapin, A. Evaluation of vibrational spectroscopic techniques for consolidants’ penetration depth determination. J. Cult. Herit. 2017, 23, 148–156. [Google Scholar] [CrossRef]
- Andersen, F.A.; Brečević, L. Infrared Spectra of Amorphous and Crystalline Calcium Carbonate. Acta Chem. Scand. 1991, 45, 1018–1024. [Google Scholar] [CrossRef]
- Meiron, O.E.; Bar-David, E.; Aflalo, E.D.; Shechter, A.; Stepensky, D.; Berman, A.; Sagi, A. Solubility and Bioavailability of Stabilized Amorphous Calcium Carbonate. J. Bone Miner. Res. 2011, 26, 364–372. [Google Scholar] [CrossRef]
- Shen, Q.; Wei, H.; Zhou, Y.; Huang, Y.; Yang, H.; Wang, D.; Xu, D. Properties of amorphous calcium carbonate and the template action of vaterite spheres. J. Phys. Chem. B 2006, 110, 2994–3000. [Google Scholar] [CrossRef] [PubMed]
- Cumaran Arunasalam, V.; Baxter, I.; Darr, J.A.; Drake, S.R.; Hursthouse, M.B.; Abdul Malik, K.M.; Mingos, D.M.P. Insertion reactions of small molecules into group 2 metal alkoxides; structural characterization of [Mg9(-CO3)(O2COMe)8(-OMe)8(MeOH)13]∙MeOH∙C7H8. Polyhedron 1998, 17, 641–657. [Google Scholar] [CrossRef]
- Rodriguez-Blanco, J.D.; Shaw, S.; Benning, L.G. The kinetics and mechanisms of amorphous calcium carbonate (ACC) crystallization to calcite, via vaterite. Nanoscale 2011, 3, 265–271. [Google Scholar] [CrossRef] [PubMed]
- Chen, S.F.; Yu, S.H.; Hang, J.; Li, F.; Liu, Y. Polymorph discrimination of CaCO3 mineral in an ethanol/water solution: Formation of complex vaterite superstructures and aragonite rods. Chem. Mater. 2006, 18, 115–122. [Google Scholar] [CrossRef]
- Ogino, T.; Suzuki, T.; Sawada, K. The formation and transformation mechanism of calcium carbonate in water. Geochim. Cosmochim. Acta 1987, 51, 2757–2767. [Google Scholar] [CrossRef]
- Manoli, F.; Dalas, E. Spontaneous precipitation of calcium carbonate in the presence of ethanol, isopropanol and diethylene glycol. J. Cryst. Growth 2000, 218, 359–364. [Google Scholar] [CrossRef]
- Easton, A.J.; Claugher, D. Variations in a growth form of synthetic vaterite. Mineral. Mag. 1986, 50, 332–336. [Google Scholar] [CrossRef]
- Dickinson, S.R.; Henderson, G.E.; McGrath, K.M. Controlling the kinetic versus thermodynamic crystallisation of calcium carbonate. J. Cryst. Growth 2002, 244, 369–378. [Google Scholar] [CrossRef]
- López-Arce, P.; Gómez-Villalba, L.S.; Martínez-Ramírez, S.; Alvarez de Buergo, M.; Fort, R. Influence of relative humidity on the carbonation of calcium hydroxide nanoparticles and the formation of calcium carbonate polymorphs. Powder Technol. 2011, 205, 263–269. [Google Scholar] [CrossRef] [Green Version]
Scheme 1.
Possible reaction pathways for the formation of CaCO3 from Ca(OEt)2.

Figure 1.
Fourier transform infrared spectroscopy (μFT-IR) spectra showing the kinetic process of 2BU: (a) all spectra recorded at different times, (b) spectrum acquired after two minutes and (c) spectrum acquired after six hours. Time intervals: Start, beginning of the reaction (black); 6m, six minutes (red); 10m, ten minutes (blue); 6h, six hours (orange); 2w, two weeks (green).

Figure 2.
µFT-IR spectrum acquired after three minutes from the beginning of the analysis showing the reaction pathway of carbonation process for 2BU.
Figure 2.
µFT-IR spectrum acquired after three minutes from the beginning of the analysis showing the reaction pathway of carbonation process for 2BU.

Figure 3.
µFT-IR spectra showing the kinetic process of NBU: (a) all spectra recorded at different times (b) spectrum acquired after six minutes and (c) spectrum acquired after six hours. Time intervals: Start, beginning of the reaction (black); 6m, six minutes (red); 10m, ten minutes (blue); 6h, six hours (orange); 2w, two weeks (green).

Figure 4.
µFT-IR spectrum acquired after seven minutes from the beginning of the analysis showing the reaction pathway of carbonation process for NBU.
Figure 4.
µFT-IR spectrum acquired after seven minutes from the beginning of the analysis showing the reaction pathway of carbonation process for NBU.

Figure 5.
X-ray diffraction (XRD) and µFT-IR analyses of 2BU after two weeks: (a) XRD pattern at 50% relative humidity (RH) (2BU50_2W) (b) µFT-IR spectrum at 50% RH (2BU50_2W), (c) XRD pattern at 90% RH (2BU90_2W) and (d) µFT-IR spectrum at 90% RH (2BU90_2W). XRD peak assignments: C, calcite; V, vaterite.

Figure 6.
XRD and µFT-IR analyses of NBU after two weeks: (a) XRD pattern at 50% RH (NBU50_2W), (b) µFT-IR spectrum 50% RH (NBU50_2W), (c) XRD pattern at 90% RH (NBU90_2W) and (d) µFT-IR spectrum at 90% RH (NBU90_2W). XRD peak assignments: C, calcite; V, vaterite.
Figure 6.
XRD and µFT-IR analyses of NBU after two weeks: (a) XRD pattern at 50% RH (NBU50_2W), (b) µFT-IR spectrum 50% RH (NBU50_2W), (c) XRD pattern at 90% RH (NBU90_2W) and (d) µFT-IR spectrum at 90% RH (NBU90_2W). XRD peak assignments: C, calcite; V, vaterite.

Figure 7.
NBU after three months at 50% RH (NBU50_3M): (a) XRD pattern and (b) µFT-IR spectrum. XRD peak assignments: V, vaterite.
Figure 7.
NBU after three months at 50% RH (NBU50_3M): (a) XRD pattern and (b) µFT-IR spectrum. XRD peak assignments: V, vaterite.

Figure 8.
Lecce stone treated with NBU applied by brushing till saturation AP1 (L_NBU_AP1): (a) drilling resistance and (b) UPV profile. NT: Untreated stone.
Figure 8.
Lecce stone treated with NBU applied by brushing till saturation AP1 (L_NBU_AP1): (a) drilling resistance and (b) UPV profile. NT: Untreated stone.

Figure 9.
Lecce stone treated with NBU applied through absorption by capillarity AP2 (L_NBU_AP2): (a) drilling resistance and (b) UPV profile. NT: untreated stone.
Figure 9.
Lecce stone treated with NBU applied through absorption by capillarity AP2 (L_NBU_AP2): (a) drilling resistance and (b) UPV profile. NT: untreated stone.

Figure 10.
Noto stone treated with NBU applied by brushing till saturation AP1 (N_NBU_AP1): (a) drilling resistance and (b) UPV profile. NT: Untreated stone.
Figure 10.
Noto stone treated with NBU applied by brushing till saturation AP1 (N_NBU_AP1): (a) drilling resistance and (b) UPV profile. NT: Untreated stone.

Figure 11.
Noto stone treated through absorption by capillarity AP2: (a) drilling resistance of sample treated with NBU (N_NBU_AP2), (b) UPV profile of sample treated with NBU (N_NBU_AP2), (c) drilling resistance of sample treated with 2BU (N_2BU_AP2), (d) UPV profile of sample treated with 2BU (N_2BU_AP2), (e) drilling resistance of sample treated with ETA (N_ETA_AP2), (f) UPV profile of sample treated with ETA (N_ETA_AP2). NT: Untreated stone.


Figure 12.
Vicenza stone treated with 2BU applied by brushing till saturation AP1 (V_2BU_AP1): (a) drilling resistance and (b) UPV profile. NT: Untreated stone.
Figure 12.
Vicenza stone treated with 2BU applied by brushing till saturation AP1 (V_2BU_AP1): (a) drilling resistance and (b) UPV profile. NT: Untreated stone.

Figure 13.
Vicenza stone treated with NBU applied through absorption by capillarity AP2 (V_NBU_AP2): (a) drilling resistance and (b) UPV profile. NT: Untreated stone.
Figure 13.
Vicenza stone treated with NBU applied through absorption by capillarity AP2 (V_NBU_AP2): (a) drilling resistance and (b) UPV profile. NT: Untreated stone.

© 2019 by the authors. Licensee MDPI, Basel, Switzerland. This article is an open access article distributed under the terms and conditions of the Creative Commons Attribution (CC BY) license (http://creativecommons.org/licenses/by/4.0/).
Share and Cite
MDPI and ACS Style
Zuena, M.; Zendri, E.; Costa, D.; Delgado-Rodrigues, J.; El Habra, N.; Tomasin, P. Calcium Ethoxide as Consolidant for Porous Limestones: Influence of the Solvent. Coatings 2019, 9, 83. https://doi.org/10.3390/coatings9020083
AMA Style
Zuena M, Zendri E, Costa D, Delgado-Rodrigues J, El Habra N, Tomasin P. Calcium Ethoxide as Consolidant for Porous Limestones: Influence of the Solvent. Coatings. 2019; 9(2):83. https://doi.org/10.3390/coatings9020083
Chicago/Turabian StyleZuena, Martina, Elisabetta Zendri, Dória Costa, José Delgado-Rodrigues, Naida El Habra, and Patrizia Tomasin. 2019. "Calcium Ethoxide as Consolidant for Porous Limestones: Influence of the Solvent" Coatings 9, no. 2: 83. https://doi.org/10.3390/coatings9020083
Note that from the first issue of 2016, this journal uses article numbers instead of page numbers. See further details here.