
Tiles from Aosta: A Peculiar Glaze Roof Covering


Department of Environmental Sciences, Informatics, Statistics, Ca’ Foscari University of Venice, Scientific Campus—Via Torino 155, 30170 Venezia Mestre, Italy
*
Author to whom correspondence should be addressed.
Colorants 2023, 2(3), 533-551; https://doi.org/10.3390/colorants2030026
Submission received: 26 May 2023
/
Revised: 4 July 2023
/
Accepted: 2 August 2023
/
Published: 14 August 2023
Abstract
:The 18th century roof tiles from the “Casa delle vigne”, located in the Aosta region (north-east Italy), were investigated as an example of a peculiar historical roof covering: ceramic tiles with a lead-based glaze finishing to waterproof them are used to create colourful patterns. A conservation project proposed the integration of the original tiles with new ones, produced according to traditional methods. Ancient and new tiles were analysed with Fiber Optics Reflectance Spectroscopy, micro-Raman, Fourier Transform Infrared Spectroscopy and X-ray Fluorescence Spectrometry, Thermogravimetry and Differential Scanning Calorimetry for understanding the composition and the production technology of this manufacture. Their resistance to freezing and thawing cycles was then tested, considering their exposure in the severe alpine climate of Aosta. The use of pure clays with low calcium contents, high firing temperature and lead-rich glazes was found in ancient tiles, able to outstand several freezing-thawing cycles without damages. Iron and copper pigments were used in old yellow and green glazes. Zinc-based pigment, low lead and calcium-rich glazes are used in the new ones, which remained mainly coherent to the ceramic body during the freeze-thaw test.
1. Introduction
Glazed roof tiling has been widely used both in the eastern and western world for centuries [1]. Glazing allows the obtainment of a perfect and durable material for roof protection against meteorological precipitation, and the possibility to colour them creates patterns of unique decorative beauty. The conservation of those materials, however, poses some challenges to the restorers linked to the original and local compositions, shapes, colouring elements, and their resistance in relation to the surrounding environment. This work presents the case study of the glazed tiles of “Casa delle Vigne” in Aosta (Italy). It is a peculiar case of glazed tile roof finishing considering that the employment of glazed tiles is not typical of the region. During the first survey phase of the conservation project for “Casa delle Vigne”, it was observed that the ancient tiles have an outstanding resistance to the severe alpine climate of the Aosta region. Thus, the composition and characteristics of the tiles were investigated in order to understand the manufacturing technology and their durability/resistance. The conservation project proposed the substitution of lost or deteriorated original tiles with new ones, produced according to traditional methods in the nearby Piedmont region (north Italy). The composition of the new tile was verified and then their resistance to freeze-thaw was tested in comparison to the original one.
The “Casa delle vigne” (Figure 1) is a small pavilion located in the vineyard of the village of Pallin in Aosta Valley, Northern Italy. The building was constructed at the end of the 18th century by the noble Passerin D’Entrèves family as a facility serving the vineyard [2]. The pavilion stands out thanks to the roof covered with colourful glazed fish scale tiles. It is a roof covering peculiar for the Aosta region, but fashionable and used in the same years in Piedmont and typical in France. It is possible, given the high profile of the owners, that the tiles were imported from the nearby Piedmont region.
The presence of important ceramic centers in Piedmont was attested between the XVII and the XIX centuries. In the cities of Asti, Turin, Castellamonte, Biella and Mondovì, there was a rich production of ceramic objects, as demonstrated by several historic documents [3,4]. In the article “Tegole ed Embrici Antichi e Moderni” (Ancient and Modern Roofing Tiles and Embrici) by Riccardo Brayda, different examples of glazed tiles, like the Pallin’s ones and those not older than the XVII century, were described. Brayda praises their durability and colour effects and explains how they were made and how they were employed on buildings. In particular, the text cites: “white and yellow glaze were obtained immerging the ceramic body into barboutine (lead and tin oxide mixture) called Potét d’Etain; the green glaze was obtained adding to the mixture black copper oxide. These tiles protect the wooden structure of roofs as they are resistant to humidity penetration and prevent lichen growth. The tiles are usually disposed like fish scales (Figure 1 right). They can have a hole to be fixed to the structure of the roof through a nail, or they have an adjunct on the back that allows them to be clipped onto the beams.
The general conservation state of the “Casa delle Vigne” pavilion is not critical; however, the failing of nails caused tile detachments and falls, rupture of tiles and tile shifts due to meteoric events (hails, winds), provoking the formation of holes in the roof that allowed water to enter, threatening the floors and the entire building structure. A restoration intervention was therefore compelling.
To obtain materials with compatible aesthetical characteristics, the handcrafted tiles produced by the workshop of Castellamonte “Associazione Centro Ceramico Museo Fornace Pagliero 1814” directed by ceramist Daniele Chechi were selected by the restorer for replacing decayed and lost tiles [5]. These tiles are produced according to the traditional techniques employed in the 18th century in Piedmont.
In this research work, the first aim was to understand the materials and characteristics of the original 18th century tiles and the new ones. The second was to compare the resistance of the new versus the original tiles when subjected to freeze-thawing cycles in terms of possible aesthetic and durability differences.
The main degradation agent for ceramic materials with open and interconnected porosity is water. Water can reach the material due to capillarity, through direct action (i.e., rain, fog) or through condensation from the gaseous state when the surface temperature is below the dew temperature of the air [6,7]. Water degradation can act directly through physical action, indirectly by transporting salts and pollutants, and finally can promote the growth of microorganisms. In the Alpine environment, the main concern for water in substrates with interconnected porosity is degradation by frequent freezing and thawing alternation. The volume change linked to freeze-thawing cycles of water within the ceramic pores causes cracks, new pores, delamination, and exfoliation of the surface [8,9,10].
2. Materials and Methods
2.1. The Site and the Historical Tiles
The “Casa delle Vigne” pavillion was constructed at the end of the 18th century by the noble Passerin D’Entrèves family, as a facility serving the vineyard. In addition to practical functions, derived from the presence of a storeroom and a small kitchen, the house also had ceremonial functions welcoming guests visiting the vineyard. In the mid-20th century, it was employed as a model farm by the San Bernardo Hospice House to teach land management to the students of the newly founded l’Ecole pratique d’agriculture. Today, the vineyard is newly active, as it hosts the cultivation of experimental vines of the Instituit Agricole Régional, a training school opened in the 1980s, on the ashes of the practical school of agriculture [2].
The hexagonal pavilion consists of two floors; on the ground floor there is the entrance flanked by two windows, and on the upper floor there is a small balcony and two windows with green shutters. The most characteristic part of the building is the polychrome roof, composed by glazed fish scale roof tiles.
A single tile is approximately 25 cm long, 16.5 cm large and 1.5 cm thick. The exposed part of the tile is covered with a coloured glaze, a layer that has both a decorative and a protective function (Figure 2A sample 13V). The tiles are fixed to the wooden structure of the roof through iron nails inserted in the hole that each scandola has on its top part. In addition to the original tiles, there are painted metal tiles which probably were used to replace missing tiles over time. In total, the roof, counting both present and missing tiles, is covered with more than 5100 tiles. The number of missing tiles is approximately 840, and the number of tiles with partially damaged glazing is 2800.
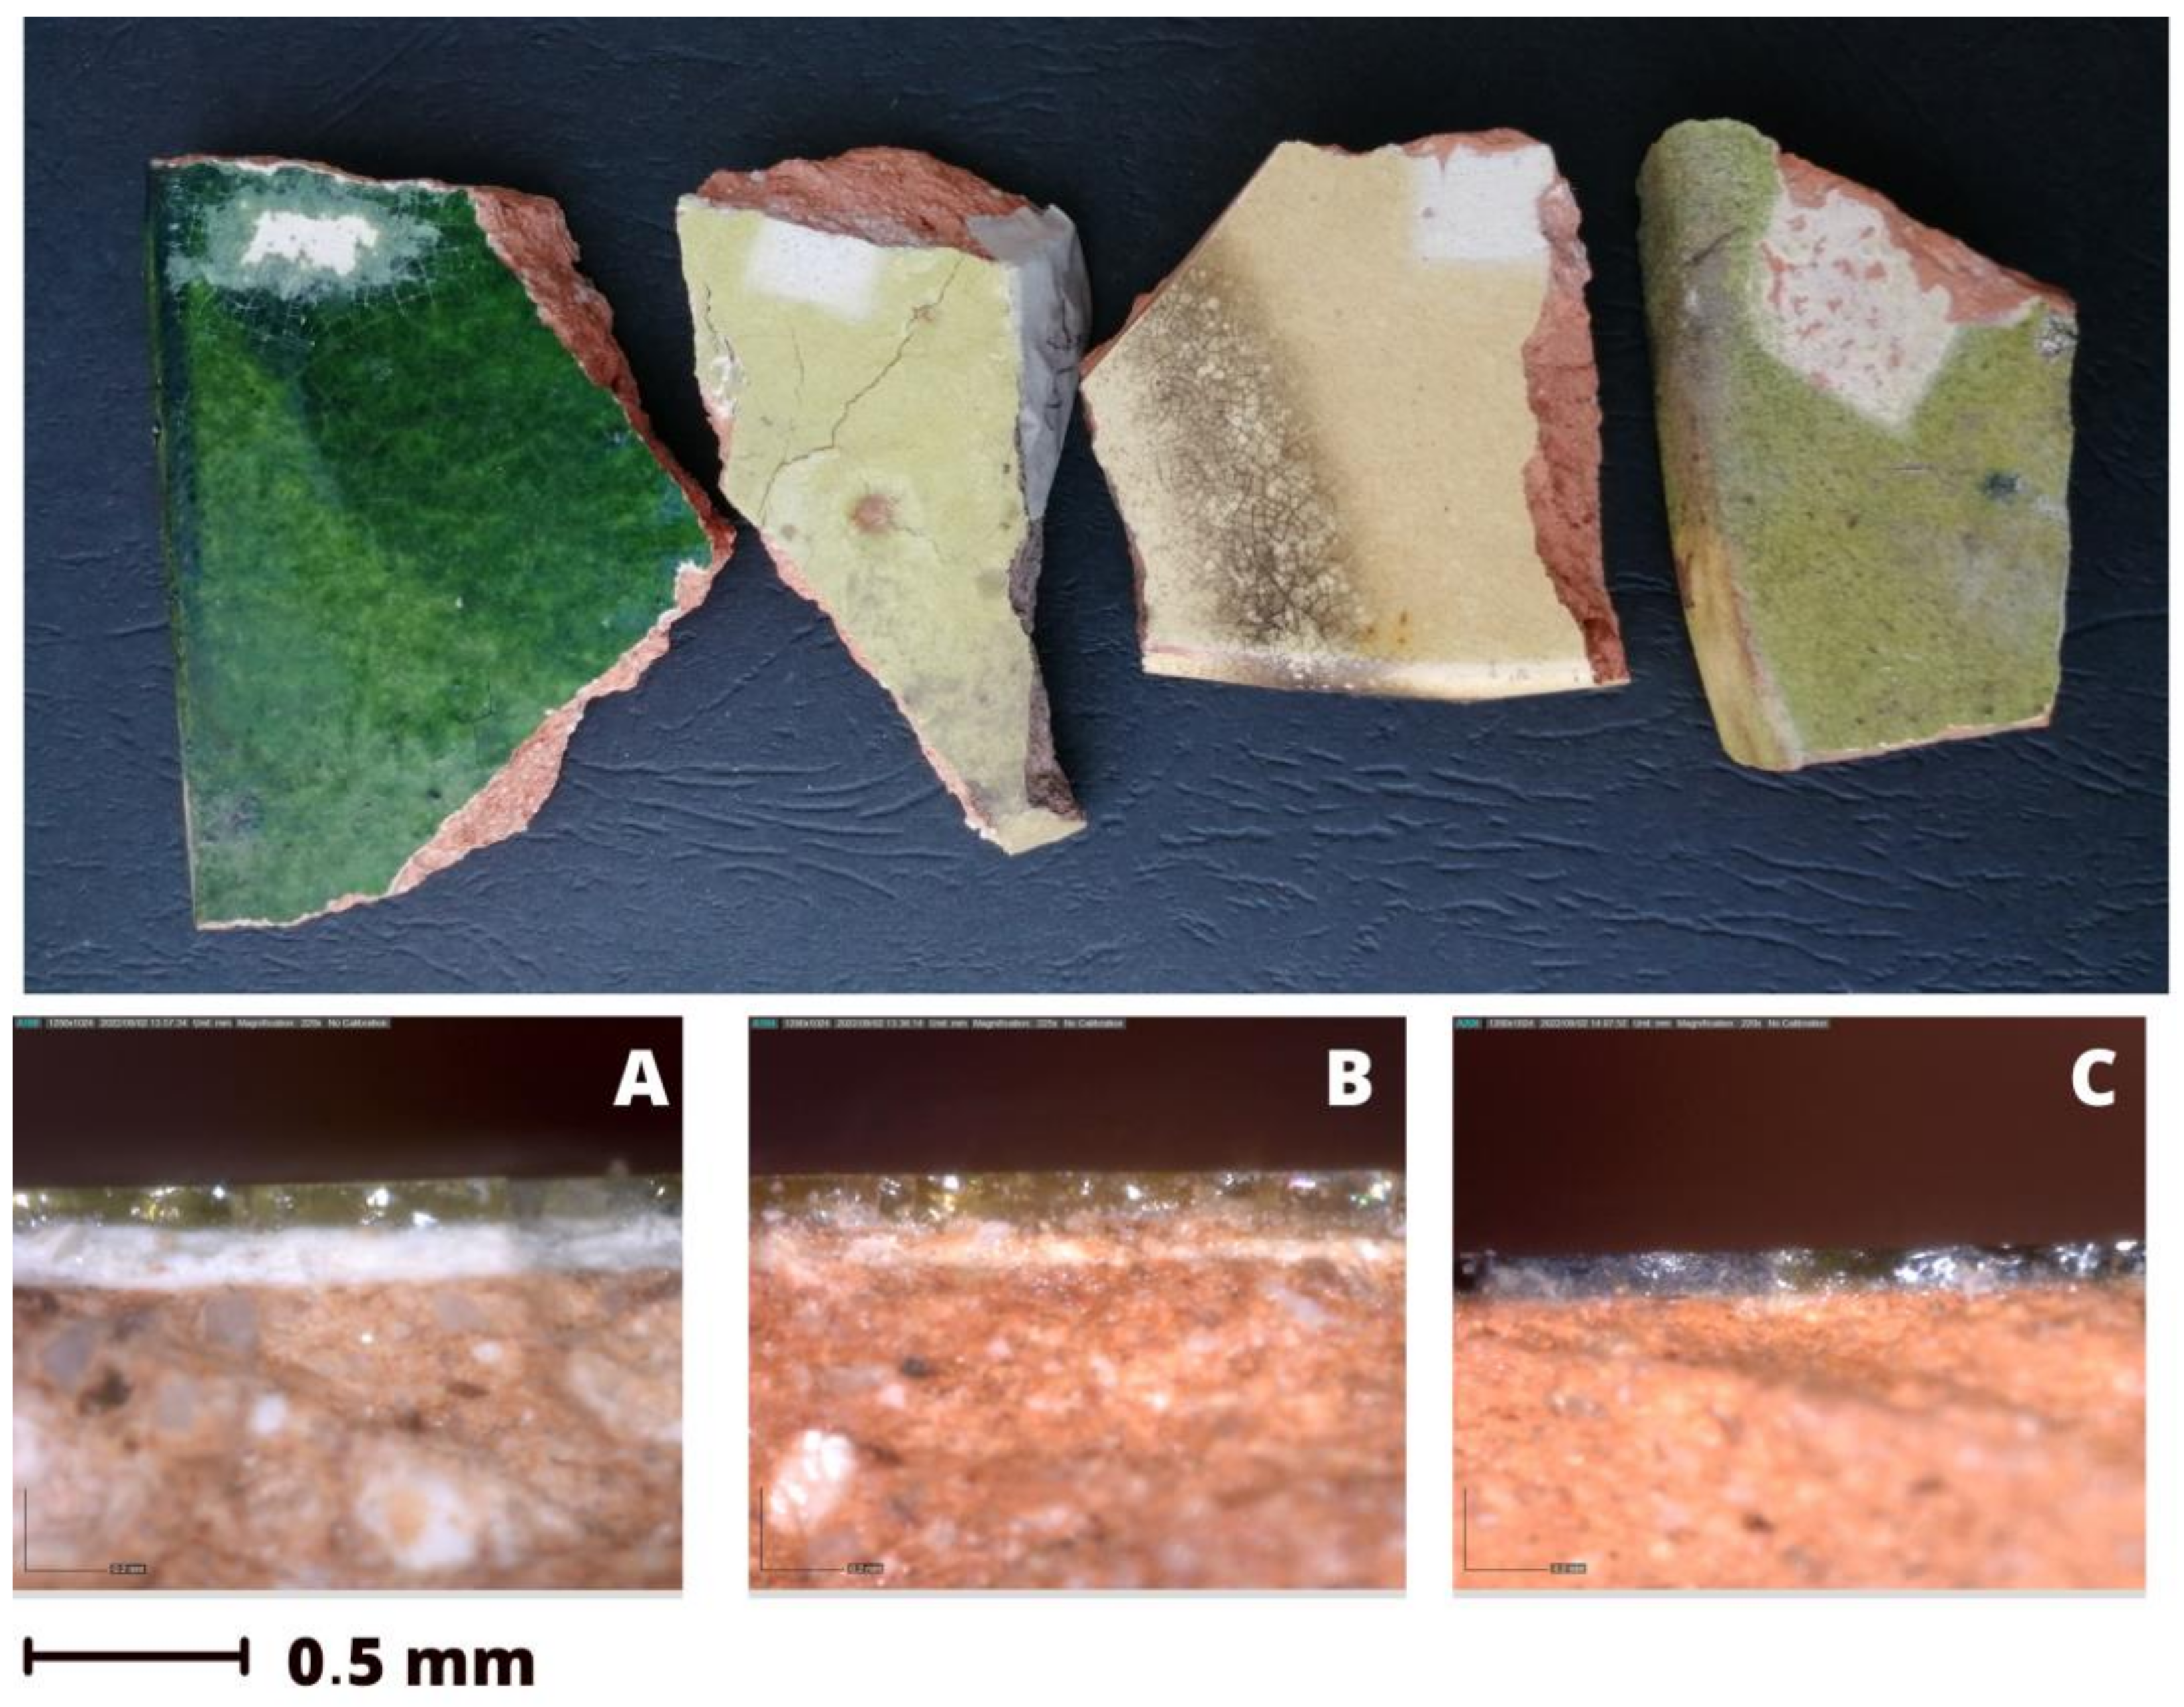
Invasive analyses were conducted on fragments from already broken tiles, which could not be restored and put in place again. The samples were selected in order to obtain the greatest variety of glaze types, choosing different colours and shades (Figure 3). The fragments can be roughly divided into green hue, yellow hue and transparent glaze ceramics, and can have a slip layer under the coloured glazing. Only non-invasive analyses were performed on the complete tiles. A new tile and a well preserved old one underwent freeze-thawing cycles to better observe and compare their resistance and behaviour.
2.2. Newly Made Tiles
New tiles for replacing the damaged and lost ones were acquired from “Associazione Centro Ceramico Museo Fornace Pagliero 1814” of Castellamonte directed by ceramist Daniele Chechi (Figure 2B sample 14G). The Fornace Pagliero’s tiles are produced following the traditional Piemontese recipe described in texts of the early 17th–late 18th century. The historical quarries are currently closed, but the artisanal workshop is allowed to use for conservation intervention the material extracted in the 1960s and 1950s from the Chiria quarry.
The clay is crushed and mixed with water to form a plastic mixture (barbottina); the mixture is then smoothed, and the tile shapes are formed by hand using a mould; the waste material is then re-used. The substrate is then left to dry and, when the clay is no longer workable, it is covered with a layer of engobe made with straw-yellow kaolin. When the substrate has completed the drying process, it is fired at temperatures above 1000 °C. After the first firing, the ceramic biscuit is covered with cristallina glaze and fired a second time at a lower temperature (900/950 °C). Cristallina is a dense liquid composed of lead oxide, pigments, transparent frits and water [11,12]. The new tiles, as the original ones, were analysed to evaluate possible differences in composition, and subjected to freeze-thawing cycles for testing their resistance with respect to the original.
2.3. Analytic Methodology
At first, a digital microscope DINO AM1143 was employed to inspect the surface morphology of the samples: on the front to observe the morphology of the glaze and to compare clean areas and stained ones; on the cross section to observe the stratigraphy of the ceramic body. More detailed images were then collected with a ZEISS Stereo Discovery V8 equipped with two ZEISS Achromat S objectives of 0.63x and 1.5x and a microscope camera ZEISS Axiocam 208 colour.
Colourimetric measurements were collected with a KONICA MINOLTA CM-2600 d/2500 d spectrophotometer equipped with CM-S100w SpectraMagicTM NX software. A D65 standard illuminant, 8 degree viewing angle geometry and a 3 mm diameter target area were used. The colourimetric parameters were analysed by considering the CIELAB colour system (CIE, 1986). For each sample, the measurement was repeated in five different random points. The mean Specular Component Included (SCI) values obtained from the analysis were used to calculate colour variations as ΔE before and after freeze-thaw cycles: ΔE = √(ΔL*2 + Δa*2 + Δb*2) with L = lightness, a = green-red component; b = blue-yellow component.
An ASD FieldSpec 4 Standard—Res Spectroradiometer at a resolution of 3 nm in the Vis-Near IR range 350–1000 nm, 8 nm in the SWIR 1000–1800, and 1800–2500 nm, endowed with a contact probe (equipped with an inner halogen light source collecting light scattered at 45° and a spot size of 1.2 cm2) was employed to collect reflectance spectra in the 350–2500 nm region. Extended reflectance spectra gave the possibility to investigate the chemical composition of the glaze in a totally non-invasive way. For data elaboration, ViewSpecPro software and Origin 8.5 were employed.
The elemental composition of the ceramic body, the glaze and the englobe (where presents) were analysed in air by using a CRONO X Ray spectrometer by Bruker with rhodium anode. For the analysis, a 1 mm collimator, 200 μA current power by 40 kV, and an acquisition time of 200 ms was employed for the analysis. The analysis set-ups were based on the literature and preliminary optimization using NIST 614 [13], commonly used for ceramic glaze-based materials. The data were collected in an air atmosphere, therefore, low Z-elements Na and Mg were not detected. XRF is a semi-quantitative technique; the calculations were conducted by using the proprietary software, checked on NIST 614 standard [13], the data obtained were considered within ±5% of accuracy for major elements, element abundances lower than 1% are indicated but not quantified, and elements with visible peaks but relative abundances lower than 0.5% were reported as traces. Preliminary data interpretation was done based on the proprietary software; further elaboration was realized with ESPRIT Bruker and Origin 8.5 to enhance graphs readability.
Four samples (Figure 3) considered as representative in terms of glaze aspect and ceramic body morphology were selected and embedded in epoxy resin for obtaining a cross section to better investigate the materials and manufacturing technique. Sample 1G had a yellow glaze realized on a white engobe; sample 3A had only a transparent glaze on the ceramic body; 7V had a green glaze on a white engobe and 12V had a green glaze applied directly on ceramic body. Next to microscopic observation, micro-Raman was also performed on the obtained cross sections. Raman is an excellent technique for studying vitreous and crystalline materials, as spectra are strictly connected to firing and production processes [14,15,16,17,18]. Raman spectra were obtained with a dispersive Raman system Thermo Scientific™ DXR3™ (Waltham, MA, USA) equipped with an Olympus microscope. The experimental parameters were laser wavelengths 532 nm, power laser of 5 mW, and 3350–50 cm−1 full range grating. A 10× and 50× objective was employed to obtain representative spectra with 25 μm-slit aperture (total acquisition time for each spectrum 120 s, initial 30 s photobleaching, automatic fluorescence correction). Raman spectra were compared with the literature for peak assignment.
Powders of 1G, 3A, 7V, 12V samples were analysed using a portable ALPHA II spectrometer by Bruker Optics® equipped with an ATR modulus with a single-bounce diamond. Spectra acquired in the range between 4000 and 400 cm−1 were obtained by collecting 64 scans with 4 cm−1 resolution.
Thermogravimetry (TG) coupled with Differential Scanning Calorimetry (DSC) allowed the further study of the firing process of ceramic artefacts [19,20]. A Netzsch 409/C apparatus was used to carried out measurements on 1G, 3A, 8V samples at a heating rate of 10 °C/min from 25 °C to 1000 °C. The instrument was purged with a mixture of air and N2 at a flow rate of 40 mL/min. Alumina was used for internal calibration. The samples were selected because of their macroscopic differences; only the ceramic paste was investigated as the glaze was not compatible with the crucible and the main aim was to understand the clay body firing.
2.4. Freeze—Thaw Cycles
Twenty freeze-thaw cycles were carried out consisting in samples imbibition, followed by freezing and subsequent defreezing at ambient temperature, adapting the procedure used in the literature [8,10]. To assure a complete capillary imbibition, ceramic tiles were placed for three hours in contact with wet sponges in a plastic box containing a thin layer (~2 mm) of distilled water. Tiles were then removed from the container, towel-dried and placed at −15 °C for three hours. The samples were then taken out of the freezer and placed in the laboratory overnight (19 °C ± 2 °C and 60% ± 5% relative humidity). During the experiment, possible surface physical-morphological variations were monitored using macro photography, microscopy observation and colourimetry. Next to those, possible weight variations were also monitored before imbibition and after imbibition.
3. Results
3.1. Optical Microscopy and Macro-Observations
Based on visual and microscopic observation, the ceramic tiles present different layers with a stratigraphy composed of a red ceramic body, the possible presence of a slip layer to enhance the glaze colours, and a glaze layer (Figure 2 and Figure 3, Table 1). The ceramic body assumes different hues of red, from a dark red paste with fine black aggregates to a light red paste with larger white aggregates. This may be related to the use of a different type of raw material or a different type of manufacturing. Colour can in fact vary depending on the raw material and on the atmosphere present in the kiln (oxidizing atmosphere produces red paste). In particular, Fe concentration and its oxidation state can highly affect the final ceramic aspect [21]. Depending on the glaze colour (greenish, yellowish or transparent), the samples can be divided in yellow, green and red tiles, respectively (Figure 3). A fair slip layer could be present in yellow and green tiles, possibly to isolate the red ceramic body and to enhance the light-coloured glaze. For the red tiles, the glaze is transparent, no slip is visible, and the hue depends directly on the red ceramic body.
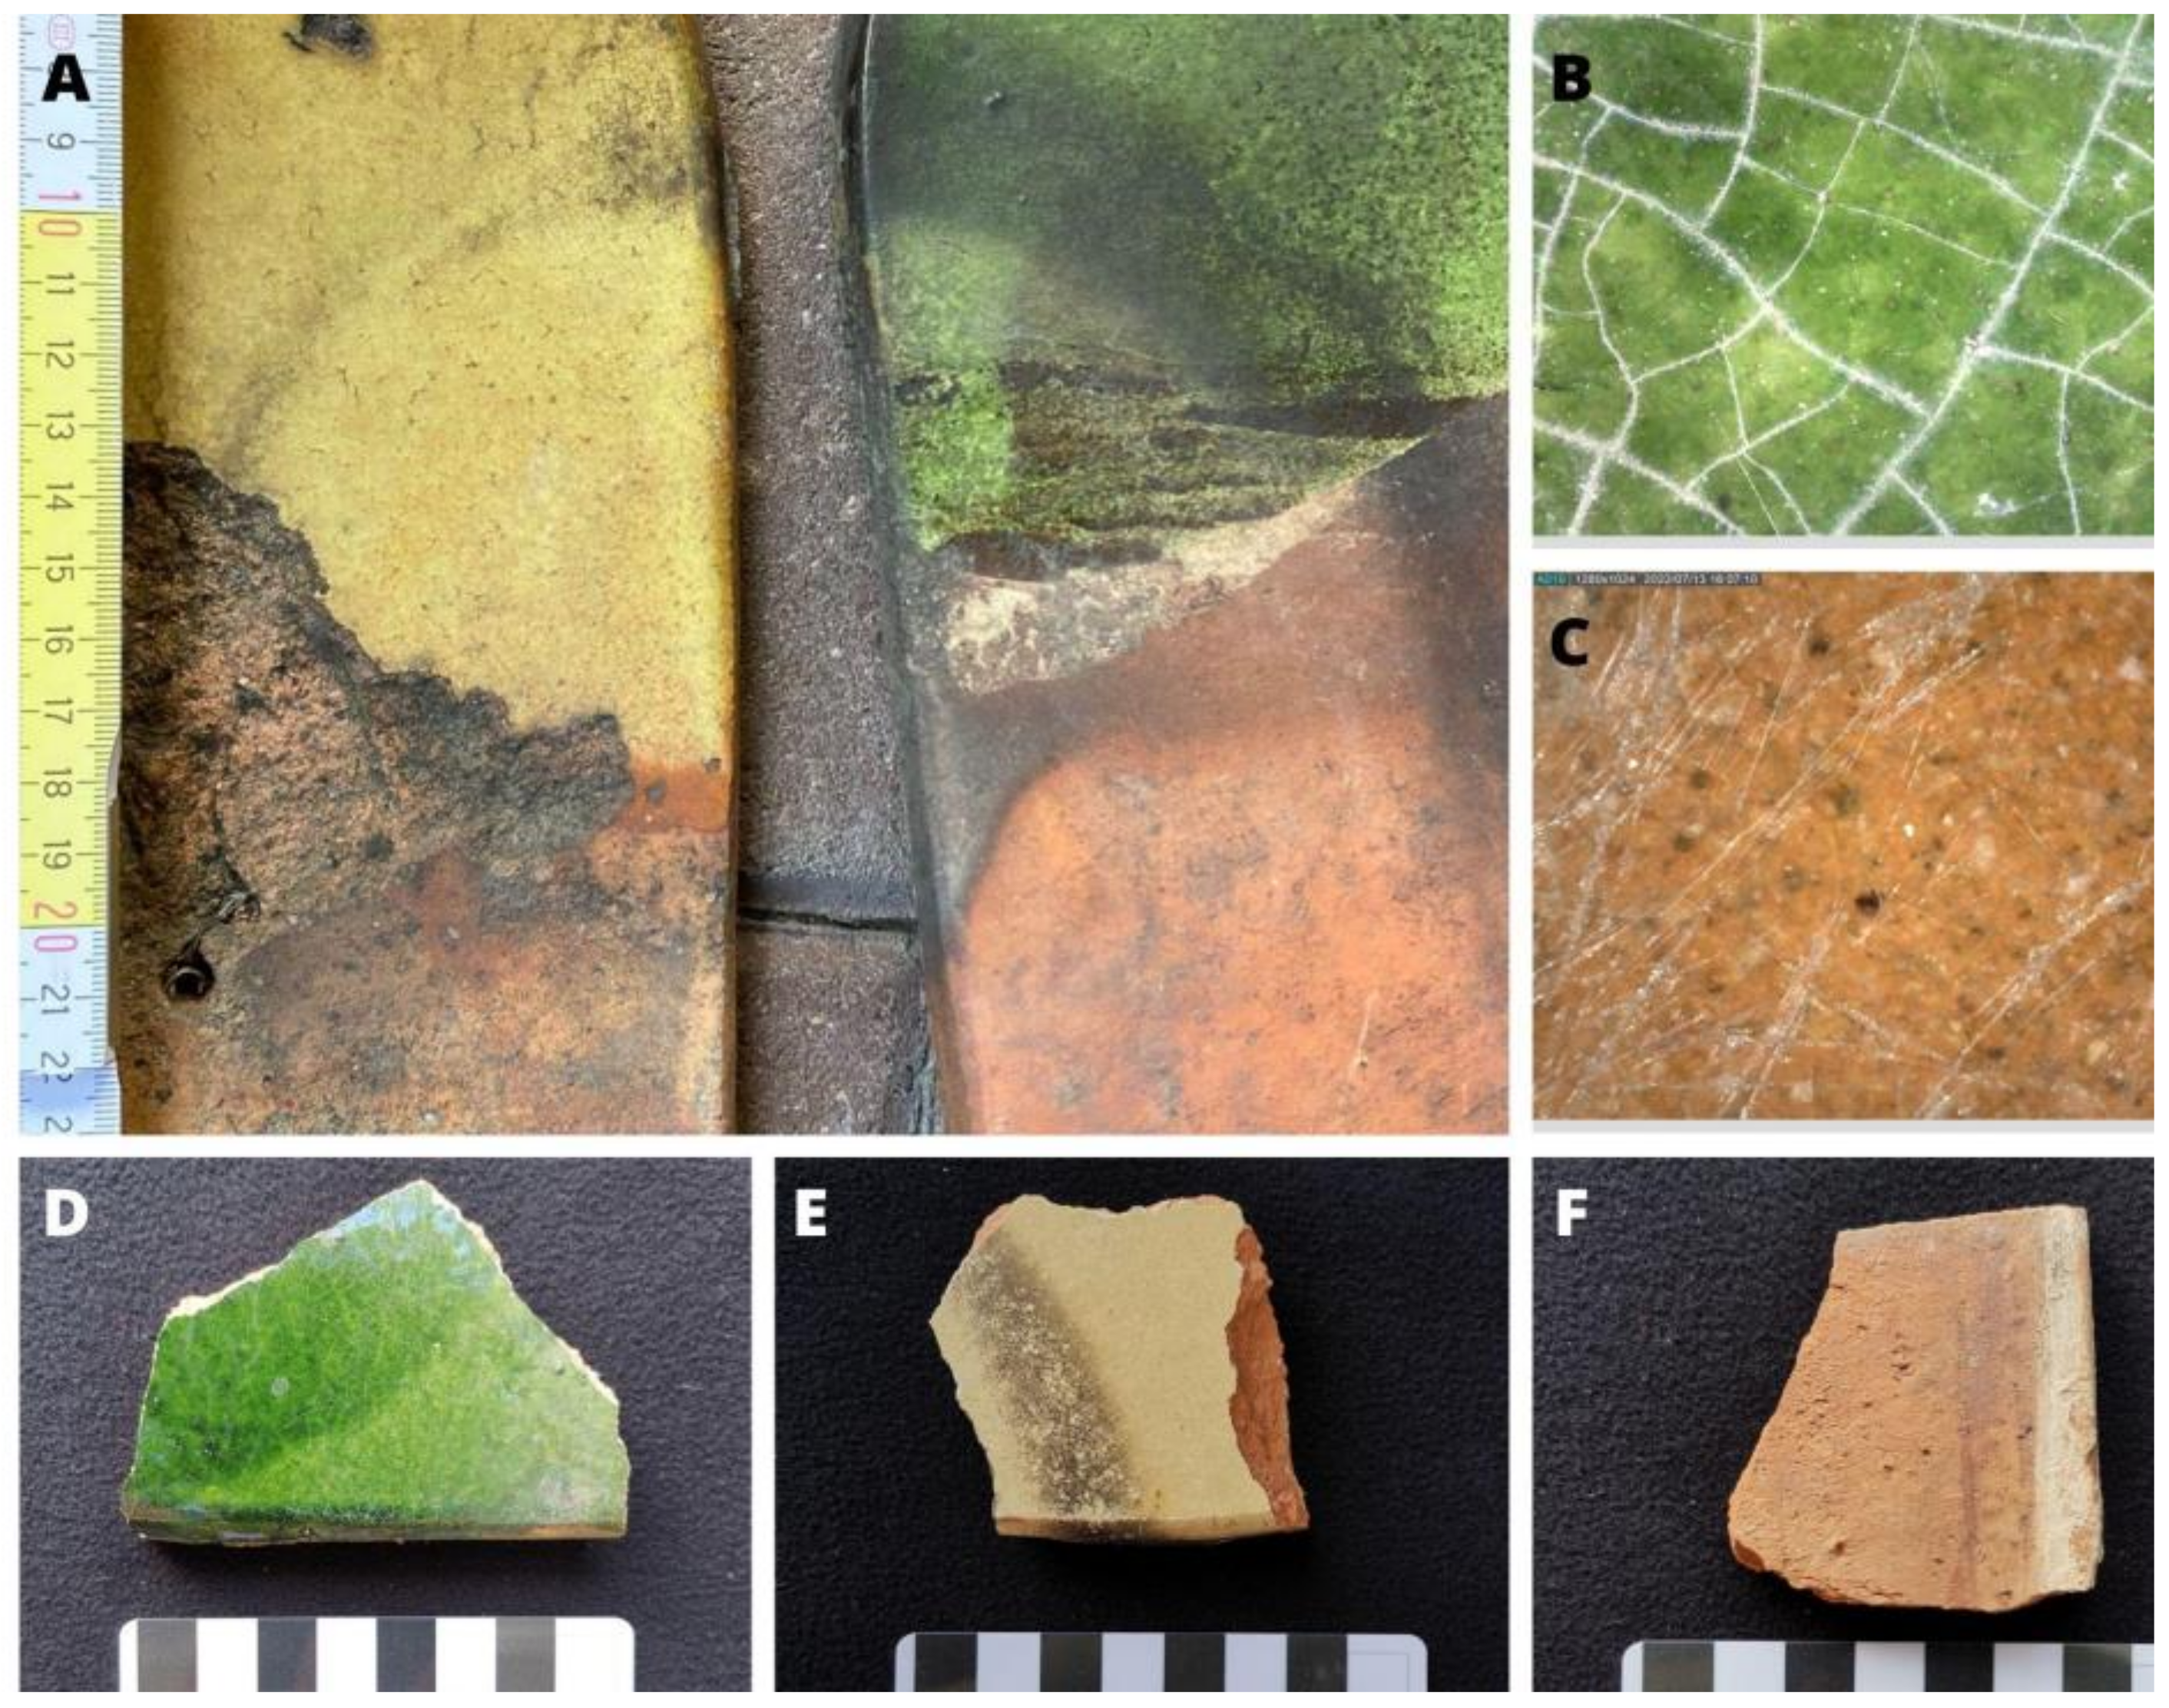
The conservation state of the tile’s surfaces (Table 1, Figure 4) depends mainly on the specific exposure to the environment. Three areas are recognizable for each tile (Figure 2A sample 13V): an external glazed area directly exposed to precipitation; a glazed area covered by the adjacent tiles; and a non-glazed area on the upper side of the tile and on the back. Dirt deposits are observed on the covered parts, while a network of cracks is visible on the glazed parts, less visible in green glazes. Despite the crack network present on almost all the samples, the glazes are extremely compact and adherent to the substrate. Several degradation processes are underway, including the formation of opaque and iridescent areas, colour variations pitting and staining. Interestingly, many of these forms of degradation are localized in the covered areas, where low atmospheric run off, pollutants deposition and water stagnation occurred, resulting in a chemical attack of glaze [22]. The new tiles by Fornace Pagliero are characterised by a yellowish-greenish hue given by a coloured glaze realized on a white slip covering the ceramic body. A dense and fine crack network is partially visible on the glaze, over the homogeneous layer of slip. Small bright stains on the glaze, typical of the hand-crafted manufacture, are also visible.
3.2. Elemental Analysis
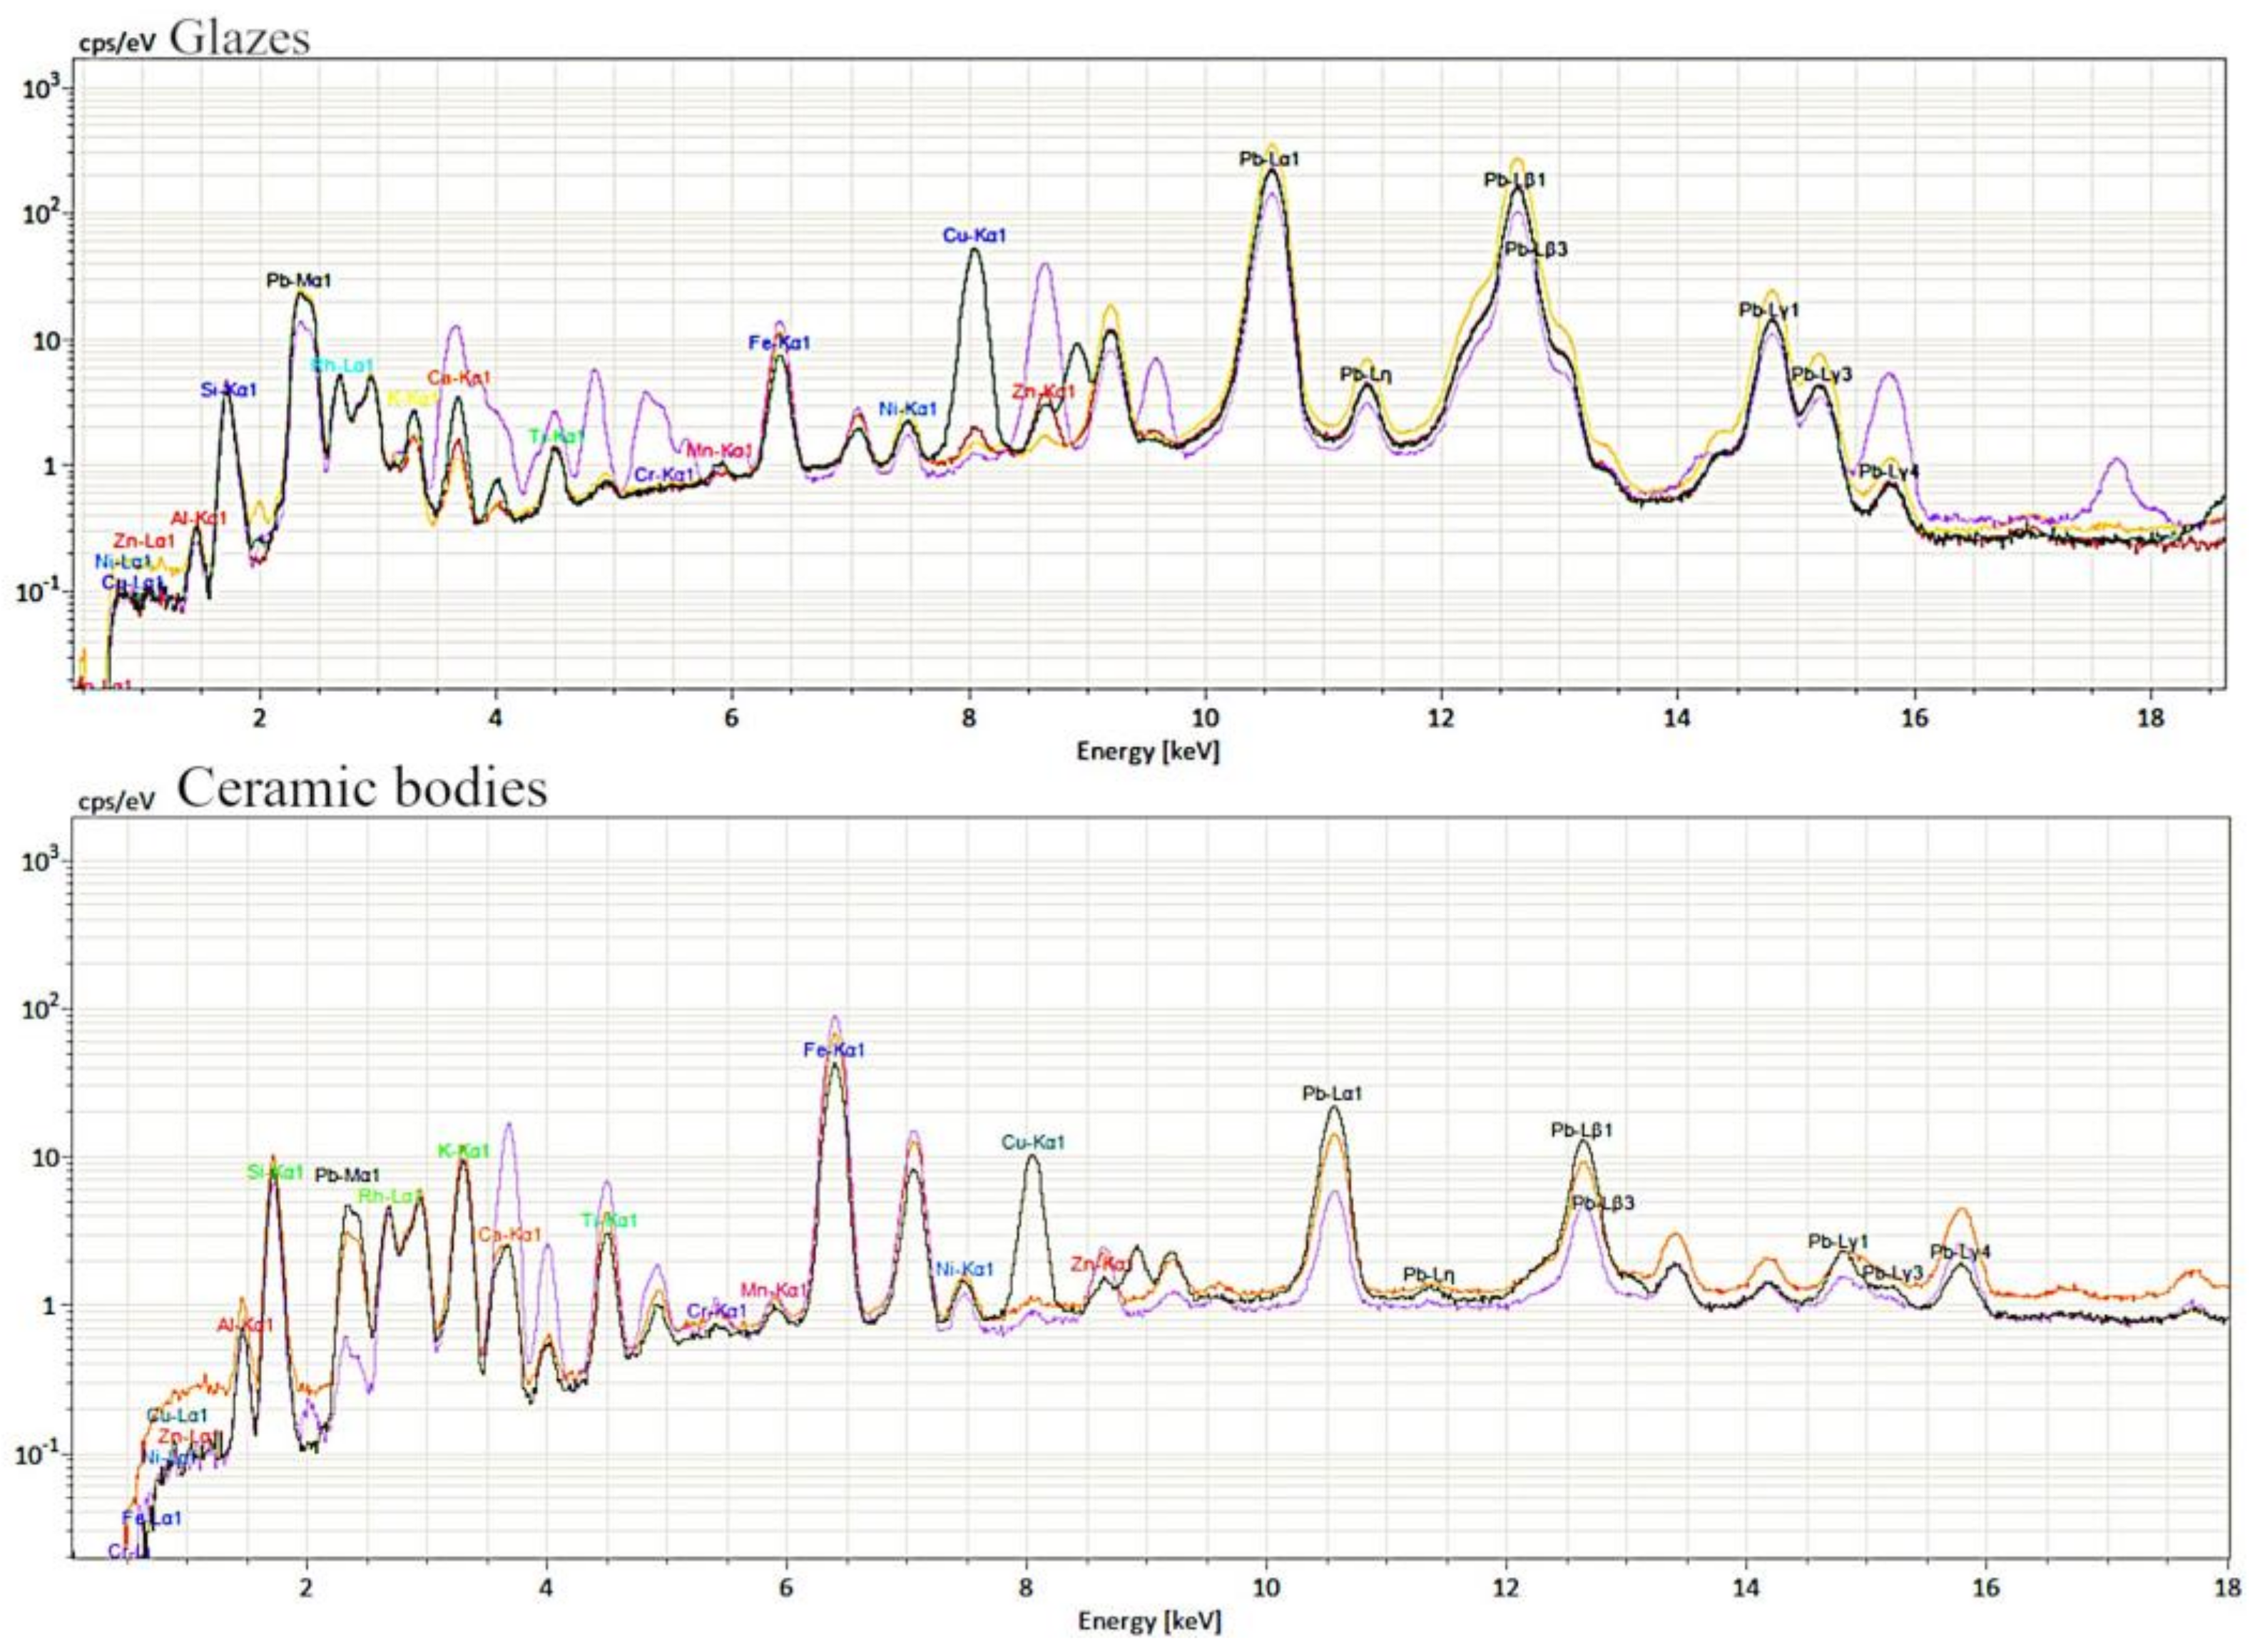
XRF analysis were carried on glazes, ceramic body and slip wherever visible. The semiquantitative analyses, allowed to compare the elements present (Figure 5, Table 2).
The ceramic body and the slip contain the typical elements of ceramics: Si, Al, K and smaller amounts of Ti, Ca, and Fe. The contents of Si, Al, Ti, K and Ca in the body and in the slip are comparable for the old tiles, while the Fe content is higher in the ceramic body (2–3 wt%) determining the colours and lower in the white clay (1%). A significantly higher amount of Ca (13%) was found in the new tiles with respect to the ancient ones. The presence of Pb in the ceramic body may be related to possible contamination from the glaze during the second cooking, or a possible addition of lead as flux.
The major constituents of the glazes are Pb (40–60 wt%), Si (35–40 wt%) and Al (6–13 wt%). The high amount of Pb confirms that it is a lead-rich glaze and Pb is used as flux and as a network former. Elements present in small concentrations and in traces in all the glaze samples are Fe, Ti, Ca and K. Iron could have been deliberately added as a colouring agent: Fe appears to be present in higher concentrations in green and in the transparent glazes, while its amount is lower in yellow samples. Moreover, green glazes are clearly distinguished from the other groups since they contain ~1% of Cu. The presence of Cu supports the hypothesis that ramina (CuO) may have been employed as a green colouring pigment [23,24]. In the case of the new tile 14 G, higher amounts of Ca (20%) and lower amounts of Pb (30%) were found. It is possible that the different starting materials and the possibility to reach easily higher firing temperatures in modern ovens allows a decrease in the lead content, or the substitution of Pb2O5 with CaO as a stabilizer and flux [25].
3.3. Spectroscopic Investigation of Old Tiles
The spectroscopic investigation of the old tiles allowed characterisation of the materials present and was conducted on the three layers of the tiles: ceramic body, slip layer and glazes and on areas at different exposures (i.e., covered, exposed to rainfall).
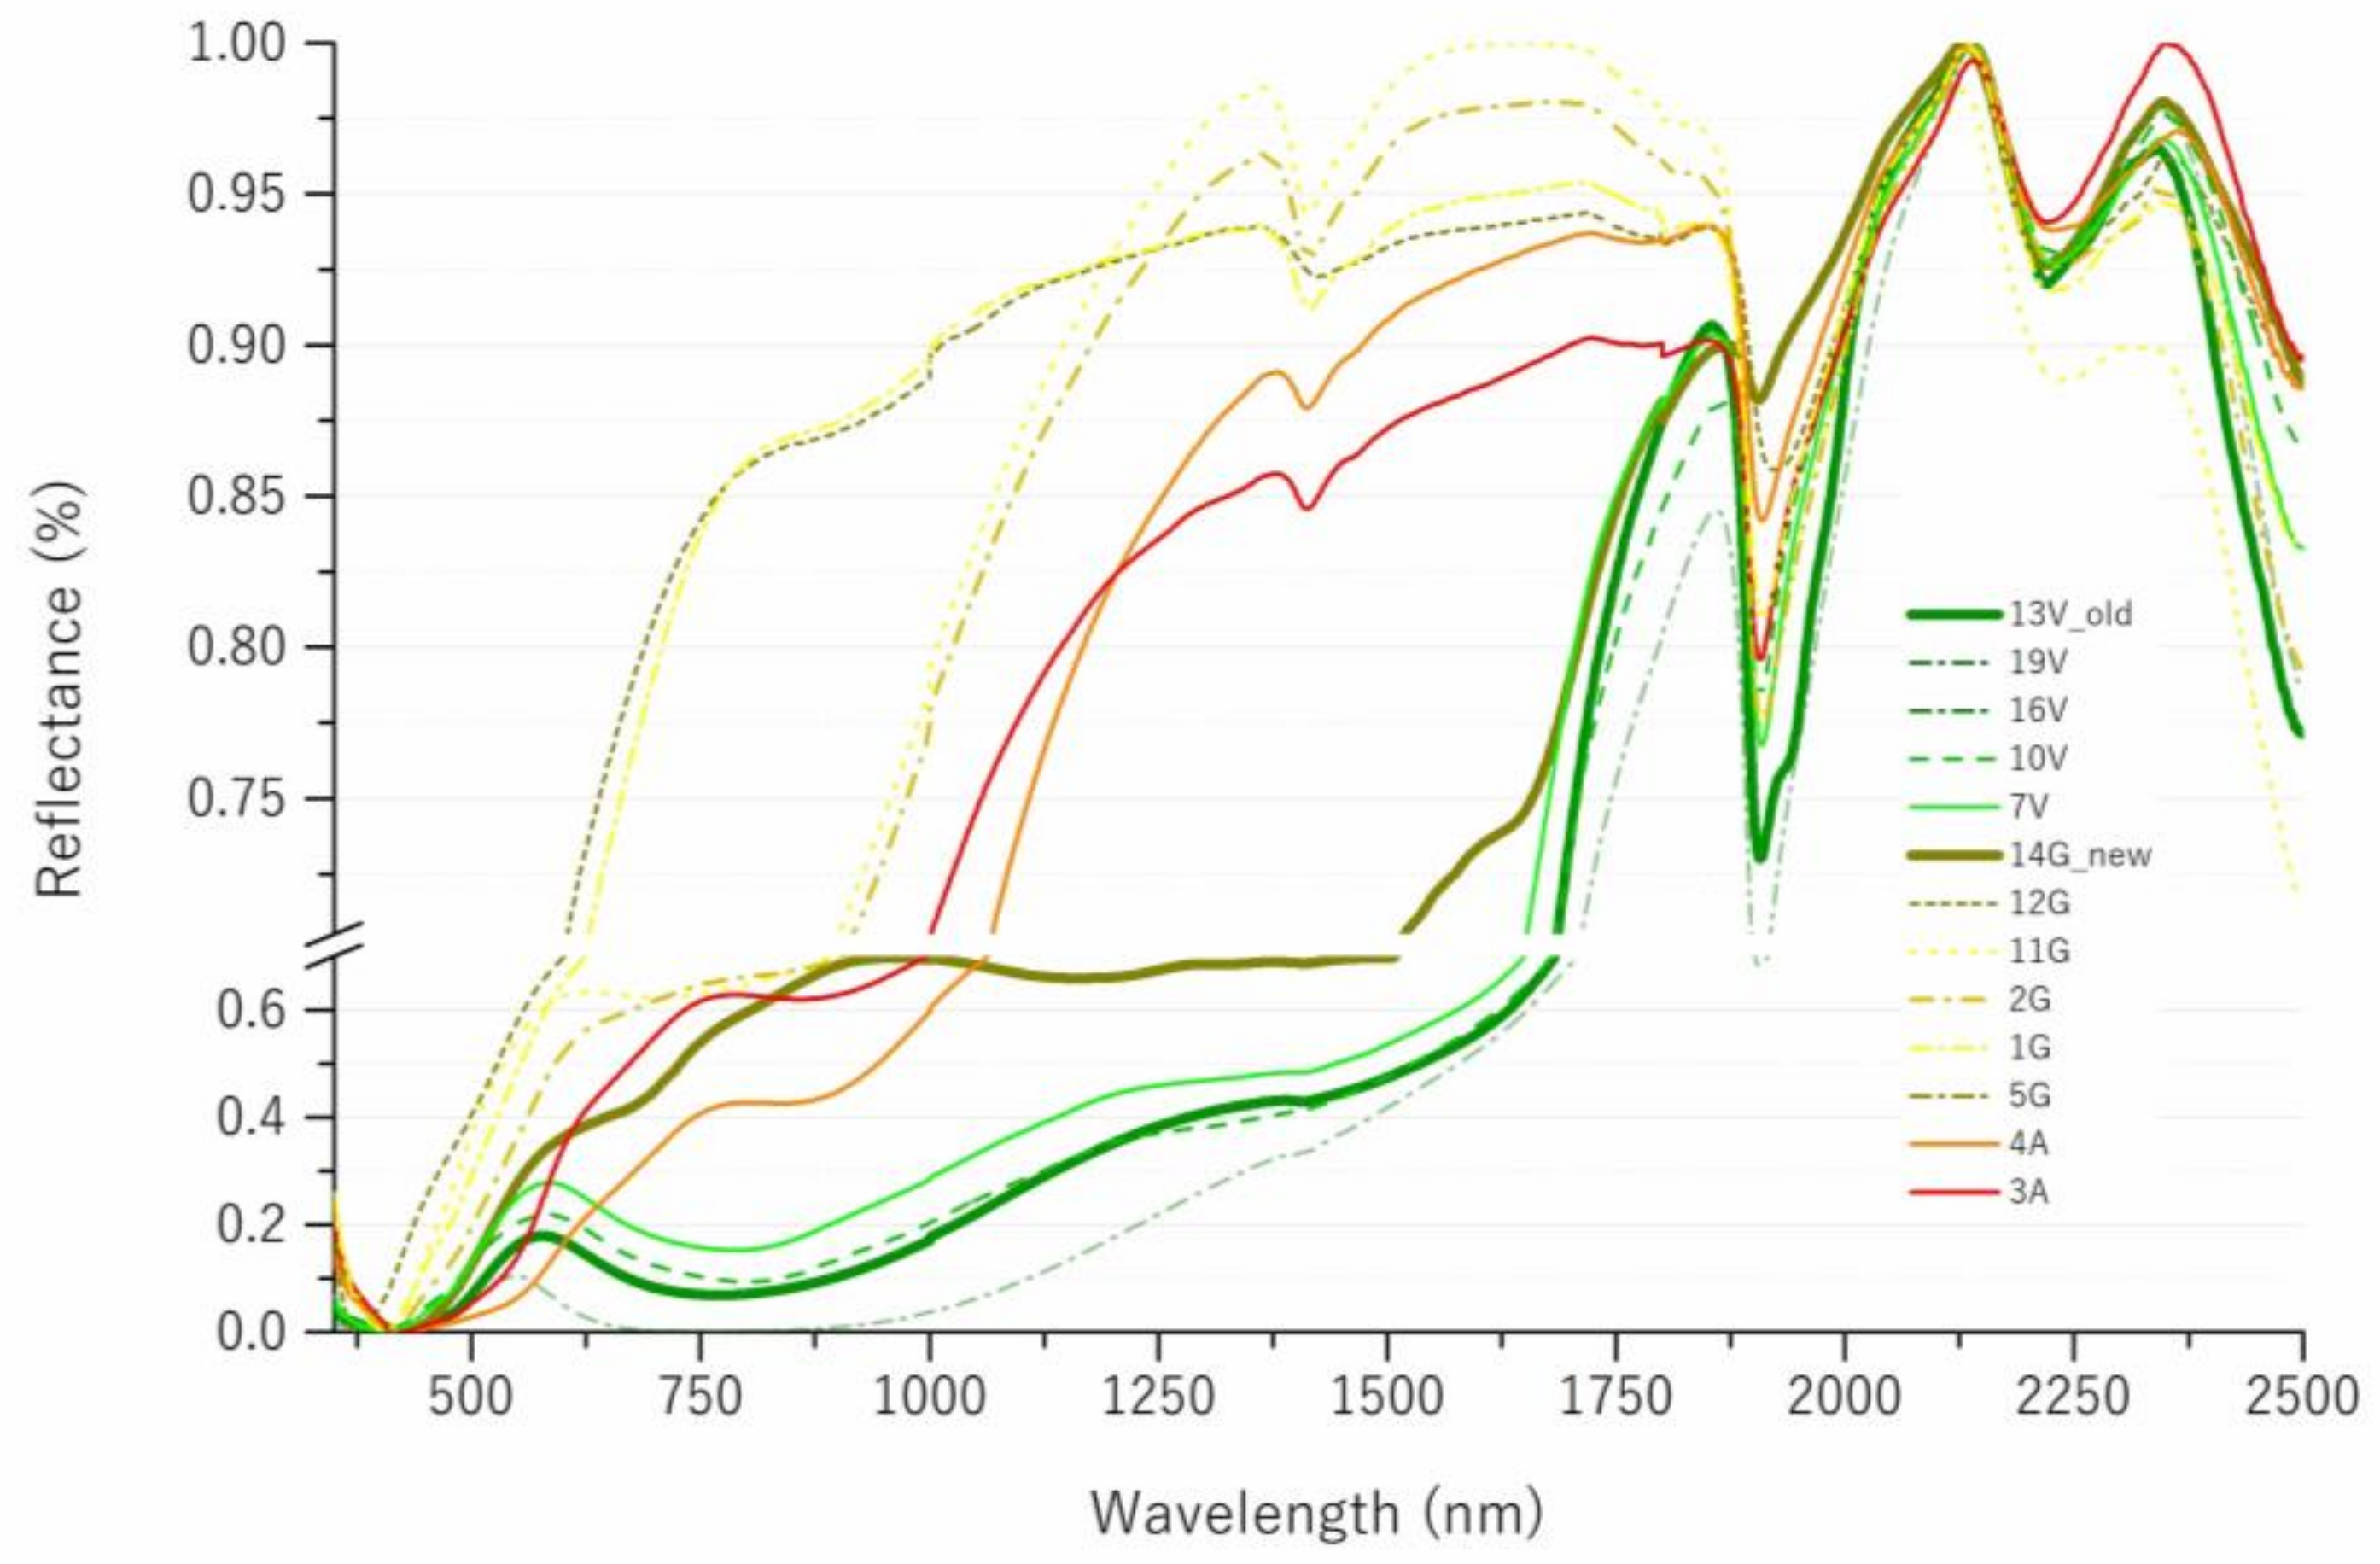
The reflectance spectra collected with FORS show a similar absorption pattern in the SWIR region (1000–2500 nm), which can be associated to water and hydroxyl groups (Figure 6) [26,27]. The bands at ~1400 nm and ~1900 nm are due to bond water, and the absorption at ~1900 nm could be associated to Al-OH bonds. The broad feature at ~2000 nm could be due both to Si-OH and Al-OH bonds. The VIS spectra (350–750 nm) differ among green, red, and yellow sample groups and in subgroups according to specific absorption bands. The green samples 7V and 11V (Figure 6) have peculiar reflectance curves with a broad band between 350 and 450 nm, associated to copper ions in silica-rich matrix, followed by a maximum at 550 nm and a broad absorption band centred at 800 nm, associated to Cu2+ absorption [24,27]. The reflectance spectra of the green samples 6V, 8V, 12V, 13V_old, and yellowish samples 7V and 11V show a maximum shifted to higher wavelengths (680–690 nm). This feature could be related to the use of a mixture with a lower copper content. Also, a small absorption band associated with Fe3+ presence appeared between 380 and 450 nm. Copper oxides and iron oxides were probably mixed to obtain a different hue. The reflectance curve of the new tile 14G is dark yellow and has a peculiar shape, with flex different from the other old tile in the 450–1000 nm range, linked probably to the use of a different pigment (a zinc-based pigment is supposed), while the curve is similar to the other glazes in the SWIR region.
Red samples 3A and 4A have a transparent glaze laying directly on the ceramic body, and their spectra coincide with the typical spectra of earth and ochre pigments [27,28,29]; hematite, in particular, can be hypothesized thanks to the absorption at ~535 nm, ~650 nm and ~850 nm.
The yellow glazes are coloured with iron oxides, as suggested by absorption bands of iron ions: 380–450 nm, 650, 850 nm [27,29]. In the presence of white slip and transparent glaze (12G and 5G), the spectra resemble the kaolin ones with the possible presence of a yellow contaminant; impurities rich in titanium such as rutile and anatase can be hypothesized.
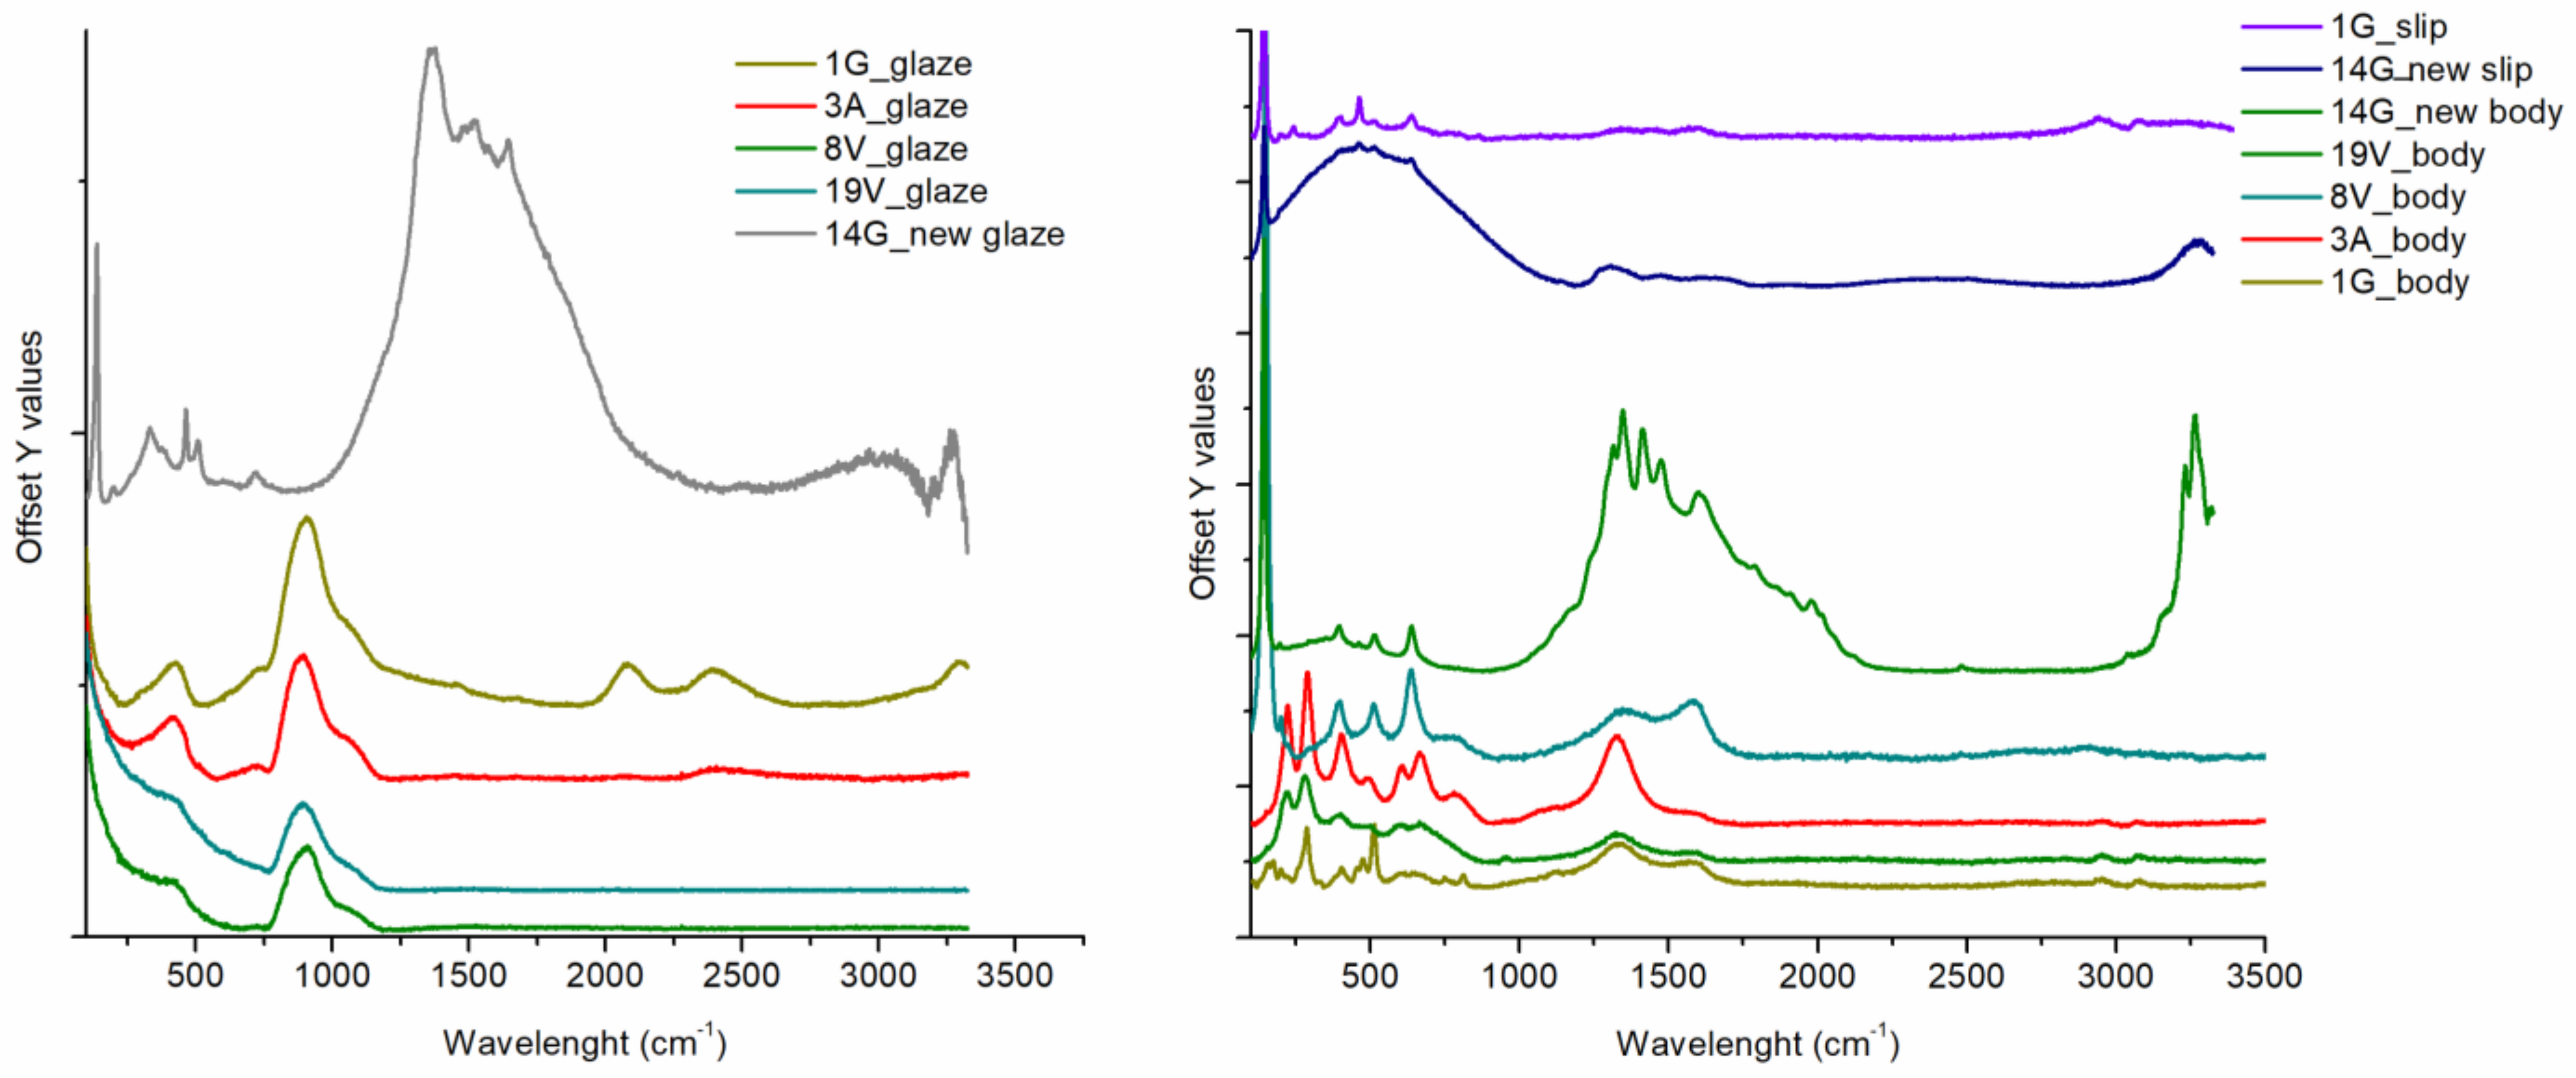
Micro-Raman analysis was performed on the four cross sections obtained for samples 1G, 3A, 8V, 19V and the new tile 14G. The samples were selected as representative of the different types of tiles considering the different colours and stratigraphy (Figure 7). Peaks corresponding to iron oxides presence (1330, 675, 615, 408, 286 cm−1), and feldspars (1129, 1107, 812, 810, 757, 747, 650, 638, 514, 475, 554, 408, 401, 325, 286, 225, 199, 174, 160, 152 cm−1) were identified in the ceramic body of sample 1G (Figure 7) [15]. The ceramic bodies of samples 3A and 19 V are dominated by hematite and magnetite signals, with weak feldspar signals. In the case of the samples 8V, no feldspar signals, and low signals of hematite and anatase are present, due possibly to a higher presence of kaolin in the original clay. The presence of feldspar may indicate a firing temperature lower than 950 °C [30]. It is interesting to note the absence of calcite signals in all the spectra. The absence of calcite may indicate that the firing temperature could have been between 800 and 950 °C, as around 800 °C, calcite decomposes. White quartz crystals (1162, 1083, 808, 694, 518, 164, 395, 355, 264, 203, 127 cm−1) and elongated quartz and albite dark grains (1011, 763, 648, 508, 476, 409, 330, 291, 209, 184, 162 cm−1) are detectable within the ceramic matrixes (Figure 7).
The slips analyses of sample 1G and 8V (Figure 7) revealed the presence of peaks characteristic of quartz (SiO2) (463, 357, 200 cm−1), anatase (TiO2) (142, 398, 512, 636 cm−1) and kaolinite (AlO2(OH4)Si2O5) (242 cm−1) [15,18].
Quartz was probably added to the kaolinitic clay as a degreaser. Anatase is a common constituent of clays and exhibits very intense Raman bands, even at low concentrations. Kaolin on the other hand has very weak Raman spectrum; for this reason, the presence of kaolin is usually given based on the anatase peaks, when present [31]. The presence of anatase indicates that the firing temperature of this layer may have occurred at a temperature below the anatase-rutile transition temperature, i.e., 750–1000 °C. The spectrum of the interface area between the glaze and the slip shows the Si-O bond glass signal (950 cm−1), together with the signals of the orthoclase (KAl Si3O8) (peaks at 512, 467, 278 cm−1), a potassium aluminosilicate [32].
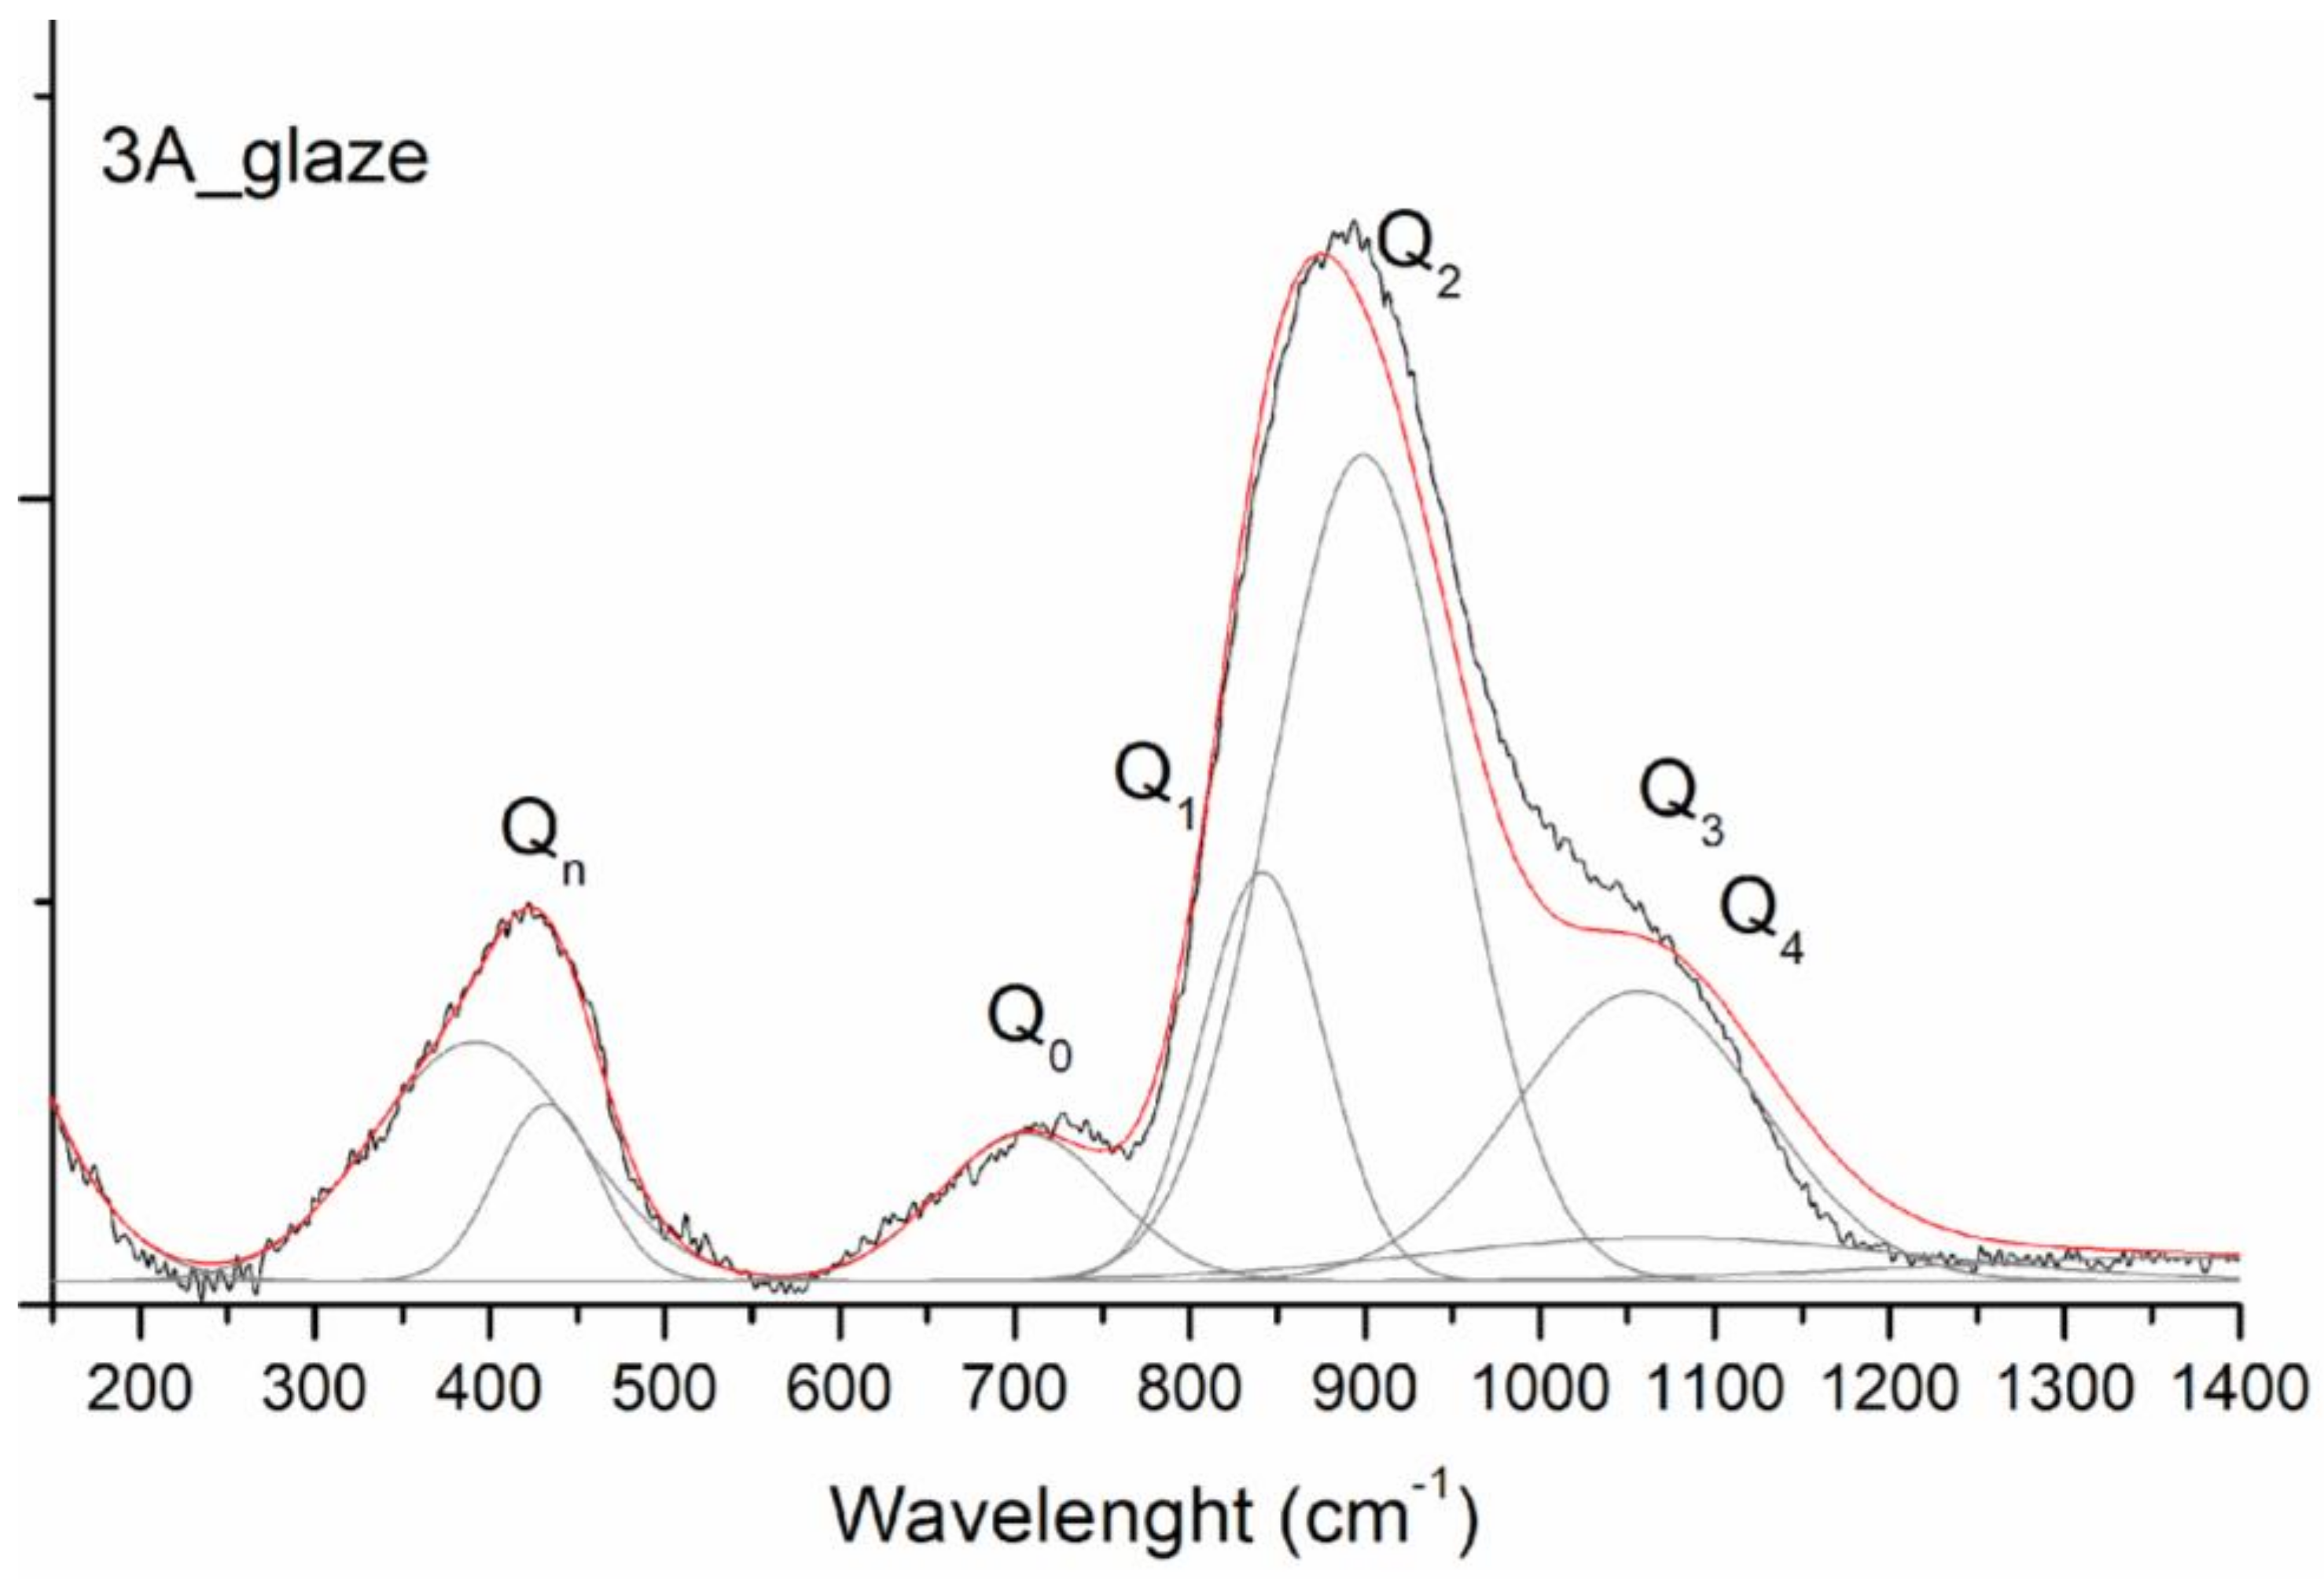
The Raman spectra of the glazes are dominated by the silicate glass’s characteristic bands (Figure 7 and Figure 8): two very intense and broad bands centred around 300 and 600 cm−1, corresponding to Si-O-Si bending within inter-tetrahedron linkages, and another band between 900 and 1300 cm−1, corresponding to Si-O stretching of mainly depolymerised silicate species [7,33]. The ratio IP = (A500/A100), with A being the area at 500 cm−1 and 1000 cm−1, is called the index of polymerization and can give an idea of how interconnected the glass network is. According to the literature, there is an empirical relation between IP, the glass composition and processing temperature. In glazed materials, the IP assumes high values in silica-rich glasses (>6), and low values for glasses with a high content of flux (>0.5), since fluxing agents breaks the Si-O linkages of the glassy network, producing isolated or partially connected tetrahedra [33]. The IP is also related to the firing temperature, as a lower number of Si-O links is related to a lower cooking temperature. The Raman signature (depending on the interconnection of silicon tetrahedra in the structures Q0…Qn) of each detected glaze is thus considered. The polymerisation index was calculated after baseline subtraction and normalisation of the data. The resulting IP values are 0.15 for sample 1G, 0.23 for sample 3A, 0.14 for sample 8V and 0.18 for sample 19V. The literature reports that IP values lower than 0.4 indicate the presence of a lead-rich glass (also confirmed by the elemental XRF analysis) and a firing temperature lower than 700 °C [33].
To further investigate the differences between intact and deteriorated glaze, the surface was analysed in different points, too. Areas showing iridescence, a degradation of the surface related to glass corrosion, were observed in covered parts (with low water run-off) near black deposits. Iridescent areas show Raman spectra similar to non-iridescent parts, while the black deposit shows typical features of rust (hematite and magnetite peaks at 584, 483, 380, 273, 212 cm−1), possibly due to corrosion decay of the iron nails used to fix the tiles, and carbon bands due to soiling (peaks at 1588, 1295 cm−1).
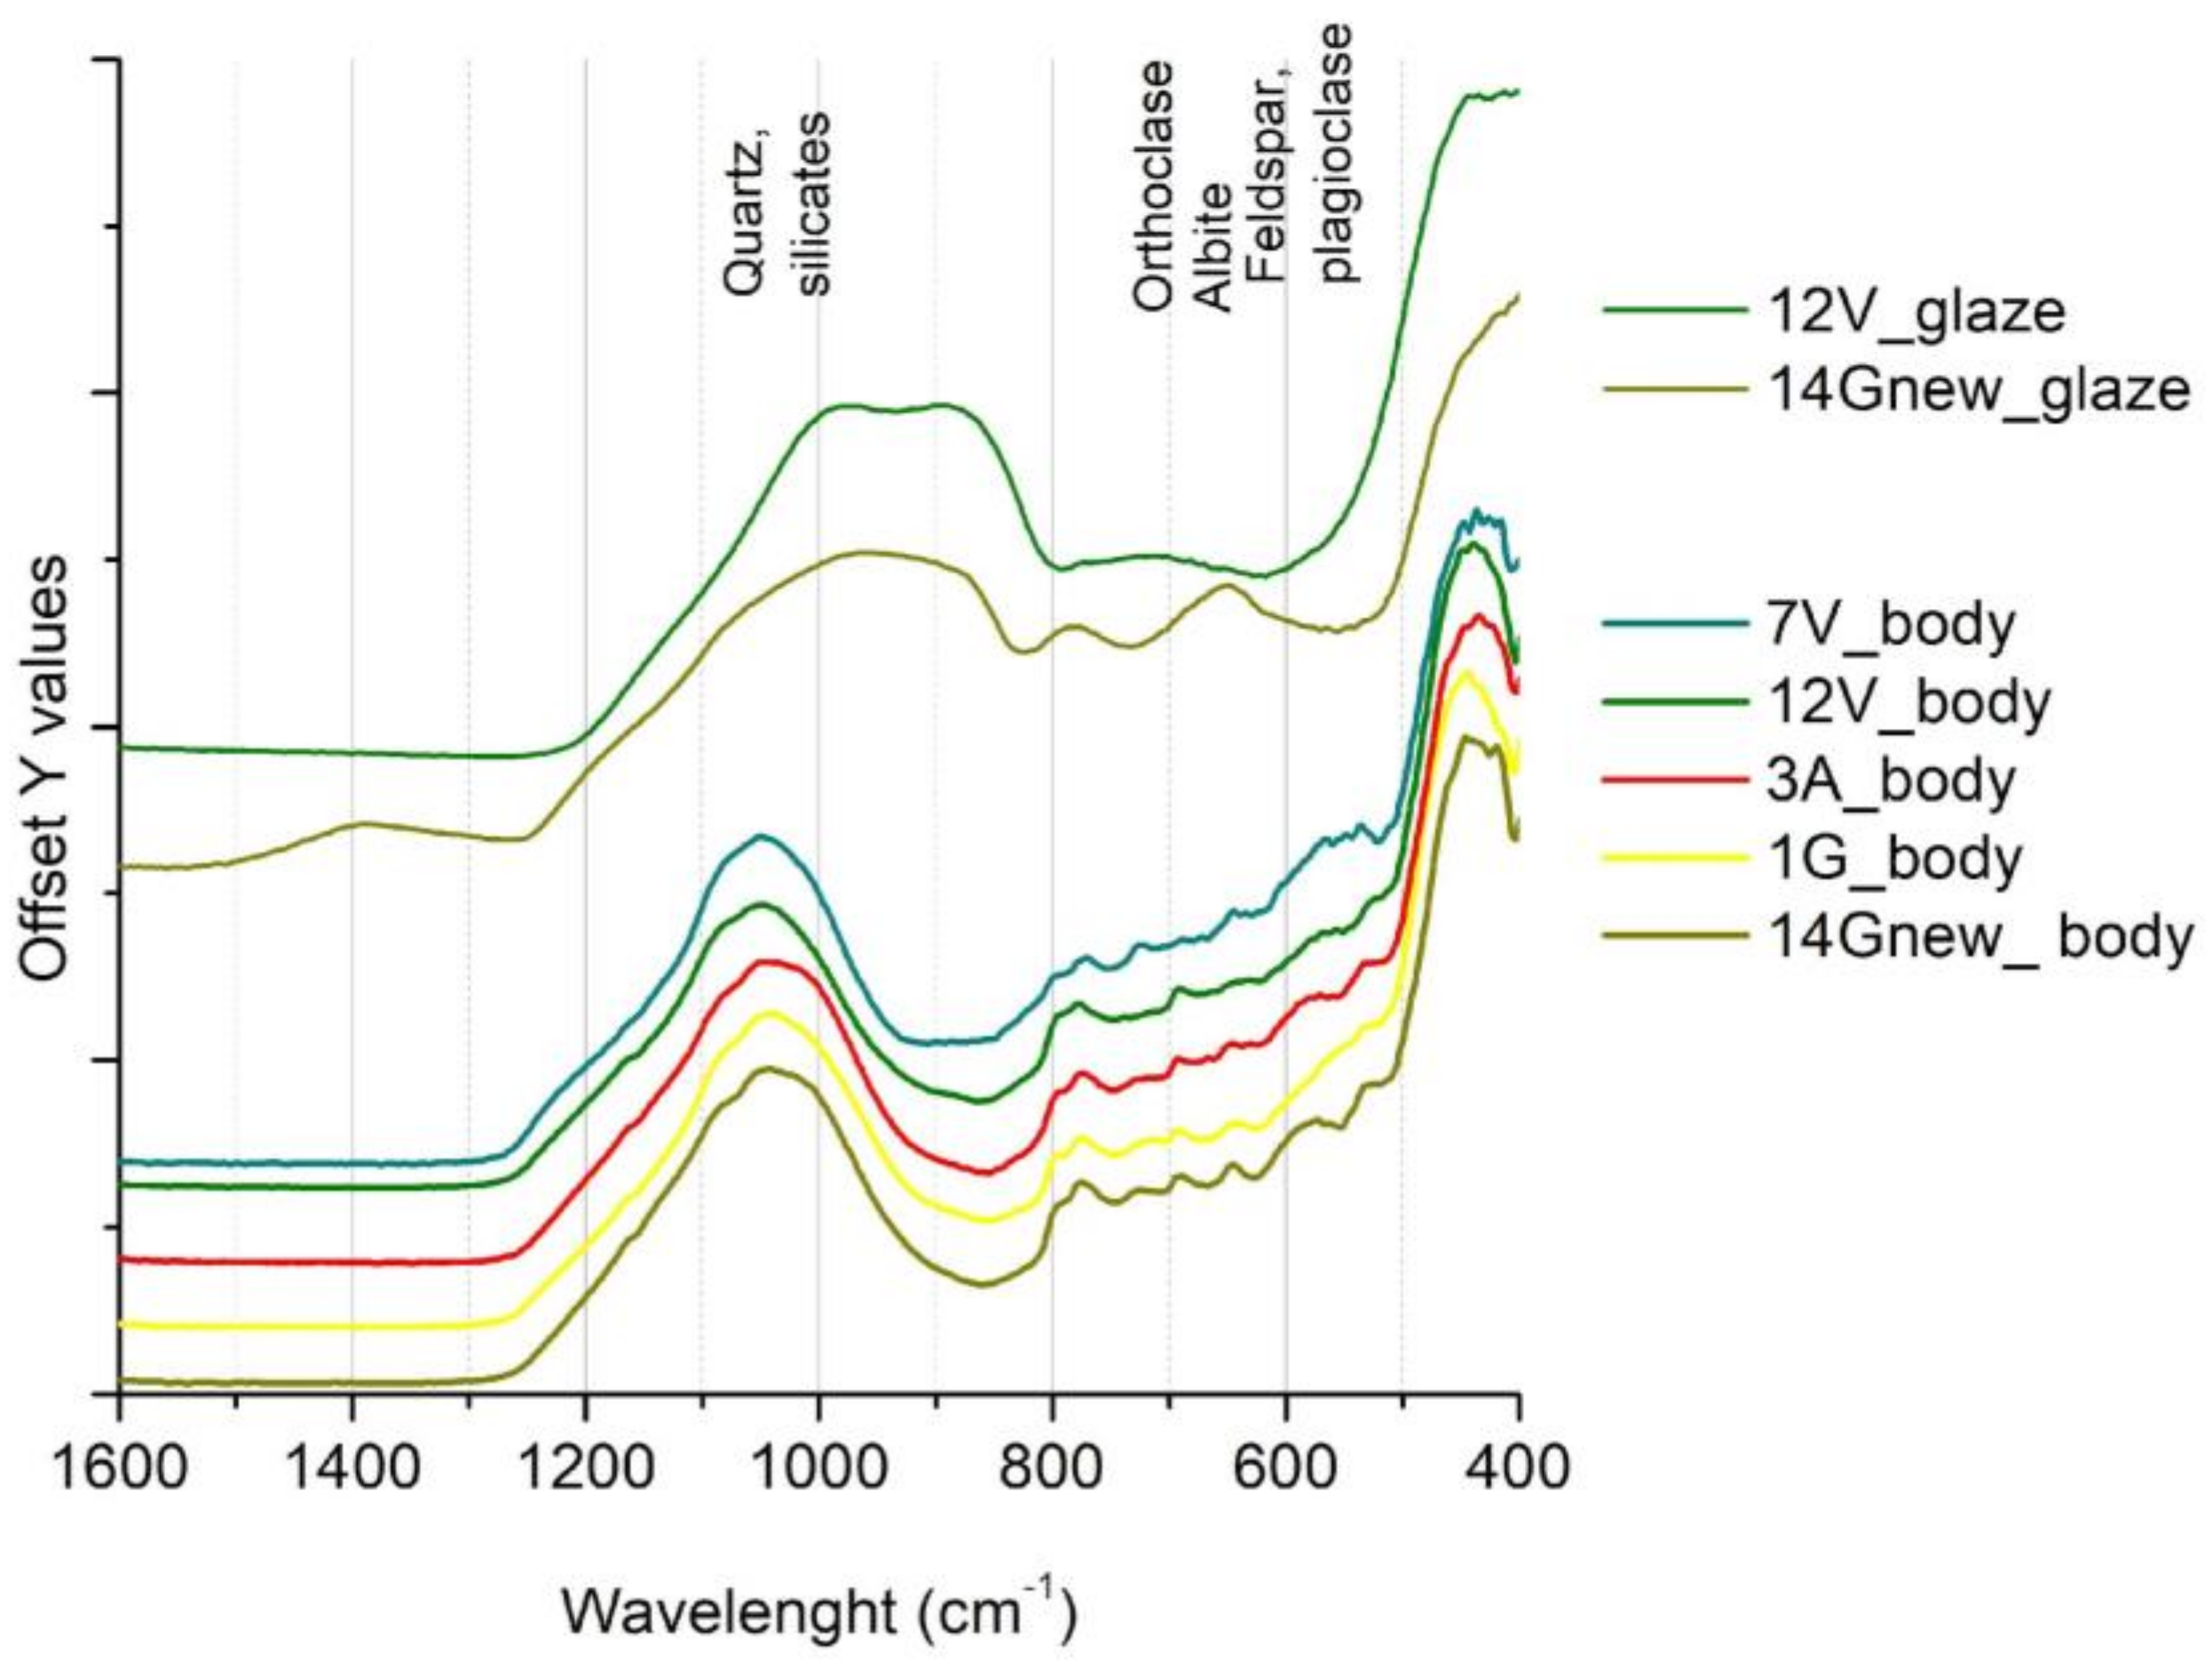
The powder of samples 1G, 3A, 7V, 12V, and 14G new ceramic body were analysed using FTIR-ATR, too. The spectra are dominated by the two main silicate bands (Figure 9) between 1300 and 900 cm−1 (Si-O stretching), and between 600 and 400 cm−1 (Si/Al-O-Si bending). Carbonate vibrations at 1794, 1430, 876, and 712 cm−1 are absent, suggesting the use of purified clay with low limestone content and high firing temperatures [21]. Smaller signals belonging to quartz (1164, 1086, 795, 781, 694, 449 cm−1), hematite (596, 529 cm−1), kaolinite (439 cm−1), and feldspars (1053, 729, 721, 645, 606, 589, 581, 464 cm−1) were individuated by using second derivatives [34], confirming the Raman spectroscopy results. The presence of hematite may indicate an oxidizing atmosphere in the kiln. The presence of feldspars instead may suggest that the cooking procedure took place below 950 °C, since they tend to decompose at higher temperatures. The new tile 14G show a spectrum profile of the ceramic body similar to the original ones, while the glaze spectra differ for the presence of two large bands at 784 and 640 cm−1, probably due to Zn-O stretching and bending [35]. In presence of zinc, beside quartz, zinc silicates are formed too, and broad peaks appear due to amorphous compounds.
3.4. TG-DSC
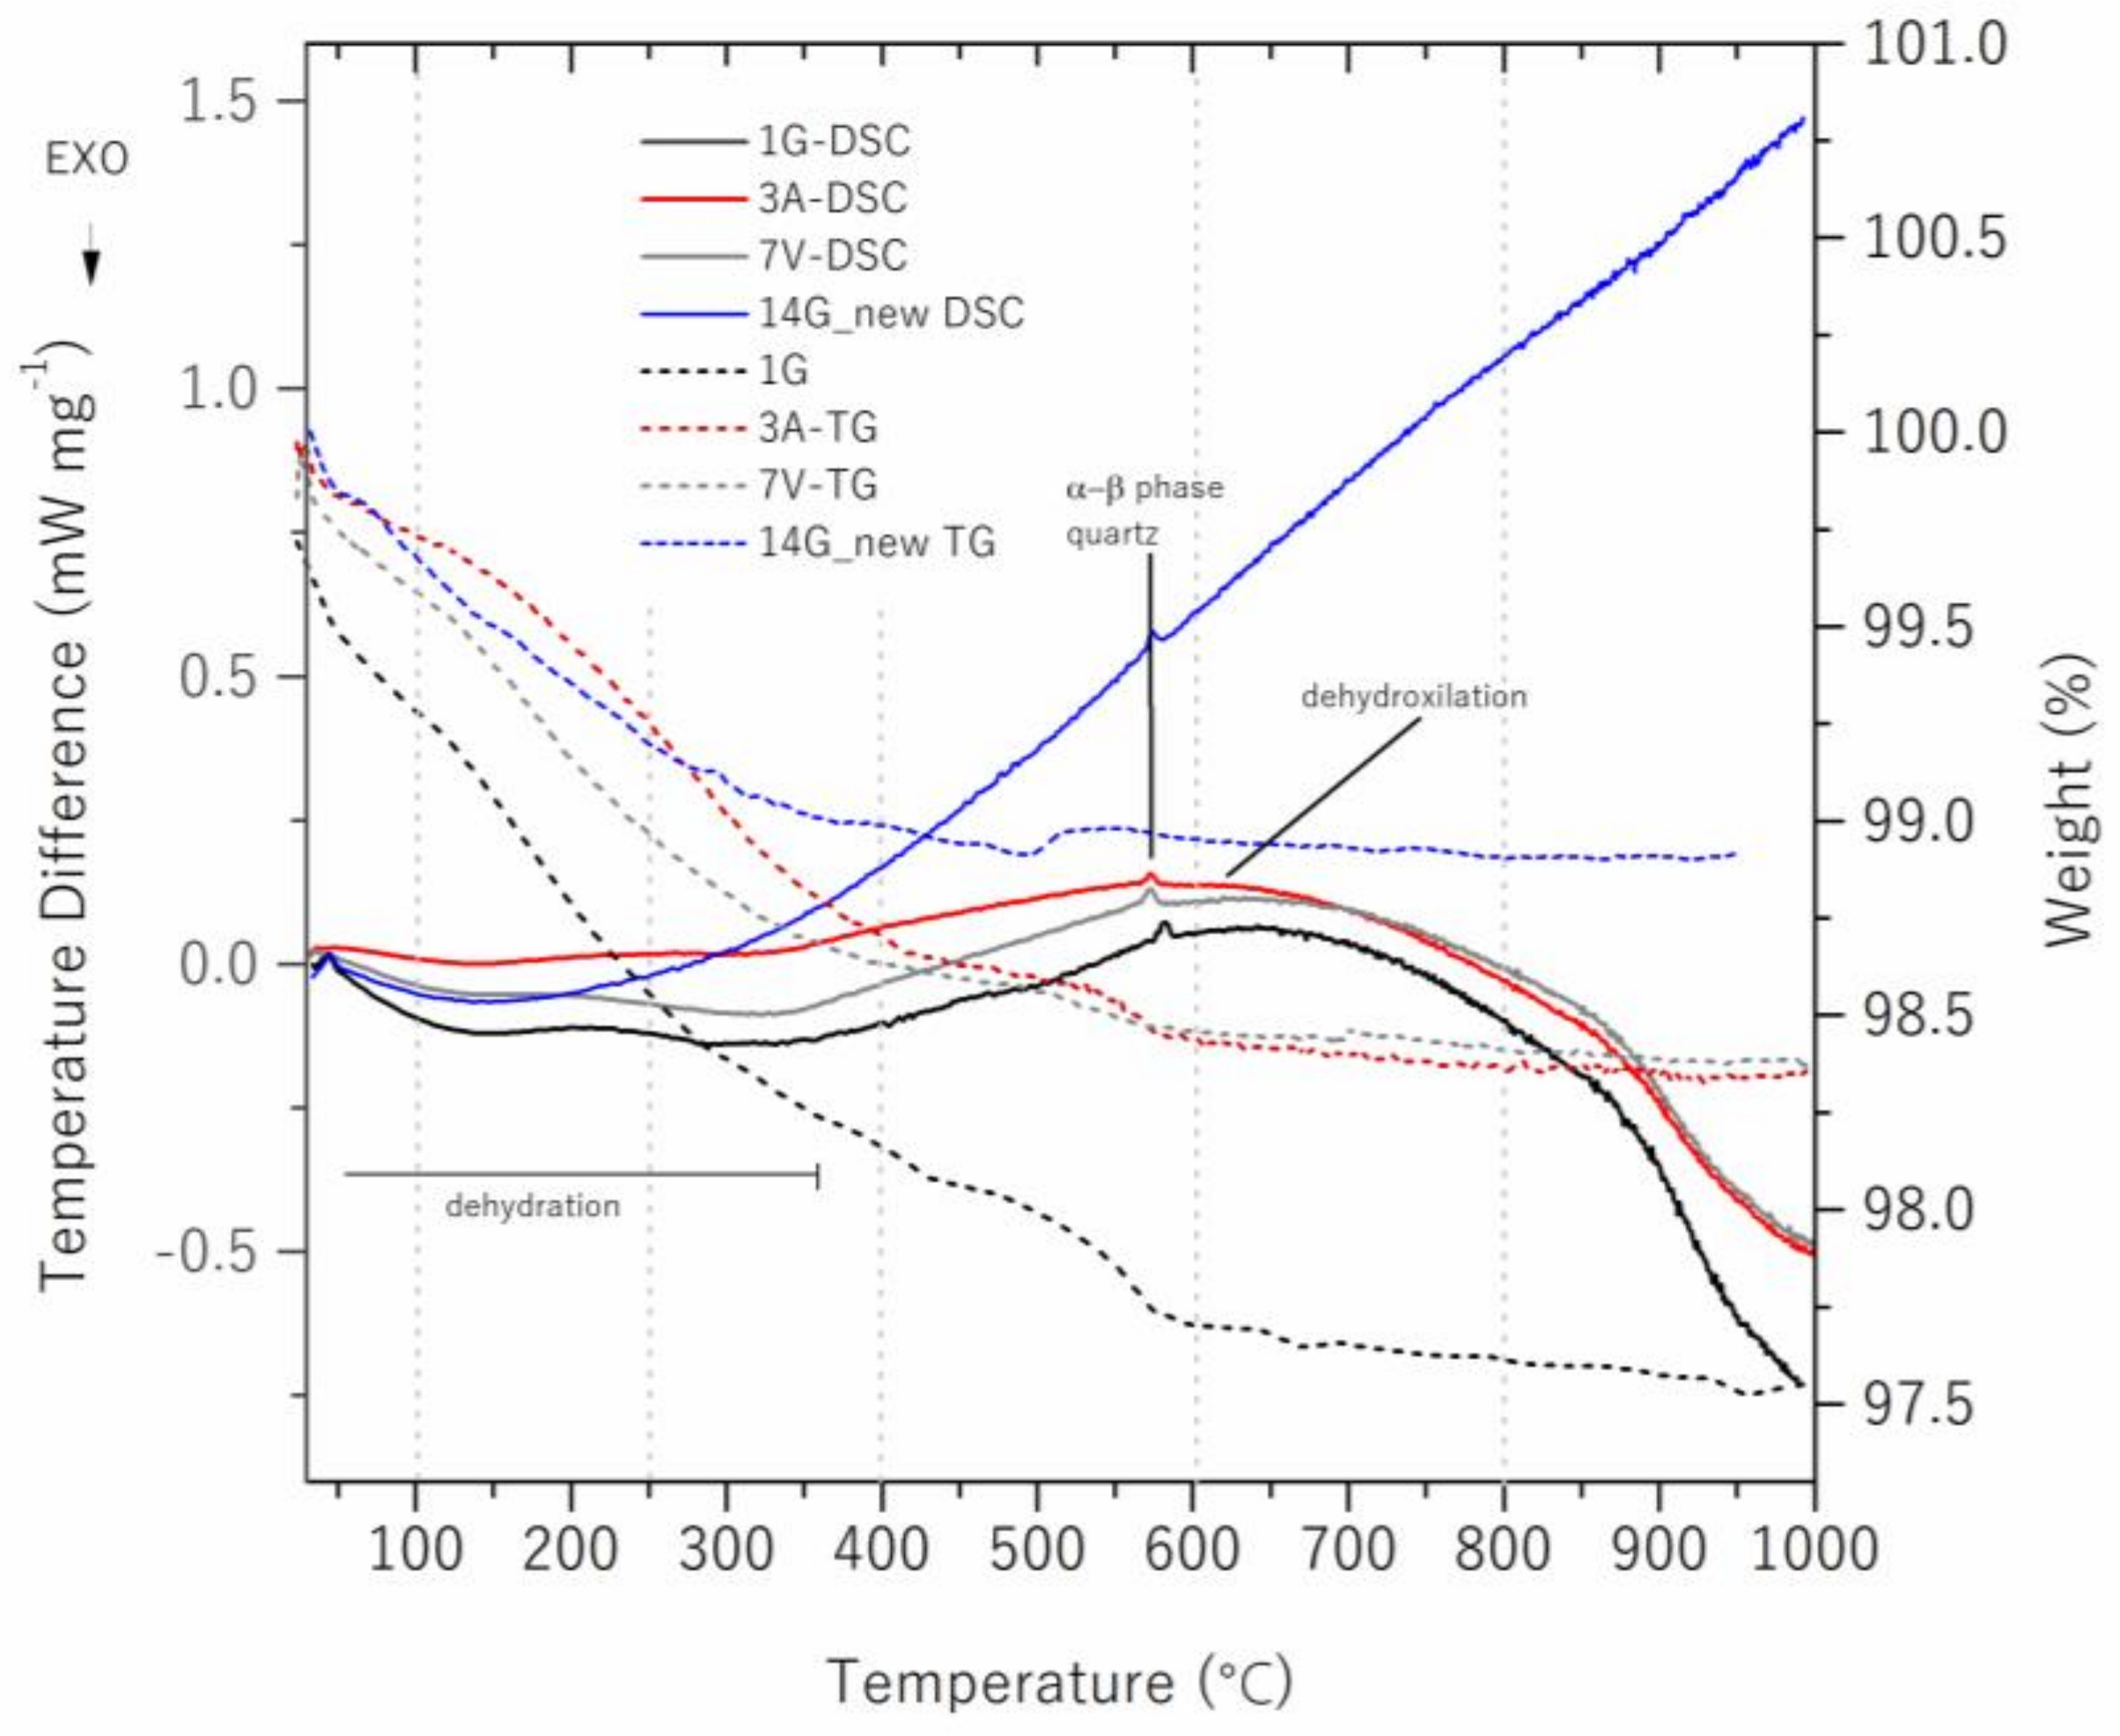
The ceramic body of samples 1G, 3A, 7V, and 14G_new underwent TG-DSC analysis (Figure 10). In general, the weight loss is low for all the samples, consisting of 2.4 wt% for sample 1G, 1.7 wt% for sample 3A, 1.6 wt% for sample 7V, and only 1% for the new 14G tile. Under 100 °C, absorbed water is lost. Between 200 °C and 250 °C, bound water, namely interlayer hydrated cations, is lost [19,20,34]. Two correspondent endothermic peaks are centred at 60 °C and 220 °C for the old tiles, respectively. The new tiles showed a unique water loss till 400 °C. Between 300 °C and 350 °C, recrystallization of amorphous and/or recrystallized Fe-oxy hydroxides may take place, as suggested by the broad exothermic peak at about 320 °C. The associated mass loss is 0.4 wt% for sample 1G, 0.6 wt% for 3A, and 0.3 wt% for 7V. At 400 °C−600 °C, a large endothermic peak is associated to dehydroxylation of clay minerals (kaolinite and illite) together with a mass loss of 0.5 wt% for sample 1G, 0.3 wt% for sample 3A, and 0.2 wt% for samples 7V. The exothermic peak, with no mass loss at about 573 °C, may correspond to the transition from α to β quartz (amorphization) and can be observed for the new tile too. In the temperature ranges of decarbonation of limestones (600–850 °C) and of the formation of the high-temperature phase of clay mineral (850–1000 °C), only minor mass losses were observed for the old samples and were completely absent for the new tile. The absence of an endothermic effect in the range 600–850 °C suggests a reduced number of carbonates. The results may indicate that the ceramic body was probably fired above 850 °C. Moreover, the absence of evident enthalpy changes above 950 °C and the negligible weight losses may indicate that the maximum firing temperature reached was not higher than 950–1000 °C.
3.5. Freeze-Thaw Cycles
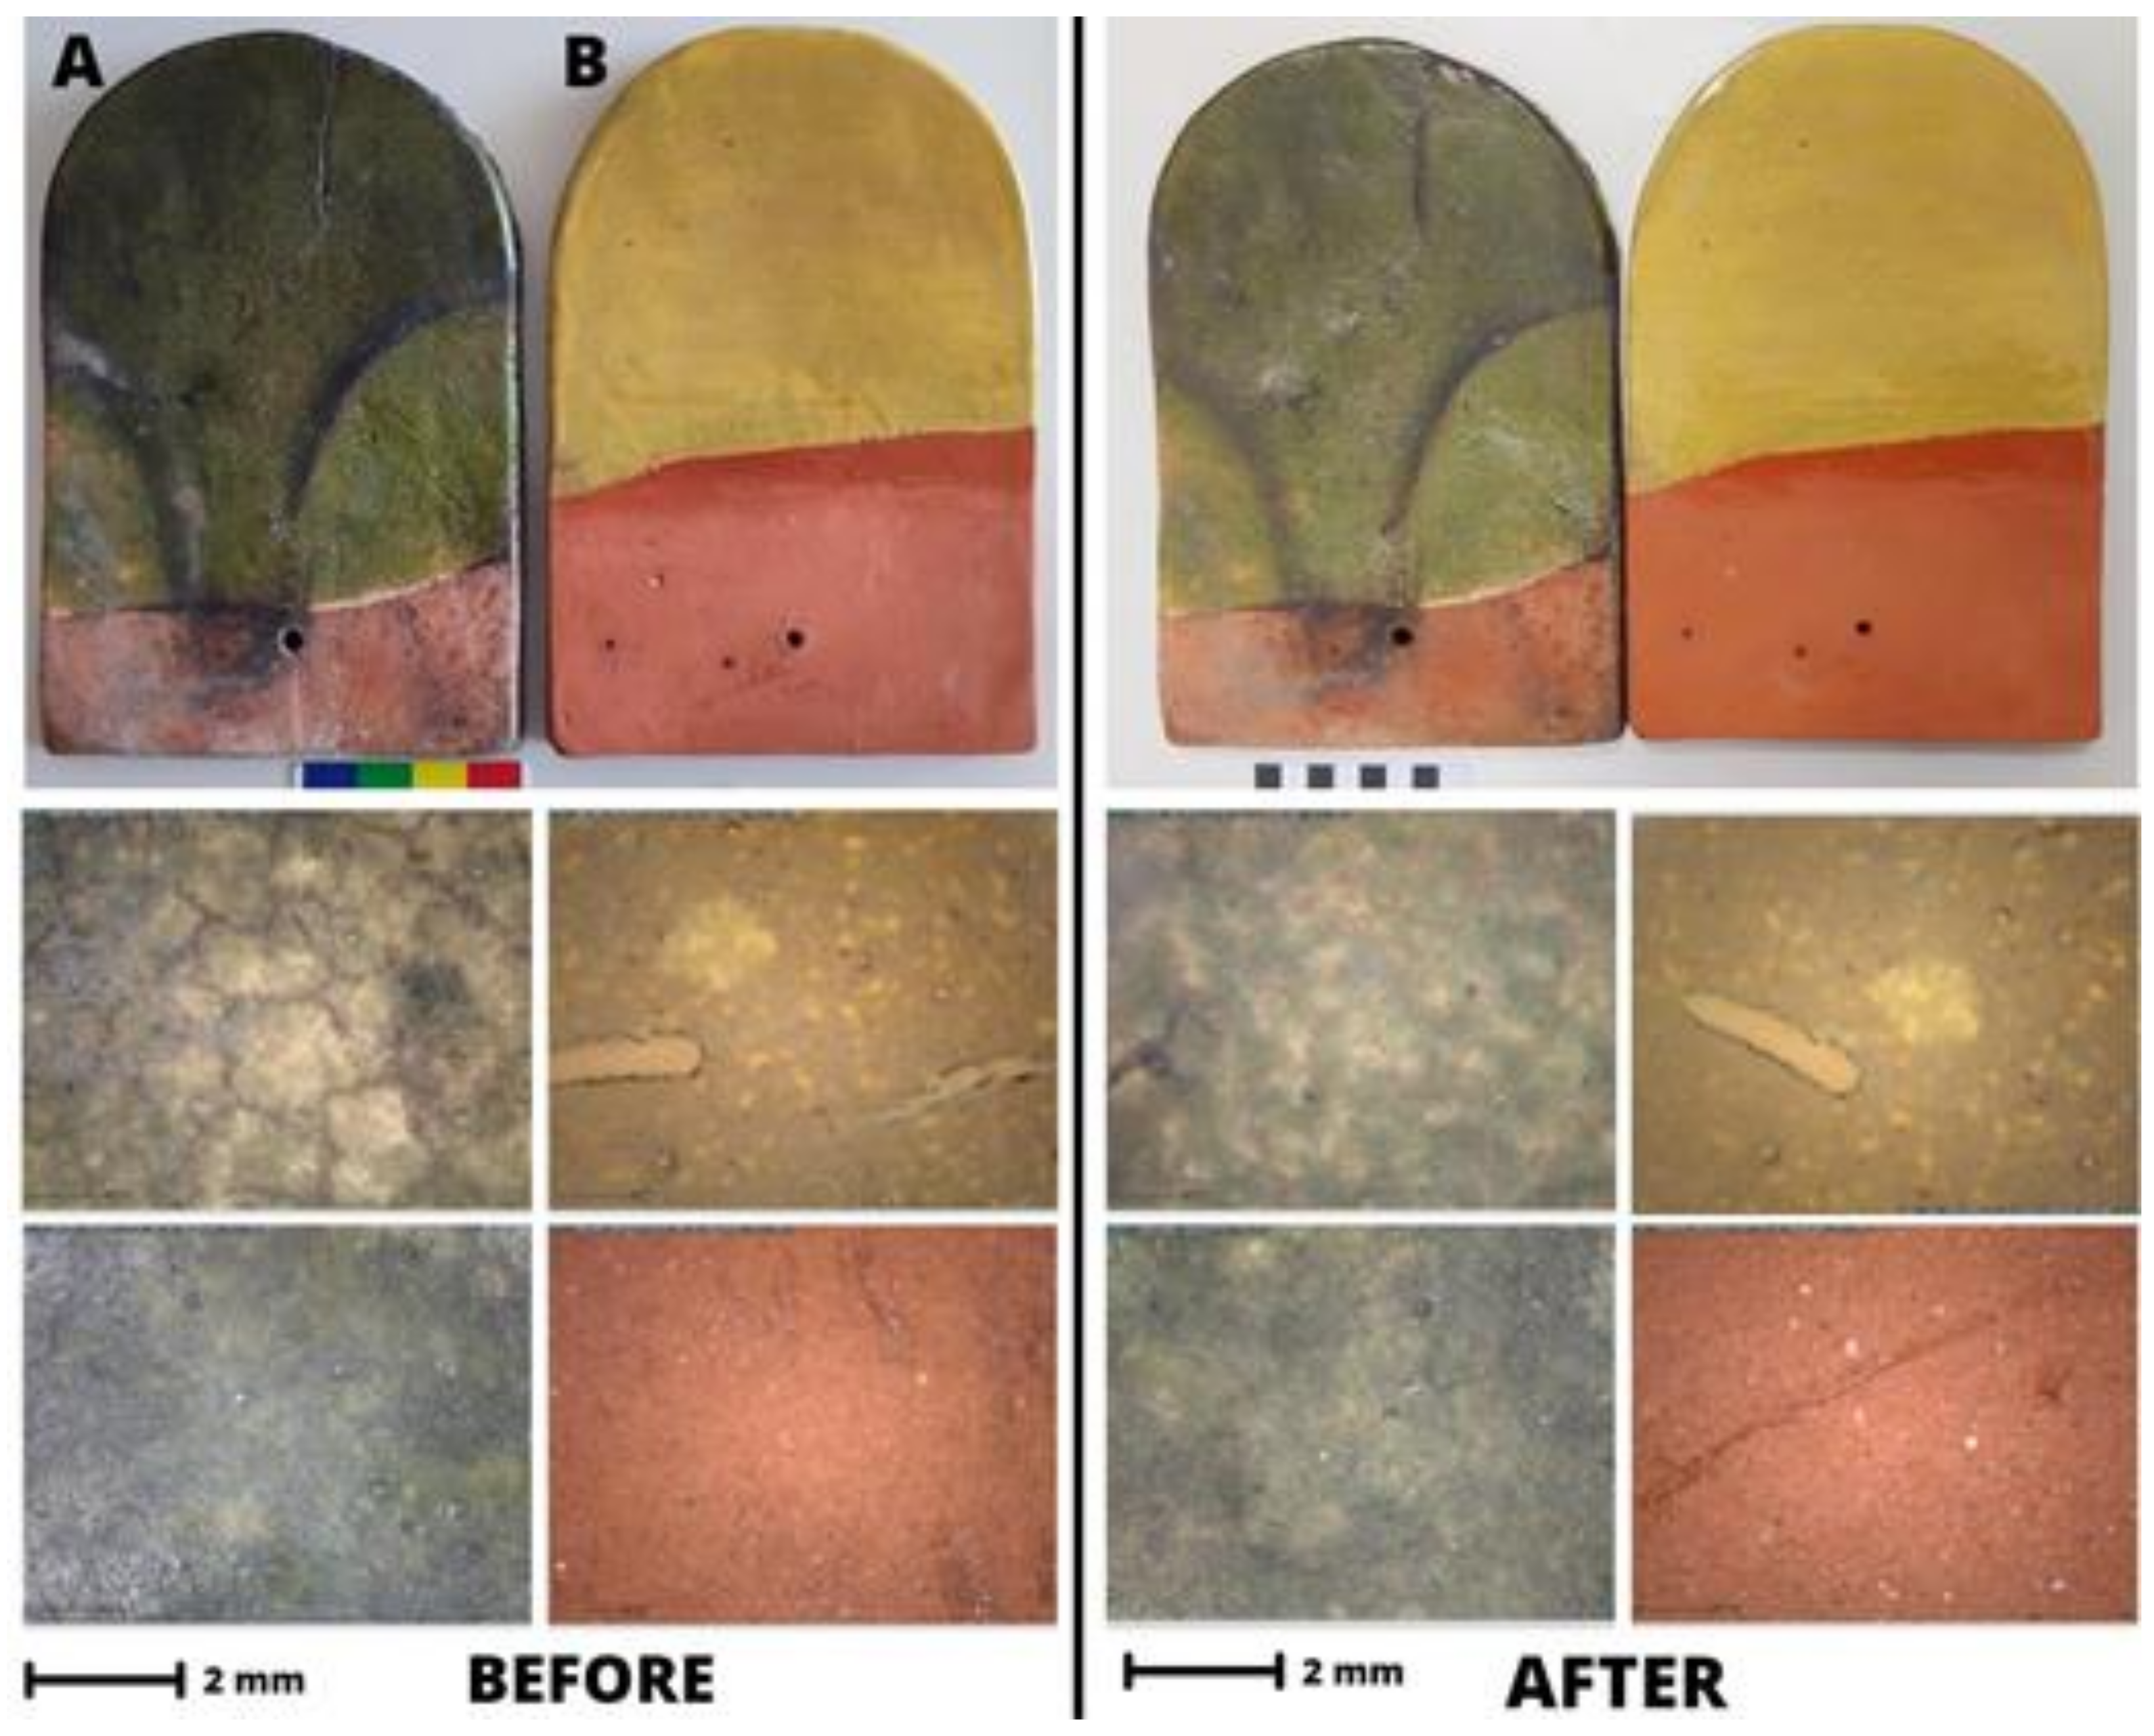
The original and new tiles were subjected to artificial freeze-thaw weathering and were compared to evaluate their behaviour. The old tile (sample 13V_old) was in a good conservation state before the experiment: glaze micro-crack, colour inhomogeneities were visible, but the ceramic body was compact, and the glaze was coherent and adherent to the ceramic body. The new tile (sample 14G_new) showed to be compact and adherent to the ceramic body glaze, characterised by a diffuse craqueleure related to the manufaturing process.
Figure 11 reports observation of the tiles before and after the 20 freeze-thaw cycles. The pictures comparison highlights slightly visible differences. At the end of the 20 cycles, the glaze of the old tile (A—sample 13V) showed a more brilliant green hue and a reduced number of grey spots. Before the treatment, the tile was just gently cleaned with a humid sponge and the freeze-thaw cycles most likely partially dissolved the dust still present. Microscopical surface observation (55×) of the 13V tile showed, in fact, clearer and reddish fine lines among the glaze cracking. No adhesion issues were observed. The 14G tile does not show evident visible variation, but minor detachments on the tile side occurred with the loss of micro-glaze fragments. The detachments that occurred on the side were micromovements and tension due to different expansions of the ceramic body and glaze was more likely to happen.
Colour variations of tiles was monitored throughout the cycles on three different points on the tile glaze; Table 3 reports the variation of lightness (L*), hue (a* and b* parameter) and the total variation ΔE* at cycles 10 and 20. Relevant colour variations were observed for both tiles. Colourimetric variations, in particular for the old tile, are difficult to evaluate, as the glaze colour is different from point to point due to production variability and degradation patterns (i.e., in exposed and not exposed area). In both cases, colour variations were detected in particular for old tiles for the b* and L* coordinate that tends to more negative values. The calculated ΔE denotes a colour variation for all the three considered points, again higher for the old tile with a ΔE equal to about 14 for point a. The new tile showed, apart for point c where all colourimetric coordinates varied, almost no relevant colourimetric changes.
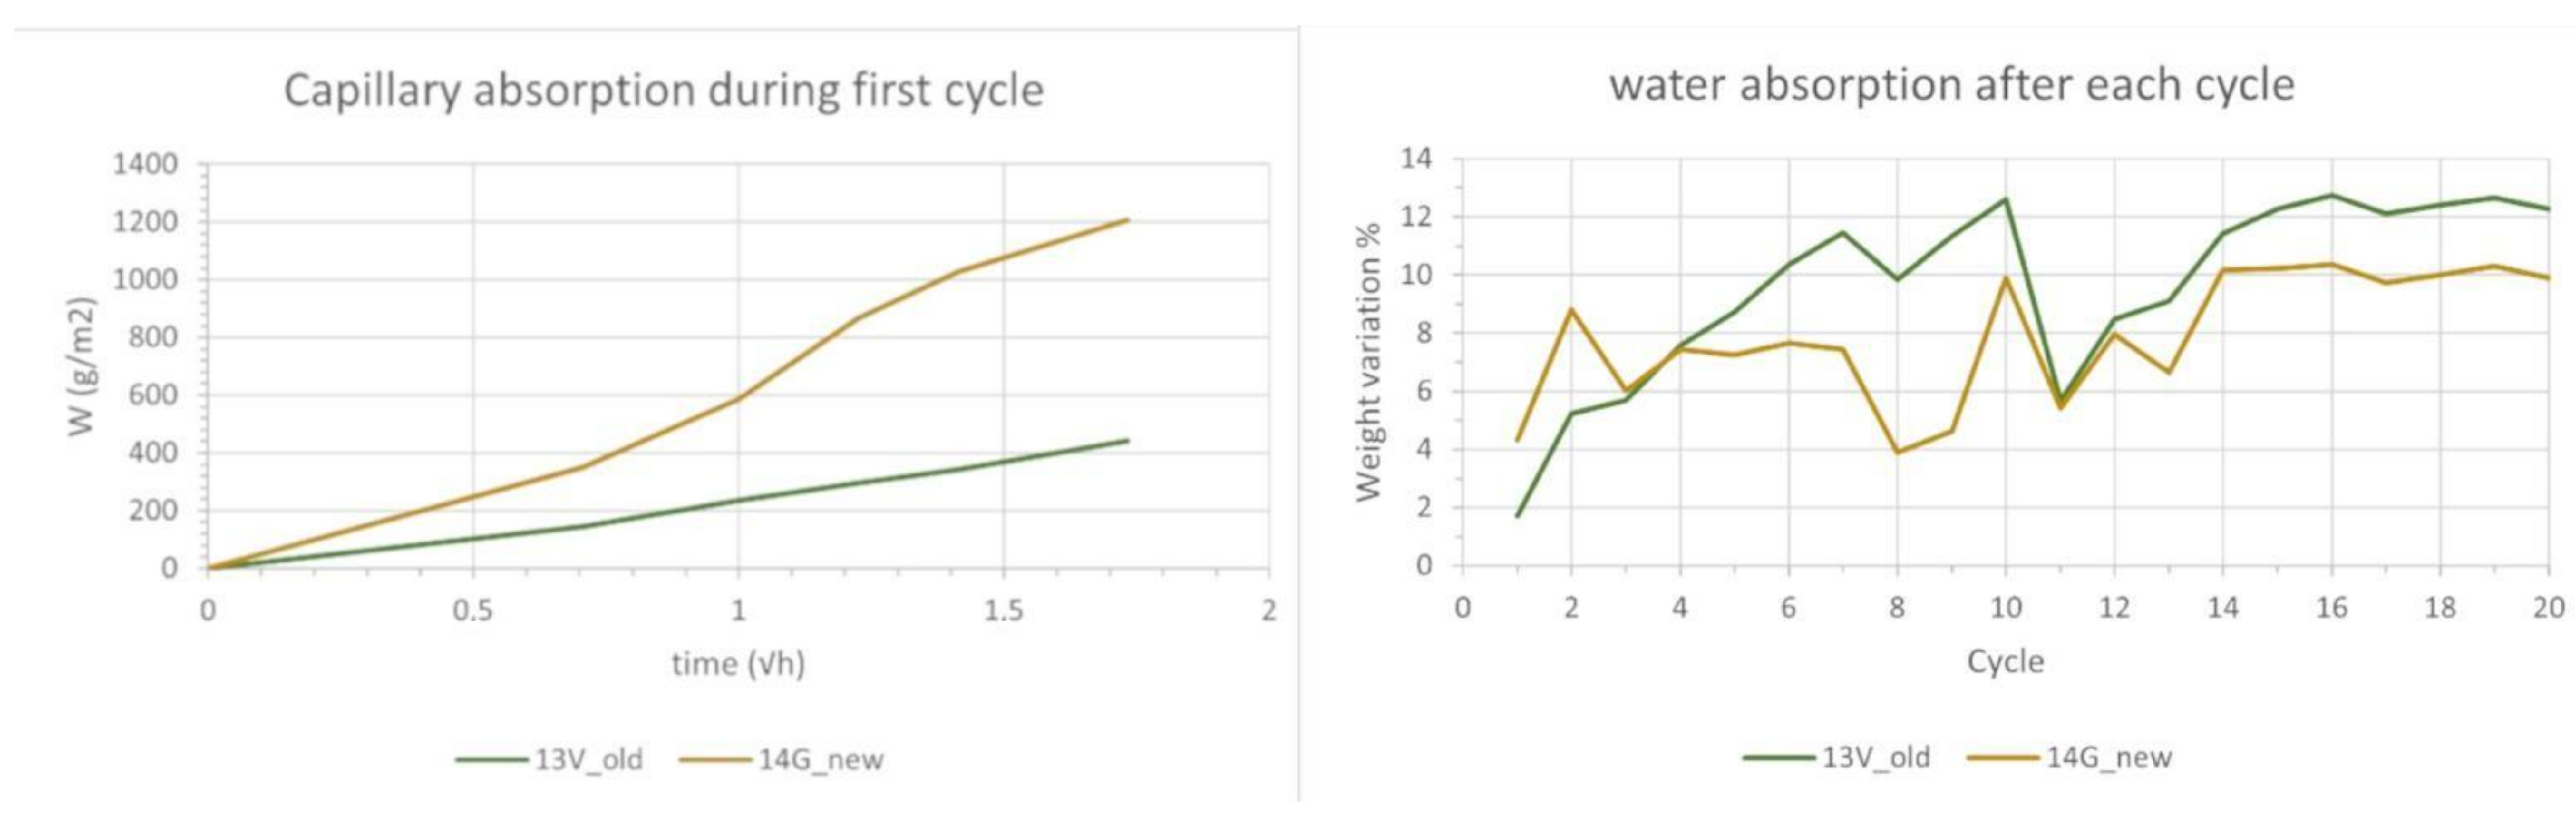
To compare the behaviour with regards to water absorption and to better understand the weight variation, the capillary water absorption of the tiles was monitored during the first three hours of the imbibition cycle (Figure 12 left). The results pointed out that the old tile may have a lower water uptake than the new one, due probably to a different porosity of the ceramic body. A higher water uptake could result in a higher vulnerability to water and ice. Moreover, during the first three hours of water absorption of the 1st cycle, the tiles did not reach water saturation (flat and constant weight); neither did the tiles dry completely over night after the freezing phase, as the weight was still higher than the starting one. This may explain why during the test a weight increase was observed from one cycle to the other (Figure 12 right). At the 10th cycle, the test was stopped, the tiles completely dried and were subjected to colourimetric monitoring. The 11th cycle shows again an increase in weight, that remains stable until cycle 15; no weight decrease due to crumbling or detachments was observed for the old tile. At the 20th cycle, tile saturation is reached and it is possible to observe that the old tile is able to absorb 12%by weight in water, while the newly made tile, 10%by weight. The new tile absorb easily and also dries faster than the old tile. In conclusion, in these experimental conditions, the glazes of the old tiles seem to be extremely resistant to freeze-thawing cycles.
4. Discussion
Coloured glazed tile is a peculiar roof solution for Aosta (north-west of Italy). Glaze tile is a system composed by different parts: the ceramic body, the glaze and the interface between the two. Microscopic observation pointed out different types of stratigraphy. This variation can be attributed to the artisanal production for obtaining specific hues and properties of the glazes. The ceramic bodies present either an intense red paste with small white and black aggregate inclusions (<100 μm), or a light-coloured paste with bigger inclusions (>100 μm). Micro-Raman, performed on the cross sections of few representartive samples, and FTIR-ATR, performed on powdered samples, were combined to study the chemical composition of the different layers. The paste, considering the micro-Raman and the FTIR results, seems to be mainly composed of aluminosilicates, in particular albite and orthoclase feldspars and kaolin, hematite and quartz. The presence of carbonates was not detected, indicating that the original clay may have a non-calcareous origin. The ceramic body, according to TG-DSC and spectroscopic analysis, was probably fired in an oxidizing atmosphere at temperatures around 900 °C. The glaze, as clearly visible in the cross sections, is either laid directly on the ceramic body or on a white slip. This contained less feldspars and hematite than the ceramic body, and a higher content of quartz and kaolinite responsible for the light colour. The interface between the glaze and the body or the slip is composed by orthoclase crystals.
The glaze is a lead-based mix with a low alkali content and can be transparent, yellow, or green. The glaze colour is given by the presence of transition metals: green is obtained with the addition of a copper-based pigment (ramina), while yellow is probably obtained from an iron-based pigment (i.e., ochre). Moreover, it is possible that some green yellowish colours were obtained from a mixture of yellow and green pigments. The glaze of the old tile is extremely compact and adherent to the ceramic body, despite presenting a network of cracks. Surface matting, iridescence, and pitting were also present. These are concentrated in areas of low wash-off, where rust and atmospheric deposition can easily accumulate.
The new handmade tiles, selected for the restoration, have a different composition from the original ones. The ceramic body shows higher calcium contents, but carbonates were not detected. Clay rich in calcium alluminates and silicates was probably used. The glaze presents a higher content of calcium and a lower percentage of lead; most likely, CaO was used as flux, as again, carbonates were not detected. Tin was added to obtain the lemon-yellow hue of the glaze. The tiles are a handmade local product, since Piedmont is adjacent to the Valle d’Aosta region.
Freeze-thaw cycles were performed to evaluate the resistance and behaviour of the new tile in comparison to the old one. Freeze-thaw resistance was considered as Aosta region experiences cold and humid winters. Both the old and new tiles were extremely resistant to freeze-thawing cycles in terms of glaze detachment possibility and formation of new cracks. Possible colour variations were difficult to evaluate due to the high variability among the glazes. Nevertheless, b* was the more affected chromatic coordinate for both the new and old tiles.
The restoration intervention with the new studied tiles is sustainable thanks to the use of local handmade tiles, and maintains the original aspect and behaviour of the roof, while it is always possible to individuate the old and new tiles thanks to the composition differences. The substituted parts in the restoration intervention remain recognizable, and the general appearance is maintained. For further restorations, the recommendation is to use tiles similar to the old ones, produced locally or in adjacent regions as the ones selected, and to reuse the old tiles whenever possible. The use of low porosity ceramic body in conjunction with a resistant glaze will stand the test of time. Further works can be done to individuate the possible origin of old tiles, possibly looking at the French manufacturers and their artisanal products.
5. Conclusions
Architects working in historic building conservation prefer to use materials close in composition and production techniques to the original ones. This aspect is often considered as crucial in terms of material compatibility and durability in heritage preservation. Plasters, tiles, and mortars with similar compositions would most likely undergo similar degradation processes and age in harmony with the original ones. Nevertheless, economic aspects should also be considered when analysing an object and evaluating its use as a restoration material, finding a fair compromise in terms of costs, outcomes and expected applications. In our research, the main interest was related to the proposal of tiles similar to the original ones and resistant to the climate of the Aosta region (Italy). This research deepens the knowledge on the glazed tile roof tradition, which is also present in the north of Europe, and forsees possible future applications in civil construction as well.
The scandole tiles analysis evidenced:
- a common red ceramic body rich in hematite, probably cooked between 800 °C (absence of carbonates) and 950 °C (presence of feldspars);
- a white slip present in most of the tiles and collocated below a coloured final glaze. This white slip was probably added to enhance the final tile colour and was thinner for the lighter yellowish glazes and thicker for the greenish ones;
- a final coloured glaze particularly rich in lead, with optimal adhesion to the ceramic body. The colour of the glaze was modulated, adding different elements: iron in the yellow ones, iron and copper in the green ones.
Next to the original tiles, an artisan tile recently produced for the roof restoration intervention was also investigated. The new tile shows a different glaze composition with a lower amount of lead and addition of tin, instead of iron, for obtaining a yellow glaze. An old and a new tile were also subjected to freeze-thawing cycles for investigating their durability. Freeze-thawing can be considered as one of the most relevant degradation factors in the area of Aosta in the wintertime. Both tiles demonstrated a good resistance, and only minor colour variations were depicted.
This research could be extended in the future for evaluating the possibility to tune tiles composition and production protocols in response to different climate scenarios and enviromental stressors.
Author Contributions
Conceptualization, E.M.C.C., E.B. and E.Z.; methodology, E.B. and E.Z.; software, E.M.C.C. and L.F.; validation, L.F. and E.Z.; formal analysis, E.Z.; investigation, E.M.C.C., E.B. and L.F.; resources, E.Z.; data curation, L.F. and E.B.; writing—original draft preparation, L.F.; writing—review and editing, E.B. and E.Z.; visualization, L.F.; supervision, E.Z.; project administration, E.B.; funding acquisition, E.Z. All authors have read and agreed to the published version of the manuscript.
Funding
This research received no external funding.
Institutional Review Board Statement
Not applicable.
Informed Consent Statement
Not applicable.
Data Availability Statement
The data presented in this study are available in the paper and are further available on request from the corresponding author. All consulted databases are referenced throughout the test; in particular, the “pigments checker database” at https://Chsopensource.Org/Fors/ (accessed on 20 June 2023) was used.
Acknowledgments
The authors would like to gently acknowledge the “Regione Autonoma Valle d’Aosta” (owner of Villa Pallin and “Casa delle Vigne” pavillon), the institute Agricole Régional, the architectural Studio Grosso of Pont-Saint-Martin and the architects Silvia Stroppa and Gabriele Grosso (restoration project managers), and Daniele Cecchi, master potter of Fornace Pagliero. The authors would like to thank the Patto per lo Sviluppo della Città di Venezia (Comune di Venezia) for their support in this research.
Conflicts of Interest
The authors declare no conflict of interest.
References
- Casasola, R.; Rincón, J.M.; Romero, M. Glass–Ceramic Glazes for Ceramic Tiles: A Review. J. Mater. Sci. 2012, 47, 553–582. [Google Scholar] [CrossRef] [Green Version]
- Ansaldo, M. Storie Dimenticate: Testimonianze di Vita Sociale Nell’antica Valle d’Aosta; Tipografia Valdostana: Aosta, Italy, 2002. [Google Scholar]
- Brayda, R. Tegole Ed Embrici Antichi e Moderni—Memoria Del Socio Ing. R. Brayda. In Atti della Società Degli Ingegneri e Degli Industriali di Torino; Politecnico di Torino: Torino, Italy, 1886; pp. 56–65. Available online: https://digit.biblio.polito.it/173/ (accessed on 1 August 2023).
- Pantò, G. I Centri Produttori di Ceramica in Piemonte (Secoli XVII-XIX); All’Insegna del Giglio: Sesto Fiorentino, Italy, 2002. [Google Scholar]
- Cechi, D. Realization of New Scandole with Traditional Method. Available online: www.fornacepagliero.it (accessed on 25 June 2023).
- Gin, S.; Delaye, J.-M.; Angeli, F.; Schuller, S. Aqueous Alteration of Silicate Glass: State of Knowledge and Perspectives. Npj Mater. Degrad. 2021, 5, 42. [Google Scholar] [CrossRef]
- Ion, R.-M.; Fierascu, R.-C.; Teodorescu, S.; Fierascu, I.; Bunghez, I.-R.; Turcanu-Carutiu, D.; Ion, M.-L. Ceramic Materials Based on Clay Minerals in Cultural Heritage Study. In Clays, Clay Minerals and Ceramic Materials Based on Clay Minerals; InTech: Vienna, Austria, 2016. [Google Scholar]
- Porfido, C.; Rizzo, R.E.; Healy, D.; Spagnuolo, M.; Terzano, R.; Allegretta, I. Investigating the Evolution of Fractures in Clay–Based Ceramics during Repeated Freeze-Thawing Cycles Using X-ray Micro-Computed Tomography and Image Analysis. Mater. Charact. 2021, 177, 111185. [Google Scholar] [CrossRef]
- Colomban, P. Glass, Pottery and Enamelled Objects: Identification of Their Technology and Origin. In Conservation Science: Heritage Materials, 2nd ed.; Garside, P., Richardson, E., Eds.; RSC: Cambridge, UK, 2020; p. 978. [Google Scholar]
- Zhao, J.; Li, W.; Luo, H.; Miao, J. Research on Protection of the Architectural Glazed Ceramics in the Palace Museum, Beijing. J. Cult. Herit. 2010, 11, 279–287. [Google Scholar] [CrossRef]
- Holclajtner-Antunović, I.; Bajuk-Bogdanović, D.; Bikić, V.; Marić-Stojanović, M. Micro-Raman and Infrared Analysis of Medieval Pottery Findings from Braničevo, Serbia. J. Raman Spectrosc. 2012, 43, 1101–1110. [Google Scholar] [CrossRef]
- Raškovska, A.; Minčeva-Šukarova, B.; Grupče, O.; Colomban, P. Characterization of Pottery from Republic of Macedonia II. Raman and Infrared Analyses of Glazed Pottery Finds from Skopsko Kale. J. Raman Spectrosc. 2010, 41, 431–439. [Google Scholar] [CrossRef]
- Glass Trace Elements NIST-614. Available online: https://www.lgcstandards.com/US/en/Glass-Trace-elements/p/NIST-614 (accessed on 4 July 2023).
- Colomban, P.; Sagon, G.; Faurel, X. Differentiation of Antique Ceramics from the Raman Spectra of Their Coloured Glazes and Paintings. J. Raman Spectrosc. 2001, 32, 351–360. [Google Scholar] [CrossRef]
- Colomban, P.; Paulsen, O. Non-Destructive Determination of the Structure and Composition of Glazes by Raman Spectroscopy. J. Am. Ceram. Soc. 2005, 88, 390–395. [Google Scholar] [CrossRef]
- Colomban, P.; Arberet, L.; Kırmızı, B. On-Site Raman Analysis of 17th and 18th Century Limoges Enamels: Implications on the European Cobalt Sources and the Technological Relationship between Limoges and Chinese Enamels. Ceram. Int. 2017, 43, 10158–10165. [Google Scholar] [CrossRef] [Green Version]
- Vieira Ferreira, L.F.; Ferreira, D.P.; Conceição, D.S.; Santos, L.F.; Pereira, M.F.C.; Casimiro, T.M.; Ferreira Machado, I. Portuguese Tin-Glazed Earthenware from the 17th Century. Part 2: A Spectroscopic Characterization of Pigments, Glazes and Pastes of the Three Main Production Centers. Spectrochim. Acta A Mol. Biomol. Spectrosc. 2015, 149, 285–294. [Google Scholar] [CrossRef]
- Vieira Ferreira, L.F.; Conceição, D.S.; Ferreira, D.P.; Santos, L.F.; Casimiro, T.M.; Ferreira Machado, I. Portuguese 16th Century Tiles from Santo António Da Charneca’s Kiln: A Spectroscopic Characterization of Pigments, Glazes and Pastes. J. Raman Spectrosc. 2014, 45, 838–847. [Google Scholar] [CrossRef]
- Moropoulou, A.; Bakolas, A.; Bisbikou, K. Thermal Analysis as a Method of Characterizing Ancient Ceramic Technologies. Thermochim. Acta 1995, 269–270, 743–753. [Google Scholar] [CrossRef]
- Cantelli, M.; Facchi, A.; Izzo, F.; Zendri, E. Characterization of Etruscan Non-Vascular Ceramic Fragments. In Proceedings of the 2020 IMEKO TC-4 International Conference on Metrology for Archaeology and Cultural Heritage, Trento, Italy, 22–24 October 2020; pp. 585–589. [Google Scholar]
- Alves de Oliveira, H.; Pereira dos Santos, C. Limestone Clays for Ceramic Industry. In Clay Science and Technology; IntechOpen: Rijeka, Croatia, 2021. [Google Scholar]
- Cannillo, V.; Esposito, L.; Rambaldi, E.; Sola, A.; Tucci, A. Microstructural and Mechanical Changes by Chemical Ageing of Glazed Ceramic Surfaces. J. Eur. Ceram. Soc. 2009, 29, 1561–1569. [Google Scholar] [CrossRef]
- Padeletti, G.; Fermo, P.; Gilardoni, S.; Galli, A. Technological Study of Ancient Ceramics Produced in Casteldurante (Central Italy) during the Renaissance. Appl. Phys. A 2004, 79, 335–339. [Google Scholar] [CrossRef]
- Peng, I.; Hills-Kimball, K.; Lovelace, I.M.; Wang, J.; Rios, M.; Chen, O.; Wang, L.-Q. Exploring the Colors of Copper-Containing Pigments, Copper (II) Oxide and Malachite, and Their Origins in Ceramic Glazes. Colorants 2022, 1, 376–387. [Google Scholar] [CrossRef]
- Pee, J.H.; Kim, G.H.; Choi, Y.D.; Jung, D.S.; Kang, G.I. Effect of Flux Materials on the Melting Characteristics of Ash Glaze. Key Eng. Mater. 2014, 608, 21–25. [Google Scholar] [CrossRef]
- Aceto, M.; Fenoglio, G.; Labate, M.; Picollo, M.; Bacci, M.; Agostino, A. A Fast Non-Invasive Method for Preliminary Authentication of Mediaeval Glass Enamels Using UV–Visible–NIR Diffuse Reflectance Spectrophotometry. J. Cult. Herit. 2020, 45, 33–40. [Google Scholar] [CrossRef]
- Micheletti, F.; Orsilli, J.; Melada, J.; Gargano, M.; Ludwig, N.; Bonizzoni, L. The Role of IRT in the Archaeometric Study of Ancient Glass through XRF and FORS. Microchem. J. 2020, 153, 104388. [Google Scholar] [CrossRef]
- Reflectance Spectroscopy (350–950 Nm) (Gorgias) Pigments-Checker Database. Available online: https://Chsopensource.Org/Fors/ (accessed on 24 May 2023).
- Picollo, M.; Casini, A.; Cucci, C.; Cherubini, F.; Stefani, L. Application of hyper-spectral imaging technique for colorimetric analysis of paintings. SCIRES-IT 2022, 12, 69–76. [Google Scholar]
- Carvalho, F.; Coentro, S.; Costeira, I.; Trindade, R.A.A.; Alves, L.C.; da Silva, R.C.; Muralha, V.S.F. The Cistercian Glazed Tiles of the Monastery of Alcobaça: Characterization of the Colour Palette. J. Mediev. Iber. Stud. 2016, 8, 196–216. [Google Scholar] [CrossRef]
- Murad, E. Identification of Minor Amounts of Anatase in Kaolins by Raman Spectroscopy. Am. Mineral. 1997, 82, 203–206. [Google Scholar] [CrossRef]
- Lafuente, B.; Downs, R.T.; Yang, H.; Stone, N. 1. The Power of Databases: The RRUFF Project. In Highlights in Mineralogical Crystallography; DE GRUYTER: Berlin, Germany, 2015; pp. 1–30. [Google Scholar]
- Colomban, P.; Tournie, A.; Bellot-Gurlet, L. Raman Identification of Glassy Silicates Used in Ceramics, Glass and Jewellery: A Tentative Differentiation Guide. J. Raman Spectrosc. 2006, 37, 841–852. [Google Scholar] [CrossRef] [Green Version]
- Dabanli, Ö.; Yildiz, D.; Bayazit, M. Composition and phase analysis on glazed tiles of southeast anatolia: Production process identification. Mediterr. Archaeol. Archaeom. 2021, 21, 1–22. [Google Scholar] [CrossRef]
- Leśniak, M.; Partyka, J.; Gajek, M.; Sitarz, M. FTIR and MAS NMR Study of the Zinc Aluminosilicate Ceramic Glazes. J. Mol. Struct. 2018, 1171, 17–24. [Google Scholar] [CrossRef]
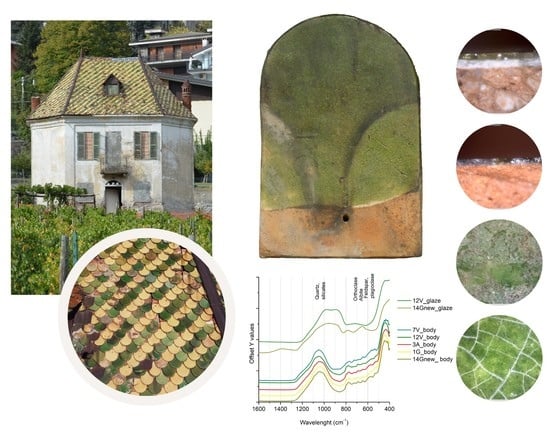
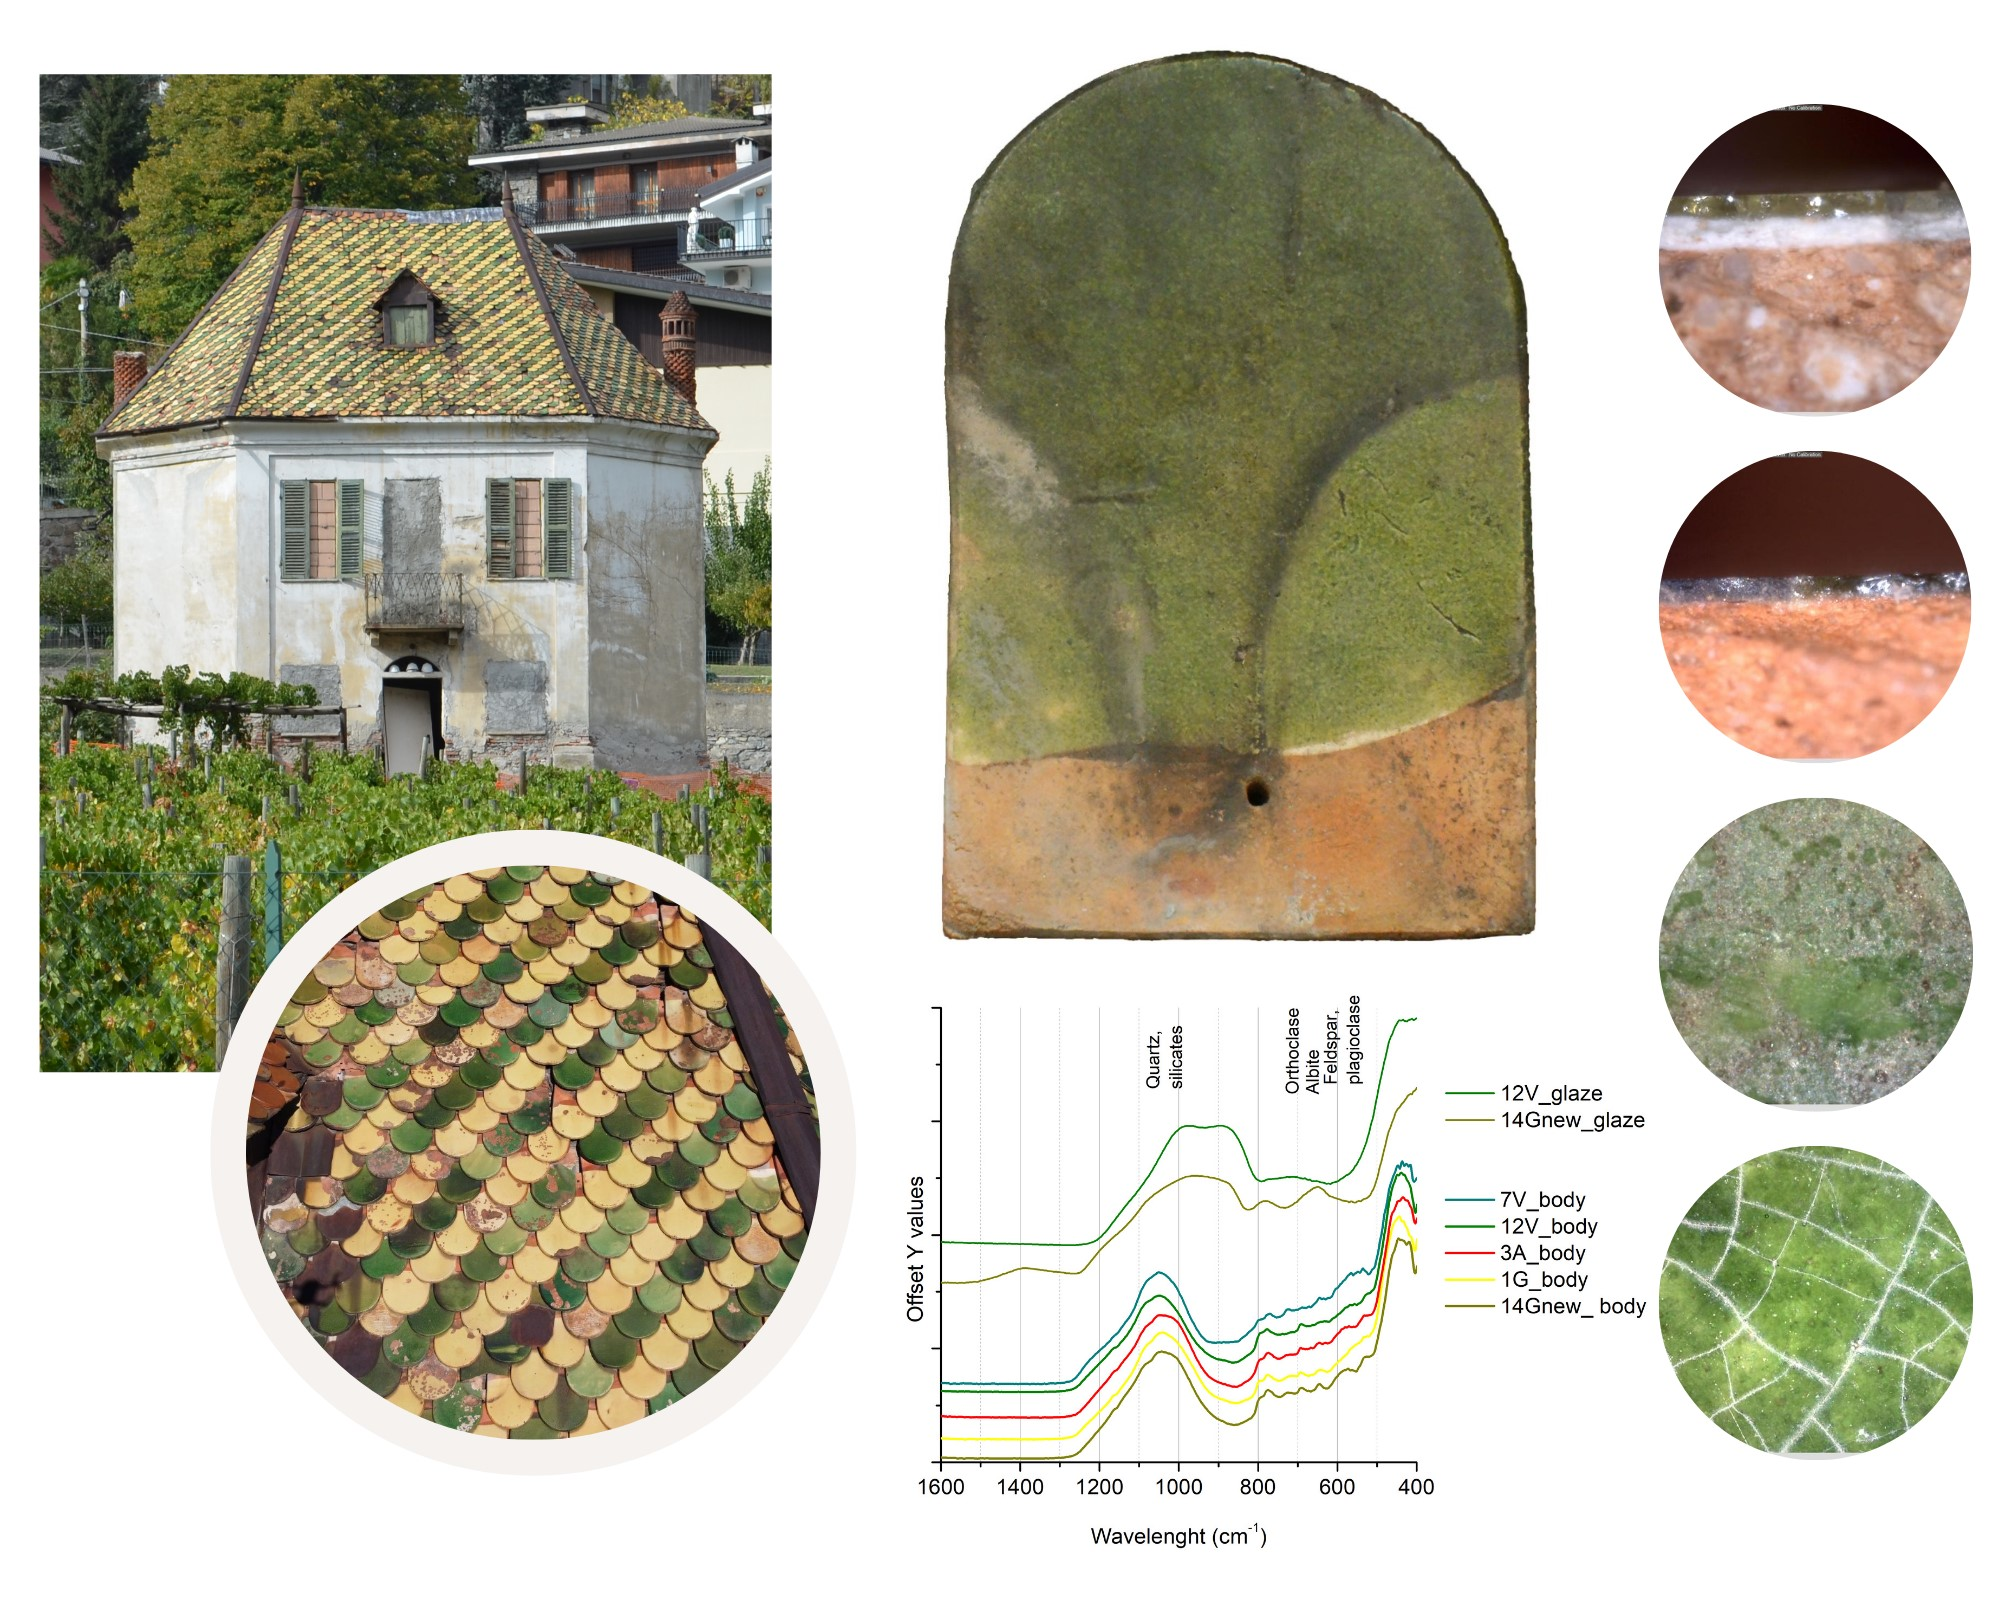
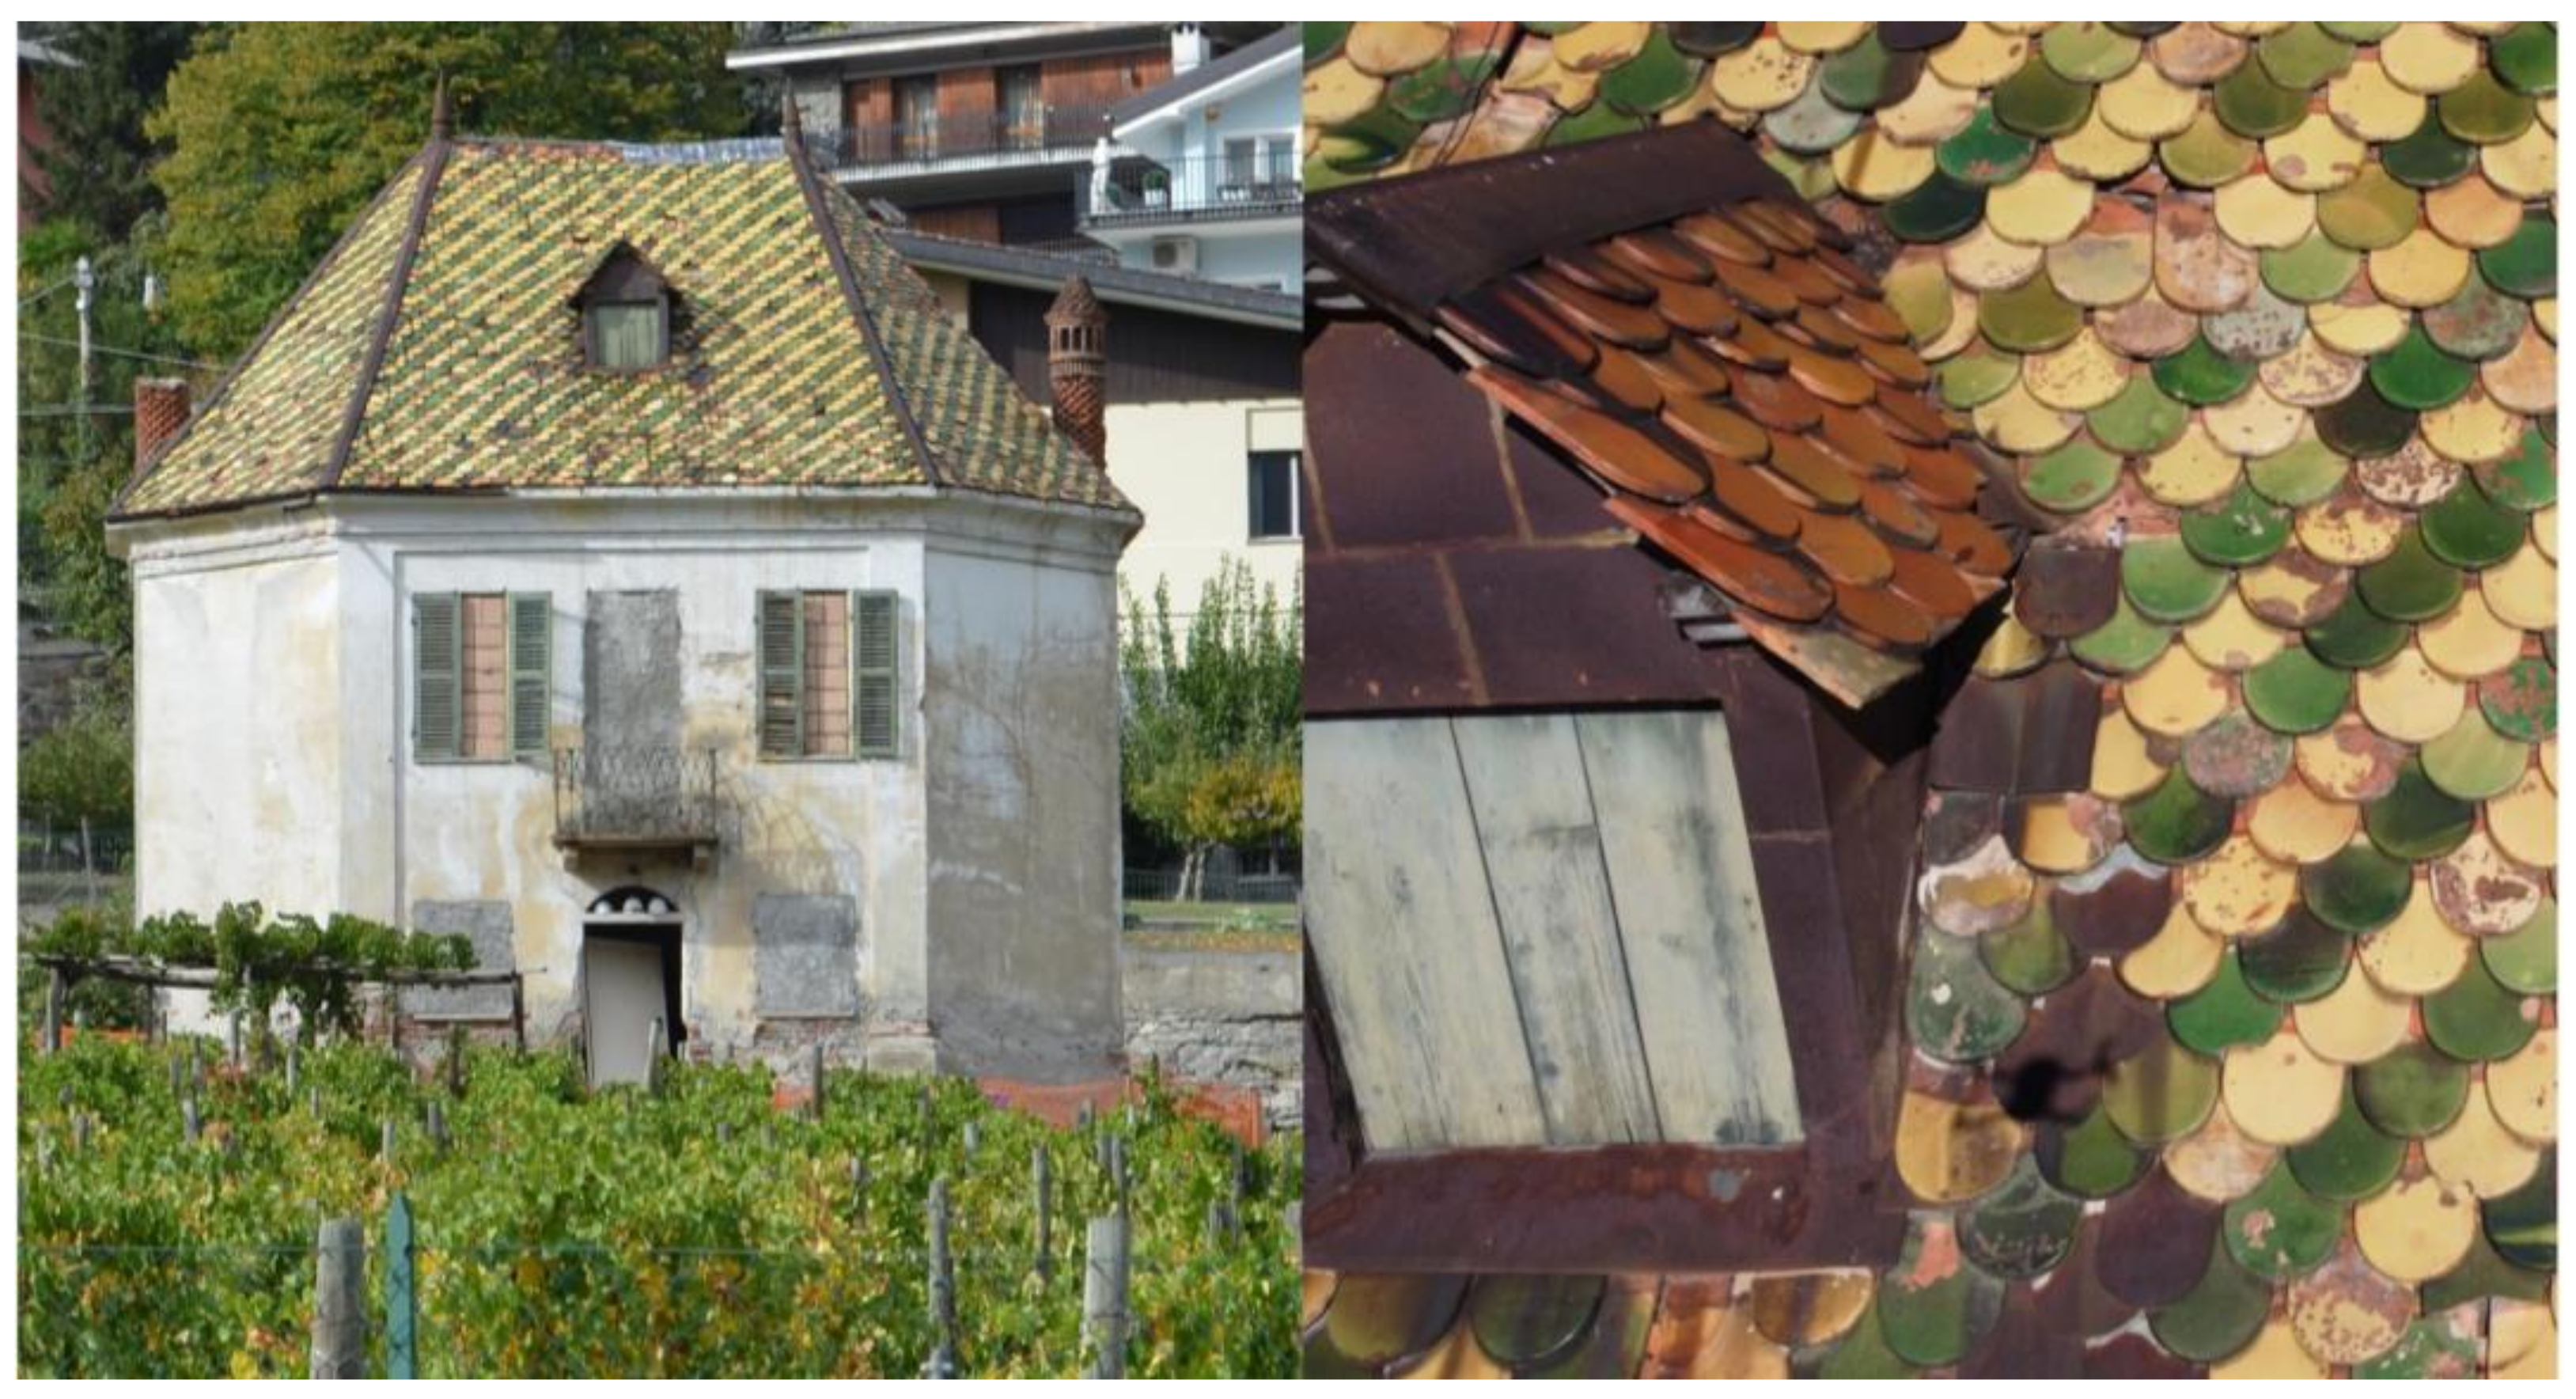
Figure 1.
(Left): the 18th century pavillon “Casa delle Vigne” in Aosta (northeast Italy) with its peculiar tiles roof. (Right): the fish-scale pattern commonly used for tile alignment in roofing.
Figure 1.
(Left): the 18th century pavillon “Casa delle Vigne” in Aosta (northeast Italy) with its peculiar tiles roof. (Right): the fish-scale pattern commonly used for tile alignment in roofing.

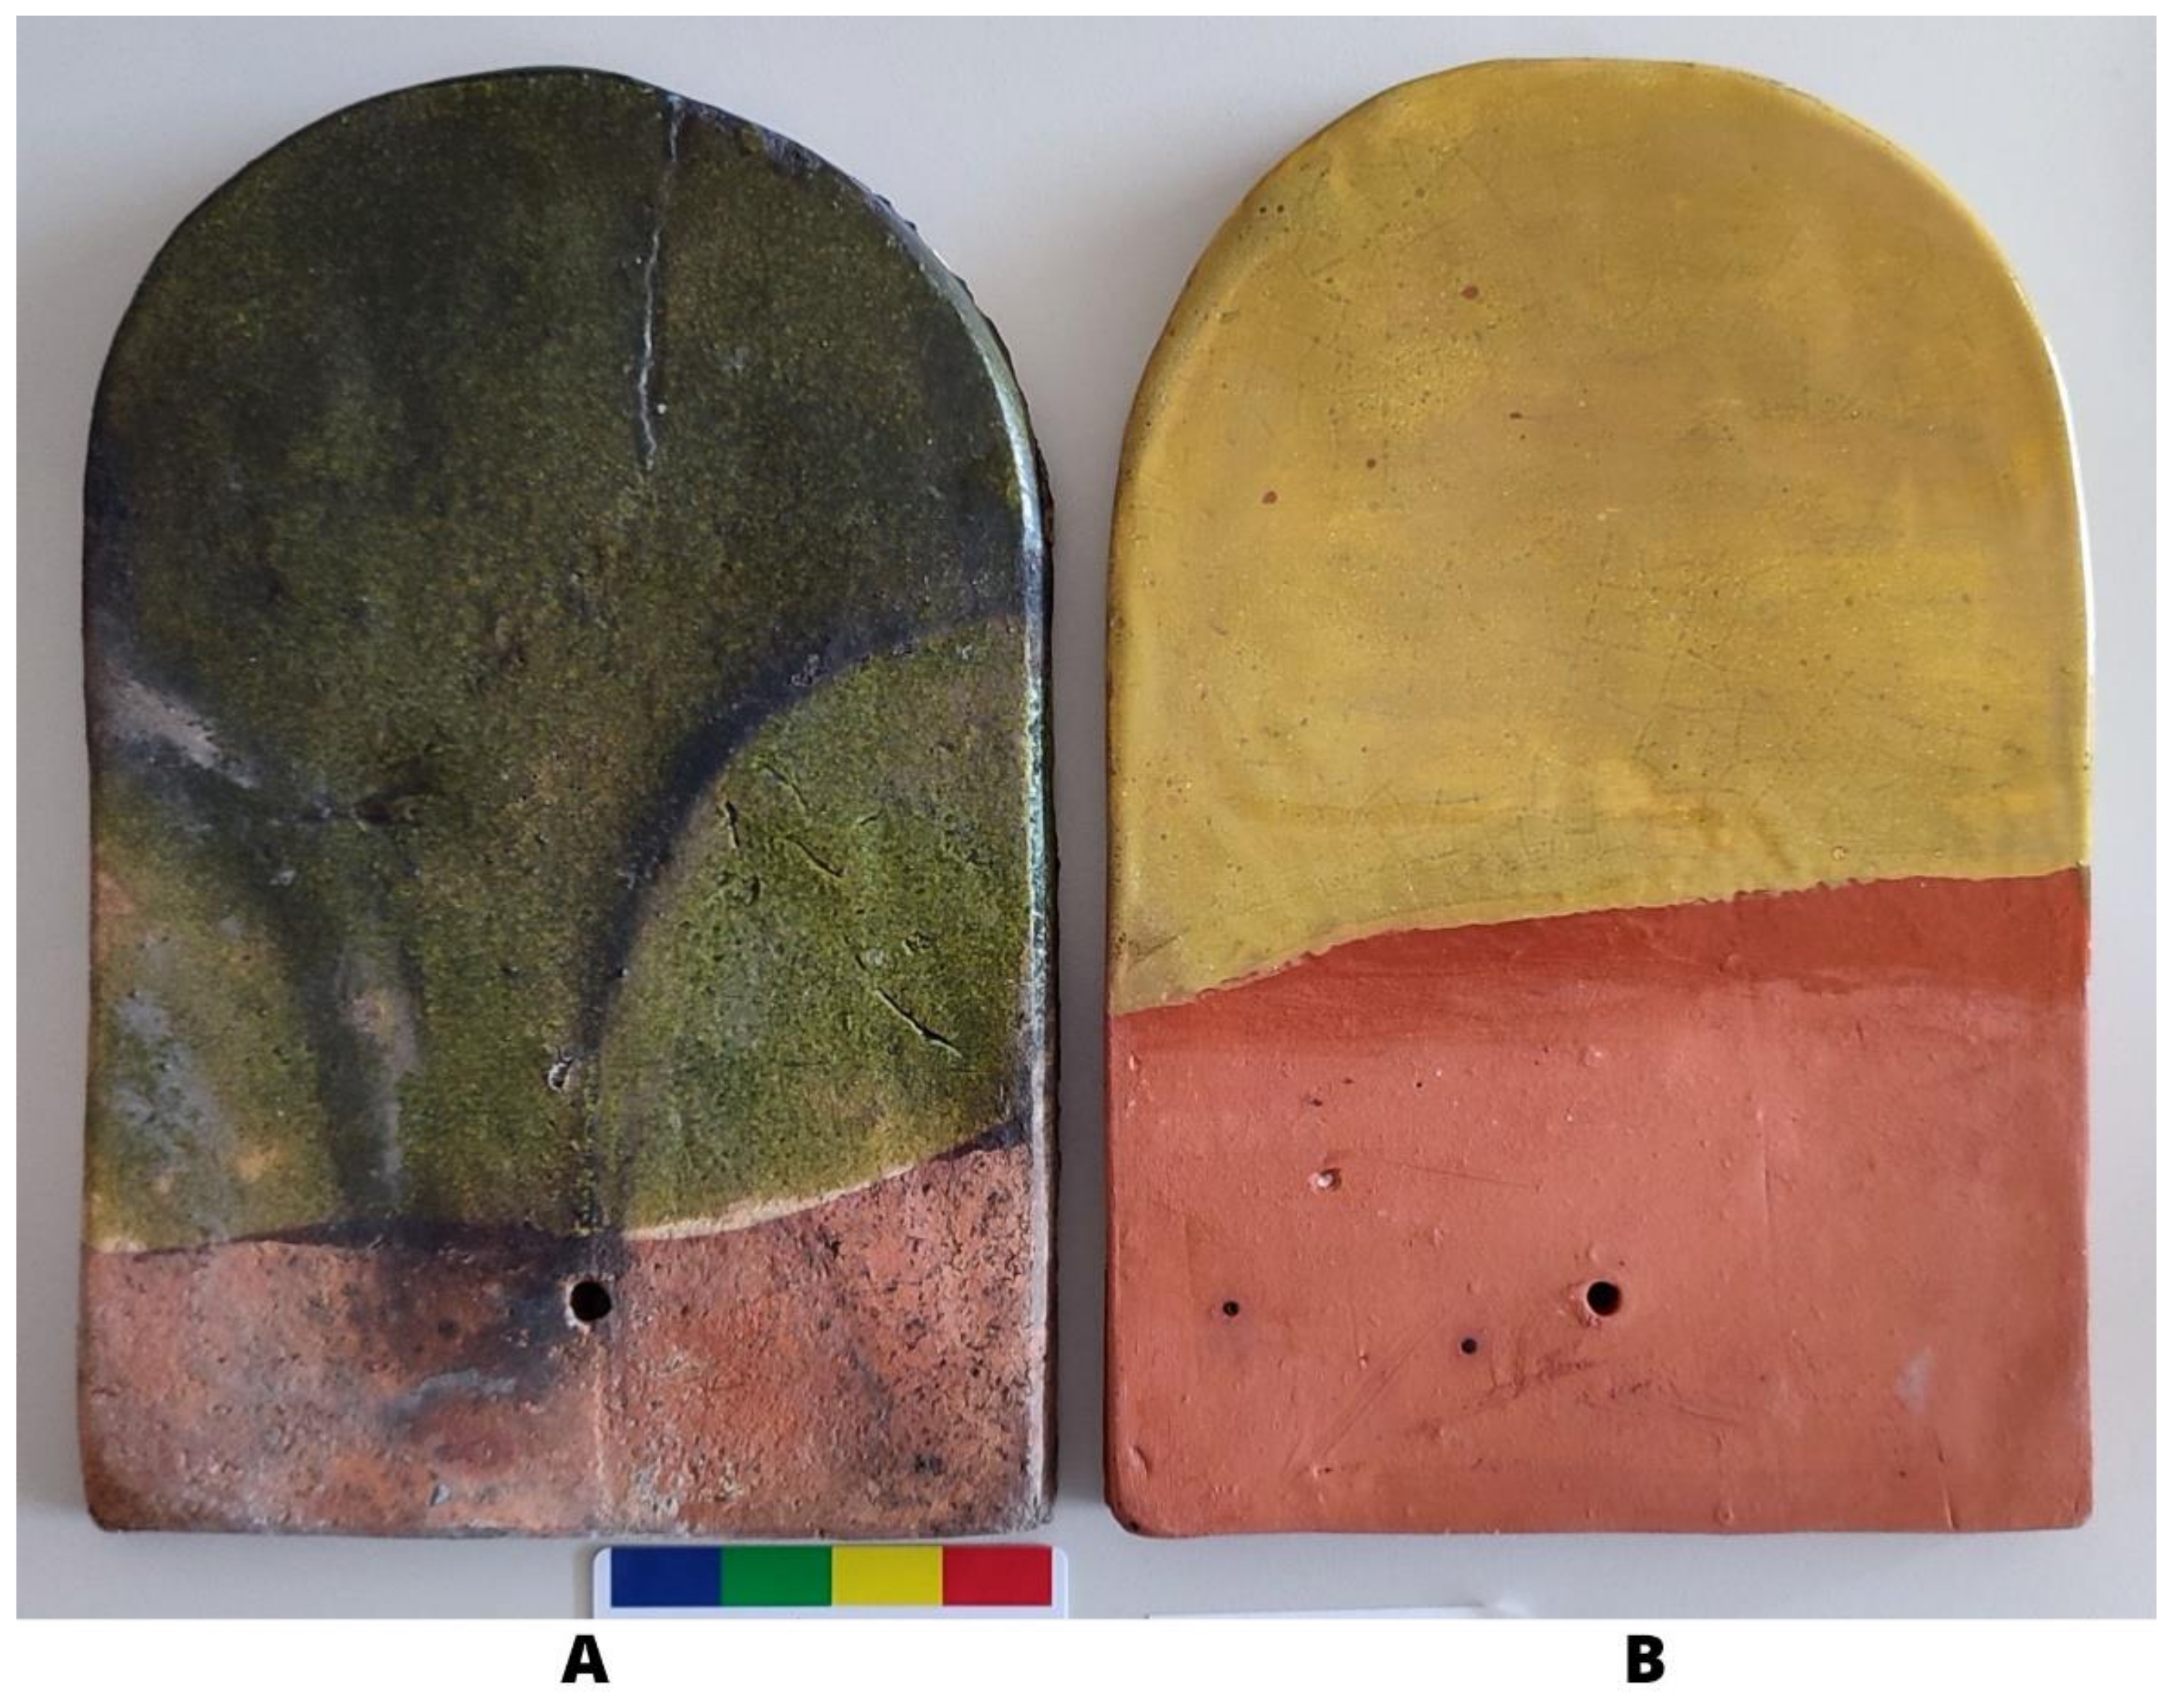
Figure 2.
Image of an original roof tile ((A)—sample 13V) and a new one ((B)—sample 14G).

Figure 3.
Examples of analysed fragments, visible images, and optical microscope observation of the obtained cross sections showing the glaze layer, the slip and the ceramic body in green ceramics (A); glaze and ceramic body and a thin slip layer in yellowish ceramic fragments (B); ceramic body overlapped by a thin transparent layer in red ceramic fragments (C).

Figure 4.
Example of degradation patterns visible on the original tiles: detachment of glaze due to freeze-thaw cycles (A); optical microscope observation (50×) highlighting the crack network of the glazes (B); scratches and cracking (C); dirt deposition and discolouration of covered and non-covered parts (D,E); stains on the ceramic body and scratches (E,F).

Figure 5.
XRF spectra of the different glaze types and ceramic bodies: violet = 14G sample; yellow = yellow glaze 11G; red = transparent glaze in sample 3A; dark green = green glaze in sample 10V.
Figure 5.
XRF spectra of the different glaze types and ceramic bodies: violet = 14G sample; yellow = yellow glaze 11G; red = transparent glaze in sample 3A; dark green = green glaze in sample 10V.

Figure 6.
Reflectance spectra of yellow, green, transparent glazes for old and new tiles.

Figure 7.
Raman Spectra of the glaze (left) and the ceramic body (right of samples 1G, 3A, 8V, 19V, and 14G_new).
Figure 7.
Raman Spectra of the glaze (left) and the ceramic body (right of samples 1G, 3A, 8V, 19V, and 14G_new).

Figure 8.
Raman spectra of 3A glaze with deconvolution of the silicates peak in the Qn components.

Figure 9.
FT-IR spectra of ceramic body and glazes of sample 1G, 3A, 7V, 12V, 14G_new.

Figure 10.
TG-DSC curves of the ceramic body of samples 1G, 3A, 7V, 14G_new.

Figure 11.
Comparison of the surfaces of 13V (A) and 14G_ (B) tiles before and after 20 freeze-thawing cycles, visible and optical microscope (55×) pictures.
Figure 11.
Comparison of the surfaces of 13V (A) and 14G_ (B) tiles before and after 20 freeze-thawing cycles, visible and optical microscope (55×) pictures.

Figure 12.
(Left): Capillary water absorption of the tiles during the first cycle; (Right): Water uptake percentage at each cycle.
Figure 12.
(Left): Capillary water absorption of the tiles during the first cycle; (Right): Water uptake percentage at each cycle.


Table 1.
Main visible features of the analysed samples. The ● symbol indicates if the features and characteristics was detected.
Table 1.
Main visible features of the analysed samples. The ● symbol indicates if the features and characteristics was detected.
| Samples | Ceramic Body | Bright Slip Presence | Glaze Colour * | Features and Degradation Patterns | ||||||
|---|---|---|---|---|---|---|---|---|---|---|
| Paste Colour * | Crystals ≤ 100 μm | Crystals ≥ 100 μm | Cracks Network | Dark Deposition | Pitting | Opaque Areas | Stains | |||
| 1G | DR | ● | ● | Y | ● | ● | ● | ● | ||
| 2G | LR | ● | ● | Y | ● | |||||
| 3A | DR | ● | T | ● | ● | |||||
| 4A | DR | ● | T | ● | ● | ● | ● | |||
| 5G | DR | ● | ● | Y-T | ● | |||||
| 6V | DR | ● | ● | G | ● | ● | ||||
| 7V | LR | ● | ● | G | ● | ● | ||||
| 8V | DR | ● | ● | G | ● | ● | ● | |||
| 9G | LR | ● | ● | Y | ● | ● | ||||
| 10G | DR | ● | ● | T | ● | ● | ||||
| 11V | DR | ● | ● | G | ||||||
| 12V | DR | ● | Y | |||||||
| 13V | DR | ● | ● | ● | G | |||||
| 14G_new | R | ● | Y | ● | Bright stains | |||||
* DR = dark red; LR = Light red; Y = yellow; T = transparent; G = green.
Table 2.
Semi-quantitative results of elements percentage detected in the ceramic body, slip and glaze of the analysed samples. Na and Mg were not considered in the quantification.
Table 2.
Semi-quantitative results of elements percentage detected in the ceramic body, slip and glaze of the analysed samples. Na and Mg were not considered in the quantification.
| Atomic Wt% | Al | Si | K | Ca | Ti | Fe | Pb | Cu | Zn | Others (Traces) |
|---|---|---|---|---|---|---|---|---|---|---|
| Ceramic body | ||||||||||
| 3A_CC | 22 | 37 | 7 | 3 | 2 | 25 | 2 | tr | <1% | Cr, Mn, Ni |
| 10V_CC | 21 | 43 | 9 | 3 | 3 | 21 | tr | tr | <1% | |
| 13G_CC | 18 | 37 | 7 | 2 | 2 | 33 | tr | tr | <1% | |
| 14G_new | 15 | 39 | 8 | 13 | 3 | 21 | 1 | tr | <1% | |
| Slip | ||||||||||
| 1G_B1 | 20 | 56 | 10 | 1 | 1 | 10 | 1 | tr | tr | Cr, Mn |
| 1V_B1 | 25 | 48 | 10 | 2 | 2 | 10 | 1 | tr | tr | |
| 7V_B1 | 18 | 52 | 11 | 2 | 1 | 10 | 3 | 3 | tr | |
| 11G_B1 | 28 | 45 | 11 | 2 | 2 | 11 | 1 | tr | tr | |
| 16V_B | 25 | 43 | 8 | 2 | 2 | 20 | 1 | tr | tr | |
| Glaze | ||||||||||
| 1G_V | 7 | 35 | <1% | 1 | 1 | 3 | 52 | <1% | tr | Cr, Mn, Ni (0.2 < Ni < 1%) |
| 2G_V | 8 | 35 | 1 | 3 | 1 | 3 | 50 | <1% | <1% | |
| 3A_V | 8 | 34 | <1% | 2 | 1 | 3 | 51 | <1% | <1% | |
| 4A_V | 7 | 29 | 3 | 2 | 1 | 4 | 53 | <1% | tr | |
| 5G_V | 6 | 37 | 1 | 2 | 0 | 2 | 52 | <1% | tr | |
| 8V_V | 7 | 27 | 1 | 2 | 1 | 4 | 49 | 9 | <1% | |
| 10V_V | 6 | 34 | 1 | 2 | 1 | 3 | 46 | 7 | tr | |
| 11G_V | 6 | 29 | <1% | 1 | 1 | 1 | 61 | <1% | <1% | |
| 14G_new | 4 | 34 | 2 | 19 | 2 | 4 | 28 | tr | 6 | |
| 16V_V | 7 | 27 | 2 | 5 | 1 | 2 | 46 | 10 | <1% | |
| 19V_V | 7 | 25 | 1 | 2 | 1 | 6 | 50 | 8 | <1% | |
| 20V_V | 8 | 34 | 1 | 3 | 1 | 3 | 41 | 9 | <1% |
Table 3.
Colour variations measured in three different points (a, b, c) on the ceramic glaze of the old (13V) and new (14G) after 10 and after 20 cycles.
Table 3.
Colour variations measured in three different points (a, b, c) on the ceramic glaze of the old (13V) and new (14G) after 10 and after 20 cycles.
| Colour Variations ∆ | 10 Cycles | 20 Cycles | ||||||
|---|---|---|---|---|---|---|---|---|
| ∆L * 10 | ∆a * 10 | ∆b * 10 | ∆E 10 | ∆L * 20 | ∆a * 02 | ∆b * 20 | ∆E 20 | |
| 14G_new a | −0.2 | 1.2 | −0.5 | 1.3 | −2.0 | 1.5 | −0.6 | 2.6 |
| 14G_new b | −0.7 | −1.5 | −0.1 | 1.7 | 0.1 | −0.5 | 0.1 | 0.6 |
| 14G_new c | 3.6 | −1.8 | 6.1 | 7.3 | 3.5 | −2.0 | 6.0 | 7.2 |
| 13V_old a | −6.4 | −0.9 | −9.3 | 11.3 | −8.4 | −1.1 | −11.0 | 13.9 |
| 13V_old b | −3.8 | −0.2 | −4.2 | 5.7 | −5.2 | −1.2 | −5.1 | 7.3 |
| 13V_old c | 3.0 | −1.3 | 2.2 | 3.9 | −6.1 | 1.3 | −7.7 | 9.9 |
Disclaimer/Publisher’s Note: The statements, opinions and data contained in all publications are solely those of the individual author(s) and contributor(s) and not of MDPI and/or the editor(s). MDPI and/or the editor(s) disclaim responsibility for any injury to people or property resulting from any ideas, methods, instructions or products referred to in the content. |
© 2023 by the authors. Licensee MDPI, Basel, Switzerland. This article is an open access article distributed under the terms and conditions of the Creative Commons Attribution (CC BY) license (https://creativecommons.org/licenses/by/4.0/).
Share and Cite
MDPI and ACS Style
Balliana, E.; Caveri, E.M.C.; Falchi, L.; Zendri, E. Tiles from Aosta: A Peculiar Glaze Roof Covering. Colorants 2023, 2, 533-551. https://doi.org/10.3390/colorants2030026
AMA Style
Balliana E, Caveri EMC, Falchi L, Zendri E. Tiles from Aosta: A Peculiar Glaze Roof Covering. Colorants. 2023; 2(3):533-551. https://doi.org/10.3390/colorants2030026
Chicago/Turabian StyleBalliana, Eleonora, Eugénie Marie Claudine Caveri, Laura Falchi, and Elisabetta Zendri. 2023. "Tiles from Aosta: A Peculiar Glaze Roof Covering" Colorants 2, no. 3: 533-551. https://doi.org/10.3390/colorants2030026