A New FANET Simulator for Managing Drone Networks and Providing Dynamic Connectivity


DIMES Department, University of Calabria, via P. Bucci 39/c, 87036 Arcavacata di Rende, Cosenza, Italy
*
Author to whom correspondence should be addressed.
Electronics 2020, 9(4), 543; https://doi.org/10.3390/electronics9040543
Submission received: 14 February 2020
/
Revised: 13 March 2020
/
Accepted: 19 March 2020
/
Published: 25 March 2020
(This article belongs to the Special Issue Unmanned Aerial Vehicles: Platforms, Applications, Security and Services)
Abstract
:In the last decade, the attention on unmanned aerial vehicles has rapidly grown, due to their ability to help in many human activities. Among their widespread benefits, one of the most important uses regards the possibility of distributing wireless connectivity to many users in a specific coverage area. In this study, we focus our attention on these new kinds of networks, called flying ad-hoc networks. As stated in the literature, they are suitable for all emergency situations where the traditional networking paradigm may have many issues or difficulties to be implemented. The use of a software simulator can give important help to the scientific community in the choice of the right UAV/drone parameters in many different situations. In particular, in this work, we focus our main attention on the new ways of area covering and human mobility behaviors with the introduction of a UAV/drone behavior model to take into account also drones energetic issues. A deep campaign of simulations was carried out to evaluate the goodness of the proposed simulator illustrating how it works.
1. Introduction
With the huge development of drone management, in terms of regulation [1] and ad-hoc protocols for 3D environments [2], Unmanned Aerial Vehicles (UAVs) are becoming a new and efficient way of providing wireless connectivity to the users in a specific geographical area covered by UAVs/drones. Given the possibility to access hostile environments and desolate places, drones can be used in many emergency situations (with the related disaster events) where the availability of temporary, prompt, and efficient communication with the outside world can provide important help for saving lives or executing rescue operations. Let us think, for example, to severe weather events, earthquakes, sabotage, and other natural or man-made disasters which can destroy water lines, roadways, bridges, oil and gas pipelines, power plants, transmission lines, and other infrastructures. The communication network composed by a dynamic set of UAVs is well known in the literature as Flying Ad-hoc NETwork (FANET), a particular type of Mobile Ad-hoc NETwork (MANET), in which the mobile nodes are the UAVs/drones that can construct self-organizing networks [3] and more complicated 3D mobility models. The way a fleet of drones can provide a reliable coverage service has been an important research topic for several years [4]. FANETs aim to maintain a certain quality of transmission deploying also node movement predictions [5,6,7]. The cooperation between these devices is fundamental for an optimal coverage service, because it is based on many coordination techniques, able to create collaborating fleet of drones, paying attention to energy issues [8] and channel state [9,10] conditions.
This paper is the extension of the conference paper [11] and it has the aim of providing the design and the realization of a software simulator written in Java language, able to point the attention on a set of important aspects of a FANET network. This kind of network is composed of a team of UAVs/drones that, as in our case, are able to provide and guarantee connectivity to users that are under their coverage. Moreover, the implemented software has the possibility of importing real maps directly from Google Maps platform. The particularity of the simulator is the management of the users based on a human mobility model that previews the subdivision of the map in different Points of Interest (PoIs) in which different typologies of users can move. PoIs represent the places crossed by mobile users that move towards a particular destination. The software is equipped also with a Graphical User Interface (GUI) that allows setting parameters such as the number of drones for covering an area, the number of users in the area, the specific drones parameters such as height and coverage radius, network resource in terms of available bandwidth, traffic typology, and so on. In addition to the previous conference paper, where the authors integrated the simulator with a human mobility model, for modeling users movements in the covered area, and a footprint model, for modeling drones channel and calculate the correct drone height on the basis of the coverage radius, a new drone behavior model taking into account the limited autonomy of these devices that have the necessity of recharging their batteries for continuing in the specific task and a a energy consumption model for considering the decreasing of energy during the flight are also introduced. The whole simulator was based on the current and newer Italian/European legislation related to the new ENAC proposal, which will be effective from July 2020, and on a review of the current state of UAV Regulations [12]. The constraints used in the simulator have been extracted from the LIC15 draft [13,14] and the main ones are resumed in Table 1. In the simulator, a standard link state protocol with periodical updates was implemented, for considering availability of bandwidth resources in the area where moving the users. Numerical results confirm the goodness of the proposed simulation software.
The remainder of this paper is organized as follows. Section 2 presents the most recent works on the considered research topics. Section 3 describes the FANETSim network simulator, with more emphasis to its main components. Section 4 describes the Java simulation environment and the implementation details. Numerical results are presented in Section 5. Section 6 summarizes the main conclusions and future works.
2. Related Work
The UAVs management introduces many issues in terms of coverage guarantees, protocol communications, self coordination, path planning, software modules implementation, privacy, and civilian use [1]. It is a quite new opportunity for realizing a new kind of temporary and dynamic infrastructure and, in the last years, it has been the subject of a lot of research activity [2]. In fact, the utilization fields of these devices are many and different, such as: connectivity, precision agriculture, disaster and recovery, and so on. In the literature exist many studies concerning the use of UAVs/drones in different scenarios showing their enormous potentiality in many applicative domains. Among different works, some propose new software simulators tailored on specific applications and then capable of analyzing in depth the UAVs/drones’ behavior. In the following, some of literature works are presented showing the studies of the researchers concerning drones’ simulators suitable for covering a particular region and giving connectivity to the users.
2.1. UAVs/drones Path Planning
The general problem of the optimum path has been investigated for many years, not only in the UAV environment. However, when considering a particular architecture, the best-path evaluation from a source point to a destination point should consider some particular constraints.
For example, Huang et al. [4] analyzed the problem of drones deployment with particular attention to the maximization of terrestrial user coverage and the minimization of drone communication costs. The authors proposed an optimization model to seek the optimal positions on the street graph for the drones to optimize the objective subject to that the drones and the Base Stations form a connected graph. By the analysis of real datasets, the authors showed that a local optimum can be evaluated.
Mardani et al. [15] addressed the problem of path planning for maximizing the quality of video streaming applications. The authors proposed two schemes, based on the A* search algorithm with Dubins-path [16], taking into account the limited energy availability, the wind effect, and the path post-smoothing, in order to avoid squared paths. Both algorithms optimize the path jointly in terms of distance and throughput experienced by the drone. Numerical results confirm the effectiveness of the proposed scheme.
Ghaddar et al. [17] considered the management of UAV flights for monitoring geographical zones while optimizing the paths for covering the considered area of interests and minimizing energy consumption. The proposed scheme also aims to achieve the minimum completion-time, minimum number of turns, to lower the energy consumption, and having a shortest mission path to cover the whole area. They considered one rotary wing drone, without obstacles and non-flying zones. The path is planned again by considering a grid-based geographical decomposition.
2.2. UAV/Drone Simulators
In this subsection, we present some of the more recent works in literature that deal with UAV/drone simulators showing different contexts of use. The simulators are very important given that most of the experiments using real prototypes or systems are not feasible due to the costs and risks involved.
De Rango et al. [18,19,20] proposed a software simulator in the field of agriculture domain able to define specific variables and parameters and to test mechanisms of UAV/drone team control and coordination. These articles suggest new techniques of UAV coordination and monitoring of the specific region in order to cope with the parasites. The proposed techniques show how the UAVs’ behavior and performance vary when different constraints, for example coverage range for communication, consumed energy, and drones resources, are taken into account.
Marconato et al. [21] proposed a hybrid software-based simulator called Aerial Vehicle Network Simulator (AVENS). This simulator merges X-Plane and OMNeT++ integrated with LARISSA (Layered architecture model for interconnection of systems in UAS). They integrated several networking protocols. The two simulators offer different functionalities: X-Plane allows controlling the flight; OMNeT++ allows measuring network parameters such as throughput, packet loss, and so on. Information between the two environments are exchanged through XML files.
Zema et al. [22] showed a novel simulation suite for networked flying robots, as the result of the integration of two already validated solutions: FL-AIR (Framework libre AIR) simulator and NS-3. The authors proposed a software solution that exploits the characteristics of these software to obtain a new one, called CUSCUS (CommUnicationS-Control distribUted Simulator), able to manage both networked and distributed control systems.
Baidya et al. [23] proposed a flexible and scalable open source simulator called FlyNetSim. Their software is able to simulate swarm of UAVs and uses two open source tools, namely ArduPilot and NS3, creating individual data paths between the devices operating in the system using a publish and subscribe-based middleware. They illustrated the capabilities of the proposal through cases of different scenarios.
Kate et al. [24] dealt with particular type of UAVs called micro-aerial vehicle (MAV) that are an emerging class of mobile sensing system. Their simulator, called Simbeeotic, allows considering swarms of MAVs and permits to model their key features, such as sensing and communication. The authors demonstrated that their software provides the appropriate level of fidelity to evaluate prototype systems while maintaining the ability to test at scale.
Javaid et al. [25] introduced in their paper a simulation testbed, called UAVSim (Unmanned Aerial Vehicle Networks cyber security analysis). The software allows users to easily experiment by adjusting different parameters for the networks, hosts and attacks. Each UAV device works on well-defined mobility framework and radio propagation models, which resembles real-world scenarios. Based on the experiments performed in their software, the authors evaluates the impact of Jamming attacks against UAV networks and reported the results to demonstrate the needing and usefulness of the testbed.
Al-Mousa et al. [26] proposed a simulator called UTSim able to simulate different UAV key aspects such as physical specification, navigation, control, communication, sensing, and avoidance in environments with static and moving objects in urban air traffic. The simulator is easy to use and permits specifying a set of parameters: the properties of the environment, the number and types of unmanned aerial vehicles in the environment, and the algorithm to be used for path planning and collision avoidance. The simulator is able to produce log files with a lot of useful information to be used for evaluating its goodness.
2.3. UAV/Drone Coverage
In this subsection, the studies on the coverage issues are analyzed. The research on connectivity is very interesting. The problems around connectivity, especially concerning the possibility of providing a prompt help in those situations of emergency such as catastrophic or disasters events, are an object of study by the research community.
Al-Hourani et al. [27] gave an interesting study on a RF propagation model for low altitude platforms providing a valid statistical approach. They proposed a simple analysis based on parameters belonging to the urban scenario that can be applied in those situation where the terrestrial infrastructure are “out-of-order” because of natural disaster. Their statistical model is able to perform prediction of path loss between the altitude platform and the terminals in a typical urban scenarios.
Park et al. [28] provided the results about their study on the possibility of giving aerial Wi-Fi network thanks to the use of UAVs/drones called Net-Drone. In this network, each aerial device acts as an access point for the users and it is able to give connection based on their mobility, which is especially useful for disaster areas where terrestrial network infrastructure is no longer available. Their proposal takes into account also the handover mechanisms, necessary to perform an adequate wireless coverage.
In addition, Sae et al. [29] analyzed, using low altitude platform, the possibility of providing a temporary communication network, composed of a number of devices equipped on board with dual technology, able to provide Wi-Fi connectivity acting as access point and a mesh network for the inter-devices communications. The authors provided a set of simulation results to prove the goodness of their proposal.
Xie et al. [30] analyzed and studied the optimal deployment density of Drone Small Cells (DSCs) to achieve maximum coverage considering the inter-cell interference. They split the channel propagation conditions as depending on two different signals, namely a probabilistic Line-of-Sight (LoS) and a probabilistic Non-Line-of-Sight (NLoS) links, which increases the computational difficulties in performance analysis. Their mathematical approach takes into account both LoS and NLoS links in order to consider the inter-cell interference issues affecting the communications.
2.4. Main Paper Contribution
This paper is the extension of the conference paper [11] where a new Java simulator has been proposed, able to simulate the dynamics of human movements and drones coverage. The main contribution of this paper is the introduction in the simulator of a new model for simulating drones coordination and behavior in order to re-accomplish the specific task and manage the charging operations. Thus, the developed simulator considers four important models implemented in the FANET network:
- There is the model of a footprint, which links the coverage area, and then the radius and height of these new devices.
- The model of human behavior simulates real movements of users in the considered area.
- The model of drones behavior in the sky considers their limited autonomy, and then the necessity of recharging their batteries for continuing in the specific task.
- The model of energy consumption considers how the energy of a drone decreases during its flight.
In this work no collision issues are taken into account and thus no collision behavior is modeled. We considered energy consumption for the drone flight to model its limited autonomy and show the need to perform charging operations for guaranteeing service continuity.
The simulator is also able to collect some interesting statistics about the simulated entities, giving the possibility to analyze the critical aspects that could occur in real situations, in terms of bad service coverage or emergency situations.
Table 2 compares the drone simulators described in the related work Section 2.2 showing the implemented models for each simulator with respect to the models implemented in our simulator software.
3. FANETSim: FANET Simulation System
The developed simulator is Java software able to consider a set of UAVs/drones that fly in the sky for providing connectivity to the users inside the considered map, as shown in Figure 1. They have to be able to communicate with each other in order to exchange protocol messages and they have to guarantee connectivity to the users that require resources for a specific application. The simulator is equipped with a GUI that gives the possibility of setting the opportune values of the considered input parameters and, moreover, it permits extracting from Google Maps the real map to be considered for the simulations. In this map, it is possible to analyze the human behavior on the basis of the considered human mobility model that gives some indications on how people move during the day. For the simulation, two different types of applications were considered: video and audio streaming. The main actors of the simulator are represented by the two main nodes: UAVs/drones and Users. In the following, the models considered for the aerial devices and for the people are shown.
As illustrated below, the FANET network topology is modeled by a grid graph structure, in which each node represents a drone and the links represent the connections between them (nodes regarding users are neglected in the forwarding network topology). The obtained adjacency matrix related to the graph is typically sparse, but it is highly dynamic given the mandatory drones mobility (from/to charging stations). The protocol messages exchanged by nodes (UAVs/drones and Users) allow the set up of the FANET network. Clearly, these nodes have to be inside a coverage that allows the communication between each devices. As mentioned above, the topology is modeled as a graph where an edge is represented by the couple of linked nodes. Each node (each vertex of the graph) has a list of neighbors that it stores in its own database.
3.1. Link State Protocol
The protocol used for the set up of the FANET network is a standard link state protocol that uses the typical messages preview by the standard. The link state protocol allows constructing the path between a couple of nodes defined source and destination. The protocol guarantees the possibility of topology adaptions, in case of topological changes when a new link is set up in the network or a link goes down. The simulator considers a real time delay in the communication, taking into account the propagation delay, the transmission delay, and the elaboration (processing) delay.
In the following, the messages sent for the creation of the FANET:
- HELLO: It is used for discovering the neighbor drones.
- ACK: It is used in reply to the HELLO message.
- BYE: It is used to disconnect a drone from the network.
- LSA (Link State Advertisement): It carries the Link State Table and it is sent in flooding to all the neighbors.
- LSU (Link State Update): It is used to update other routers with the information contained in the local router’s database.
- LU (Link Update): It is created to reduce traffic. Each drone sends it itself to account for its link update. The LU are grouped in a single LSU message and managed every 30 s. At every prefixed time, the drone generates a LSA packet with the updated information about its links.
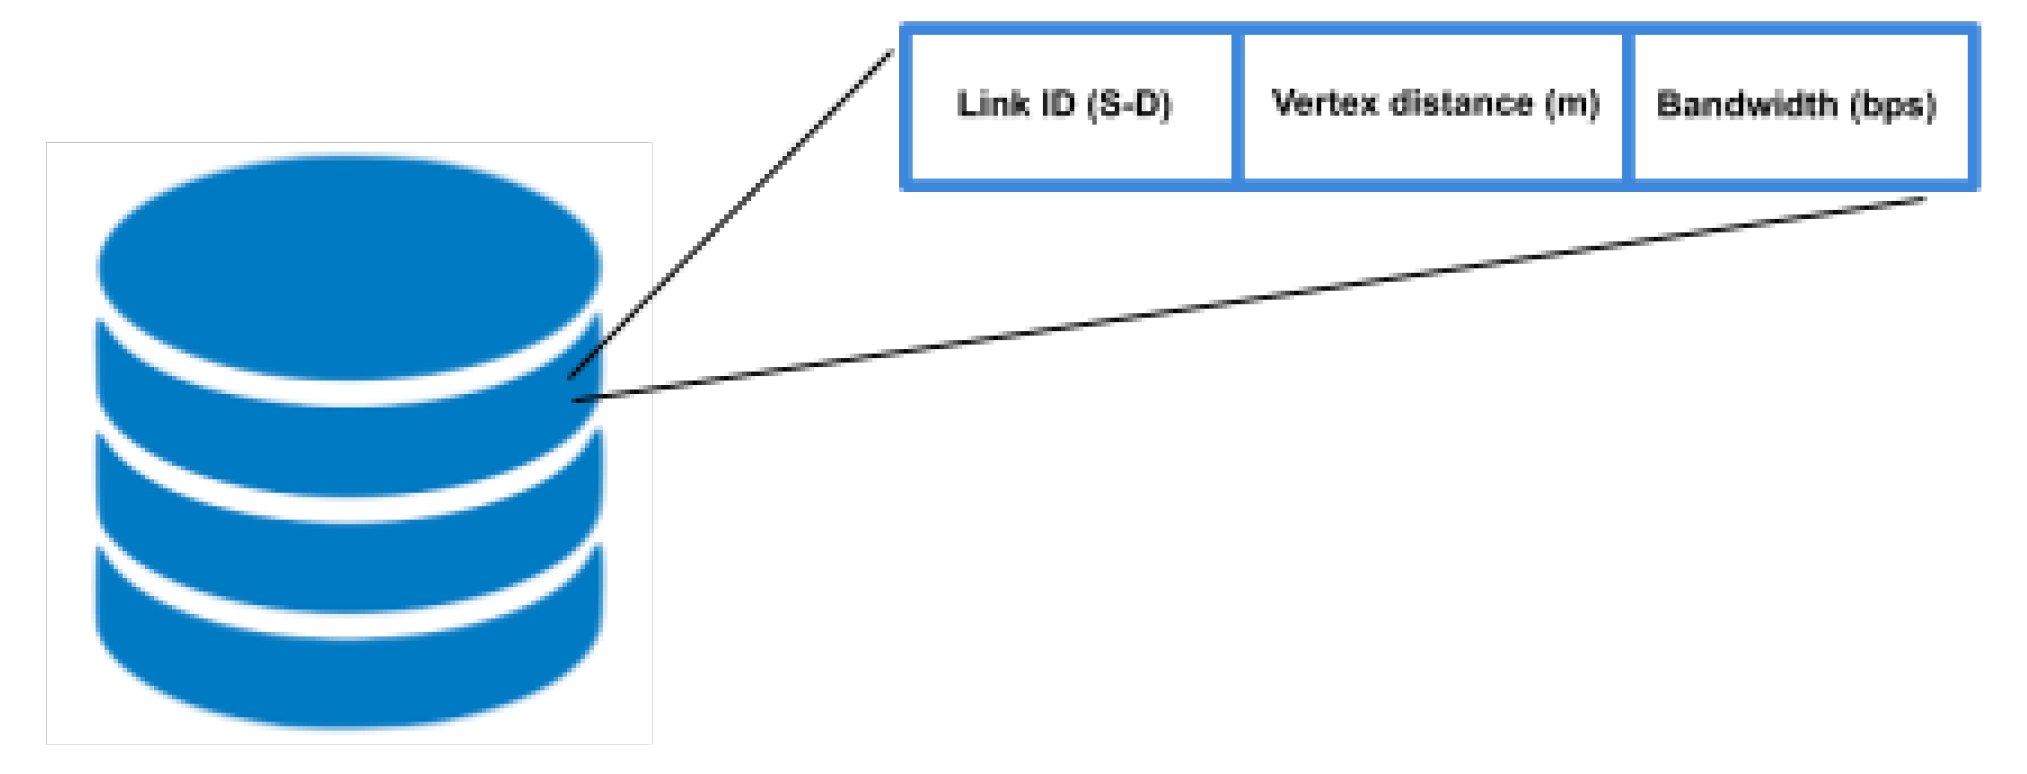
The UAVs/drones can send the packets of the link state protocols containing the following main information: a number ID that identifies the node; a sequence number increased in each new packet; and the Time To Live (TTL) of the packet. Moreover, the device uses a database for storing update information for each received LSA packet (see Figure 2).
3.2. Human Mobility Model
The simulator introduces a human mobility model that helps to describe people behavior during the day giving indication on the main habits of the considered classes of users. This model is derived from a study conduced by the University of Milan [31]. They analyzed a smartphone call information dataset with over 69 million phone calls and 20 million text messages extracted in the city of Milan conduced for 67 continuous days. Moreover, in their work, the authors also studied the dataset of WiFi and GPS information based on the behavior of 178 people during four years (between 2007 and 2011). Thanks to this large volume of data, they extrapolated a human mobility model that considers three different categories of Points of Interest (PoIs) that represent the places visited by people during the day:
- Mostly Visited PoI (MVP): locations most frequently visited by users (in this case are the homes and the workplaces);
- Occasionally Visited PoI (OVP): locations of interest for the user, but visited just occasionally (in most cases, they correspond to favorite places or meeting points visited during the week); and
- Exceptionally Visited PoI (EVP): locations that users rarely visit.
The behavior of users in the area has been considered and a classification of this people behavior has been introduced into the software simulator, considering the possible movement of the users in an urban scenario. Three different typologies of mobile users have been proposed:
- Employee: People who spend most of their time of a day at work. In addition, students can fit into this category.
- Housewife: People who spend most of their time, especially in the morning, at home.
- Retired Person: People who are free to move in the area without any constraints.
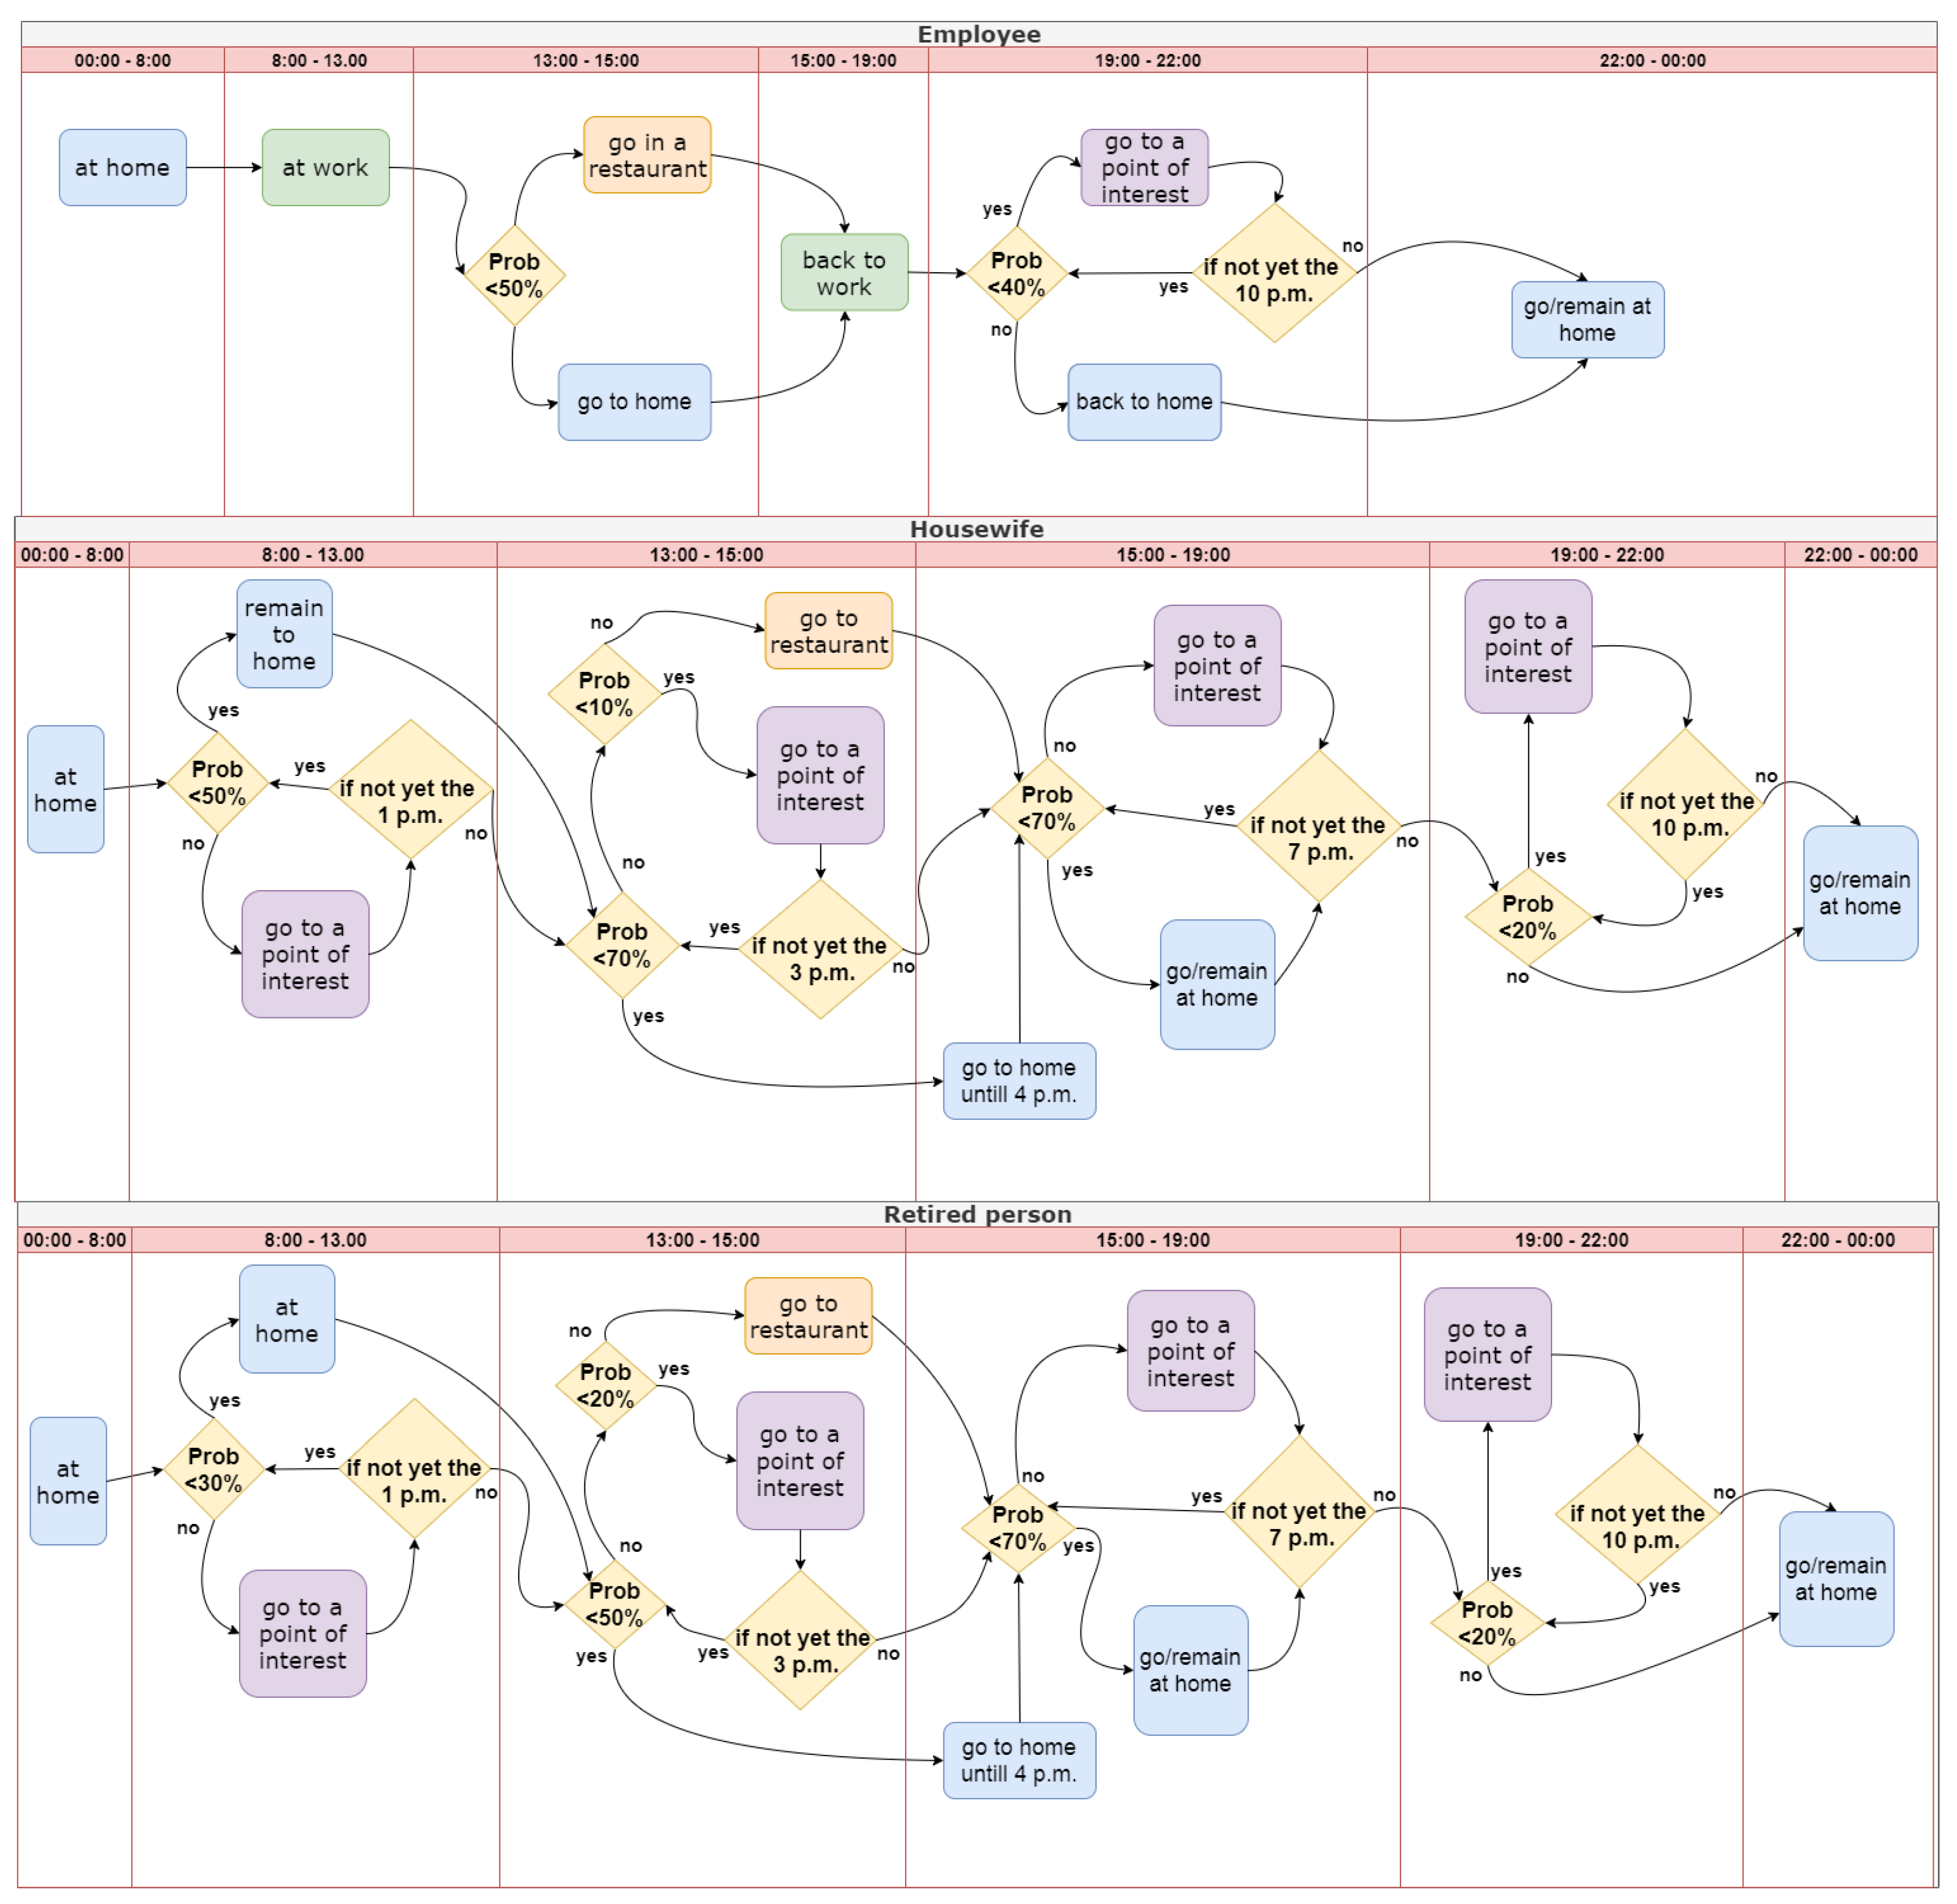
It is clear that each kind of users will spend its time during the day differently from other users categories, moving on the map with a different mobility model, as shown in Figure 3.
The mobile user movements are influenced by their needs and social links. A user moves towards a series of places but he come back to home or to work that represent the most visited places. The probabilities associated with the most relevant places visited by users are computed on the basis of the visiting frequency. Equation (1) shows the probability that each mobile user m chooses of visiting the next Point of Interest, , during a generic day, given that he has just visited the one:
where represents the number of times a mobile user has left to go to , and is the total number of times a mobile user left .
As regards the PoIs management with the mobility trace-files extracted from the considered map (Milan in our case), each mobile user chooses the next PoI to be visited probabilistically, on the basis of Equation (1). Our simulator gives the possibility to deploy a parametric number of PoIs as a square grid. Thus, without loss of generality, suppose we have a square geographical map with size and a PoI grid equally spaced of where each point represents the coordinates of a point of interest. The horizontal and vertical distance among PoIs will be . Thus, if has the coordinates , then its “pertinency” will occupy the area , where . To obtain the expression of Equation (1) a preliminary simulation round is necessary; the PoI is considered visited (and, hence, is increased by 1 considering the starting ) if users arrive inside during the trips provided into the trace-files and remain inside the for a certain temporal threshold indicated with parameter at least equal to 300 s [32]. In this way, Equation (1) can be defined for each defined PoI inside the map.
3.3. Footprint Coverage Model
In the considered urban scenario, a typical air to ground channel model has been considered composed mainly of two signals: Line of Sight (LoS) and a Non-Line of Sight (NLoS) [27]. These two typologies of signal can be considered separately and, then, they are studied considering different occurrence probabilities, which are functions of environment, density and height of buildings, and elevation angle. In this context, the impact of small scale fading has been neglected considering that fading probability is much smaller that the probability of receiving LoS and NLoS components [33]. In these conditions, for NLoS connections affected by shadowing and signals obstacles reflection, Path Loss () is higher than LoS. For this reason, additional path loss values are assigned to LoS and NLoS links in the free space propagation loss model. In Table 3, the mathematical formulation symbols used in this subsection are shown.
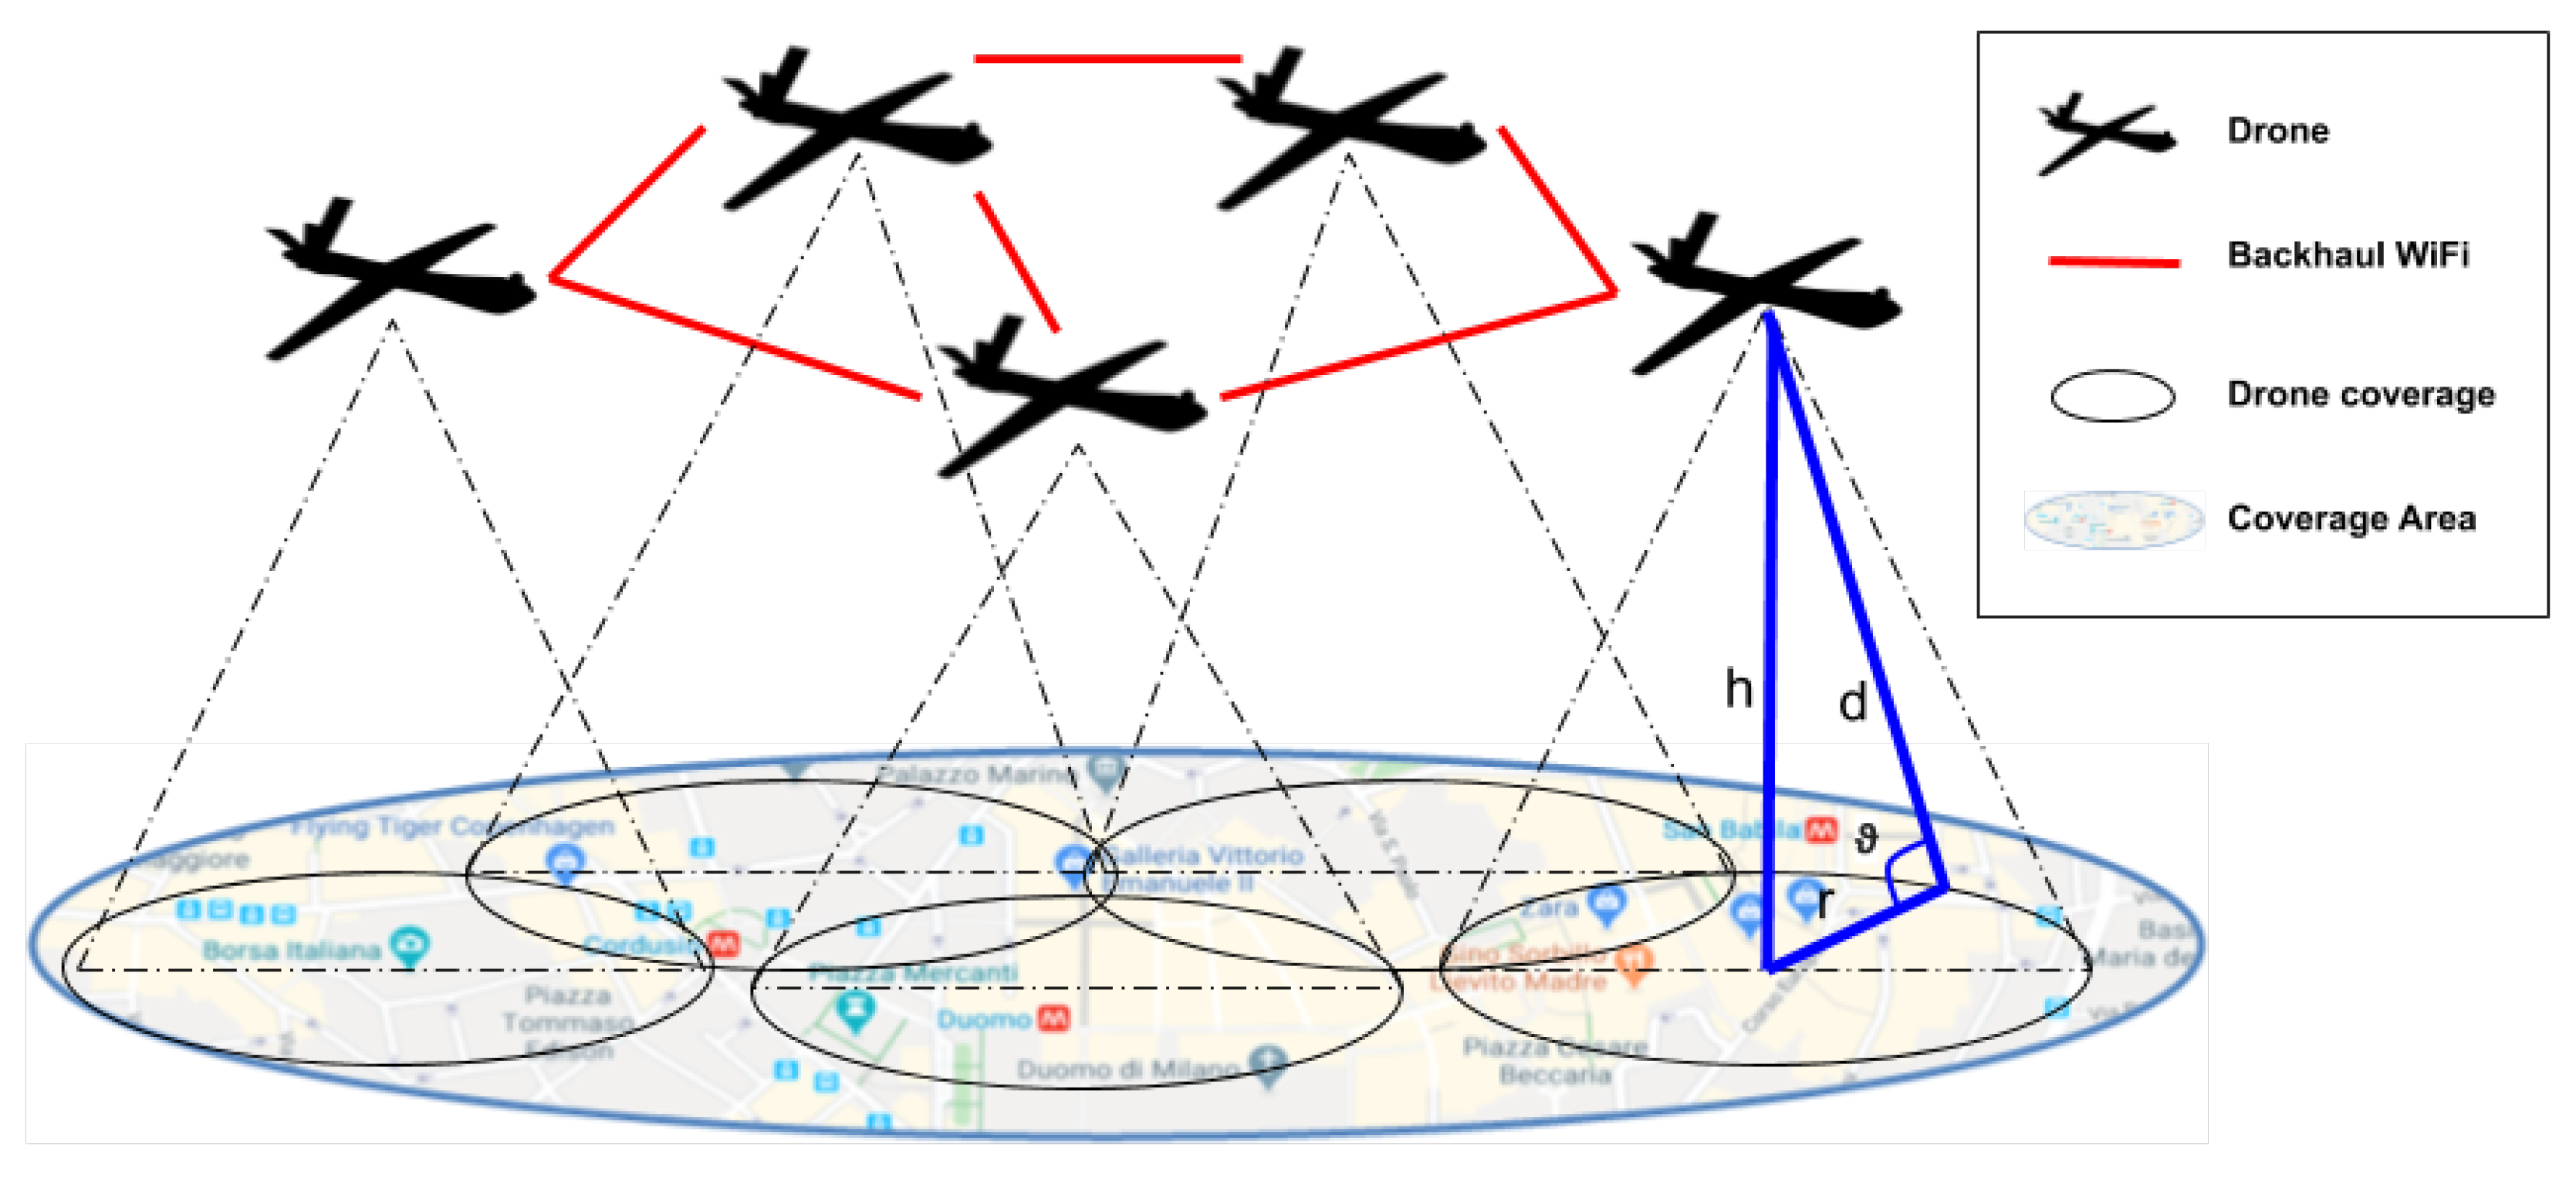
A typical coverage area of a drone is characterized by h (height of the drone), r (coverage radius), (distance between user on the coverage edge and drone in the sky), and (angle (in radiant) between r and d), as shown in Figure 1.
From the above, a formula for the Path Loss () for LoS/NLoS conditions as in [27] is given:
where is the average () for LoS/NLoS links, is the average additional loss to the free space propagation loss which depends on the environment, c represents the speed of light, and is the carrier frequency. The probability of having LoS connections at an elevation angle of is given by [30]:
where and are constant values which depend on the environment (rural, urban, dense urban, etc.).
The NLoS probability is . Equation (3) indicates that the LoS probability in the connection between drone and user is a function of . In particular, it expresses that by increasing the elevation angle , the shadowing effect decreases and clear LoS path exists with high probability. Finally, the average is given. It shows its dependence from altitude (h) and coverage radius (r):
On the basis of the previous drone channel model it is possible to provide a formula that links the optimal altitude h to the maximum ground coverage area of radius r. Considering the drone transmission power (), it is possible to compute the received power () as:
Having , an user inside the coverage area of a drone at an height of h can receive the signal if its Signal to Noise Ratio (SNR) is greater than a set threshold ():
where N is the noise power. From Equation (5), it is possible to state that, to find the maximum achievable coverage radius, it should be: . Setting transmission power, the optimal drone height for having maximum coverage is given by [33]:
where and . By solving Equation (6), and are found. The following parameter values have been considered: = 2 GHz; = 1 dB; = 20 dB; = 9.6; = 0.28; and = 10 dB.
3.4. Drone Characteristics and Energy Model
In the simulator, a typology of a drone with a flight mechanism called “fixed-wing”, which is in the category of very small drones (with a weight between 100 g and 2 kg), has been considered. In particular, the model selected for this typology of drones is the “Parrot Disco”, which has the following specific characteristics: a weight of about 750 g, a range of about 2 km for remote control, a flight time of about 45 min, and a speed of about 80 km/h. Moreover, it is equipped with a three-cell LiPo battery of about 2700 mAh/25 A. The typical applications for this typology of drones are recreation and connectivity [34].
The total energy consumption of the UAV includes two components. The first one is the communication-related energy, which is due to the radiation, signal processing, as well as other circuitry. The other component is the propulsion energy, which is required for ensuring that the UAV could remain in the sky for supporting its mobility, if needed. The energy of an aircraft is characterized by two parameters, which are specific energy distribution rate, driven by elevator, and total specific energy rate, driven by throttle [35]. Note that, in practice, the communication-related energy is usually much smaller than the UAV’s propulsion energy consumption; thus, as shown in several studies, it is ignored. For the flight level with fixed altitude, the UAV’s energy consumption can be considered only depending on the speed and acceleration . For steady straight-and-level flight (SLF) with constant speed V, we have and . Thus, we have:
Equation (7) is the consumed energy of the flight device for a finite time horizon T, where and are two parameters that take into account: weight, wing area, air density, etc. For simplicity, in this work, the payload is considered into the overall weight of the aircraft and the UAV energy storage weight reduction over time (for consumed fuel or battery) is ignored. The energy consumption presented in Equation (7) is a function of V, and it consists of two terms: one is proportional to the cubed speed V; it is known as the parasitic power for overcoming the parasitic drag due to the aircraft’s skin friction, form drag, etc. The other term, as shown in Equation (7), is inversely proportional to V; it is known as the induced power for overcoming the lift-induced drag, i.e., the resulting drag force due to wings redirecting air to generate the lift for compensating the aircraft’s weight. Moreover, the formula shows the dependence of time T as the time.
3.5. UAV/Drone Behavior Model
In this section, the behavior of flying UAVs is described, as implemented in the proposed Java simulator. We based our implementation on a simplified version of the idea in [15], considering the energy-aware approach for generating optimal trajectories, neglecting wind conditions and considering a dynamic coverage range, in order to adapt the data transmission to clients needs, in terms of the number of service requests. In this paper, no collision avoidance issues are taken into account. We have considered that drones cannot be in the same airspace and no collision model has been implemented. These aspects will be considered in our future works. In Table 4, the symbols for the mathematical formulation used in this subsection are shown.
The authors of [15] based their path planning algorithm on the A* search algorithm and Dubins paths [16], with a computational complexity lower than the one of Dijkstra’s algorithm, thanks to the use of a heuristic function and a smaller search space. It must be underlined that physical trajectories are computed off-line by internal controllers, while routing data distribution is based on the link state protocol, as described above. Internal trajectory algorithms are also responsible for compensating external disturbances of regular and stable movements and follow the indications evaluated by the path planning algorithm. Drones join the data network by exchanging the packets with their neighbors. Coverage range is dynamically adapted to cover bigger/smaller regions on the basis of the requested bandwidth and the number of users (this is the main relation with the human mobility model and PoIs). The coverage range is never lower than (the distance from the drone and the terrestrial surface, in order to guarantee the air–terrestrial connectivity). Figure 4 represents a typical coverage scenario with only four drones.
As illustrated in Figure 4, the flight area is modeled according to an undirected grid graph [17] , where is the set of nodes (drones) associated to the n tiles and is the set of edges. The number of drones n is equal to the number of tiles, while the number of edges k is variable and depending on the reciprocal coverage relationships. In fact, each drone is located at the center of each tile and its coverage range is directly proportional to the number of service requests of its tile. Differently from Mardani et al. [15], nodes corresponding to adjacent tiles are not surely connected by an edge: radiuses are adjusted on the basis of the bandwidth needs of the covered tile.
Each is associated to a geographical position and to a number of service requests , while an edge is associated to the radio connection between nodes and . We do not consider obstacles in the flight area. Drones can fly from a tile to another one at constant speed , while consuming a power . The initial energy available in each drone is , while the energy consumption for traveling on is . After the battery charging completion (in the simulator, different numbers of charging stations have been considered and they are placed on the map accordingly description in Section 4), each drone starts its trip from the first tile near the charging station (starting waypoint) and it needs to arrive to the center of its associated tile (destination waypoint), by following a set of consecutive flying segments from to , forming a loopless path . If is the set of all the possible loopless paths, the implemented drone mobility scheme, finds the optimal path for minimizing energy consumption and respecting the following relationship:
with residual energy of the drone (at the beginning ), while the energy consumption is , with equal to the traveling time on . For simplicity, we did not considered the smoothing feature of Mardani et al. [15], thus drones move along the edges of the graph in a squared way.
The algorithm implemented in Java for the proposed simulator is composed of three main parts:
- Initialization: At the beginning, charging stations are placed as explained above and it is assumed that drones are fully charged, and then sent to the center of their own tile. When the drone arrives, the Point of No Return (PNR) energy is evaluated for each drone, in order to know the amount of energy needed for having the possibility to go back to the charging station. Each drone then adjusts its coverage radius on the basis of the number of the number of service requests and starts the flooding of HELLO messages and the LSP. Once the grid graph (GG) is created, its adjacency matrix can be set as M.
- Loop: Each drone has to continuously check its own residual energy level. When the energy drops down the threshold, the drone in tile needs to return to its charging station , thus the function PLAN is called to evaluate the best “go-back” path with the lowest energy consumption. If the drone is in and its energy level has reached the maximum , then the optimal path needs to be planned again, through the PLAN function.
- PLAN: This function receives as inputs , source and destination nodes, and it returns the evaluated path in the variable p. Its structure is very similar to the typical minimum search algorithm, but the extract-min-energy function takes into account the relationship of Equation (8). In fact, the energy needed by a drone to traverse an edge is given by and it is taken into account by this function as the metric for each edge of the graph.
4. UAV/Drone Simulation Environment
The geographical grid model has been based on the center of Milan, with its center GPS coordinates equal to 45.468197, 9.193153. The map was extracted from Google Maps platform considering real coordinates. Several PoIs (shops, restaurants, hotels, and churches) have been taken into account, as well as people’s homes (a grid of PoIs was chosen to cover most of the map).
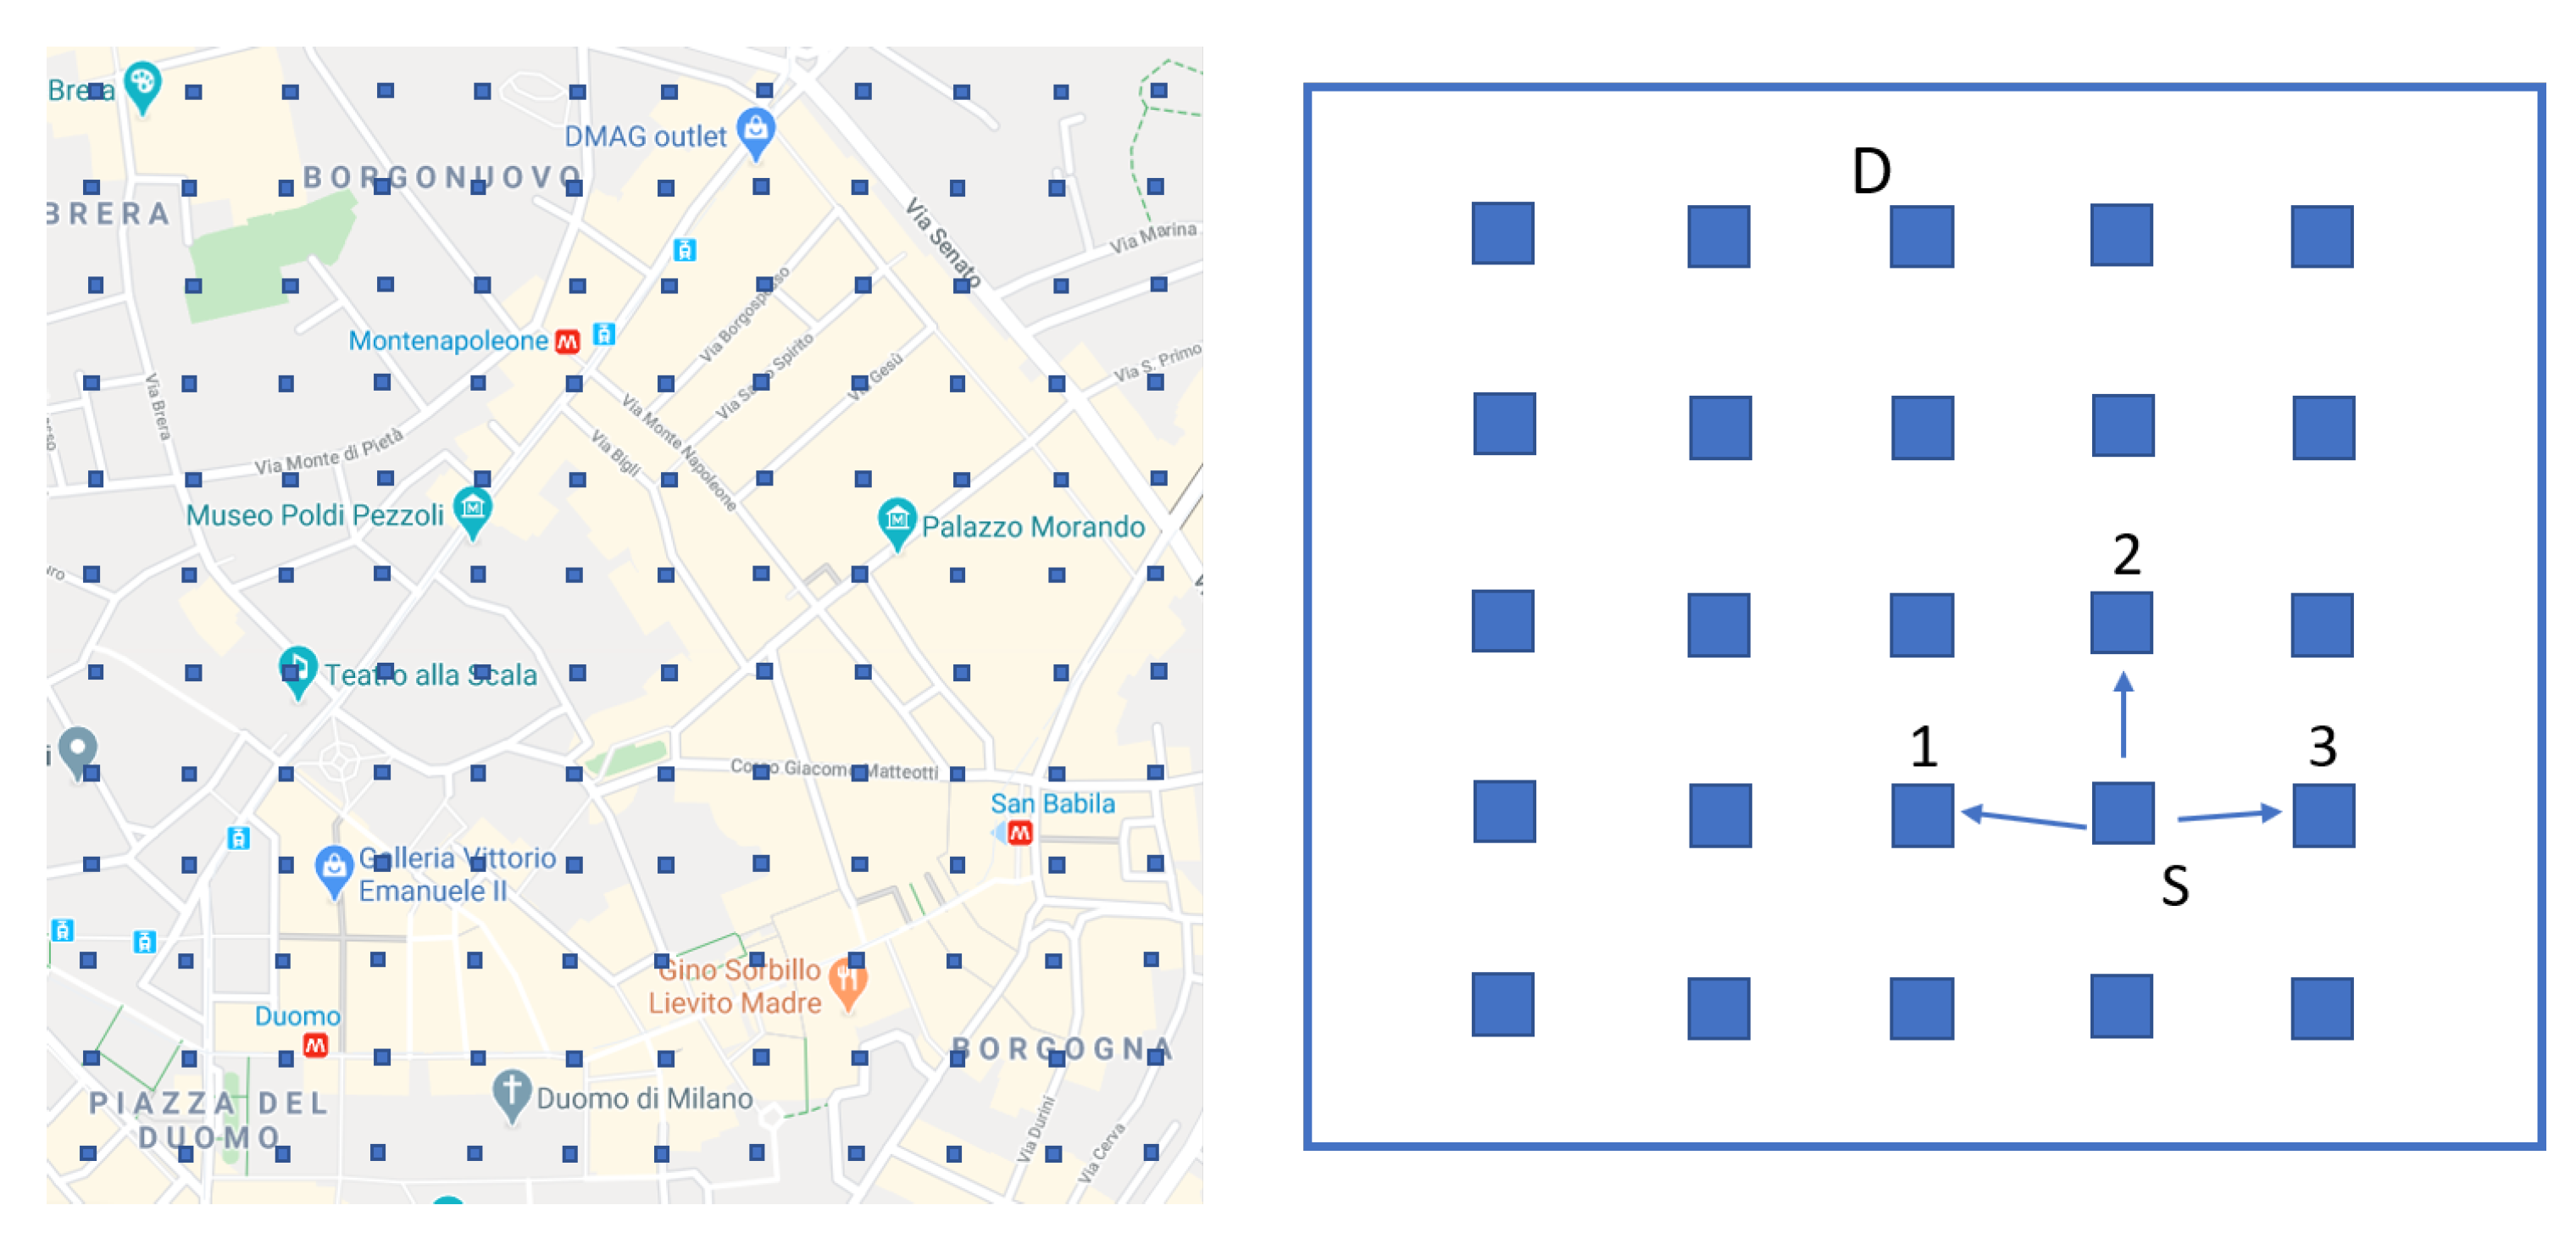
Pedestrian mobility was then generated as follows: each mobile user will start its activity at midnight of a generic working day, then it will stay at home until 8:00 am. After this time, all users will move during the day according to their own behavior, as shown in Figure 3. There are three types of moving users (employees, housewives and retired persons), by defining their percentage referring to the total number of moving nodes. To obtain deterministic human movements, a random seed is extracted and it is used to choose the next location probabilistically. Then, each mobile human node will reach it by following a real path (the best one existing into the extracted geographical map). The best path is obtained by searching, each time, for a next PoI of crossing. A grid on the map with a radius of about 80 m between two points has been considered.
Figure 5 explains better this motivation by an example: a user that goes from point S towards point D can choose one of Points 1–3. Among these, he chooses Point 2 because it satisfies the conditions of the algorithm: it is the point reachable from S closer to D.
Each human node reaches its destination by moving at a speed of 3 km/h. If, after a moving step, it still does not reach the destination, then the next PoI is recursively re-evaluated, and another moving step is generated. On the contrary, if the destination has been reached, then two other events related to the pause of people’s mobility are initiated: a person who is not working (or is not at home) can stay in a particular PoI for a time belonging to the interval [10, 60] minutes. All activities end at 10:00 pm, and after this time, no more activities are provided (all the humans will return at home).
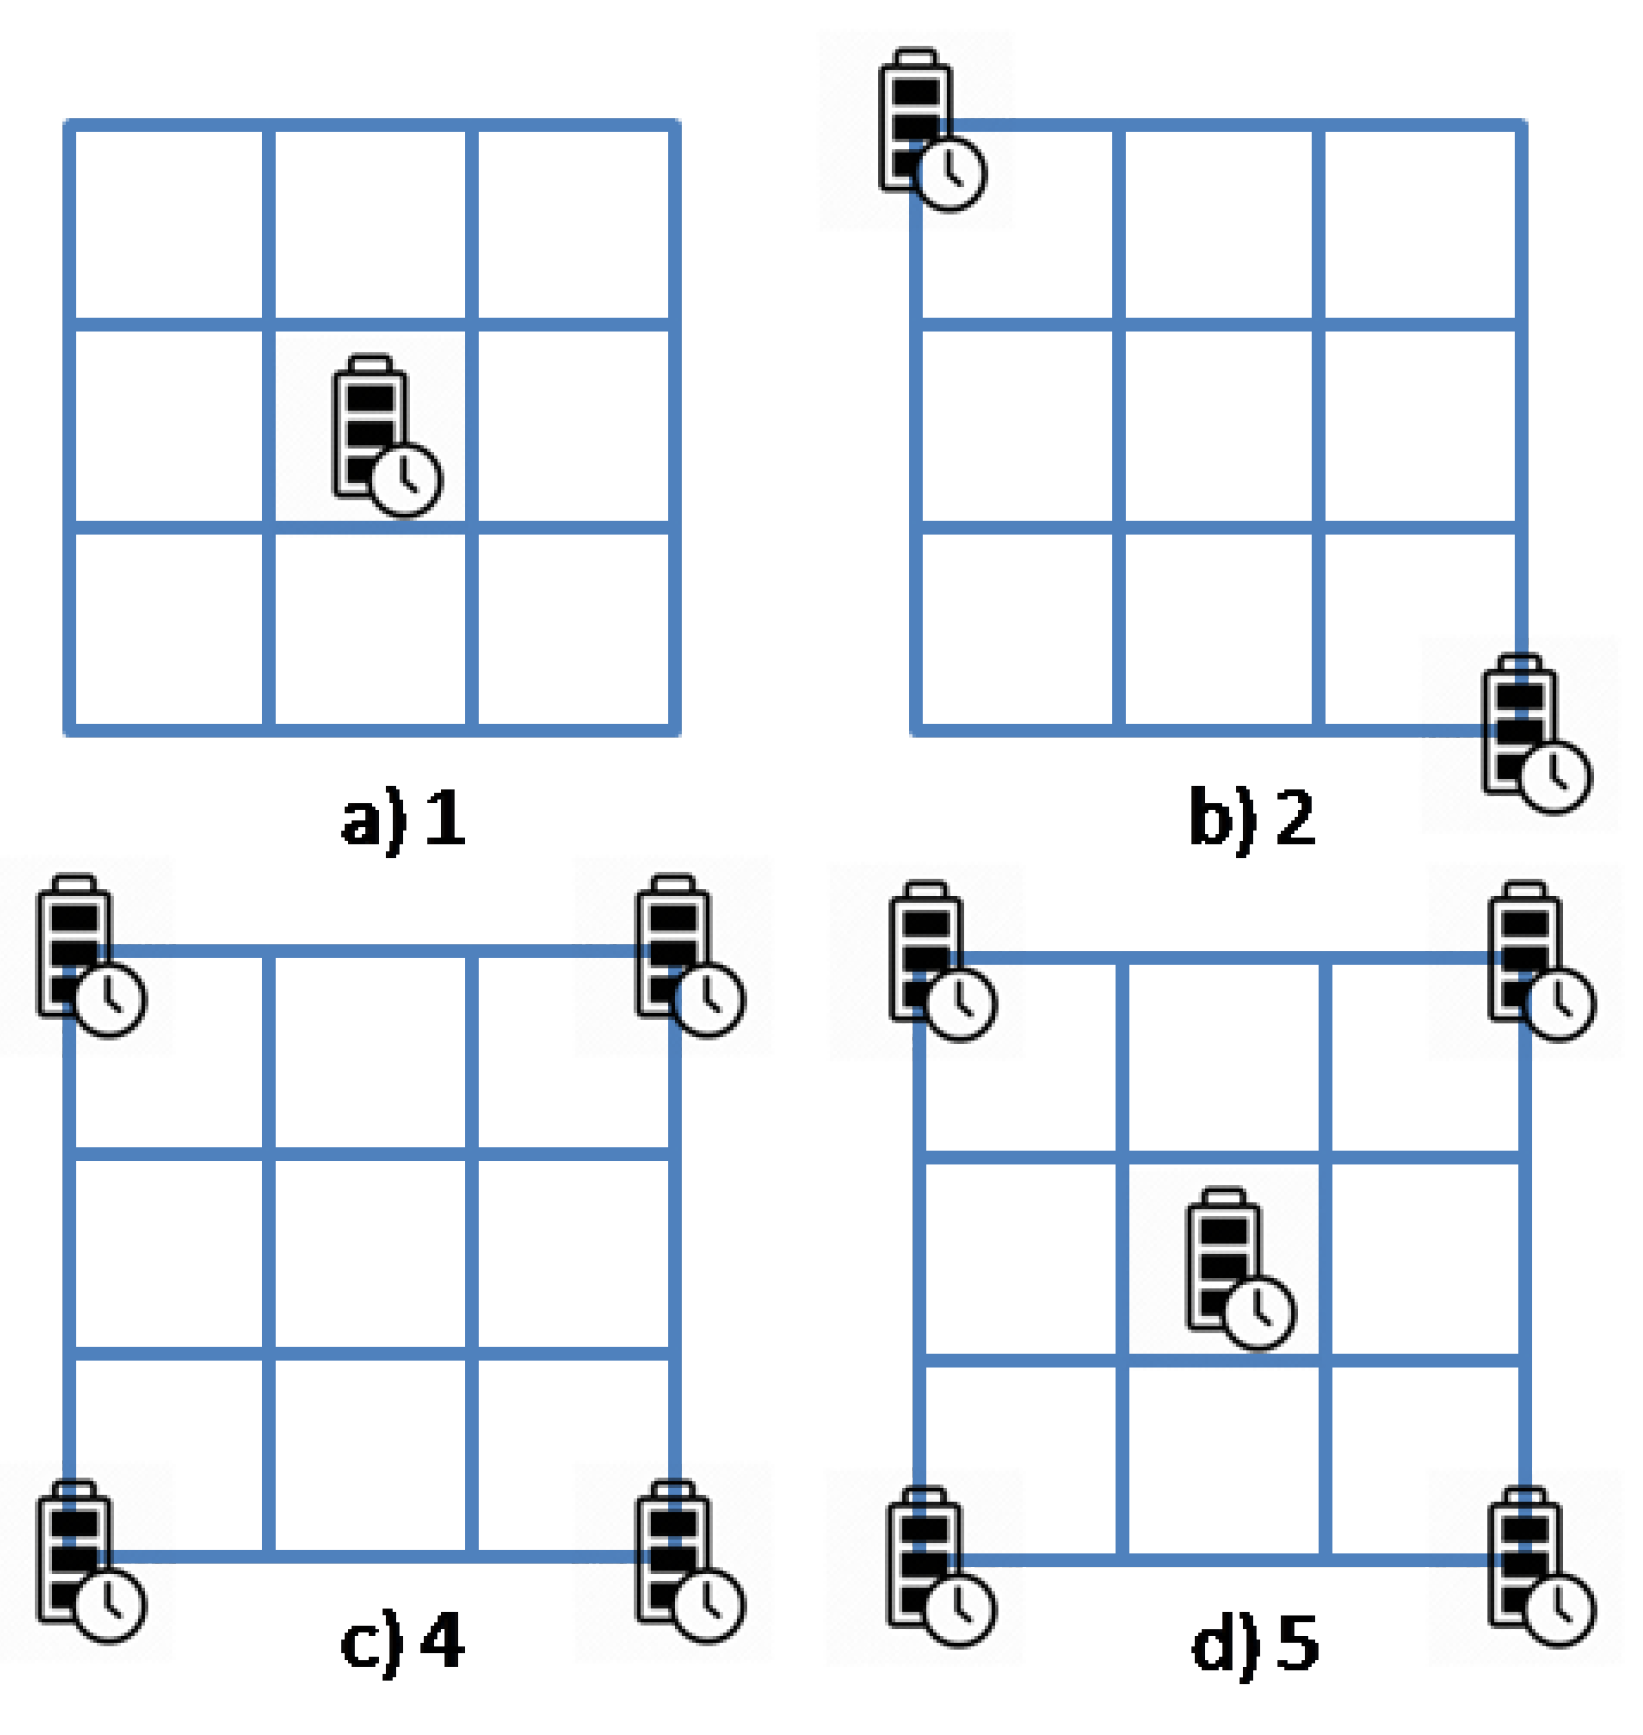
As regards flying devices, in the software simulator we considered the charging stations placement as illustrated in Figure 6: four stations are placed at the four corners of the simulated map.
When a flying drone needs to go to the assigned charging station to charge its battery, because it has reached the lower bound of residual energy, a backup drone is contacted before through a recruiting message (we assume that each flying drone knows exactly the address of its backup drone). Thus, the coverage hole is filled with the presence of the designated backup drone. We based our approach on the one specified in [20]. In our simulator, we have considered an approach based on drones recruiting. That is, to cope with the problem of the coverage hole left by a drone that needs to recharge its battery, we have considered, as some works in the literature suggest [36], the use of backup drones that lie near the charging station. This mechanism permits of replacing the drone that has to recharge its battery with a spare drone that is in an idle status, waiting for a recruiting message by a drone in the sky. The used policy for the recruitment is based on [20].
The implemented simulator is able to simulate flying devices able to guarantee connectivity among peopel who can communicate using multimedia applications. In particular, two types of traffic have been considered: video and audio streaming.
The number of involved users is 50, 75, 100, 125, and 150. Each user is able to make a call each time it is in a PoI. Regarding the proposed human behavior model, 70% has been chosen for employees. Table 5 shows some of the considered parameters used in the simulative campaigns. For all simulations, a network topology consisting of drones, with a distance of 252 m from each other, and disposed in a grid , has been used (this grid map permits of covering most of the considered area).
For all the simulations, a network topology consisting of nine drones, with a distance of 252 m each other and disposed in rows of three, has been considered (in this way the most of the area of interest is covered).
5. Performance Evaluation
Different simulation campaigns were performed, changing the number of users able to move in the considered geographical map. The following output parameters were collected by simulations:
- audio and video streams data delay;
- sent, received and lost packets;
- accepted and refused requests; and
- occupied bandwidth percentage.
These output parameters allowed evaluating the goodness of the proposed software simulator varying some input parameters.
5.1. UAVs/drones Simulation Tests without Energy Issues
In this subsection, we assume that each drone has unlimited energy availability, thus neither charging operations nor energy aware path planning are needed. Each flying device stays at the center of its grid element giving the needed coverage, in terms of bandwidth, while communicating with its neighbors via link state protocol. In this scenario, each UAVs/drones has no energy awareness and, then, only the network aspects are discussed with the considered graphics.
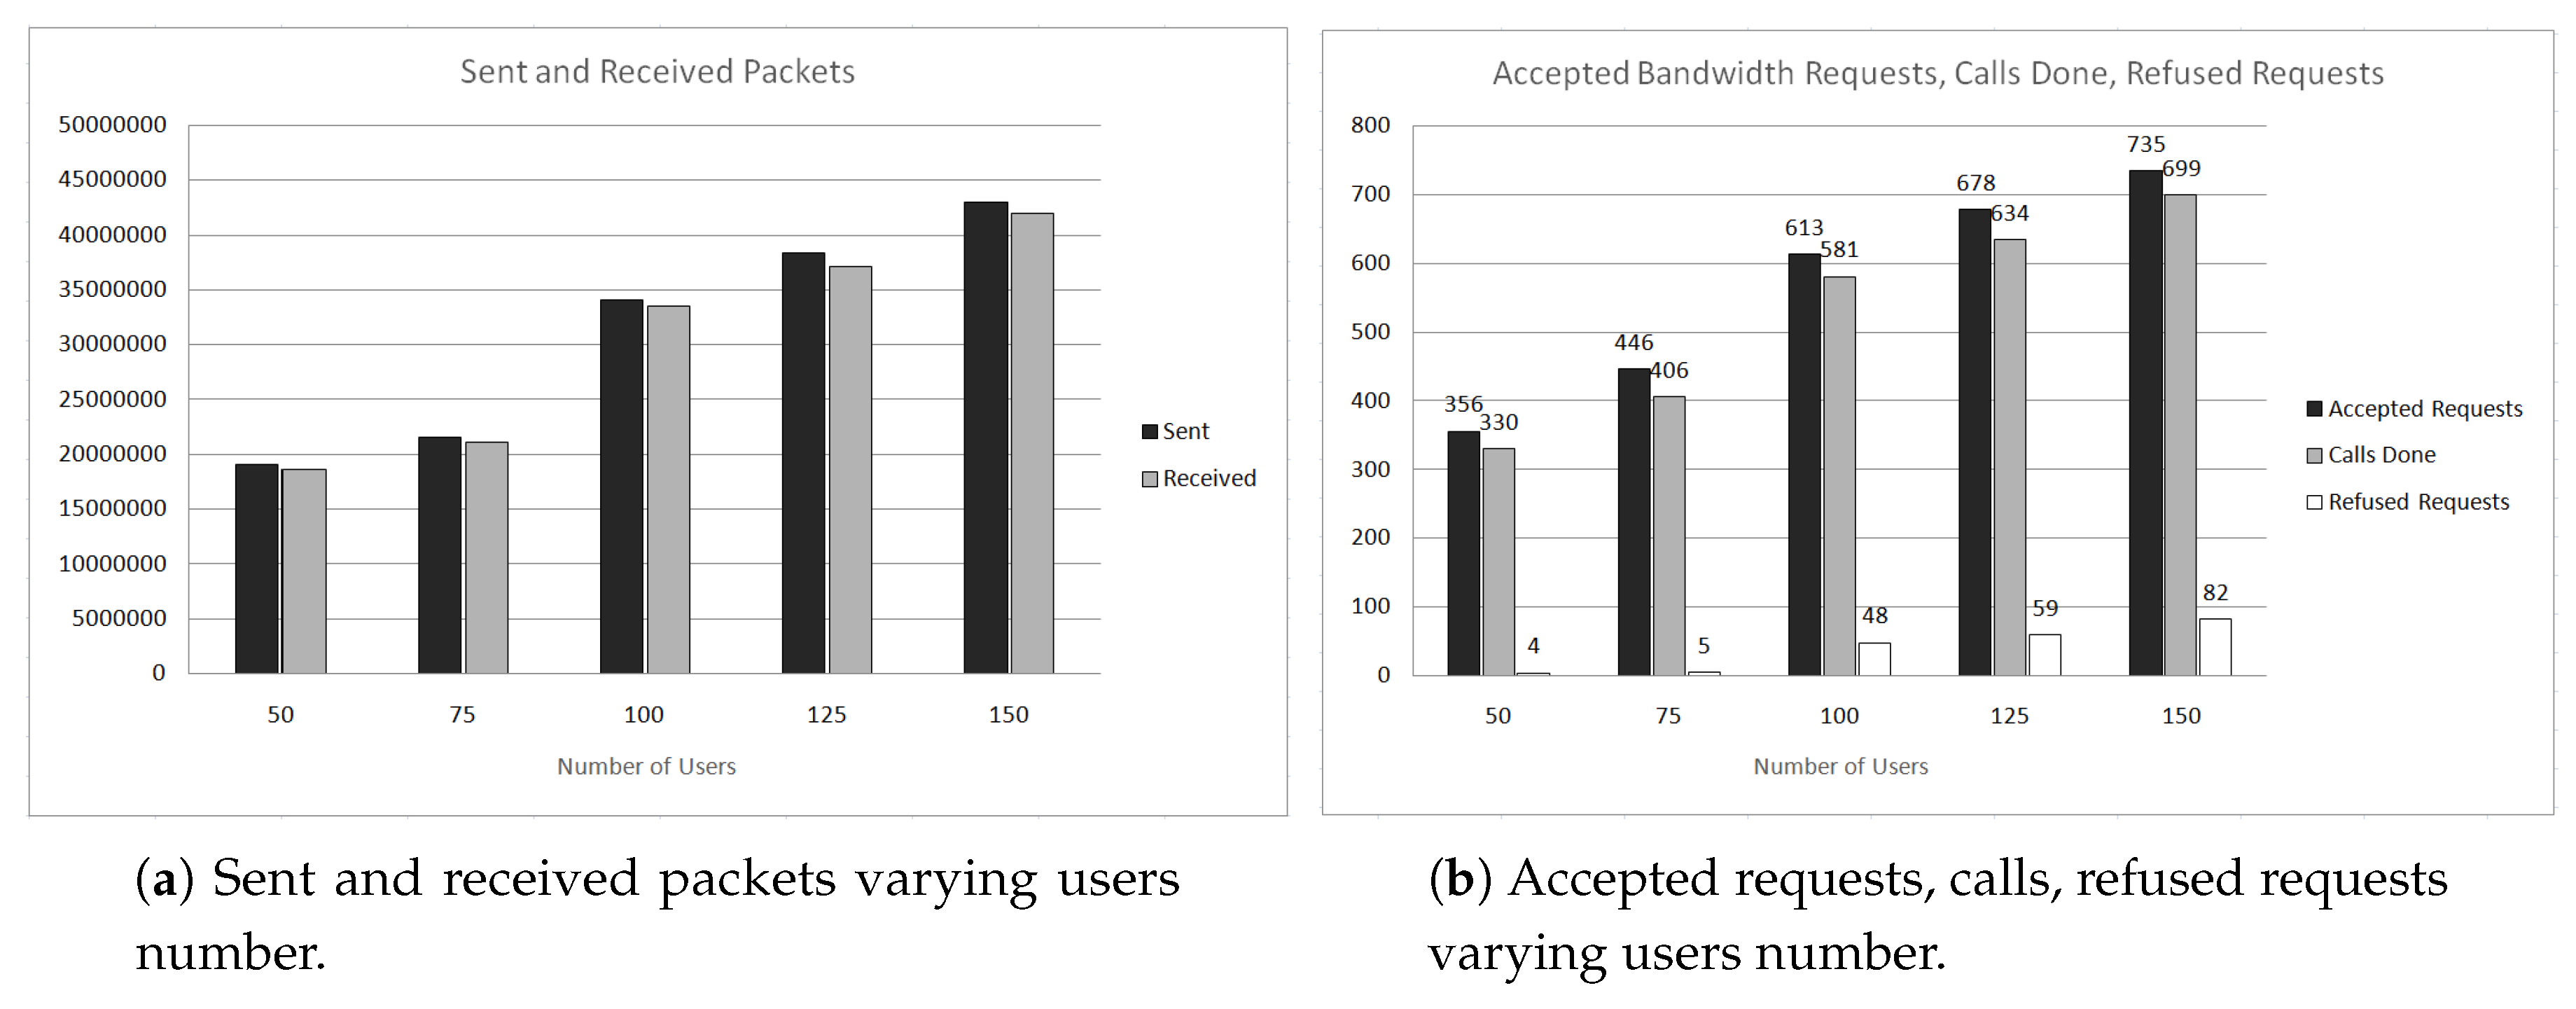
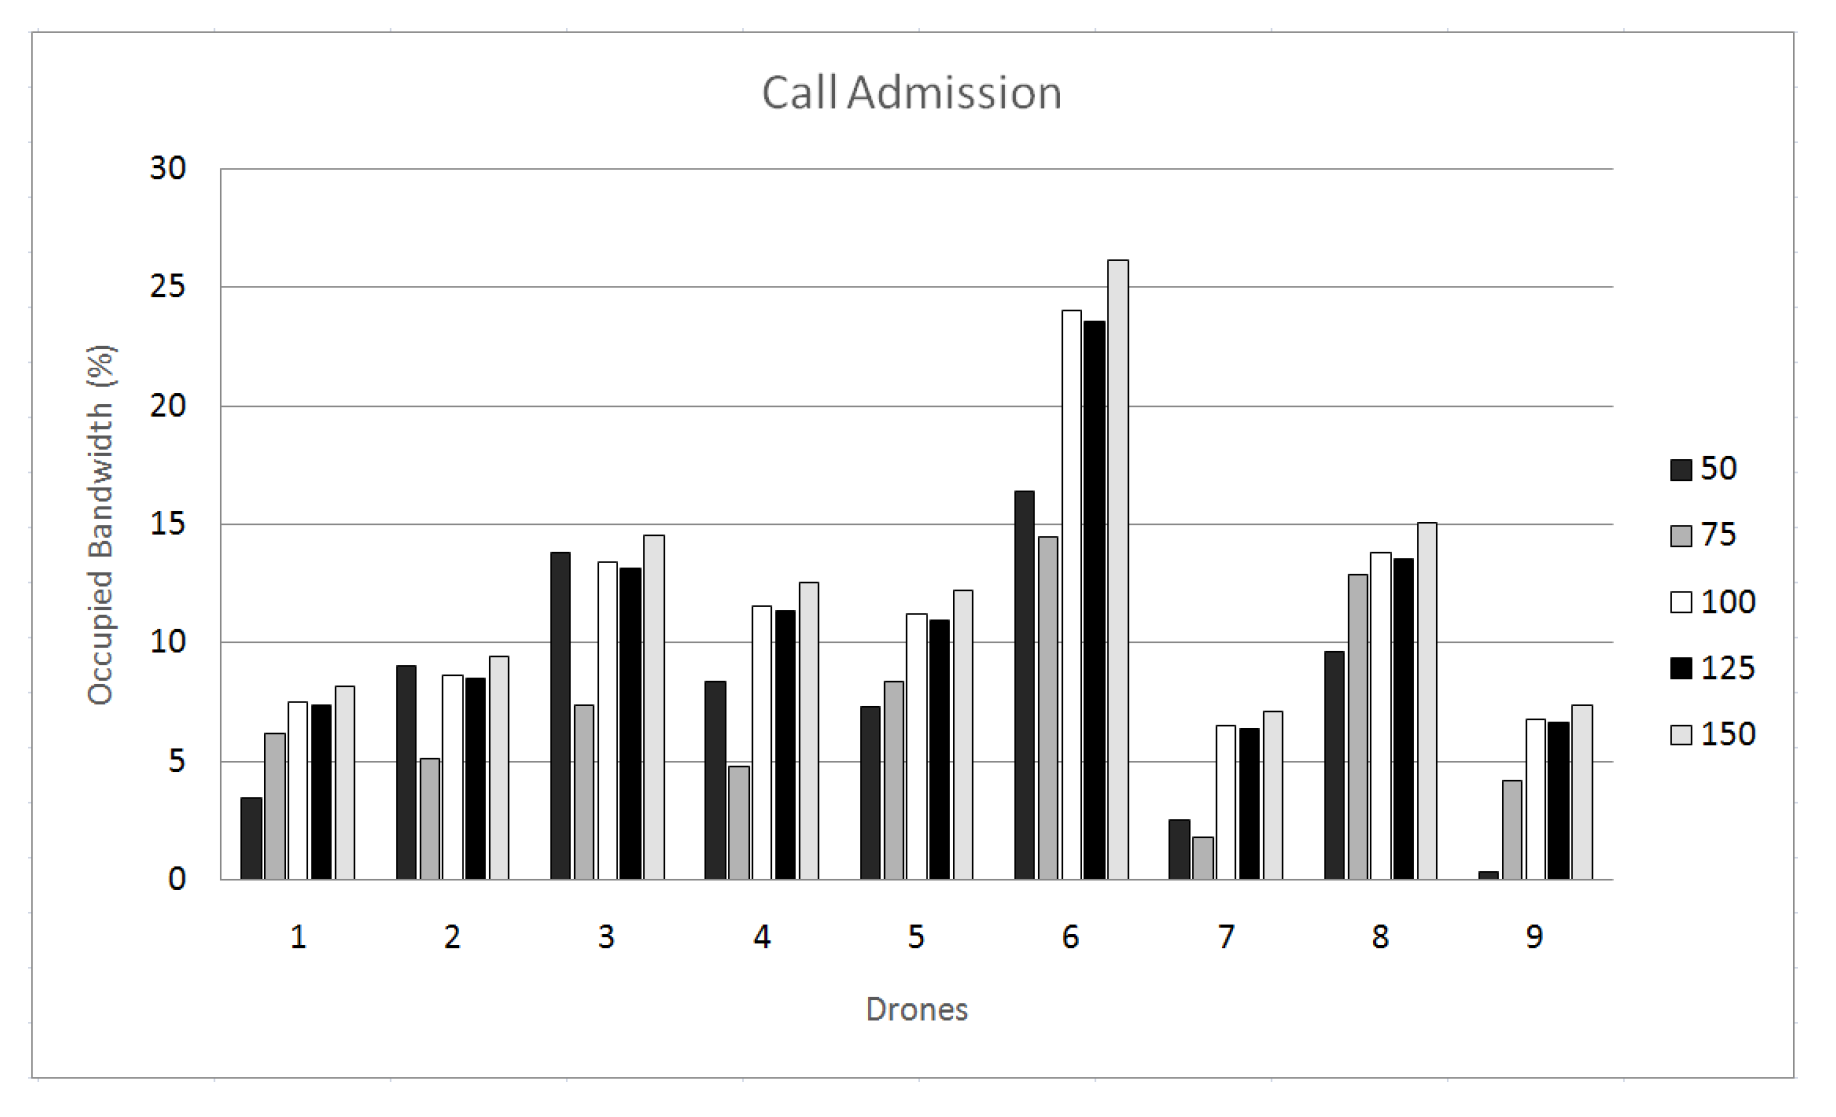
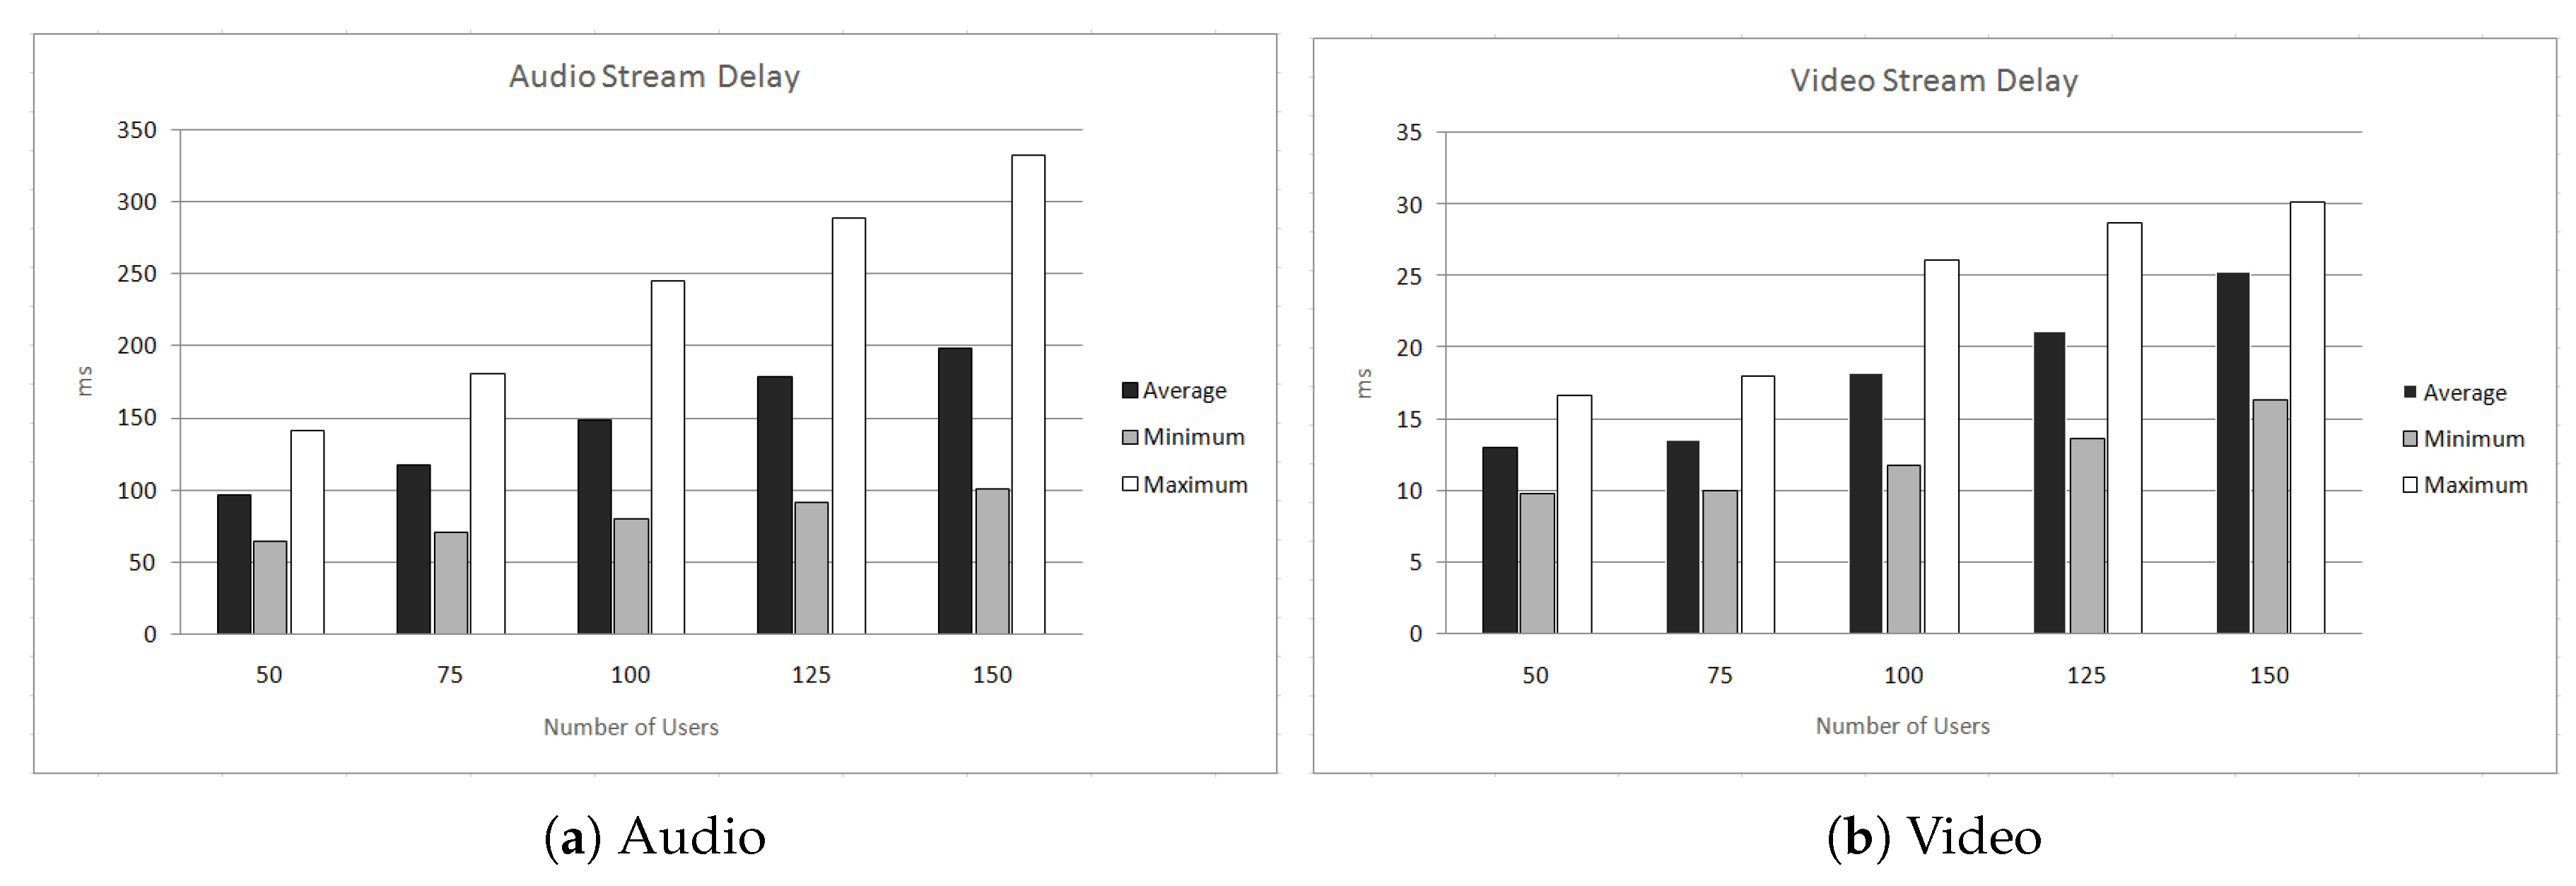
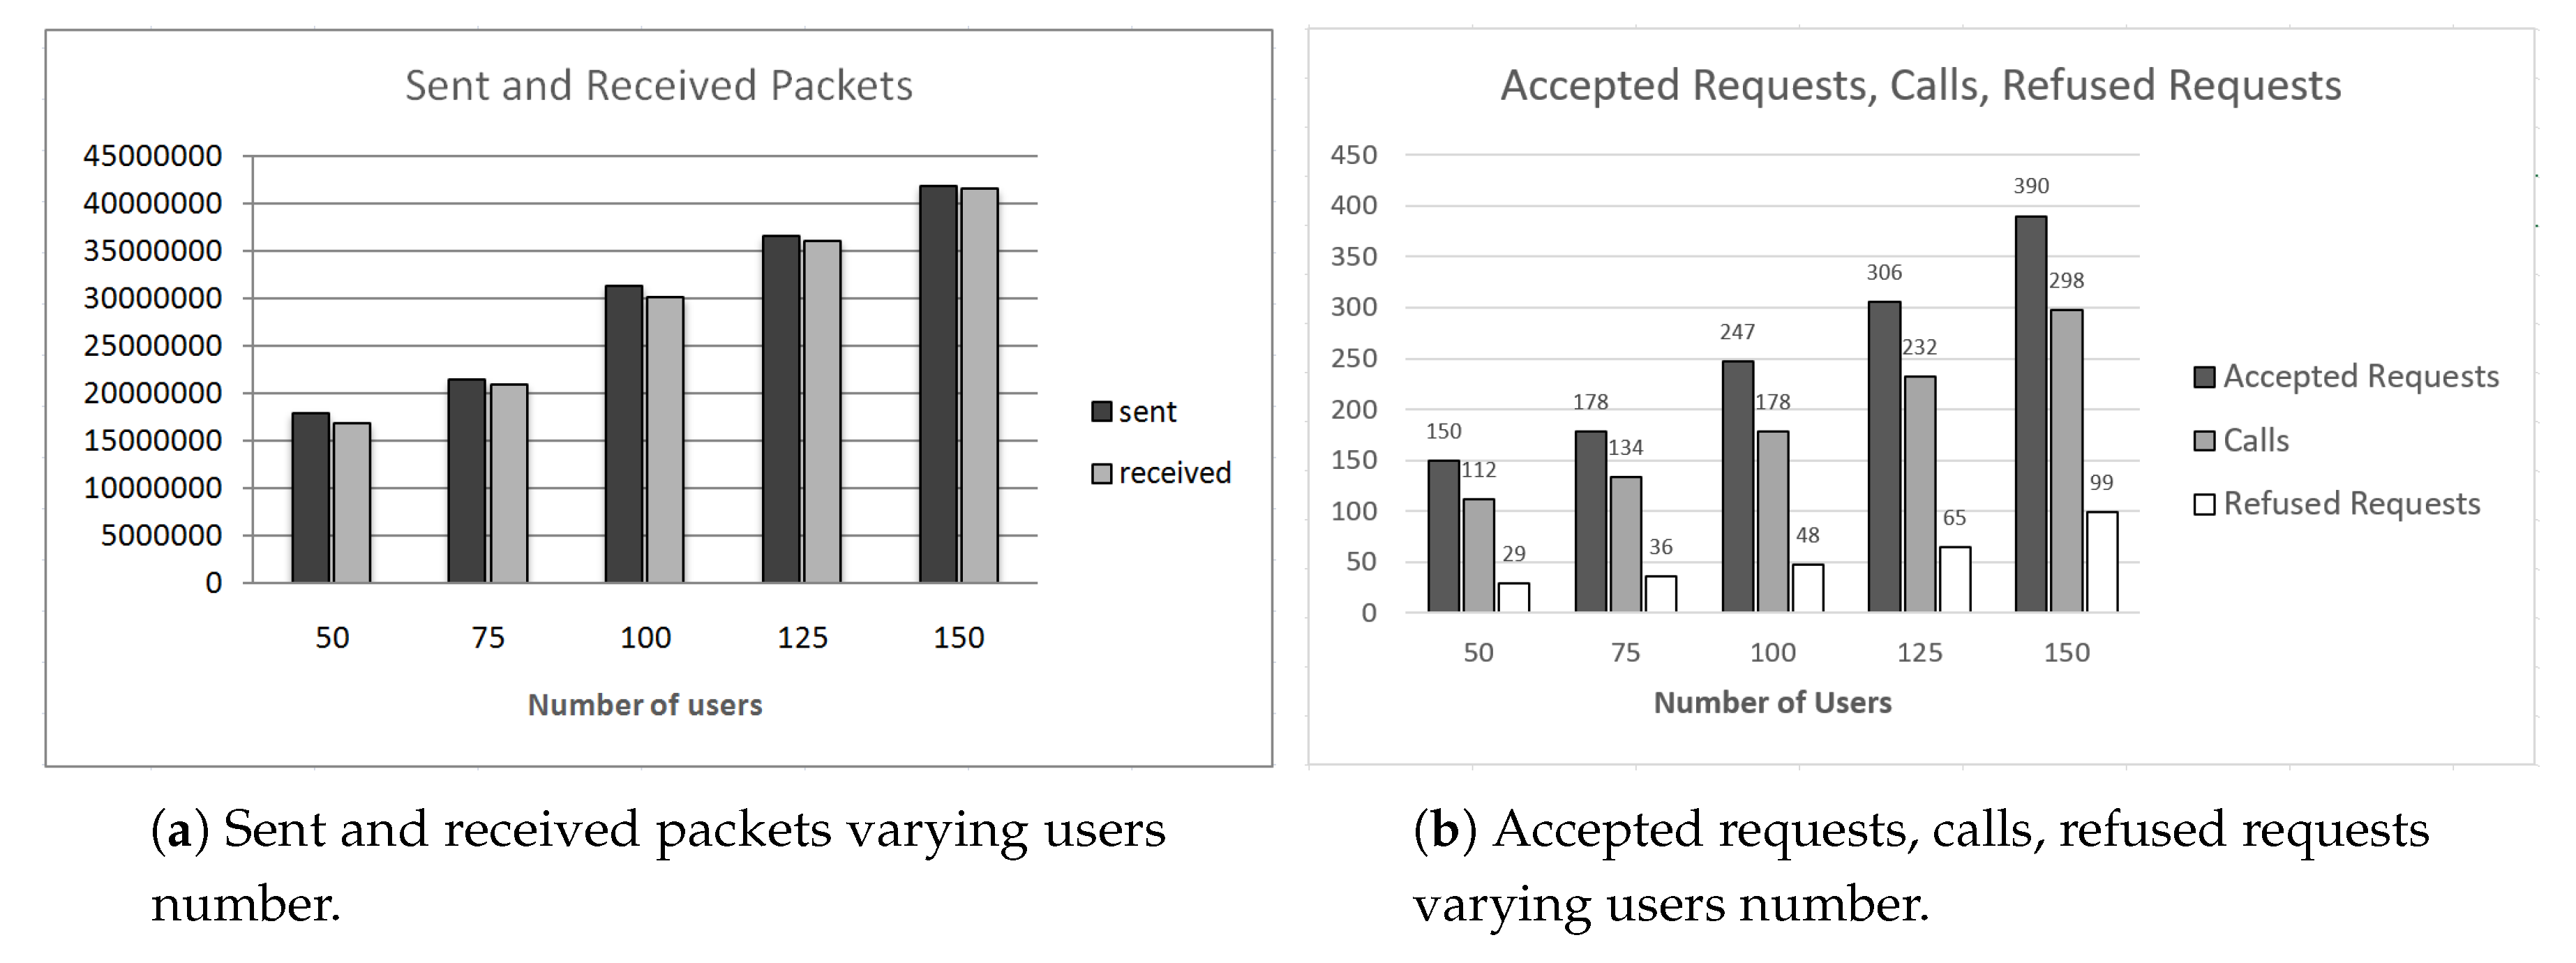
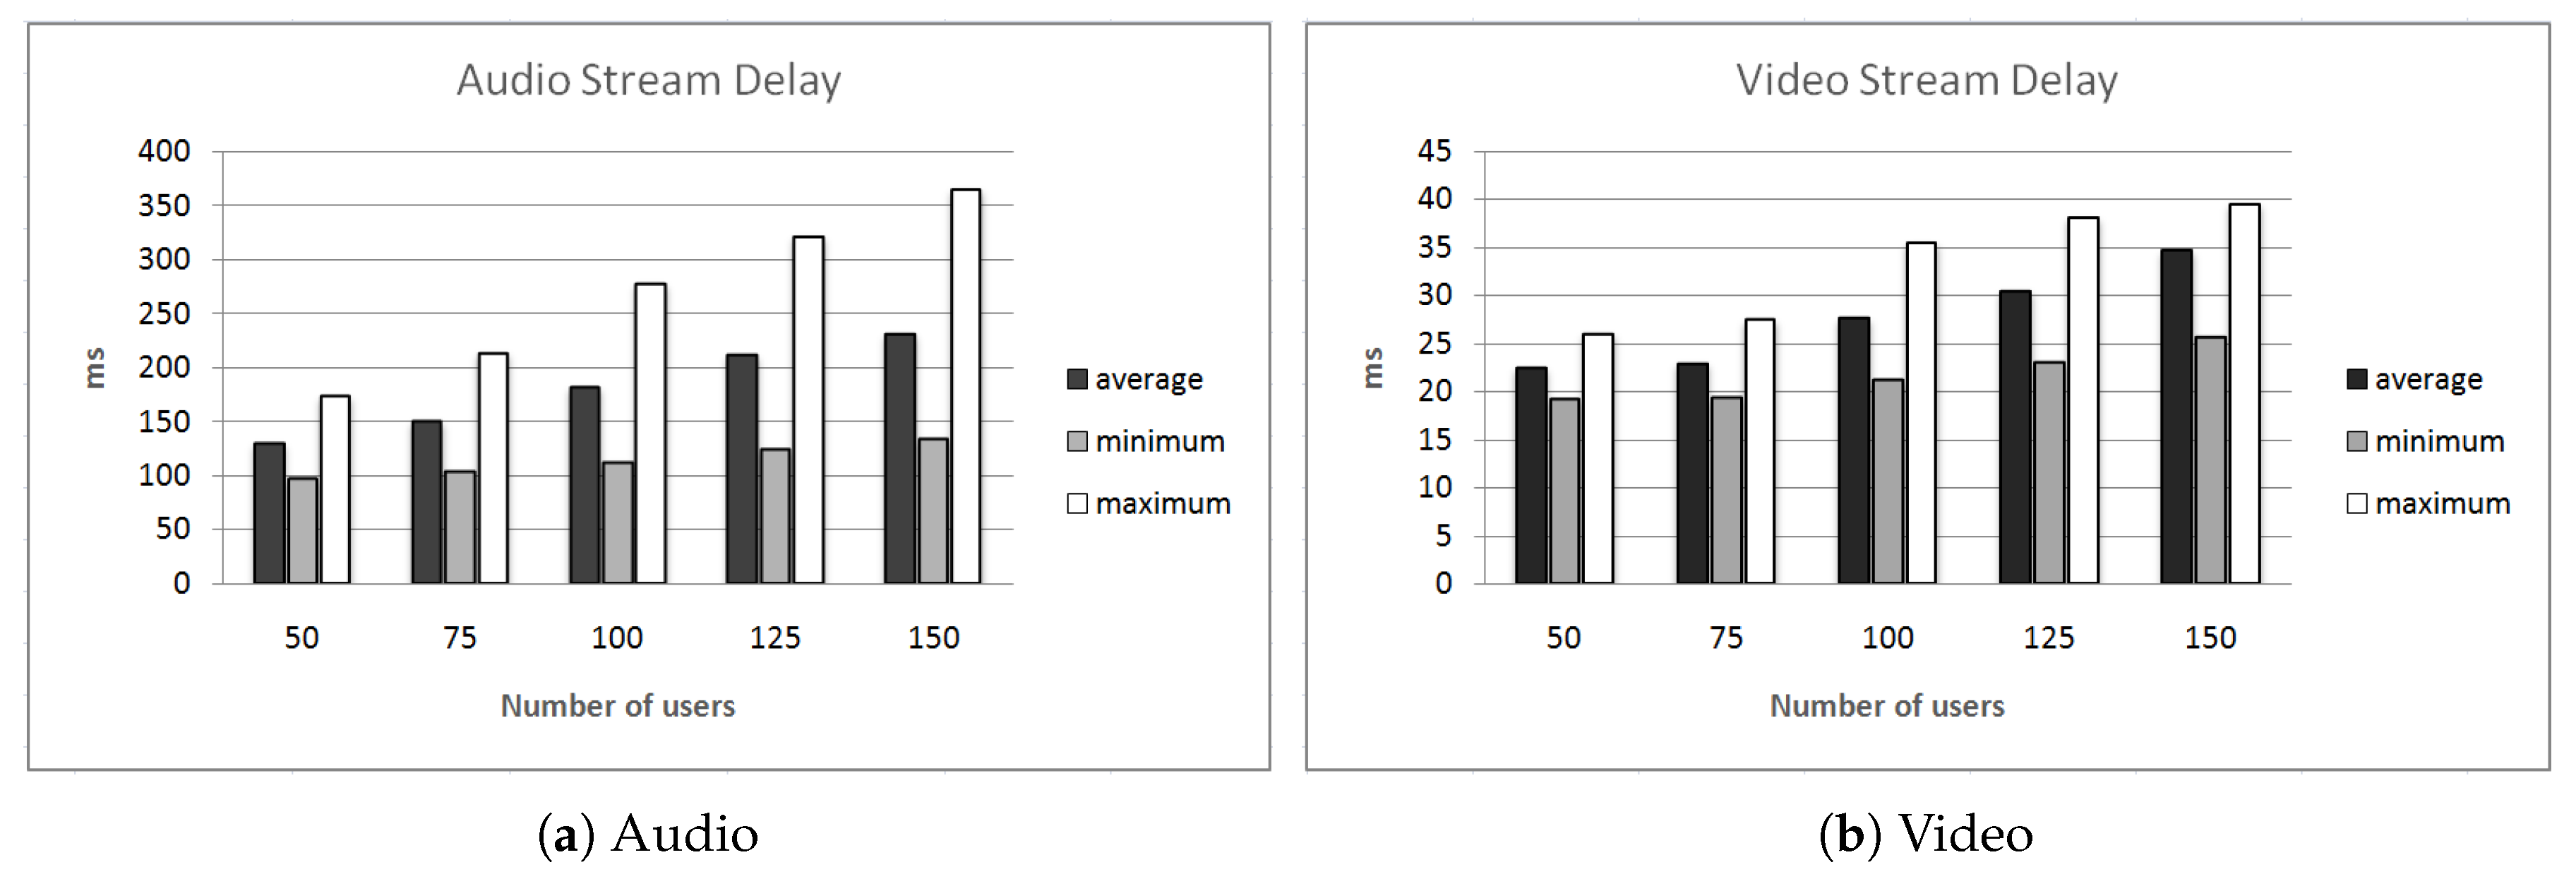
Figure 7a shows the curve trend of the sent and received packets in the scenario. It is possible to see how sent and received packets increase with the number of users on the map. This behavior of the simulator fits with the expected simulations results. This is the direct consequence of the available bandwidth on-board each device and the considered mobile users percentages among employees, housewives, and retired persons. Figure 7b shows the histogram of accepted requests, calls, and refused requests varying the number of user between 50 and 150. The trend of these results is in line with the expectation; in fact, the figure shows how the number of bandwidth requests increases with the number of users and how, therefore, calls and refused requests numbers increase. Figure 8 shows the trend of call admission behavior of each drone in the considered map. It shows the percentage of occupied bandwidth for each drone on the map and allows of making some consideration on the results. It is possible to view how Drones 3, 6, and 8 are the most loaded ones. This last ones present the greatest number of occupied bandwidth. In addition, the figure shows how the bandwidth percentage increases for higher number of users in the system and in the covered points of interest. In addition, it can be seen how the percentage of occupied bandwidth is under , thus it results in a non-congested network, without any bottleneck in terms of throughput. Finally, the delay for audio and video streams is reported in the Figure 9. It shows the minimum, average, and maximum delay for both multimedia traffic, video and audio applications. In addition, for these simulation results, the obtained trend satisfies the expectations, respecting the typical values of these traffic typologies. Delay slightly increases for a higher number of mobile users, due to the higher protocol overhead.
5.2. UAVs/drones Simulation Tests with Energy Issues
Differently from the previous subsection, in this case, the residual energy is always taken into account. Thus, the energy aware path planning is mandatory to guarantee a proper coverage. In general, simulation results are worse than the previous scenario, because of the periodical need for charging operations: energy and time are wasted for flying from charging station to the grid elements and vice versa. In this scenario, firstly, we show some graphics considering four recharging stations without considering backup drones, and then we show a comparison considering 1, 2, 4, and 5 recharging stations with and without taking into account a backup drone for each station.
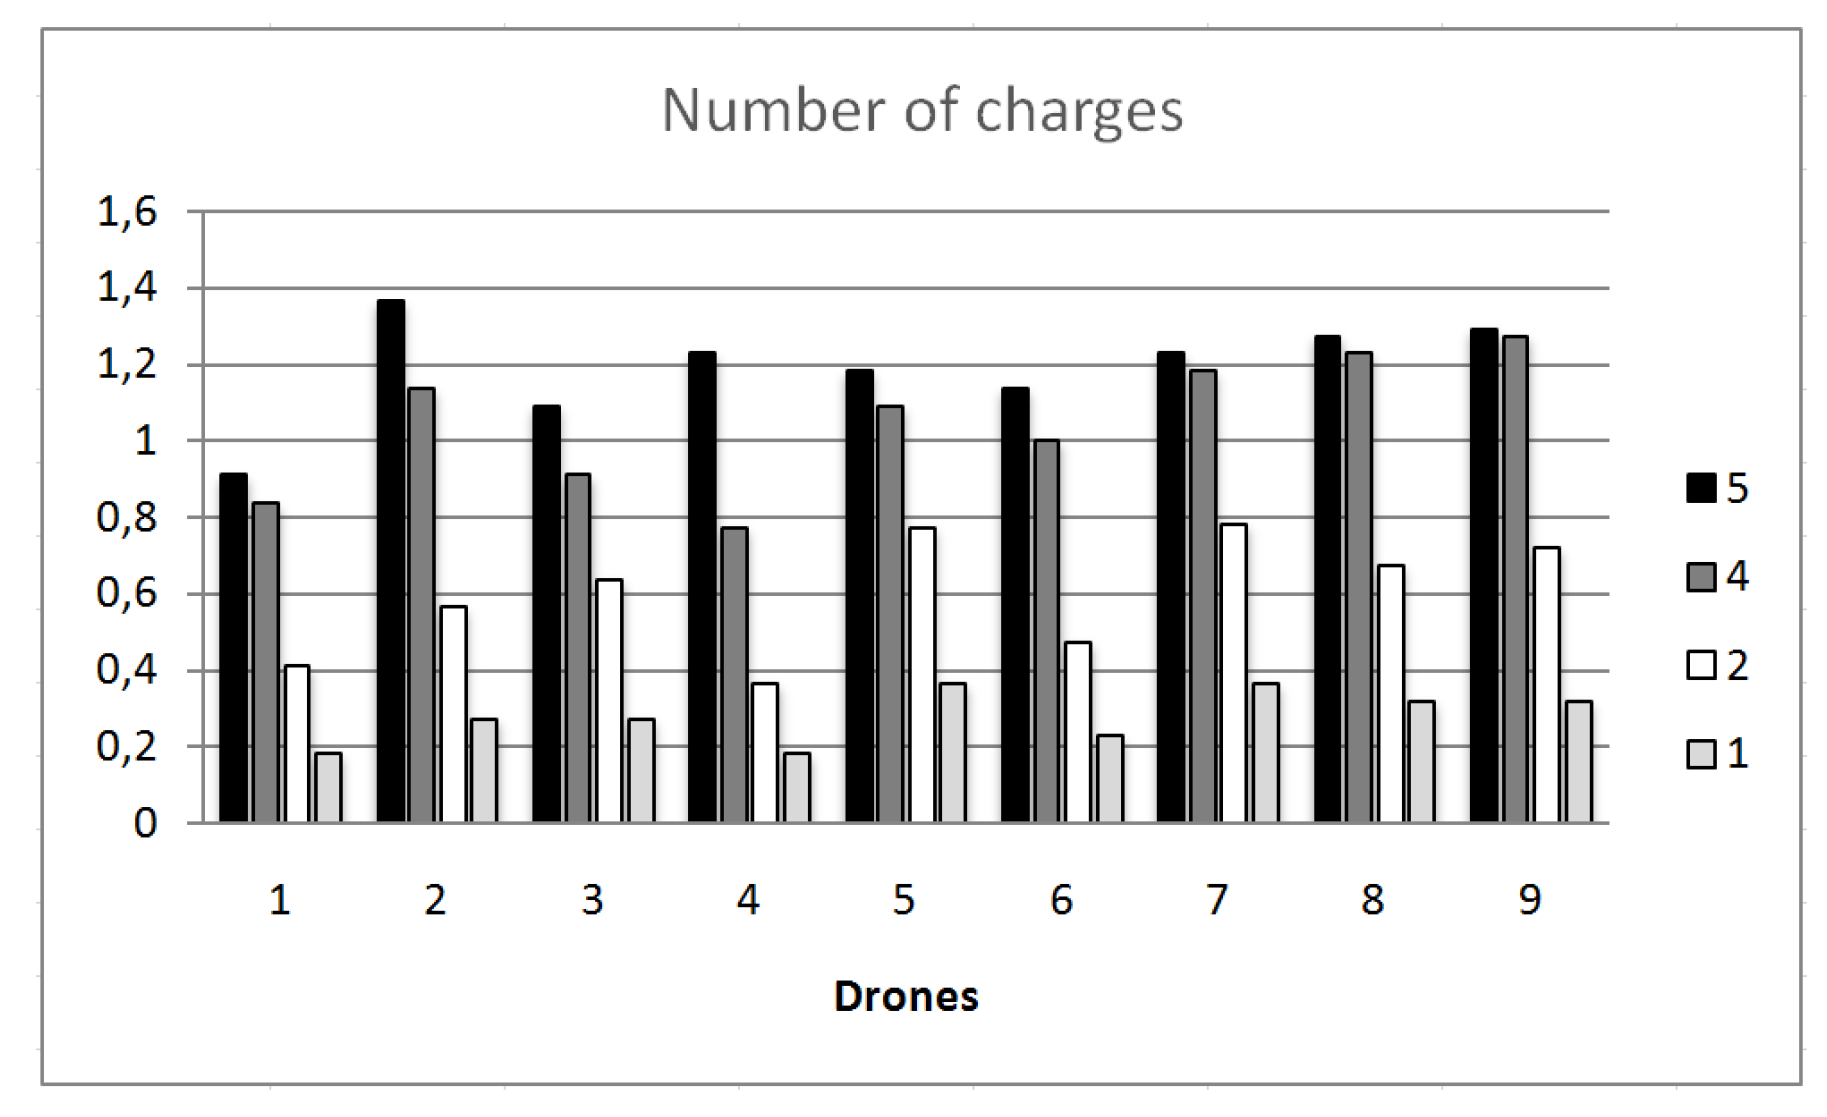
As for the previous case, also taking into account energy issues, we show the graphics for the sent and received packets in the overall considered system. Figure 10a shows the trend of the curves of sent and received packets highlighting the increasing behavior with the number of users on the map. This behavior of the simulator fits with the expected simulations results. Figure 10b shows that the number of accepted requests, calls, and refused requests are worse in this scenario. This type of behavior is due to the drones energy consumption. The drone that needs to recharge its battery recruits a new drone to permit the continuous coverage of its geographical area, guaranteeing the connectivity to the users connected; however, the drone exchange s takes some time, during which no connectivity can be provided. For this reason, a higher number of refused calls and a lower number of concluded calls are obtained. Figure 11 shows the average number of needed charges for each drone by varying the number of charging stations from one to five, as illustrated in Figure 6. As can be seen, the number of completed charging operations increases with the number of charging stations: this is due to the higher availability of charging chances. We assume that, if two or more drones compete for a charging place, they are served with a FIFO queue: waiting drones are placed near the charging stations (on the ground) and they are set in a stand-by mode (with a negligible energy consumption). Clearly, performance is degraded, in terms of not only energy consumption, but also served users, as can be seen in Figure 10b. In addition, for audio and video streaming delay, this scenario shows worse performance, as can be seen in Figure 12, because of the time needed for drones exchange and charging operations.
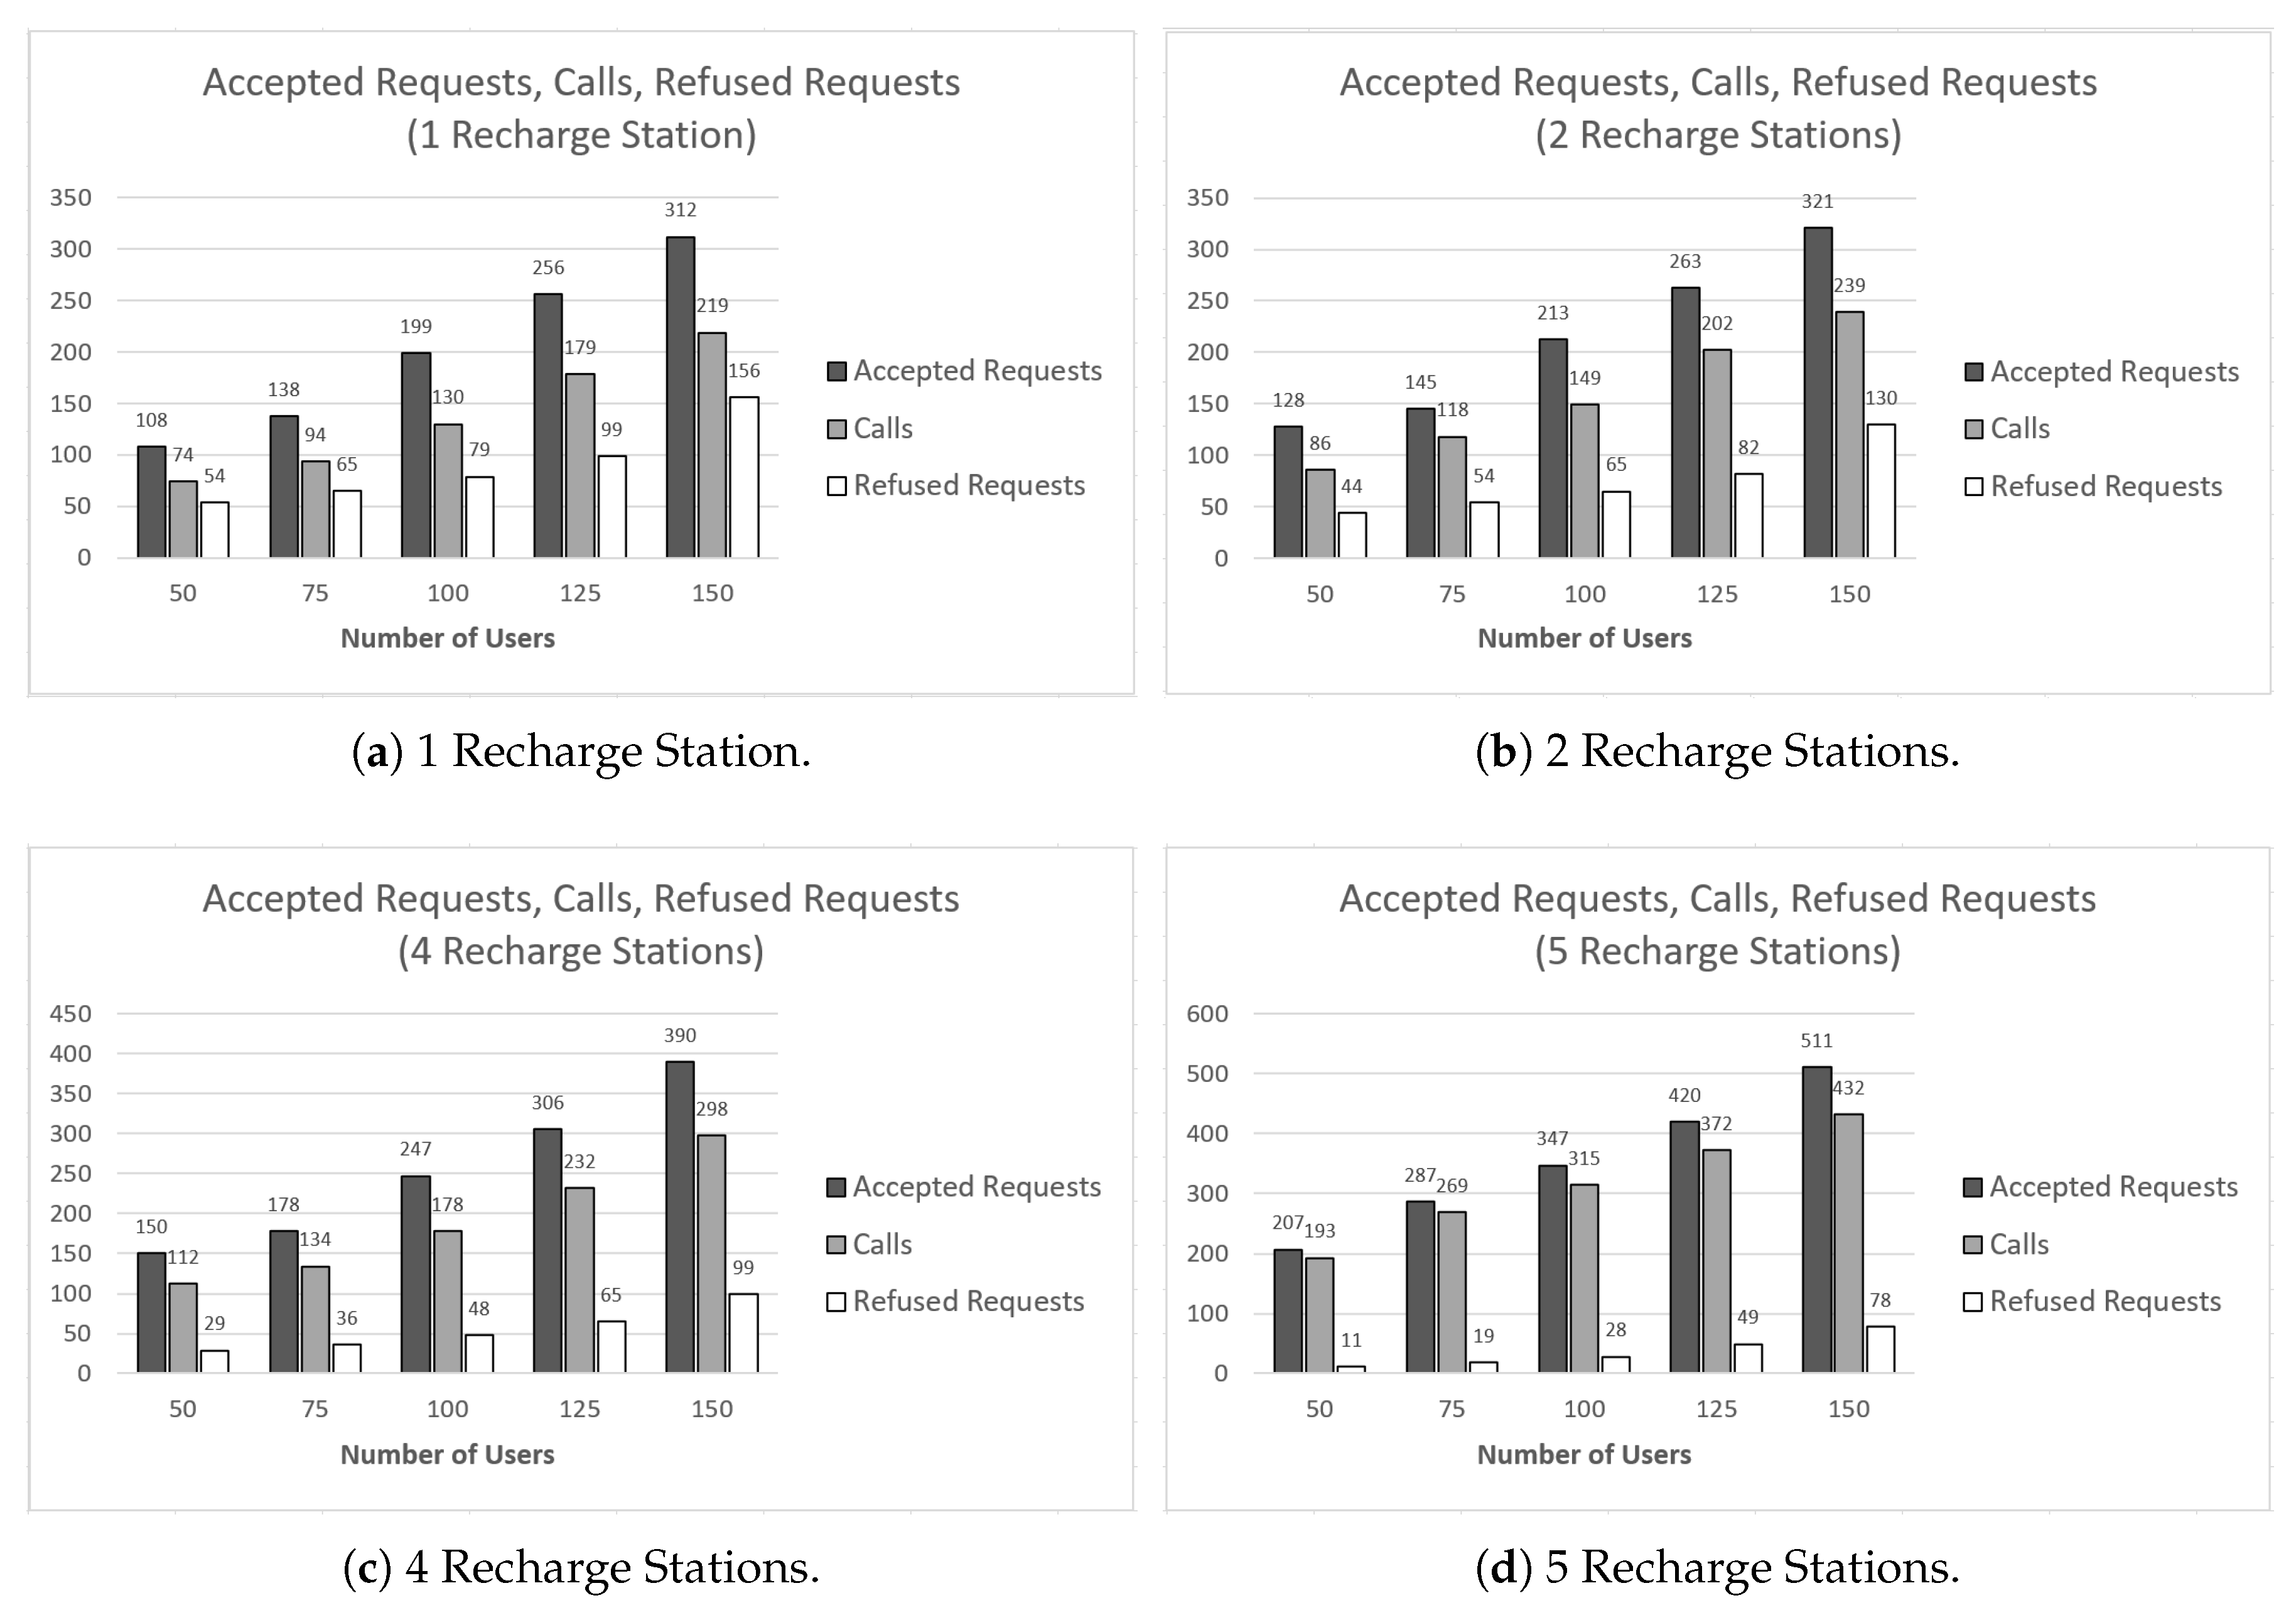
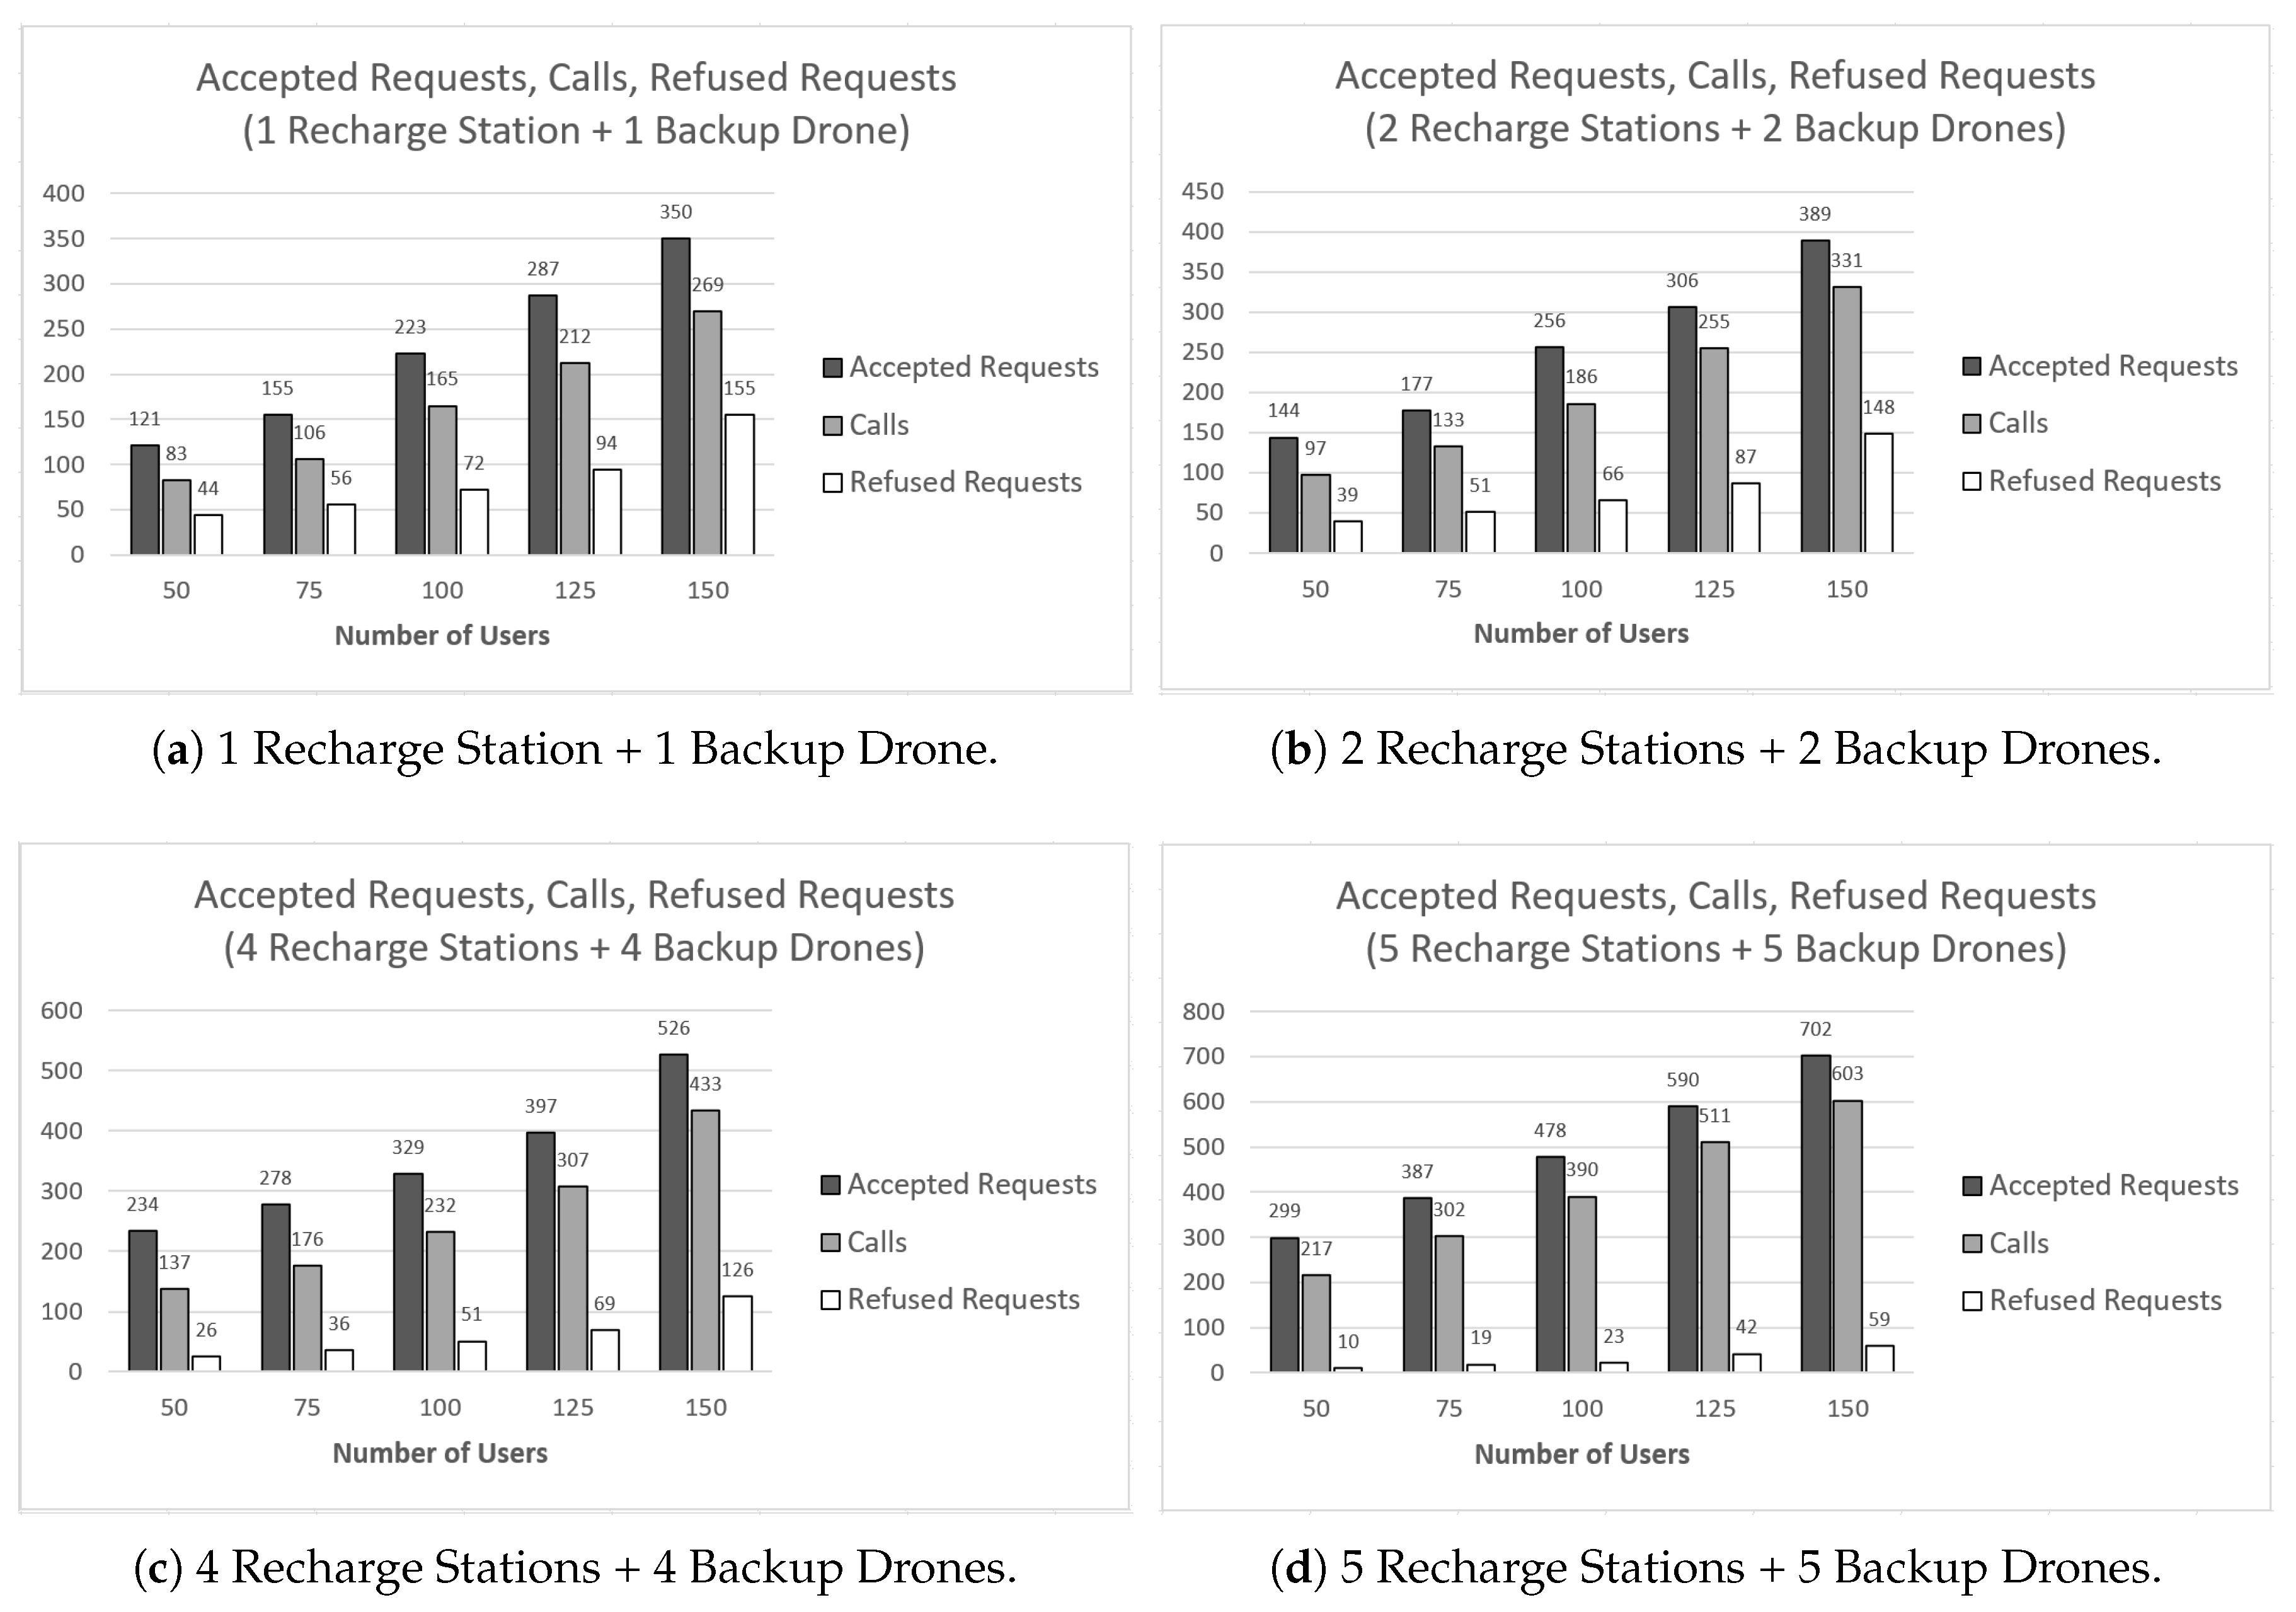
To show the effects of recharging stations in our simulator, we show some graphics about simulation results considering the use of 1–5 recharging stations on the map. Successively, we considered also the use of backup drones that can be recruited when a drone needs to perform recharging operations. The graphics in Figure 13 show how the introduction of recharging station to allow drones to recharge their battery results in worse system performance concerning the requests evaded by drones with respect to the case of considering no energy issues. The other series of graphics in Figure 14 show the performance in terms of accepted and refused requests when recharge stations and backup drones are implemented in the system together. The presence of spare drones allows replacing the device that has to recharge its battery. The drone that notices its battery level is low sends a recruiting message towards a drone placed near its recharging station. This drone reaches the location of the drone sending the request so it can provide transparently coverage to users.
6. Conclusions
In this paper, a novel UAVs Java simulator is proposed. The main features of the simulator consist of the possibility of analyzing different aspects of the so-called FANETs. Flying devices (commonly defined UAVs or drones) are able to create temporary communications from air to ground, offering new connectivity, last-mile bandwidth distribution, guaranteeing efficient communications. The proposed Java software allows performing different simulation campaigns varying different input parameters. The simulator takes into account some typical aspects of FANET, such as a human mobility model with the introduction of Points of Interest (PoIs) in order to simulate the main behavior of the people, the introduction of some typologies of users in order to simulate different users’ moving, the footprint for channel modeling, the Link-State routing protocol for data exchange (audio and video streaming in particular), and dynamic range adjustment for taking into account user requests. Simulation results verified and confirmed the effectiveness of the proposed simulator.
As regards our future works, we plan to improve the simulator by adding some other aspects, such as other network protocols and various techniques for safety and security considering new proposal for the solutions against different attacks. It is also important to consider new optimal placement algorithms and investigate adequately the energy aspects for drone flight in every phase of its movement, including providing the connection to the users. Moreover, it is possible to improve the use of the recharging station through the optimization of the stations and the number of backup drones for each station. Moreover, in this work, no collision avoidance issues have been taken into account and no consideration has been done on the possibility of a drone to be in the same airspace of its neighbors. All these aspects are in the development phase and will be taken into account in our future proposals.
Author Contributions
F.D.R. conceived the idea; M.T. designed and implemented the software simulator with the help of P.F.; F.D.R. and N.C. analyzed the data; and M.T. and F.D.R. reviewed the paper with the help of N.C. All authors have read and agreed to the published version of the manuscript.
Funding
This research received no external funding.
Conflicts of Interest
The authors declare no conflict of interest.
References
- Winkler, S.; Zeadally, S.; Evans, K. Privacy and Civilian Drone Use: The Need for Further Regulation. IEEE Secur. Priv. 2018, 16, 72–80. [Google Scholar] [CrossRef]
- Oubbati, O.S.; Atiquzzaman, M.; Lorenz, P.; Tareque, H.; Hossain, S. Routing in Flying Ad Hoc Networks: Survey, Constraints, and Future Challenge Perspectives. IEEE Access 2019, 7, 81057–81105. [Google Scholar] [CrossRef]
- Bujari, A.; Calafate, C.T.; Cano, J.C.; Manzoni, P.; Palazzi, C.E.; Ronzani, D. Flying ad-hoc network application scenarios and mobility models. Int. J. Distrib. Sens. Netw. 2017, 13, 10. [Google Scholar] [CrossRef] [Green Version]
- Huang, H.; Savkin, A.V. An Algorithm of Efficient Proactive Placement of Autonomous Drones for Maximum Coverage in Cellular Networks. IEEE Wirel. Commun. Lett. 2018, 7, 994–997. [Google Scholar] [CrossRef]
- Fazio, P.; Tropea, M.; De Rango, F.; Voznak, M. Pattern prediction and passive bandwidth management for hand-over optimization in QoS cellular networks with vehicular mobility. IEEE Trans. Mob. Comput. 2016, 15, 2809–2824. [Google Scholar] [CrossRef]
- Fazio, P.; De Rango, F.; Tropea, M. Prediction and qos enhancement in new generation cellular networks with mobile hosts: A survey on different protocols and conventional/unconventional approaches. IEEE Commun. Surv. Tutor. 2017, 19, 1822–1841. [Google Scholar] [CrossRef]
- Santamaria, A.F.; Fazio, P.; Raimondo, P.; Tropea, M.; De Rango, F. A New Distributed Predictive Congestion Aware Re-Routing Algorithm for CO2 Emissions Reduction. IEEE Trans. Veh. Technol. 2019, 68, 4419–4433. [Google Scholar] [CrossRef]
- Nguyen, T.N.; Duy, T.T.; Luu, G.T.; Tran, P.T.; Voznak, M. Energy harvesting-based spectrum access with incremental cooperation, relay selection and hardware noises. Radioengineering 2017, 26, 240–250. [Google Scholar] [CrossRef]
- Nguyen, T.N.; Do, D.T.; Tran, P.T.; Voznak, M. Time switching for wireless communications with full-duplex relaying in imperfect CSI condition. KSII Trans. Internet Inf. Syst. 2016, 10, 4223–4239. [Google Scholar]
- Do, D.T.; Nguyen, H.S.; Voznak, M.; Nguyen, T.S. Wireless powered relaying networks under imperfect channel state information: System performance and optimal policy for instantaneous rate. Radioengineering 2017, 26, 869–877. [Google Scholar] [CrossRef]
- Tropea, M.; Fazio, P. A Simulator for Creating Drones Networks and Providing Users Connectivity. In Proceedings of the 2019 IEEE/ACM 23rd International Symposium on Distributed Simulation and Real Time Applications (DS-RT), Cosenza, Italy, 7–9 October 2019; pp. 1–8. [Google Scholar]
- Stöcker, C.; Bennett, R.; Nex, F.; Gerke, M.; Zevenbergen, J. Review of the current state of UAV regulations. Remote. Sens. 2017, 9, 459. [Google Scholar] [CrossRef] [Green Version]
- Bozza Circolare LIC 15 Mezzi Aerei a Pilotaggio Remoto - Centri di Addestramento e Attestati Pilota. Available online: https://www.enac.gov.it/la-normativa/normativa-enac/consultazione-normativa/bozza-circolare-lic-15-mezzi-aerei-pilotaggio-remoto-centri-di-addestramento-attestati-pilota (accessed on 10 November 2019).
- Workshop “Prospettive e transizione dal Regolamento ENAC Mezzi a pilotaggio Remoto al nuovo Regolamento EASA”. Available online: https://www.enac.gov.it/news/workshop-prospettive-transizione-dal-regolamento-enac-mezzi-pilotaggio-remoto-al-nuovo (accessed on 10 November 2019).
- Mardani, A.; Chiaberge, M.; Giaccone, P. Communication-Aware UAV Path Planning. IEEE Access 2019, 7, 52609–52621. [Google Scholar] [CrossRef]
- Song, X.; Hu, S. 2D path planning with Dubins-path-based A* algorithm for a fixed-wing UAV. In Proceedings of the 2017 3rd IEEE International Conference on Control Science and Systems Engineering (ICCSSE), Beijing, China, 17–19 August 2017. [Google Scholar]
- Ghaddar, A.; Merei, A. Energy-Aware Grid Based Coverage Path Planning for UAVs. In Proceedings of the Thirteenth International Conference on Sensor Technologies and Applications SENSORCOMM, Nice, France, 27–31 October 2019. [Google Scholar]
- De Rango, F.; Palmieri, N.; Santamaria, A.F.; Potrino, G. A simulator for UAVs management in agriculture domain. In Proceedings of the 2017 International Symposium on Performance Evaluation of Computer and Telecommunication Systems (SPECTS), Seattle, WA, USA, 9–12 July 2017; pp. 1–8. [Google Scholar]
- De Rango, F.; Palmieri, N.; Tropea, M.; Potrino, G. UAVs Team and Its Application in Agriculture: A Simulati5on Environment. SIMULTECH 2017, 2017, 374–379. [Google Scholar]
- De Rango, F.; Potrino, G.; Tropea, M.; Santamaria, A.F.; Fazio, P. Scalable and ligthway bio-inspired coordination protocol for FANET in precision agriculture applications. Comput. Electr. Eng. 2019, 74, 305–318. [Google Scholar] [CrossRef]
- Marconato, E.A.; Rodrigues, M.; Pires, R.D.M.; Pigatto, D.F.; Luiz Filho, C.Q.; Pinto, A.R.; Branco, K.R. Avens-a novel flying ad hoc network simulator with automatic code generation for unmanned aircraft system. In Proceedings of the HICSS, Hilton Waikoloa Village, HI, USA, 4–7 January 2017. [Google Scholar]
- Zema, N.R.; Trotta, A.; Sanahuja, G.; Natalizio, E.; Di Felice, M.; Bononi, L. CUSCUS: CommUnicationS-control distributed simulator. In Proceedings of the 2017 14th IEEE Annual Consumer Communications & Networking Conference (CCNC), Las Vegas, NV, USA, 8–11 January 2017; pp. 601–602. [Google Scholar]
- Baidya, S.; Shaikh, Z.; Levorato, M. FlyNetSim: An open source synchronized UAV network simulator based on ns-3 and ardupilot. In Proceedings of the 21st ACM International Conference on Modeling, Analysis and Simulation of Wireless and Mobile Systems, Montreal, QC, Canada, 19 October 2018; pp. 37–45. [Google Scholar]
- Kate, B.; Waterman, J.; Dantu, K.; Welsh, M. Simbeeotic: A simulator and testbed for micro-aerial vehicle swarm experiments. In Proceedings of the 2012 ACM/IEEE 11th International Conference on Information Processing in Sensor Networks (IPSN), Beijing, China, 16–20 April 2012; pp. 49–60. [Google Scholar]
- Javaid, A.Y.; Sun, W.; Alam, M. UAVSim: A simulation testbed for unmanned aerial vehicle network cyber security analysis. In Proceedings of the 2013 IEEE Globecom Workshops (GC Wkshps), Atlanta, GA, USA, 9–13 December 2013; pp. 1432–1436. [Google Scholar]
- Al-Mousa, A.; Sababha, B.H.; Al-Madi, N.; Barghouthi, A.; Younisse, R. UTSim: A framework and simulator for UAV air traffic integration, control, and communication. Int. J. Adv. Robot. Syst. 2019, 16. [Google Scholar] [CrossRef] [Green Version]
- Al-Hourani, A.; Kandeepan, S.; Jamalipour, A. Modeling air-to-ground path loss for low altitude platforms in urban environments. In Proceedings of the 2014 IEEE Global Communications Conference, Austin, TX, USA, 8–12 December 2014; pp. 2898–2904. [Google Scholar]
- Park, K.N.; Cho, B.M.; Park, K.J.; Kim, H. Optimal coverage control for net-drone handover. In Proceedings of the 2015 Seventh International Conference on Ubiquitous and Future Networks, Sapporo, Japan, 7–10 July 2015; pp. 97–99. [Google Scholar]
- Sae, J.; Yunas, S.F.; Lempiainen, J. Coverage aspects of temporary LAP network. In Proceedings of the 2016 12th Annual Conference on Wireless on-Demand Network Systems and Services (WONS), Cortina d’Ampezzo, Italy, 20–22 January 2016; pp. 1–4. [Google Scholar]
- Xie, J.; Dong, C.; Li, A.; Wang, H.; Wang, W. Optimal Deployment Density for Maximum Coverage of Drone Small Cells. In Proceedings of the 2017 IEEE 86th Vehicular Technology Conference (VTC-Fall), Toronto, ON, Canada, 24–27 September 2017; pp. 1–6. [Google Scholar]
- Papandrea, M.; Jahromi, K.K.; Zignani, M.; Gaito, S.; Giordano, S.; Rossi, G.P. On the properties of human mobility. Comput. Commun. 2016, 87, 19–36. [Google Scholar] [CrossRef] [Green Version]
- Kang, J.H.; Welbourne, W.; Stewart, B.; Borriello, G. Extracting places from traces of locations. ACM Sigmobile Mob. Comput. Commun. Rev. 2005, 9, 58–68. [Google Scholar] [CrossRef]
- Feng, Q.; McGeehan, J.; Tameh, E.K.; Nix, A.R. Path loss models for air-to-ground radio channels in urban environments. In Proceedings of the 2006 IEEE 63rd Vehicular Technology Conference, Melbourne, Victoria, Australia, 7–10 May 2006; Volume 6, pp. 2901–2905. [Google Scholar]
- Fotouhi, A.; Qiang, H.; Ding, M.; Hassan, M.; Giordano, L.G.; Garcia-Rodriguez, A.; Yuan, J. Survey on UAV cellular communications: Practical aspects, standardization advancements, regulation, and security challenges. IEEE Commun. Surv. Tutor. 2019, 21, 3417–3442. [Google Scholar] [CrossRef] [Green Version]
- Zeng, Y.; Zhang, R. Energy-efficient UAV communication with trajectory optimization. IEEE Trans. Wirel. Commun. 2017, 16, 3747–3760. [Google Scholar] [CrossRef] [Green Version]
- Erdelj, M.; Natalizio, E. UAV-assisted disaster management: Applications and open issues. In Proceedings of the 2016 international conference on computing, networking and communications (ICNC), Kauai, HI, USA, 15–18 Febuary 2016; pp. 1–5. [Google Scholar]
Figure 1.
UAV/drone coverage footprint on the map.

Figure 2.
New record of LSA DB.

Figure 3.
Diagram of human behavior for the different types of users.

Figure 4.
An example of geographical coverage: black points are the drones, thin circles represent their coverage area, and the link represent the connection for data/overhead/LSP transmission.
Figure 4.
An example of geographical coverage: black points are the drones, thin circles represent their coverage area, and the link represent the connection for data/overhead/LSP transmission.

Figure 5.
Example of next PoI chosen by user to reach point D from S (Point 2 is the closer to D).

Figure 6.
Charging stations placement with a typical UAV coverage.

Figure 7.
Curves on packets and requests number.

Figure 8.
Drones call admission number varying users number.

Figure 9.
Audio and video stream delay (average, minimum, and maximum) varying users number.

Figure 10.
Curves on packets and requests number.

Figure 11.
Number of charges varying charging stations number.

Figure 12.
Audio and video stream delay (average, minimum, and maximum) varying user number.

Figure 13.
Accepted requests, calls, and refused requests varying users and the recharge stations’ number.
Figure 13.
Accepted requests, calls, and refused requests varying users and the recharge stations’ number.

Figure 14.
Accepted requests, calls, and refused requests varying users and the recharge stations’ number considering backup drones.
Figure 14.
Accepted requests, calls, and refused requests varying users and the recharge stations’ number considering backup drones.


Table 1.
Table of drones.
| Subcategory | Operative Environment | Drone Class | Weight | Required Skills |
|---|---|---|---|---|
| A1 (VLOS, h<120m) | Overflight of uninvolved people (no gatherings) | C0 C1 | <250 g; <900 g; (v<19 m/s, E<80J) | Online training and online exam prepared by the authority or center recognized by the authority |
| A2 (VLOS, h<120m) | 50 m horizontal from uninvolved people, or 5 m if a low speed mode limited to 3 m/s is installed | C2 | <4 kg | Certificate of competence issued by the authority or a center recognized by the authority, after: Online training and online examination as for A1. Self-practical training. Additional online training and online exam prepared by the authority or center recognized by the authority with additional subjects |
| A3 (VLOS, h<120m) | No presence of uninvolved people, 150 m from residential, commercial, industrial, or recreational areas | C3 C4 | <25 kg <25 kg | Online training and online exam as for A1 |
Table 2.
Comparison of UAVs software simulators on implemented models.
| Simulator | Applications | Human Mobility | Coverage Model | Path Planning | Energy Model |
|---|---|---|---|---|---|
| Model | Model | Model | |||
| AVENS [21] | R&D | - | - | x | - |
| CUSCUS [22] | R&D | - | - | x | - |
| FlyNetSim [23] | R&D | - | x | x | - |
| Simbeeotic [24] | R&D | - | x | - | - |
| UAVSim [25] | R&D | - | x | x | - |
| UTSim [26] | R&D | - | x | x | - |
| FANETSim | R&D | x | x | x | x |
Table 3.
Footprint coverage model: used symbols.
| Symbols | Description |
|---|---|
| average additional loss to the free space propagation loss in LoS | |
| average additional loss to the free space propagation loss in NLoS | |
| SNR threshold | |
| constant values which depend on the environment (rural, urban, dense urban, etc.) | |
| constant values which depend on the environment (rural, urban, dense urban, etc.) | |
| carrier frequency | |
| Path Loss | |
| Path Loss for the LoS component of the signal | |
| Path Loss for the NLoS component of the signal | |
| h | height |
| r | coverage radius |
| d | distance between drone and receiver |
| elevation angle | |
| probability of having LoS connections at an elevation angle of | |
| probability of having NLoS connections at an elevation angle of | |
| transmission power | |
| received power | |
| N | noise power |
| h on r ratio |
Table 4.
Drone behavior model: used symbols.
| Symbols | Description |
|---|---|
| edge | |
| Energy consumed traveling between and | |
| Residual Energy | |
| Point of No Return (PNR) Energy | |
| Loopless path between a starting waypoint and a destination waypoint | |
| Consuming power | |
| charging station | |
| traveling time on |
Table 5.
Simulation parameters.
| Parameter | Value |
|---|---|
| Simulation time | 300 min |
| Area size | |
| Drones grid | |
| Drones resource | 10 Mbps |
| Drones coverage radius | 175 m |
| Drones distance | 252 m |
| Drones optimal height | 120 m |
| Drones buffer size | 50 packets |
| Drones communication range | 300 m |
| Recharging station number | 1, 2, 4, 5 |
| Backup Drones number | 1, 2, 4, 5 |
| PoIs grid | with |
| PoIs distance | meters m |
| PoIs number | (108 h |
| 36 shops, restaurant, entertainment) | |
| m | |
| m | |
| 300 s | |
| Audio&Video Calls % | 30% Audio & 70% Video |
| Users speed | 3 km/h |
| Users number | 50, 75, 100, 125, 150 |
| Users’ distribution | 70% employees |
| 20% housewives | |
| 10% retired persons |
© 2020 by the authors. Licensee MDPI, Basel, Switzerland. This article is an open access article distributed under the terms and conditions of the Creative Commons Attribution (CC BY) license (http://creativecommons.org/licenses/by/4.0/).
Share and Cite
MDPI and ACS Style
Tropea, M.; Fazio, P.; De Rango, F.; Cordeschi, N. A New FANET Simulator for Managing Drone Networks and Providing Dynamic Connectivity. Electronics 2020, 9, 543. https://doi.org/10.3390/electronics9040543
AMA Style
Tropea M, Fazio P, De Rango F, Cordeschi N. A New FANET Simulator for Managing Drone Networks and Providing Dynamic Connectivity. Electronics. 2020; 9(4):543. https://doi.org/10.3390/electronics9040543
Chicago/Turabian StyleTropea, Mauro, Peppino Fazio, Floriano De Rango, and Nicola Cordeschi. 2020. "A New FANET Simulator for Managing Drone Networks and Providing Dynamic Connectivity" Electronics 9, no. 4: 543. https://doi.org/10.3390/electronics9040543
Note that from the first issue of 2016, this journal uses article numbers instead of page numbers. See further details here.