Article

Preliminary Study on Mini-Modus Device Equipped with a Bioreactor to Purify and Oxygenate a Synthetic Effluent

1
Consula Sas di Perin Fabrizio & C. Sede legale Via H Arendt 11, 30027 San Donà di Piave, Italy
2
Department of Environmental, Computer, and Statistics Sciences (DAIS), University of Venice, via Torino, 155, 30170 Mestre, Italy
3
Formerly at the CNR-ISMAR, Sede di Venezia, Castello 1364/a, 30122 Venice, Italy
4
C. da Vallemerlo, 16, 66023 Francavilla al Mare, Italy
*
Author to whom correspondence should be addressed.
Environments 2023, 10(2), 21; https://doi.org/10.3390/environments10020021
Submission received: 6 December 2022 / Revised: 22 January 2023 / Accepted: 24 January 2023 / Published: 28 January 2023

Abstract

:
To explore the possibility of recovering a polluted anoxic environment characterized by an elevated organic load, a bench-scale novel technology, called the module for the decontamination of units of sediment (MODUS), was studied. The bench-scale apparatus is able to aerate an effluent by a sparger that uses an air flow. The apparatus was implemented with a bioreactor to biodegrade a synthetic effluent made by glucose, urea, and potassium acid phosphate; an apparatus that will be here referred to as the BIOmini-MODUS. To test its performance, seven series of biodegradation experiments were done, each series corresponding to one of the seven different selected air flows in the range 5–20 L min−1. The purpose was to determine the best operative conditions for the BIOmini-MODUS, especially in terms of energy efficiency. These were found by studying eight parameters deemed particularly crucial: (1) dissolved oxygen concentration of the synthetic effluent, (2) time required to complete the substrate biodegradation, (3) air pressure (head losses) of the pumped air, (4) power needed to pump the air, (5) total energy used during a single biodegradation experiment, (6) biodegradation efficiency, (7) biological oxygen demand BOD as a function of time, and (8) the maximum biodegradation velocity reached by each biodegradation experiment. All of them, except BOD, were a function of the air flow. The air flow resulted in being particularly important to optimize the performance of the BIOmini-MODUS in terms of biodegradation velocity and oxygen concentration at the apparatus exit, in conjunction with energy efficiency. This last one, which showed a sharp maximum for an air flow of 10 L min−1, was determined on the basis of the biodegradation rate. At low air flows, a high biodegradation rate resulted in being a good parameter to indicate high energy efficiency; while, on the other hand, a high oxygen concentration resulted in being a good parameter to determine a high biodegradation rate.

Graphical Abstract

1. Introduction

In this paper, the possibility of recovering a polluted aquatic environment characterized by anoxic conditions and an elevated organic load was explored at bench scale. Therefore, the focus was on the remediation of contaminated water bodies and not the treatment of wastewater before discharge into natural water bodies. For this purpose, the best operative conditions of a bench-scale version of the module for the decontamination of units of sediment (MODUS) [1,2] were investigated. In the case of remarkable organic load, a high oxygen concentration alone is apparently not sufficient to allow the self-depuration of a real water body. For this reason, the present experimental apparatus was equipped with a bioreactor able to operate the organic load abatement. For this purpose, in the bioreactor there are microorganisms that are present on the biofilm which adheres to the inert support (expanded clay spheres). The apparatus will be referred from now on to as the BIOmini-MODUS, which, therefore, is substantially made by two main parts: the air-lift and the bioreactor.
To simplify the study, the “pollution” was obtained by adding to the tap water medium glucose, urea, and potassium acid phosphate in order to recreate the most realistic synthetic “effluent”. The kind of pollution the apparatus is intended to eliminate is BOD. For experimental convenience in the laboratory simulation, the BIOmini-MODUS operates as a closed circuit, i.e., the effluent enters the aeration reactor where a stone sparger [3] produces the desired bubbling which works both as a pump and as oxygenator as well. After that, the effluent passes through the bioreactor and then comes back to the aeration reactor.
When designing the scaling up of the bench-scale apparatus to the real full-scale one, the operative conditions are crucial to explore those encountered in reality [4,5]. The aim of the present study was to determine the performance of the BIOmini-MODUS novel technology in terms of its ability to biodegrade a synthetic effluent in the shortest time employing the least amount of energy. This because it is desirable that the effluent exiting the apparatus should be sufficiently oxygenated and at least partially depurated in a reasonable lapse of time using the least possible amount of energy. The novelty of this work is the proposal of an experimental method able to establish the appropriate experimental conditions to obtain the best performance of the bioreactor/air-lift system. This was accomplished by changing systematically the only independent variable which was under control, i.e., the air flow in the sparger, while monitoring all the other dependent variables. Particularly, the biodegradation velocity and the oxygen concentration at the apparatus exit, in conjunction, especially, with the energy efficiency. This last variable was determined on the basis of the biodegradation rate. At low air flows, high biodegradation rate resulted in being a good parameter to indicate high energy efficiency while, on the other hand, a high oxygen concentration resulted in being a good parameter to determine a high biodegradation rate. Above a certain critical air flow oxygen concentration at the apparatus exit did not increase significantly any more while energy costs became prohibitive. With the actual apparatus geometry, this optimum air flow that maximizes the energy efficiency corresponded to 10 L min−1.

2. Materials and Methods

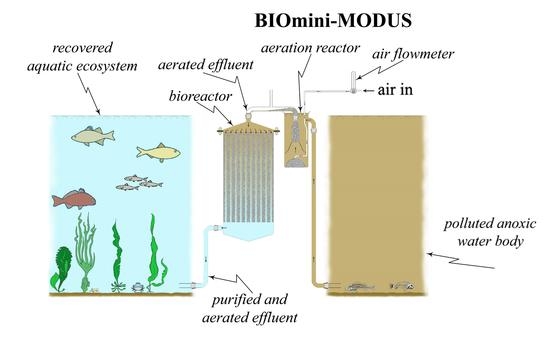
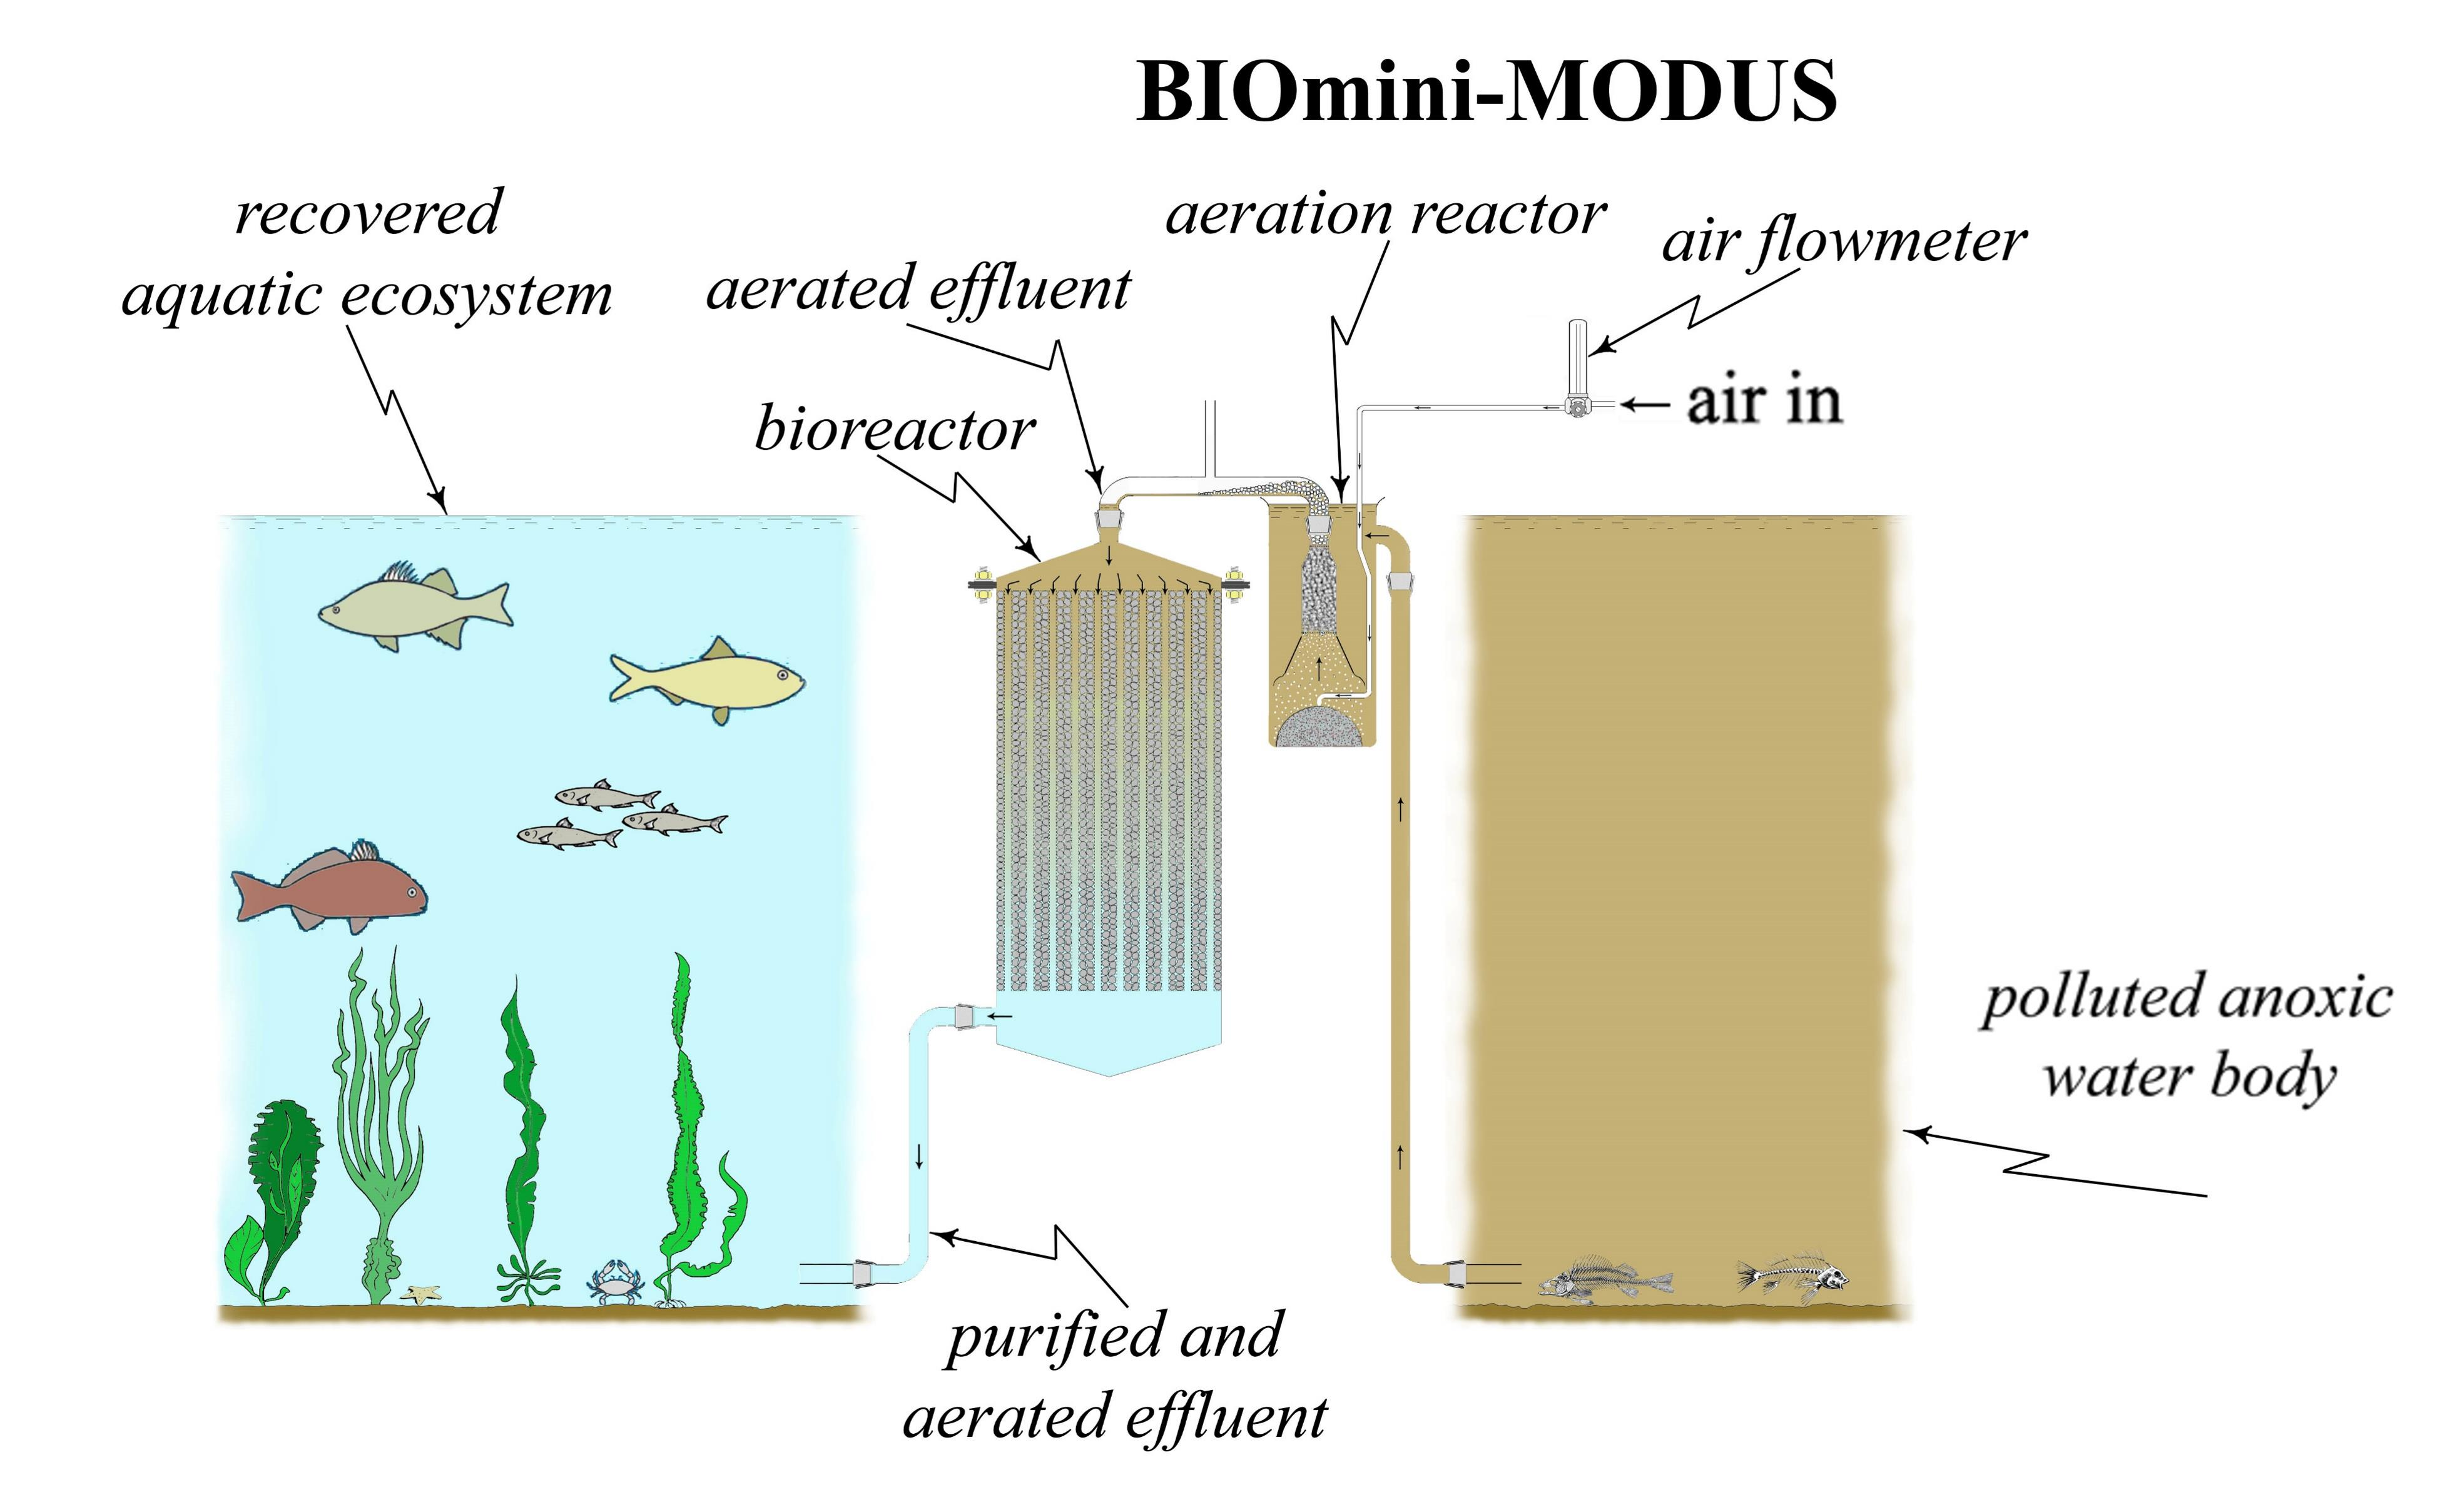
2.1. Apparatus Overview

The schematic view (not to scale) of the experimental BIOmini-MODUS apparatus is shown in Figure 1 (see Supplementary Material).
Sections I (active volume = 2.5 L), II (active volume = 17 L), and III (active volume = 5.3 L) are hydraulically connected between them, while section IV is isolated from the others. In more detail: (1) thermostatic fluid circuit, (2) insulated tank (darkroom) containing the biodegradation experimental apparatus and the thermostatic fluid, (3) insulated lid (light-tight), (4) degassing UV-C lamp chimney, (5) alimentation cable and data cable of effluent flowmeter, (6) UV-C lamp (55 W), (7) effluent flowmeter, (8) BOD sampling pipe, (9) microbial load sampling pipe, (10) sedimentation tank collector hopper for scraped biofilm, (11) thermometer, (12) pH meter, (13) UV-C lamp alimentation cable, (14) discharge pipe of the sedimentation tank hopper, (15) oximeters, (16) sedimentation tank, (17) bioreactor collector hopper for scraped biofilm, (18) grids containing bioreactor expanded clay spheres, (19) discharge pipe of the bioreactor hopper, (20) bioreactor cleaning-maintenance flanges, (21) bioreactor, (22) air-lift degassing chamber chimney, (23) air flowmeter, (24) degassing chamber and air-lift foam, (25) aeration reactor or air-lift reactor, (26) “bread” air stone sparger, (27) air-lift reactor tank, (28) thermostatic fluid entrance, (29) thermostatic fluid exit, (30) faucets, (31) effluent recycling pipe, (32) centrifugal pump alimentation cable, (33) centrifugal pump, (34) butterfly valve, (35) sedimentation tank lid, (36) air-lift tank lid, (37) pressure gauge.

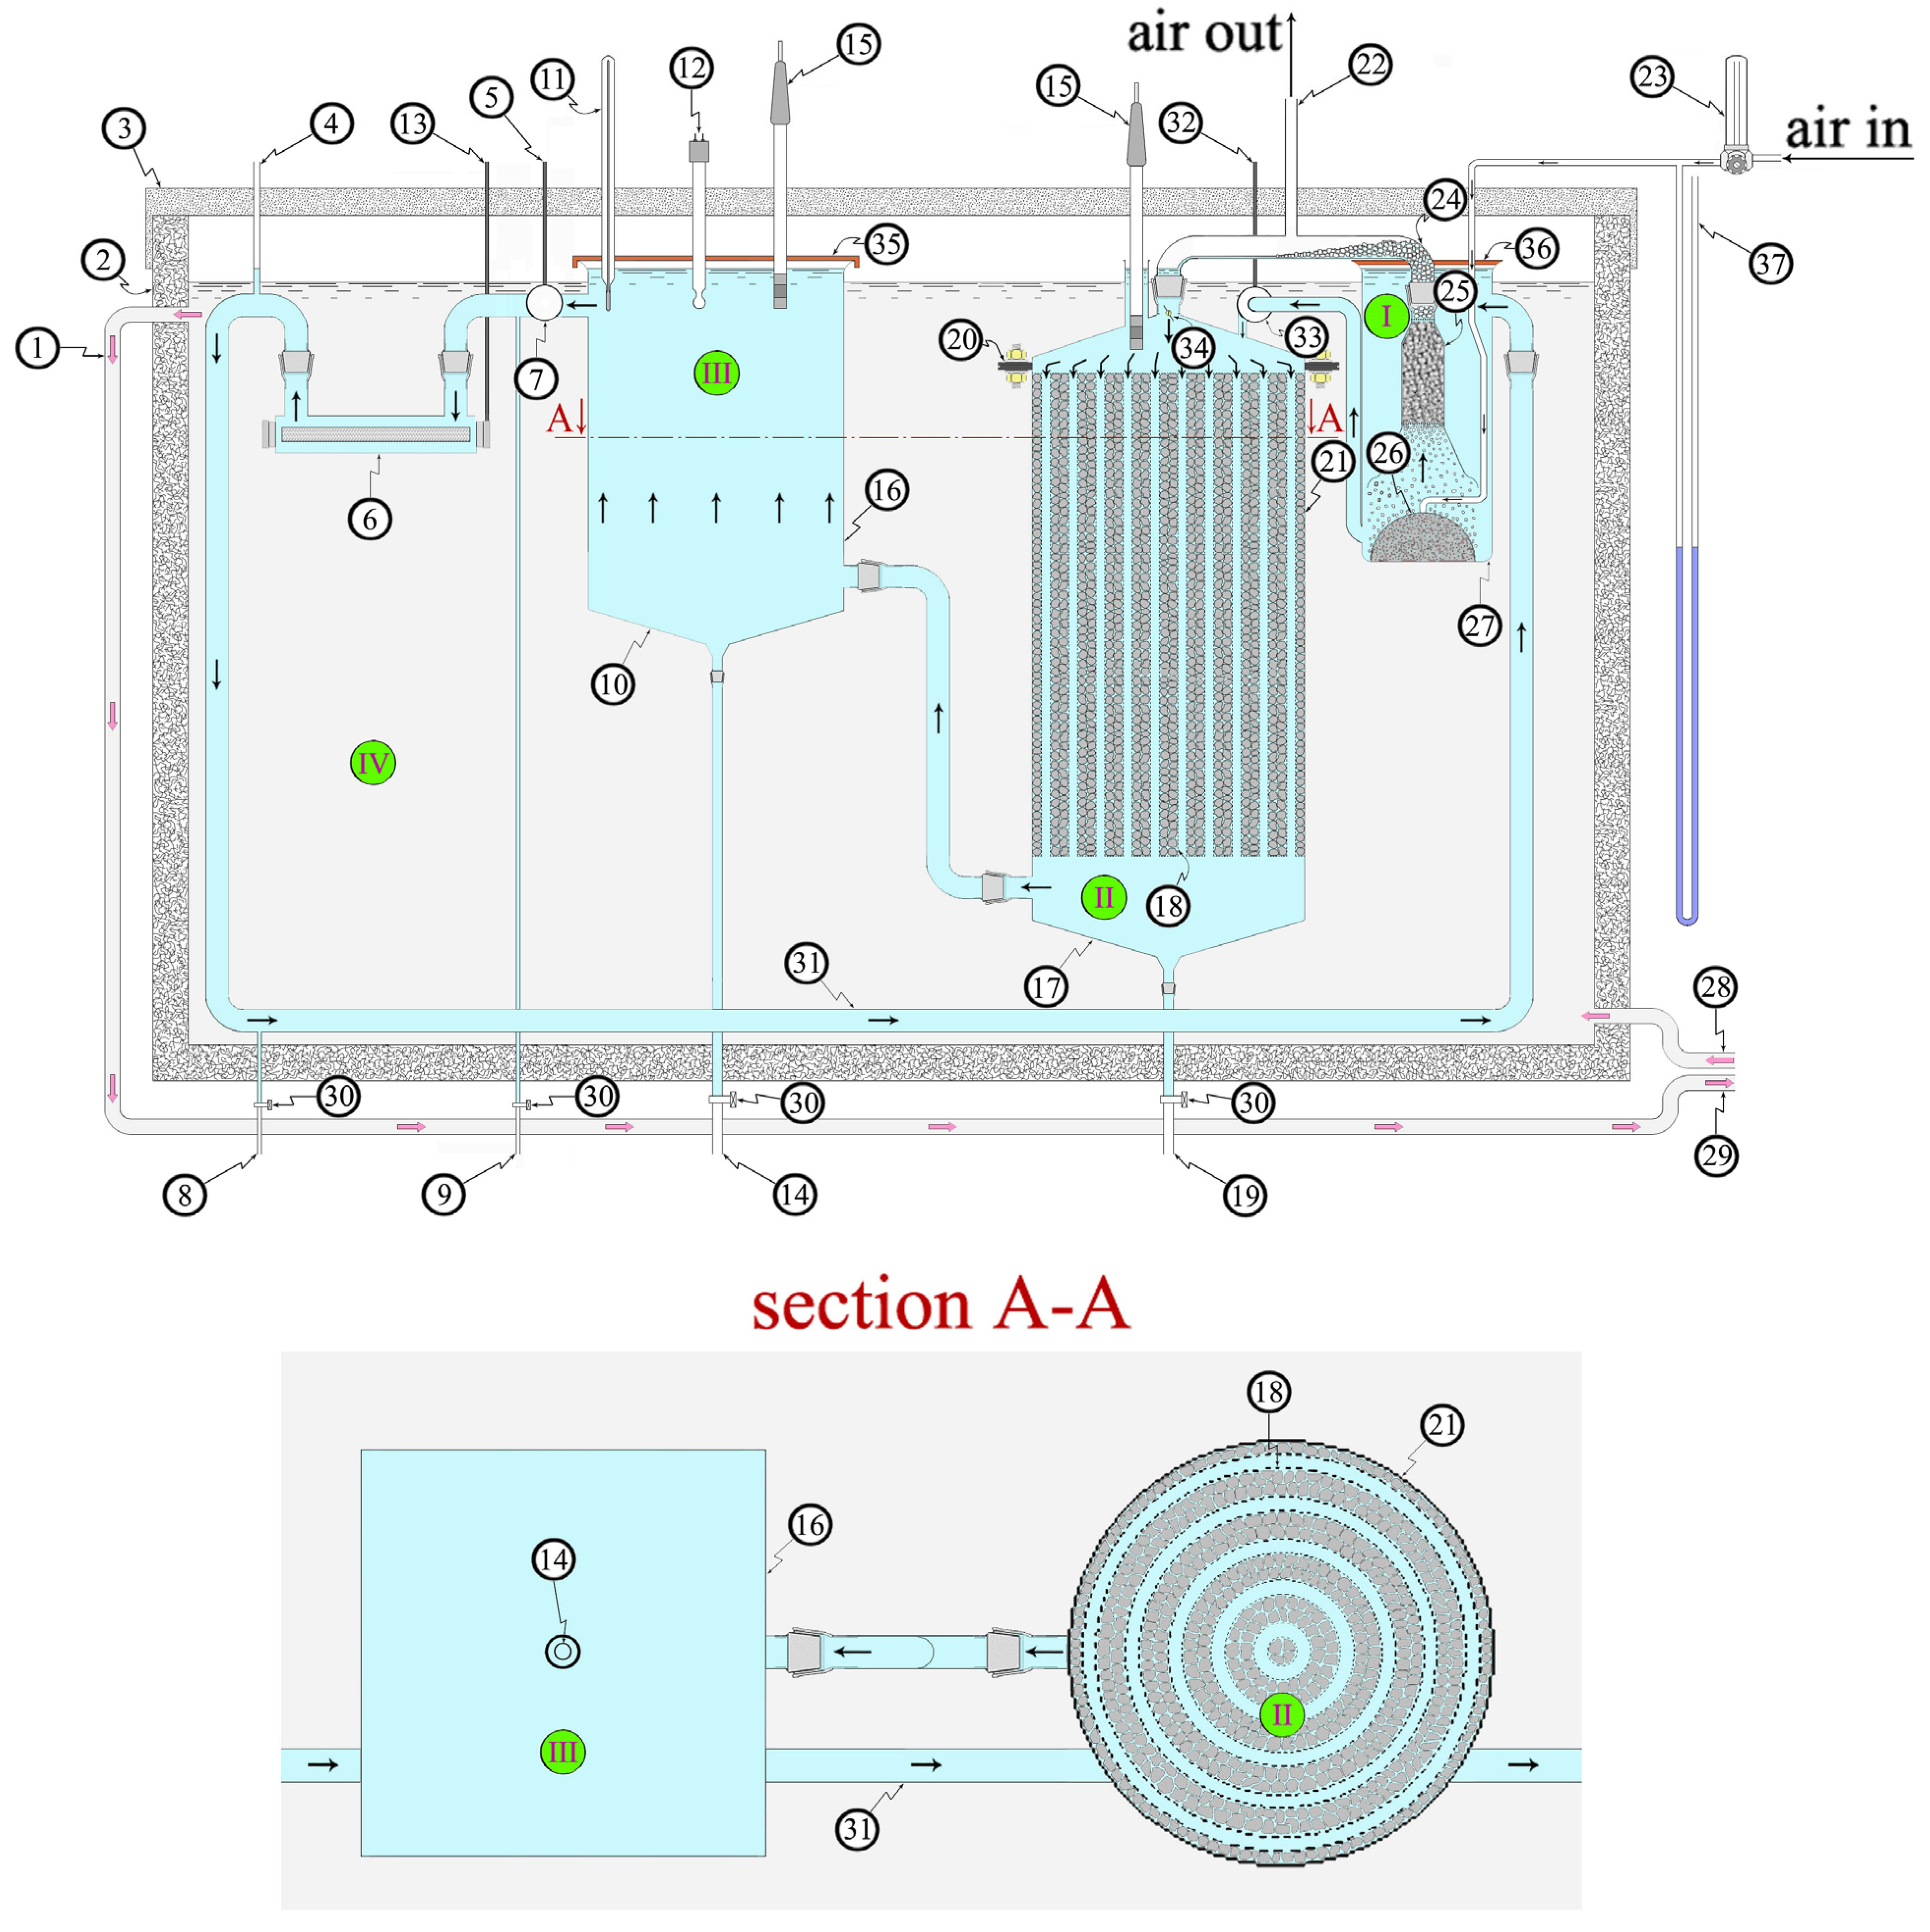
2.2. Equipment Description

The BIOmini-MODUS was thermostatic at 20 °C and maintained in the dark. Light absence was necessary in order to avoid eventual experimental artifacts due to algae formation and proliferation, especially on the equipment walls. Their presence outside the bioreactor could invalidate the experimental results which, instead, would be directed to monitor bioreactor activity only.
The experimental apparatus is principally made by two main parts: the aeration one (i.e., the aeration reactor or air-lift reactor) and the biodegradation sector (i.e., the bioreactor). In more detail, as shown in Figure 1, the system is made of four tanks. Three of them (i.e., I, II, and III) are connected between each other by pipes, while tank IV is the external insulated tank (darkroom) containing the biodegradation experimental apparatus and the thermostatic fluid. Differently with respect to the previous paper [1], there is no sediment in any of these four tanks. The decanting tank (16) is followed by the UV-C lamp [6].

2.3. Aeration Reactor (Air-Lift)

The aeration reactor was double in height with respect to that of the previous work [1], while the sparger was substantially improved. The oxygenation reactor was filled with a bed made of glass Rashig rings measuring 8 mm in diameter and 10 mm in height. This bed was maintained in position by two grids: one at the top of the bed and the other on the bottom, as discussed in the previous paper [1].

2.4. Bioreactor

Inside the bioreactor (see also section A-A of Figure 1) there is a bed of expanded clay spheres maintained in position by the grids (18) that in Figure 1 are represented by “black thick dotted lines”, as it can also be seen in “section A-A”. The diameter of the expanded clay sphere bed measures 300 mm while its height is 540 mm. The mass of the expanded clay spheres added is 20.1 kg while their density is 950 kg m−3. The volume available for the synthetic effluent in the bioreactor is 17 L. The grids are spaced out from one another to allow an easy effluent flow and a comfortable detachment of the biofilm scrapings. This avoids the clogging of the 5 ring-like canals (vertical ducts) that are present inside the bioreactor and which are 5 mm in length. This way, biofilm scrapings can be collected by the bioreactor collector hopper (17) purged through (19) and then weighted. The internal 5 rings containing the expanded clay spheres are 25 mm thick while the most external ring is 12.5 mm.

2.5. Analytical Techniques and Equipment

The UV-C 55W lamp radiates 55.000 µWatt cm−2 s−1. The producer warrants the effluent sterilization for a maximum flow of 29 L min−1 when the turbidity is kept below 20 NTU. Dissolved oxygen concentrations were determined by a Vernier Dissolved Oxygen Probe whose accuracy was checked by Winkler standard method [7] several times during a single experiment. The utilized model SC100-A10 thermostatic unit allows a thermostatic fluid flow of 17 L min−1 and a cooling power of 240W at 20 °C, and keeps the temperature within the ±0.02 °C range. TOC concentrations were determined by a SHIMADZU TOC-5050A TOTAL ORGANIC ANALYZER (Shimatzu; Milan, Italy) equipped with the TNM-1 unit.

2.6. Biofilm Formation

Biofilm formation takes place as a result of the effluent-support contact. A rough and porous support is highly desirable so that the biomass can correctly adhere to the support surface. For this reason, the choice for the bioreactor filling fell to the expanded clay spheres.
As a first stage, the bioreactor was filled inside the grids with expanded clay spheres. Then, the BIOmini-MODUS apparatus was filled with active sludge that, in this way, got into contact with the expanded clay spheres. The sludge, which came from the aeration tank of the municipal wastewater treatment plant of Treviso city (Italy), was already in the logarithmic phase. In order to allow biofilm formation on the surface of the expanded clay spheres, the correct experimental conditions (nutrient concentration and abundant oxygen) were set. Once the biofilm was formed within 24 h, the biofilm was subsequently acclimatized for a month to the synthetic effluent. Again, ideal conditions (abundant oxygen and nutrients) were supplied to the biofilm in order to obtain the development of heterotrophic mass. The nutrient mixture, which was dissolved in tap water, had the following composition: glucose, urea, and potassium monoacid phosphate. The conventional ratios between these nutrients were respected so that the concentrations were such that BOD:N:P = 100:5:1 [8]. This mixture was able to supply the essential elements needed for biomass growth. As far as the micro- and meso-elements such as Fe, Mg, Ca, etc., the quantities already present in the tap water were deemed sufficient to warrant biomass growth.

2.7. Experimental Conditions

In order to identify which is the best air flow for our BIOmini-MODUS, 7 series of experiments were performed, precisely using an air flow of 5, 7.5, 10, 12.5, 15, 17.5, and 20 L min−1, to determine eight parameters which were deemed to be the most important for the present study: (1) dissolved oxygen concentration as a function of the air flow and, for a selected set of experimental conditions, as a function of time; (2) time required to complete the substrate biodegradation; (3) air pressure (head losses) needed to obtain the desired air flow; (4) power needed to pump the air; (5) total energy required to complete the substrate biodegradation; (6) apparatus biodegradation efficiency defined as the quantity of substrate biodegraded when an energy unit is spent; (7) BOD as a function of time during a selected biodegradation experiment; and (8) the maximum biodegradation velocity reached by each biodegradation experiment. For each air flow, the biodegradation experiments were repeated five times (in the same experimental conditions) to calculate the average value along with the standard deviation (i.e., error bars present in the figures) of all the measured parameters. Before the start of each series of experiments (i.e., a new value of air flow) the bioreactor was reloaded and then re-acclimatized for one month in the same experimental conditions adopted at the beginning of the study. The biofilm formation, acclimatization, as well as a blank experiment and the biofilm respirometric measurements took place once at the start of each series of experiments. At the end of the acclimatization month a blank experiment was run using tap water as “effluent” in order to measure the amount of the detachments from the biofilm scrapings (see collector hoppers (10) and (17) for scraped biofilm, as well as discharge pipes (14) and (19) in Figure 1). Then, because the biofilm utilizes oxygen even in the absence of nutrients, it was necessary to measure the amount of such oxygen consumption (after the blank experiment just discussed). In order to determine this biofilm oxygen consumption, a respirometric test was performed according to [9,10]. Finally, the synthetic effluent was loaded and the biodegradation experiments could take place. For both “BOD vs. time” and “dissolved oxygen vs. time” experiments, during the time interval of 0–6 h sampling was performed each ½ h while for the time interval of 6–27 h sampling was done each 1 h.
In the course of each experiment the following parameters were measured: the dissolved oxygen concentration levels in the effluent by (15), the effluents pH in (12), the effluent temperature in (11), air flow by (23), the water/effluent flow by (7), the air pressure by (37), the BOD, and the turbidity. The measurement of the air pressure was necessary to calculate the power utilized during the biodegradation experiment; the calculation was performed by Perry’s formula [11] as shown in Equation (1):
N = 2.72 × 10⁻⁵ × Qair × p
where N is measured in kW, Qair is the air flow expressed in m3 h−1, and the air pressure p in cm of water column (cm WC, measurement error of ±1 cm WC).
The total volume of the synthetic effluent (apparatus capacity determined experimentally) is 34 L. Its chemical–physical characteristics are as follows: temperature 20 °C, pH 6.9–7.2. At the end of each experiment, the two scraped biofilm collector hoppers of II and III were unloaded and the scraped biofilm collected was weighted. The whole apparatus was then rinsed with tap water.

2.8. Biofilm Biomass Measurement

Once the biofilm formation had taken place inside the bioreactor, prior to any new series of experiments (i.e., a new value of air flow), the quantity of biomass covering the expanded clay spheres was determined, though only indicatively. The biomass of a single expanded clay sphere (average diameter 10 mm) was dissolved in 15 mL of H2SO4 conc. and on this aliquot a COD measurement was done. This COD value allowed for calculating the biomass quantity by Equation (2), which is a relationship that expresses the volatile suspended solids (VSS) as a function of COD(measured in g) [12]:
VSS = 1.48 × COD
where VSS (expressed in g) is indeed the value of the biomass (wet weight) [12].

2.9. Respirometric Tests

In the present paper, the definition of the endogenous respiration of biomass proposed by [9] as “the auto-oxidation of cell material not related to substrate from the wastewater” has been adopted. According to [9], it was possible to calculate the rate of oxygen consumption of the bioreactor biofilm, expressed in mg (O2) L−1 min−1, utilizing tap water in place of the effluent normally used during the biodegradation experiments. This value is essential because it must be taken into account when considering the overall oxygen consumption budget, i.e., biodegradation and respiration (see Section 3.4).

2.10. Organic Matter Measurements

In the case of the present study, the chemical oxygen demand (COD) has the same numerical value of BOD (as experimentally verified by measuring COD and BOD separately) because of the complete biodegradability of the substances used. The BOD values, obtained from the COD ones, reported in the present paper were calculated from the calibration curve obtained from standard solutions of known COD prepared with a mixture of glucose, urea, and potassium monoacid phosphate and then analyzed by TOC. It was thus necessary to measure the COD by the Hach method involving the colorimetric determination of COD (in the interval 0–1500 mg (O2) L−1) using the Hach DR/2000 spectrophotometer at 620 nm and a digesting solution at 150 °C.
The TOC instrument was calibrated periodically using 2 standard solutions prepared at different concentrations of (1) anhydrous potassium hydrogen phthalate (C8H5KO4) for the total carbon (TC) calibration, and (2) a mixture of anhydrous sodium bicarbonate and anhydrous sodium carbonate (NaHCO3/Na2CO3) for the inorganic carbon (IC) calibration according to [13]’s method.
The urea analysis was performed by the TOC analyzer equipped with the TNM-1 unit according to [14,15,16,17,18] which allowed for determination of the total nitrogen (TN) in chlorinated solutions of urea samples.
The quantity of glucose introduced as BOD according to the required stoichiometry, was calculated according to the Baker equation (Equations (3) and (4)) for COD [19], that is
CnHmOeXkNjSiPh + b O2
n CO2 + [(mk − 3j − 2i − 3h)/2] H2O + k HX + j NH3 + i H2SO4 + h H3PO4
from which can be derived
b = n + (mk − 3j − 2i − 3h)/4 − e/2 +2i +2h
where b represents, see Equation (4), the oxygen quantity required to oxidize the substrate, i.e., the COD.
In the plot of the measured TOC (mg L−1) in the ordinate vs. COD = BOD in the abscissa (mg L−1), determined from standard solutions of known COD, the experimental data lay on a straight line whose equation is as follows:
TOC = 0.3511 × COD − 0.0559
The plot of Equation (5) showed a very high correlation (R ≈ 1).

2.11. Synthetic Effluent Composition

At the beginning of each biodegradation experiment, C and N effluent composition was such that the conventional concentration ratios between the introduced chemical specimens [8] BOD:N:P = 100:5:1 was fully respected. So, in the apparatus were loaded: BOD = 300 mg (O2) L−1 of glucose (corresponding to 0.282 g L−1 of glucose) and BOD = 9 mg (O2) L−1 of urea (corresponding to 32 mg L−1 of urea). This means that the total initial BOD was 309 mg (O2) L−1. This represents the actual BOD that was introduced into the BIOmini-MODUS as biodegradable substrate and not the BOD that would be initially measured experimentally (see Section 3.1 for a deeper discussion). For the sake of completeness, it was decided to start with a BOD = 300 mg (O2) L−1 of glucose as this value corresponded to that of a case study of a real water body presenting “typical pollution” [20] our research group examined in the past. On the other hand, [21] reports that BOD5 = 300 mg (O2) L−1 is a typical value for polluted water bodies.

2.12. Sample Filtration and Checking the Absence of Biological Activity Outside the Bioreactor

Each effluent aliquot sampled from (8) was divided in two portions: the first one was microfiltered [22,23] and analyzed for BOD, while the second (unfiltered) was aerated for 1 h (to supply oxygen to the eventually present alive microorganisms) and then microfiltered and analyzed for BOD. It was expected that BOD of the second portion did not decay with time because of biodegradation caused by live microorganisms floating in the effluent sample. This test allowed for verifying the absence of biodegradation taking place outside the bioreactor, and therefore, the efficiency of the UV-C lamp sterilization [24,25,26]. This is due to the goal of the present study, which was to determine the performance of the bioreactor alone, i.e., without any contribution of biological active material external to the bioreactor.

2.13. Calculation of the Energy Consumption and the Apparatus Efficiency

The energy consumption can be calculated by Equation (6):
E = N × t
where N is the power employed by the apparatus as a function of the air flow and t is the time require to complete the biodegradation experiment.
The efficiency ƞ is defined in this paper as the total energy Etot necessary to biodegrade a certain amount of substrate, measured as ΔBOD. It is calculated as shown in Equation (7):
η = ΔBODtot/Etot
where ΔBODtot represents the “substrate drop”, i.e., the difference between the initial value of the BOD and the final one.

3. Results and Discussion

3.1. Biodegradation Experiments

Compared to the previous work [1] the aeration reactor improvements allowed obtaining, for example in the case of an air flow of 10 L min−1, 94% of oxygen saturation at the air-lift exit. Because at a temperature of 20 °C oxygen saturation is 9.2 mg (O2) L−1, this means that at the air-lift exit the oxygen concentration of the effluent is 8.65 mg (O2) L−1. At the end of each experiment the scraped biofilm, whose biomass is made by 90% of water, was weighed. On average, for each experiment such scraped biofilm biomass weighed 47.9 g. During the experiments, the effluent turbidity NTU at the exit of the decanting tank was 15 NTU, while the maximum effluent flow was 8.8 L min−1 (for an air flow of 20 L min−1).
The “theoretical” BOD initial value (presented in the Section 2) of 309 mg (O2) L−1, is different with respect to that experimentally measured at the beginning of each biodegradation experiment. Without microfiltering the sample, the initial BOD was 376 mg (O2) L−1, while after microfiltration the BOD was 314 mg (O2) L−1. In addition to the theoretical BOD (309 mg (O2) L−1) due to glucose and urea, there is also the BOD originated by the presence of Soluble Microbial Products (SMP) [27,28]. These last ones are “a pool of organic compounds that are released into solution from metabolism and biomass decay” [29], which normally slip from the bioreactor biofilm. They do not precipitate in the collector hoppers (10) and (17) for scraped biofilm. Vice versa, they are sufficiently small to keep floating in the effluent. Therefore, when sampling in (8) the sampled synthetic effluent will contain SMP also. Actually, after microfiltration the real BOD initial value is 314 mg (O2) L−1 due to the SMP residual presence. In fact, SMP can be partially reduced by microfiltration. During the study, it was found experimentally that microfiltration eliminates 92% of the BOD presumably because of the SMP (BODSMP). Without microfiltration, BODSMP = 67 mg (O2) L−1. After microfiltration, the BOD due to the residual presence of SMP was 5.4 mg (O2) L−1. Experimentally, after sample microfiltration such residual BOD was summed up with the “theoretical” BOD initial value of 309 mg (O2) L−1, affording the measured BOD initial value of 314 mg (O2) L−1.
The final BOD experimentally measured at the very end of each biodegradation experiment after microfiltration would be due only to the SMP. This is because a part of both the glucose and the urea would have been totally biodegraded and the rest absorbed by the biofilm present in the bioreactor. Therefore, at the end, all the experiments reached a final BOD value of 5.4 mg (O2) L−1, and this value was selected to indicate the end of the biodegradation experiment. Thus, during each biodegradation experiment the measured BOD showed the following decay: 314 mg (O2) L−1–5.4 mg (O2) L−1, independently from the adopted air flow.

3.2. Initial Dissolved Oxygen, Biodegradation Time, and Air Pressure as a Function of the Air Flow

As displayed in Figure 2 (black line), at the beginning of each biodegradation experiment in correspondence to the air-lift exit (i.e., bioreactor entrance) the dissolved oxygen concentration measured by the oximeter (15) placed on the head of the bioreactor resulted in being a function of the air flow read by the flowmeter (23).
In Figure 2 (black line) the presence of a sharp bend (system saturation) corresponding to an air flow of 10 L min−1 is most probably a function of the apparatus geometry. Presumably, its explanation is fairly simple: for low values of air flow (0–5 L min−1), when the air flow is increased, the effluent flow [1] increases linearly until the air flow reaches 5 L min−1. Beyond this value, the effluent flow approaches a plateau [1]. This means that a further increase of air flow would not produce a similar increase in the effluent flow. Doubling the air flow from 5 to 10 L min−1 produces an increase of the effluent flow of about 1 L min−1 only [1]. When increasing the air flow inside the interval 5–10 L min−1, the effluent will get into contact with more and more air. Consequently, the effluent will be more oxygenated and dissolved oxygen concentration reaches values very close to the saturation one.
If all variables are kept constant, a change of the air flow will affect the time required to completely biodegrade the glucose and urea substrate. The ensuing plot is reported in Figure 2 (green line). Low air flow values imply long biodegradation times, mainly because when the air flow is low then the effluent-dissolved oxygen concentration is low, see Figure 2 (black line).Consequently, microorganisms are oxygen deprived, so biological reactions take place at a lower rate, i.e., there is oxygen diffusion limitation to the bioconversion of organic substrate.
The presence of a sharp bend in correspondence of the air flow of 10 L min−1 is interesting, and may corroborate the central role of this value in determining the optimal working condition for the BIOmini-MODUS. For this apparatus’ geometry, it seems that an air flow of 10 L min−1 represents a sort of watershed between long (>24h) biodegradation times strongly dependent on the air flow value and short (≈24 h) ones which are practically independent of the air flow value. No significant reduction of the biodegradation time can be observed by increasing the air flow beyond 10 L min−1.
As shown in Figure 2 (purple line), high values of the air flow require high values of air pressure, and this last factor increases with the square of the air flow.

3.3. Power, Total Energy, and Efficiency as a Function of the Air Flow

Figure 3 (black line) reports the power(needed to pump the air during each biodegradation experiment) as a function of the air flow. The power was calculated according to Perry’s formula [11] where the air pressure can be obtained from Figure 2 (purple line).
It is possible to obtain Figure 3 (green line), remembering that the energy can be calculated by Equation (6). The power is that reported in Figure 3 (black line), while t is the time required to complete the biodegradation, which is a function of the air flow as displayed in Figure 2 (green line).
It can be clearly seen the absolute minimum of energy for the air flow of 10 L min−1. This minimum, for the apparatus geometry, corresponds to the best compromise conjugating a low power on one hand, which occurs for low air flow (see Figure 3 (black line) for an air flow equal or less than 10 L min−1), and a short t on the other hand (see Figure 2 (green line) for an air flow equal or greater than 10 L min−1. It is not surprising, therefore, that the air flow of 10 L min−1 plays a pivotal role in the biodegradation experiments of the present work.
Only a small difference exists between an air flow of 10 L min−1 and 20 L min−1 when looking at (a) dissolved oxygen measured by the oximeter (15) on the top of bioreactor at the beginning of each biodegradation experiment (see Figure 2 (black line)) and (b) time required to fulfill the complete substrate biodegradation (see Figure 2 (green line)). Vice versa, as it can be seen in Figure 3 (green line), a considerable difference can be observed between these two air flows when dealing with energy costs: an air flow of 20 L min−1 implies about 0.27 kWh of energy spent to achieve the complete biodegradation, which is approximately 3 times that corresponding to an air flow of 10 L min−1 (about 0.09 kWh). It is remarkable that the energy spent for the air flow of 20 L min−1 is 3 times that corresponding to 10 L min−1 and not double, as doubling the air flow (10–20L min−1) would seem to suggest. This is because the head losses (see Figure 2 (purple line)) increase with the square of the flow. Therefore, the power(see Figure 3 (black line)) will be increased due to both the air flow increase and the increase of the head losses (from Perry’s formula it results that the power is proportional to the product “air flow × head losses”). The energy costs consequently suggest that the best working condition is for an air flow of 10 L min−1 once again.
The efficiency ƞ was calculated as shown in Equation (7). The total energy spent during the biodegradation experiment can be read in Figure 3 (green line) and is a function of the air flow. Consequently, as shown in Figure 3 (purple line), the efficiency will be a function of the air flow as well.
Figure 3 (purple line) shows that for and air flow of 10 L min−1, the efficiency reaches a maximum corresponding to 3404 mg (O2) L−1 kWh−1 which represents the maximum amount of ΔBOD that can be biodegraded by the apparatus when spending 1 kWh. Because the substrate drop is almost always the same for all the experiments (within the experimental errors), it is expected that in Figure 3 green and purple lines should approximately mirror each other.
The presence of an efficiency maximum corresponding to an air flow of 10 L min−1 is not surprising. The efficiency steep decrease observed in Figure 3 (purple line) for an air flow greater than 10 L min−1 suggests that an air flow increase would disproportionately raise energy costs. It appears more convenient to maintain a relatively low air flow (i.e., 10 L min−1) and increase the number of times the effluent passes through the air-lift (and therefore the bioreactor). On the other hand, as shown in Figure 2 (green line), a decrease in the air flow from 15 L min−1 to 10 L min−1 results in an irrelevant increase of the biodegradation time, while the power (Figure 3 (black line)) and the energy (Figure 3 (green line)) drop by a more conspicuous amount. This result seems to be counterintuitive as it would be logical to think that in order to aerate a water body, the air flow should be pushed up as much as possible. However, in the case of the BIOmini-MODUS this does not happen beyond the air flow of 10 L min−1 (see Figure 2 (black line)). One more important variable to determine the energy is the biodegradation time: for example, when the air flow decreases from 10 L min−1 to 5 L min−1, the increase in the biodegradation time (see Figure 2 (green line)) is so remarkable that despite the decrease in power (see Figure 3 (black line)) the ensuing energy increases and therefore the efficiency diminishes.

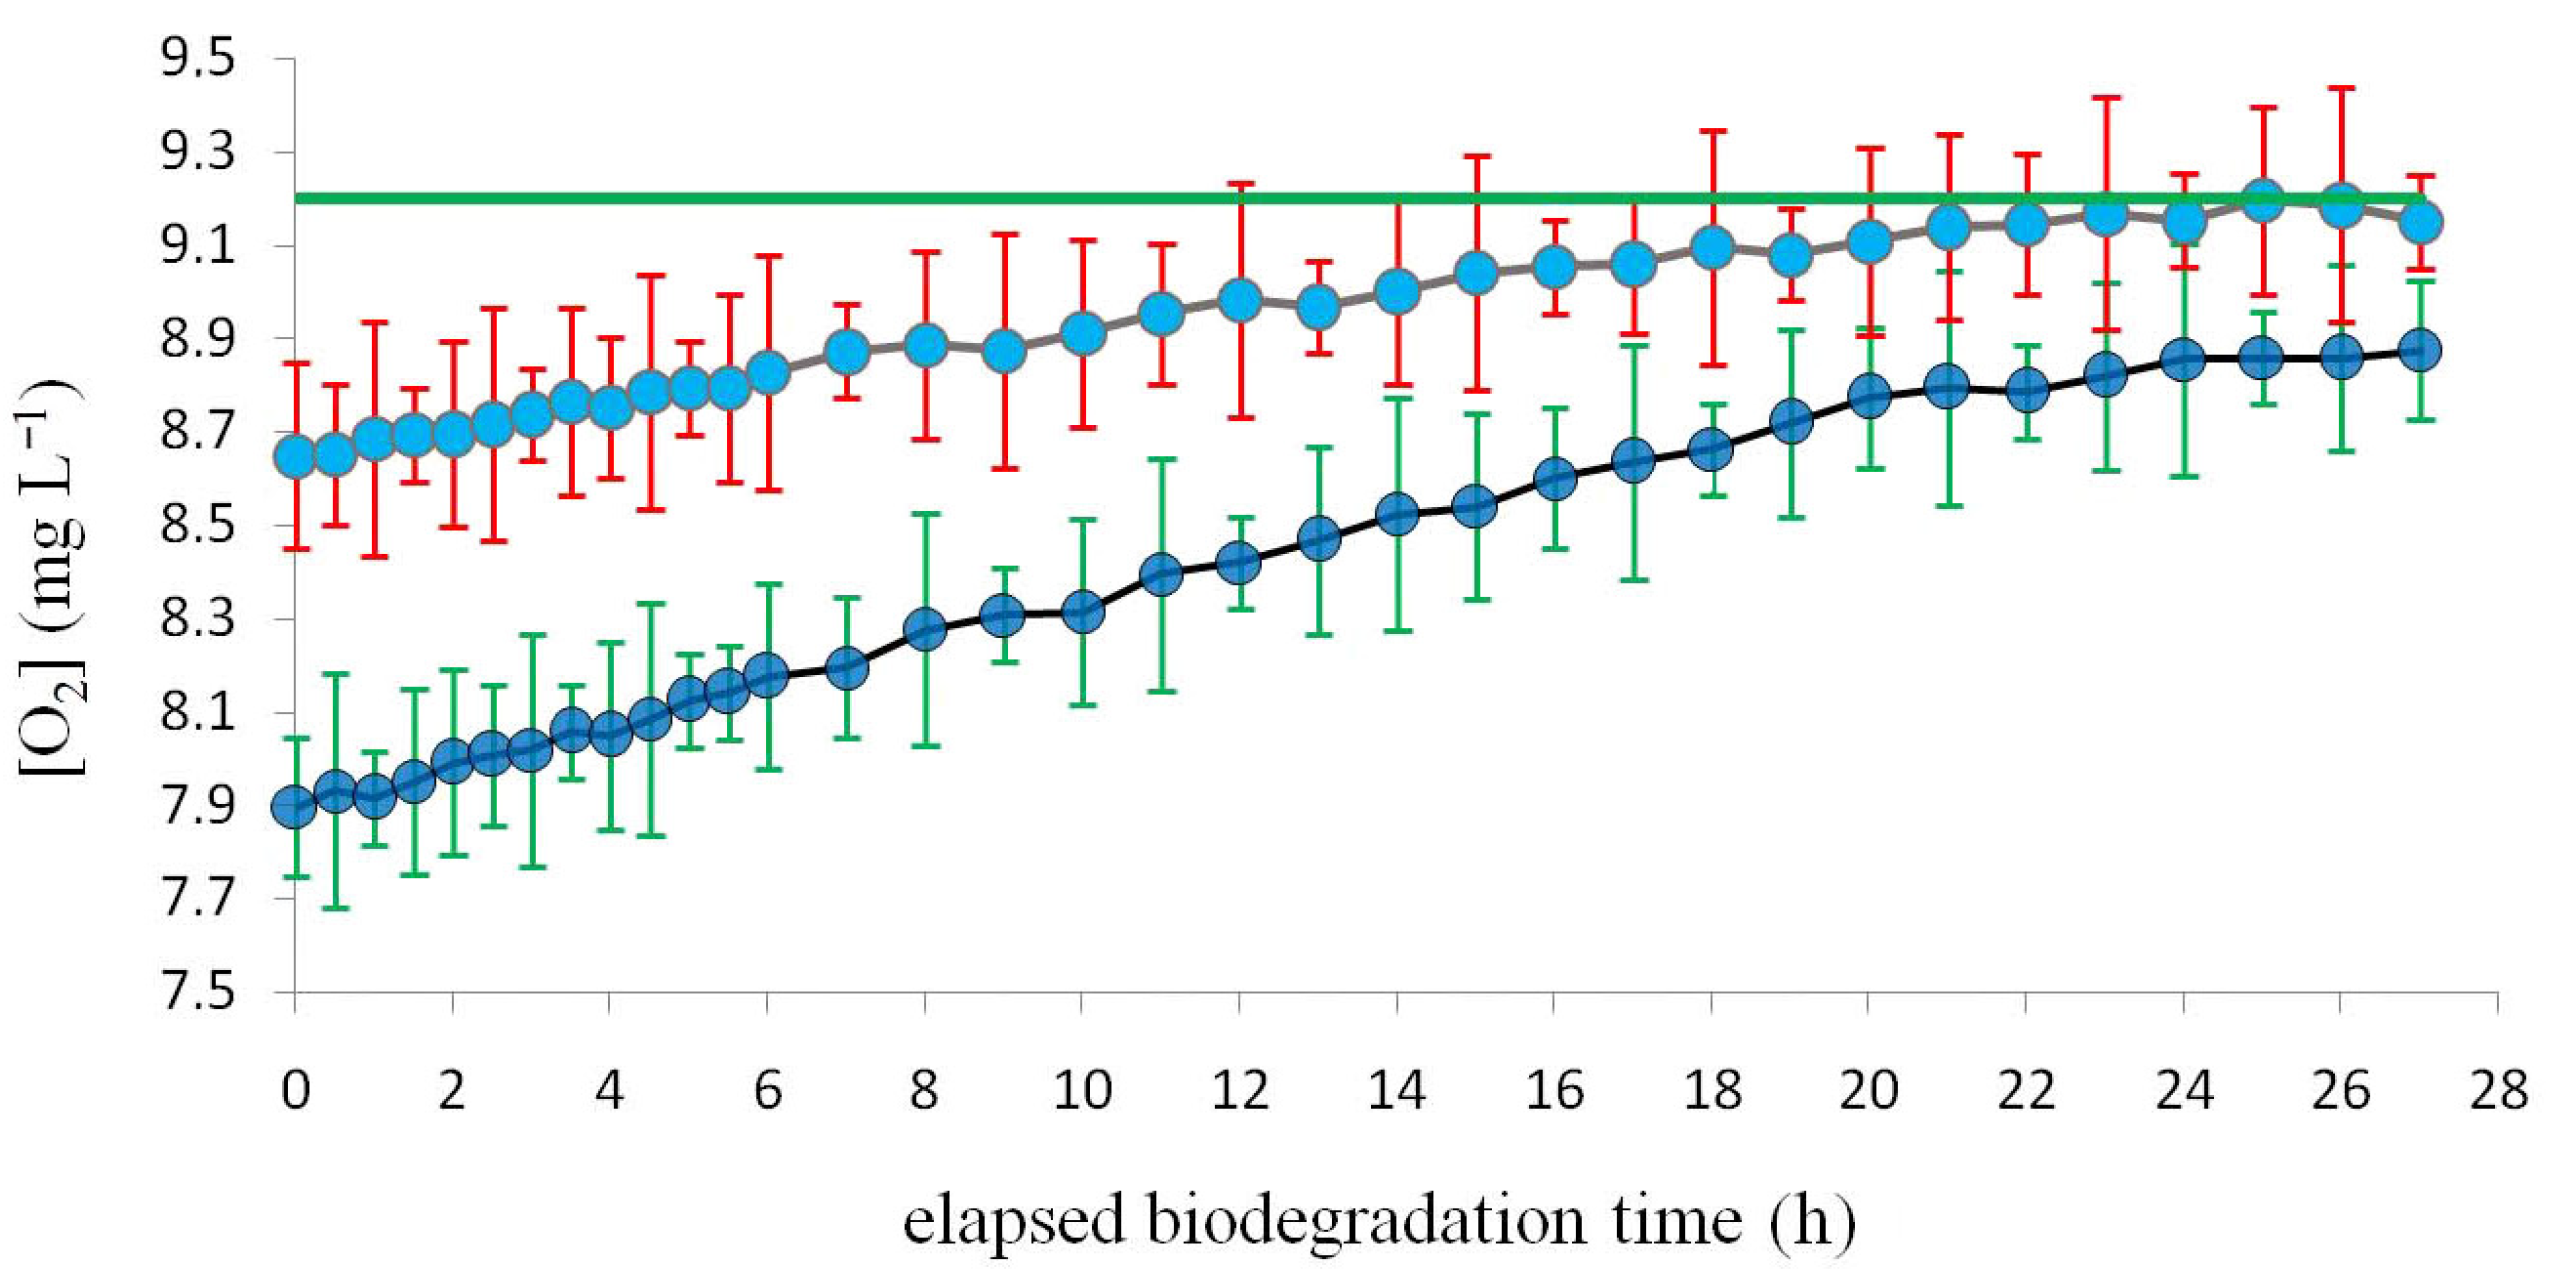
3.4. Dissolved Oxygen Concentration and BOD during a Selected Biodegradation Experiment

Because the pivotal role played by the air flow of 10 L min−1 which is optimal for the actual apparatus geometry, here below are reported two plots concerning the trend of the dissolved oxygen concentration (Figure 4) and BOD (Figure 5) during the biodegradation experiments when the air flow was 10 L min−1. For this air flow, the results indicate that the aeration reactor delivered 1.8 mg (O2) L−1 to the effluent each time the effluent passed through it. When the effluent passed through the bioreactor, a part of this oxygen was used both for substrate biodegradation and for biomass respiration. The remaining oxygen exited the bioreactor. In this contest, according to what was described in the Section 2, it was calculated that the biomass present in the bioreactor was 84 g of VSS. The experiments showed that such biomass consumes 5 mg (O2) L−1 h−1. In other words, experimentally 0.7 mg (O2) L−1 was used by the bioreactor for the biodegradation and respiration altogether each time the effluent passed through the bioreactor.
As depicted in Figure 4, during each biodegradation experiment both oximeters (15) were monitored: the one placed in the sedimentation tank (16) measured the oxygen concentration at the bioreactor exit, while the other oximeter placed on the top of the bioreactor (21) measured the oxygen concentration at the aerator exit. The upper horizontal green straight line represents the asymptotic saturation oxygen concentration value. At the end of the biodegradation experiment the difference between the two lines, the top brown and the bottom black, resulted in being about 0.3 mg (O2) L−1. This difference is presumably due to the respiration of the biofilm present in the bioreactor. The other graphics (not reported in this paper) corresponding to air flows of 5, 7.5, 12.5, 15, 17.5, and 20 L min−1 are quite similar to that reported here below relative to an air flow of 10 L min−1.
Figure 5 shows the BOD vs. time plot when the air flow is 10 L min−1. At the beginning, at the intersection of the curve with the ordinate axis, the tangent linear relationship (y = mx + q) displays the highest slope “m”, i.e., the “m” takes the maximum negative value. The absolute value of this maximum angular coefficient represents the maximum rate of BOD biodegradation, i.e., the maximum biodegradation velocity vmax. In Figure 5, therecan be easily measured a maximum biodegradation velocity of 15 mg (O2) L−1 h−1 (which is the maximum slope of the BOD curve). Because of the chemical simplicity of the substrate to be biodegraded (glucose and urea), according to the theory [21], the experimental curve of Figure 5 clearly shows a Monod behavior [30].The Monod constant Ks, which can be easily deduced from Figure 5, takes the value of Ks = 11 mg (O2) L−1. It is assumed that the total microbial biomass is constant during each experiment because the formation of new biofilm is compensated by the release of scraped biofilm (collected in the collector hoppers (10) and (17)). This was confirmed by biofilm biomass measurement (see Section 2.7) which showed that the microbial biomass amount is constant.
The other graphs (not reported in this paper) corresponding to air flows of 5, 7.5, 12.5, 15, 17.5, and 20 L min−1 and are quite similar to that reported below relative to the air flow of 10 L min−1.
In Figure 5, it is possible to observe that at the end of the biodegradation experiment, BOD does not reach the zero value. This is likely due to the residual presence of the SMP (after microfiltration) in the final effluent and not due to the eventual residual glucose or urea, as it is expected that both would be either totally biodegraded or absorbed by the bioreactor biofilm.
In Figure 6, the 7 maximum biodegradation velocities vmax (mg (O2) L−1 h−1), each corresponding to one of the seven selected air flow objects of the present study, are plotted against the air flow. In Figure 6, a sharp bend corresponding to an air flow of 10 L min−1 whose position and shape are, again, most probably a function of the apparatus geometry, can be seen. The presence of a sharp bend has also been noticed in Figure 2 (black and green lines), making it rather common in these results.
As already discussed in Figure 2 (black line), beyond the air flow of 10 L min−1, the dissolved oxygen does not increase appreciably anymore, which is expected to affect biodegradation speed substantially. Incidentally, looking at Figure 2 (green line) and Figure 6 together it is evident that for air flows greater than 10 L min−1, vmax and the time at which biodegradation ends, virtually do not vary. In addition, for such air flows, BOD vs. time plots are almost the same. Not surprisingly, their Monod constants Ks (data here not reported) are almost the same too. In conclusion, for these air flows, vmax, Ks, and the time at which biodegradation ends depend on the apparatus geometry only. The effects of the equipment geometry on the optimal air flow rate as well as on any other parameter that defines the working conditions cannot be calculated by any mathematical or empirical correlation. This is because, normally, all variables are mutually interdependent. This makes extrapolations and generalizations difficult or impossible. Thus, there is no shortcut for performing laboratory experiments, which will be the topic of the next study.
What is most interesting from the environmental application point of view is the dissolved oxygen concentration of the effluent, which exits the BIOmini-MODUS and that would enter into the ecosystem. Figure 4 shows that the oxygen concentration remains in the range 7.9–8.9 mg (O2) L−1, which would be very good for most fresh water aquatic life. Generally, fish require 6–7 mg (O2) L−1 [20,31].
When analyzing Figure 5, it is clear that for an air flow of 10 L min−1, 24 h are sufficient (see Figure 2 (green line)) to completely biodegrade the synthetic effluent. If these kinds of results can also be obtained for a real effluent, this would mean that this apparatus could be scaled up from the bench-scale BIOmini-MODUS to the real scale bioMODUS. A particularly interesting extension of these results, which concerned fresh water, would be a new study regarding sea water [32,33].

4. Conclusions

The air flow parameter, resulted in being particularly important to optimize the performance of the BIOmini-MODUS in terms of biodegradation velocity, oxygen concentration at the apparatus exit and, especially, energy efficiency. This last one was determined on the basis of the biodegradation rate. At low air flows, high biodegradation rate resulted in being a good parameter to indicate high energy efficiency while, on the other hand, a high oxygen concentration resulted in being a good parameter to determine a high biodegradation rate. In general, it would be expected that oxygen concentration increases with the air flow. However, the analysis of the effects of the increase of the air flow indicated that beyond a certain critical air flow, oxygen concentration does not increase significantly any more while energy costs become prohibitive. Thus, an optimum air flow value which represents the best compromise between oxygenation and costs could be identified. With the actual apparatus geometry this optimum corresponded to 10 L min−1.

Supplementary Materials

The following supporting information can be downloaded at: https://www.mdpi.com/article/10.3390/environments10020021/s1.

Author Contributions

G.P. had the original idea for the study, F.R. (Francesco Romagnoli) was responsible for data collection, A.G. was responsible data analysis, M.B. and F.R. (Franco Romano) drafted the manuscript, and F.P. and C.F. reviewed it. All authors have read and agreed to the published version of the manuscript.

Funding

This research received no external funding.

Institutional Review Board Statement

Not applicable.

Informed Consent Statement

Not applicable.

Data Availability Statement

No new data were created.

Acknowledgments

We are thankful to the Italian “Ministero degli Esteri d’Italia—Direzione Generale per la Cooperazione allo Sviluppo”—Rome (Italy) as well as to the “IUCN—International Union for the Nature Conservation”—Gland (Switzerland).

Conflicts of Interest

The authors declare no conflict of interest.

References

  1. Perin, G.; Romagnoli, F.; Perin, F.; Giacometti, A. Preliminary study on mini-Modus device designed to oxygenate bottom anoxic waters without perturbing polluted Sediments. Environments 2020, 7, 23. [Google Scholar] [CrossRef] [Green Version]
  2. Soltero, R.A.; Sexton, L.M.; Ashley, K.I.; McKee, K.O. Partial and full lift hypolimnetic aeration of medical Lake, WA to improve water quality. Water Res. 1994, 28, 2297–2308. [Google Scholar] [CrossRef]
  3. Dai, C.; Guo, J.; Liu, J.; Donga, L.; Liu, H. Experimental Study on Aeration Performance and Bubble Characteristics of Inverted Umbrella Aerator. Water 2020, 12, 2809. [Google Scholar] [CrossRef]
  4. Bekassy–Molnar, E.; Majeed, J.G.; Vatai, G. Overall volumetric oxygen transfer coefficient and optimalgeometry of airlift tube reactor. Chem. Eng. J. 1997, 68, 29–33. [Google Scholar] [CrossRef]
  5. Dudley, J. Mass transfer in bubble columns: A comparison of correlations. Water Res. 1995, 29, 1129–1138. [Google Scholar] [CrossRef]
  6. Najm, I.; Trussell, R.R. New and emerging drinking water treatment technologies. In Identifying Future Drinking Water Contaminants; National academic press: Washington, DC, USA, 2021. [Google Scholar]
  7. Parkhill, K.L.; Gulliver, J.S. Indirect measurement of oxygen solubility. Water Res. 1997, 31, 2564–2572. [Google Scholar] [CrossRef]
  8. Tchobanoglous, G.; Burton, F.L. Wastewater Engineering: Treatment, Disposal, and Reuse, 3rd ed.; McGraw-Hill: New York, NY, USA, 1991. [Google Scholar]
  9. Spanjers, H. Respirometry in Activated Sludge. Doctoral Thesis, University of Wageningen, Wageningen, The Netherlands, 1993. [Google Scholar]
  10. Spanjers, H.; Vanrolleghem, P.A. Respirometry. In Experimental Methods in Wastewater Treatment; van Loosdrecht, M.C.M., Nielsen, P.H., Lopez-Vazquez, C.M., Brdjanovic, D., Eds.; IWA Publishing: London, UK, 2016. [Google Scholar]
  11. Perry, R.H.; Green, D.W.; Maloney, J.O. Perry’s Chemical Engineers’ Handbook, 7th ed.; McGraw-Hill: New York, NY, USA, 1997. [Google Scholar]
  12. University of Cape Town; City Council of Jahannesburg; National Institute for water research of the Council for Scientific and Industrial Research (CSIR). Theory, Design and Operation of Nutrient Removal Activated Sludge Processes; Collaborative information for Water Research Commission; Water Research Commission: Pretoria, South Africa, 1984. [Google Scholar]
  13. APHA American Public Health Association. Standard Methods for the Examination of Water and Wastewater; American Public Health Association: Washington, DC, USA, 1985. [Google Scholar]
  14. De Laat, J.; Wentao, W.; Freyfer, D.A.; Dossier-Berne, F. Concentration levels of urea in swimming pool water andreactivity of chlorine with urea. Water Res. 2011, 45, 1139–1146. [Google Scholar] [CrossRef] [PubMed]
  15. Shimadzu. Application Handbook. Sum Parameter; Shimadzu Europa GmbH: Duisburg, Germany, 2015. [Google Scholar]
  16. Norris, D.P.; Parker, D.S.; Daniels, M.L.; Owens, E.L. High-Quality Trickling Filter Effluent without Tertiary Treatment. J. (Water Pollut. Control. Fed.) 1982, 54, 1087–1098. [Google Scholar]
  17. Shimadzu Application News. TN Measurement of Urea Solution; Shimadzu Europa GmbH: Duisburg, Germany, 2018. [Google Scholar]
  18. Walker, K.R.; Stojowski, L.; Clifford, R.H. Total Nitrogen Analysis: ANew Perspective on TOC. 2013. Available online: http://bcodata.whoi.edu/LaurentianGreatLakes_Chemistry/totalnit.pdf (accessed on 18 August 2022).
  19. Baker, J.R.; Milke, M.W.; Mihelcic, J.R. Realationship between chemical and theoretical oxygen demand for specific classes of organic chemicals. Water Res. 1999, 33, 327–334. [Google Scholar] [CrossRef]
  20. Masotti, L. Depurazione delle Acque. Tecniche ed Impianti per il Trattamento delle Acque di Rifiuto; Calderini: Bologna, Italy, 1991. (In Italian) [Google Scholar]
  21. Vismara, R. Depurazione Biologica: Teoria e Processi; Hoeply: Milan, Italy, 2002. (In Italian) [Google Scholar]
  22. Cescon, A.; Jiang, J.-Q. Filtration process and alternative filter media material in water treatment. Water 2020, 12, 3377. [Google Scholar] [CrossRef]
  23. Gunam, I.B.W.; Arnata, I.W. Combination of filter media to reduce total suspended solids, biochemical, and chemical oxygen demand in wastewater using installation of horizontal roughing filter. Asian J. Microbiol. Biotechnol. Environ. Sci. 2016, 18, 867–873. [Google Scholar]
  24. Fitzhenry, K.; Barrett, M.; O’Flaherty, V.; Dore, W.; Cormican, M.; Rowan, N.; Clifford, E. The Effect of Wastewater Treatment Processes, in Particular Ultraviolet Light Treatment, on Pathogenic Virus Removal; EPA Research Programme 2014–2020; Environmental Protection Agency: Galway, Ireland, 2016; Available online: www.epa.ie (accessed on 5 September 2022).
  25. Turtoi, M. Ultraviolet light potential for wastewater disinfection. Ann. Food Sci. Technol. 2013, 14, 153–164. [Google Scholar]
  26. USACHPPM. Ultraviolet Light Disinfection in the Use of Individual Water Purification Devices, IWP Individual Water Purifer, Pathogen Removal, Potable Water. 2006. Unclassified Document 31-006-0306. Available online: http://handle.dtic.mil/100.2/AD453967 (accessed on 27 June 2022).
  27. Azami, H.; Sarrafzadeh, H.M.; Mehrnia, R. Soluble microbial products (SMPs) release in activated sludge systems: A review. Iran. J. Environ. Health Sci. Eng. 2012, 9, 30. [Google Scholar] [CrossRef] [PubMed]
  28. Burzio, C. Soluble Microbial Products (SMP) and Bacteriophages in Activated Sludge. Master’s Thesis, Chalmers University of Technology, Gothenburg, Sweden, 2016. [Google Scholar]
  29. Barker, D.J.; Stukey, D.C. A review of soluble microbial products (SPM) in wastewater treatment systems. Water Res. 1999, 33, 3063–3082. [Google Scholar] [CrossRef]
  30. Bekins, B.A.; Godsy, E.M.; Warren, E. Comparison of Zero-Order, First Order, and Monod Biotransformation Models. Ground Water 1998, 36, 261–268. [Google Scholar] [CrossRef]
  31. Loyless, J.C.; Malone, R.F. Evaluation of the air-lift pump capabilities for water delivery, aeration, and degasification for application to recirculating aquaculture systems. Aquacult. Eng. 1998, 18, 117–133. [Google Scholar] [CrossRef]
  32. Fondriest, Environmental Learning Center. Dissolved Oxygen, Environmental Measurement Systems. 2013. Available online: https://www.fondriest.com/environmental-measurements/parameters/water-quality/dissolved-oxygen/ (accessed on 20 July 2022).
  33. Webb, P. Temperature–Introduction to Oceanography. Roger Williams University. 2021. Available online: https://rwu.pressbooks.pub/webboceanography/chapter/6-2-temperature/ (accessed on 30 September 2022).
Figure 1. Schematic view, not to scale, of the biodegradation experimental apparatus the BIOmini-MODUS.
Environments 10 00021 g001
Figure 2. Black line: Dissolved oxygen concentration [O2] (mg (O2) L−1) values (at 20 °C) measured by the oximeter (15) on the top of bioreactor (21) at the beginning of each biodegradation experiment in the ordinate vs. air flow (L min−1) in the abscissa. Green line: The ordinate time (h) required fulfilling the complete substrate biodegradation. For the sake of clarity, error bars of time (which represent the standard deviation of five measurements) are exaggerated by a factor of 2. Purple line: The ordinate air pressure (cm of water column, i.e., cm WC) measured by the pressure gauge (37). For the sake of clarity, air pressure error bars (which represent the standard deviation of five measurements) are exaggerated by a factor of 5.
Environments 10 00021 g002
Figure 3. Black line: Power N (kW) in the ordinate vs. air flow (L min−1) in the abscissa. Green line: The ordinate total energy Etot (kWh) spent to complete the substrate biodegradation. Purple line: The ordinate efficiency ƞ (mg L−1 kWh−1) obtained for each series of substrate biodegradation experiments.
Environments 10 00021 g003
Figure 4. The ordinate: dissolved oxygen [O2] (mg L−1) measured by the two oximeters (15) relative to the biodegradation experiment using an air flow of 10 L min−1.The first oximeter is placed on the top of bioreactor (21) and corresponds to the brown line with red error bars; the second oximeter is placed in the sedimentation tank (16) and corresponds to the black line with green error bars. The very top horizontal green straight line represents the asymptotic saturation oxygen concentration value (9.2 mg L−1) at 20 °C. The abscissa: elapsed time (h) during the biodegradation experiment.
Environments 10 00021 g004
Figure 5. BOD (mg L−1) in the ordinate vs. elapsed biodegradation time (h) in the abscissa. In the inset (top right), details of the last few h of the biodegradation experiment are shown. For the sake of clarity, error bars (which represent the standard deviation of five measurements) are exaggerated by a factor of 3.
Environments 10 00021 g005
Figure 6. Maximum biodegradation velocity vmax (mg L−1 h−1) in the ordinate vs. air flow (L min−1) in the abscissa.
Environments 10 00021 g006
Disclaimer/Publisher’s Note: The statements, opinions and data contained in all publications are solely those of the individual author(s) and contributor(s) and not of MDPI and/or the editor(s). MDPI and/or the editor(s) disclaim responsibility for any injury to people or property resulting from any ideas, methods, instructions or products referred to in the content.

