Article

Preliminary Study on Mini-Modus Device Designed to Oxygenate Bottom Anoxic Waters without Perturbing Polluted Sediments

1
Archives of Sustainability (ArcSos), University of Venice, Palazzo Moro Cannaregio 2978/D, I 30123 Venice, Italy
2
ConsulaSas di Perin Fabrizio & C. Sede legale Via H Arendt, 11-30027 San Dona’ di Piave (VE), Italy
3
Department of Environmental, Computer, and Statistics Sciences (DAIS), University of Venice, INCA-VEGAPARK via delle Industrie 21/8, I 30175 Marghera (Venice), Italy
*
Author to whom correspondence should be addressed.
Environments 2020, 7(3), 23; https://doi.org/10.3390/environments7030023
Submission received: 13 November 2019 / Revised: 21 February 2020 / Accepted: 13 March 2020 / Published: 20 March 2020

Abstract

:
The Tangential Guanabara Bay Aeration and Recovery (TAGUBAR) project derives its origins from a Brazilian government decision to tackle the planning and management challenges related to the restoration of some degraded aquatic ecosystems such as Guanabara Bay (state of Rio de Janeiro), Vitória Bay, and Espírito Santo Bay (state of Espírito Santo). This was performed by using the successful outcomes of a previous Ministry of Foreign Affairs and Directorate General for Cooperation and Development (i.e., Direttore Generale alla Cooperazione allo Sviluppo, MFA–DGCS) cooperation program. The general objective of the program was to contribute to the economic and social development of the population living around Guanabara, Vitória, and Espírito Santo Bays, while promoting the conservation of their natural resources. This objective was supposed to be achieved by investing money to consolidate the local authorities’ ability to plan and implement a reconditioning program within a systemic management framework in severely polluted ecosystems such as Guanabara Bay, where sediments are highly contaminated. Sediments normally represent the final fate for most contaminants. Therefore, it would be highly undesirable to perturb them, if one wishes to avoid contaminant recycling. In this context, we explored a bench-scale novel technology, called the module for the decontamination of units of sediment (MODUS), which produces an oxygenated water flow directed parallel to the sediment floor that is aimed to create “tangential aeration” of the bottom water column. The purpose of this is to avoid perturbing the top sediment layer, as a flow directed toward the bottom sediment would most probably resuspend this layer. Three kinds of tests were performed to characterize a bench-scale version of MODUS (referred to as “mini-MODUS”) behavior: turbulence–sediment resuspension tests, hydrodynamic tests, and oxygenation–aeration tests. In order to understand the functioning of the mini-MODUS, we needed to eliminate as many variables as possible. Therefore, we chose a static version of the module (i.e., no speed for the mini-MODUS as well as no water current with respect to the bottom sediment and no flume setting), leaving dynamic studies for a future paper. The turbulence tests showed that the water enters and exits the mini-MODUS mouths without resuspending the sediment surface at all, even if the sediment is very soft. Water flow was only localized very close to both mouth openings. Hydrodynamic tests showed an interesting behavior. An increase of low air flows produced a sharp linear increase of the water flow. However, a plateau was quickly reached and then no further increase of water flow was observed, implying that for a certain specific geometry of the equipment and for the given experimental conditions, an increase in the air flow does not produce any reduction of the residence time within the aeration reactor. Oxygenation–aeration tests explored three parameters that were deemed to be most important for our study: the oxygen global transfer coefficient, KLa; the oxygenation capacity, OC; and the oxygenation efficiency, OE%. An air flow increase causes an increase of both KLa and OC, while OE% decreases (no plateau was observed for KLa and OC). The better air flow would be a compromise between high KLa and OC, with no disadvantageous OE%, a compromise that will be the topic of the next paper.

1. Introduction

Sediments normally represent the final fate for most of the contaminants present in ecosystems and they may be responsible for the continuous release of pollutants back to the water column, generating ecological and public health problems [1]. If the sediments are anoxic, they also produce unpleasant odors caused by hydrogen sulfide and some other sulfur- or ammonia-based compounds [1], which can eventually be stripped away by bubble columns or similar equipment [2,3,4]. However, these buried pollutants can sometimes be released back into the environment, especially when the sediments are perturbed (i.e., when they are dredged or mixed). As this is normally highly undesirable, this means that we need to adopt a very careful approach in sediment management if we want to avoid contaminant recycling. In this context, we explored a bench-scale novel technology called the module for the decontamination of units of sediment (MODUS), which aimed to create “tangential aeration” of the bottom water column by a “laminar aeration flow” directed tangentially to the seabed, without perturbing the top sediment layer. On the other hand, the organic matter that subsequently falls from sedimentation from the sea surface to the bottom crosses the oxygenated water layers, and is therefore able to form a sediment layer in aerobic conditions, giving rise to the so-called bio-oxy layer (bio-ox-capping). When not disturbed, this bio-oxy layer allows for the biological recovery of the top portion of the sediment, forming the basis for the colonization of the seabed by animals and benthic aerobic microorganisms [4]. Actually, this was the objective of the Tangential Guanabara Bay Aeration and Recovery (TAGUBAR) project, in the framework of the Ministry of Foreign Affairs and Directorate General for Cooperation and Development (i.e., Direttore Generale alla Cooperazione allo Sviluppo, MFA–DGCS) and of the Government of Brazil, which decided to invest money in order to perform specific research to check this MODUS methodology in Rio de Janeiro (Guanabara) Bay.
However, before choosing the most promising kind of equipment, we perused a list of the possible alternatives, taking into account that a surface water temperature of 20 °C and one atmosphere pressure has a dissolved oxygen concentration (DO) of about 9 (mg L−1). Below is a brief (and non-exhaustive) list of the available equipment.
Aeration-by-bubble columns [5]: Their performance mainly depends on the diffusor depth as well as on the diameter of the bubbles. Unfortunately, in any case, the bubbles move to the surface where O2 concentration is already maximal, instead of remaining at the bottom long enough to explicate their function.
Submerged aeration chambers [4,6,7]: The bubbles warrant both aeration and water flow. These types of equipment withdraw the water from the bottom, aerate it, and then discharge it tangentially with respect to the sediment. The main disadvantage is the lack of mobility because it is necessary to anchor them to the bottom sediment.
Aeration by pressurized air (jet aerators) [8,9]: In the mixing chamber, water and air are in close contact at relatively high pressure, so that the water becomes supersaturated and is then expunged by a jet diffuser. The drawback is that this water is introduced into the water body quite wildly, and therefore the risk of resuspending and perturbing the top sediment is non-negligible.
Water fan aerators (Garton pumps) [10,11]: These pump the superficial water layers that are rich in O2 to the bottom, where oxygenation is scarce. The first disadvantage is that their efficiency clearly depends on the natural gradient of the dissolved oxygen (DO). Second, the mechanical components are eventually subjected to wear, corrosion, and fan jamming due to floating garbage, sand. or suspended particulates.
“Air-lift” aerators [7,12,13,14,15]: Mechanical components are totally absent (wear, corrosion, and jam are excluded). The water is “pneumatically” aerated and stirred in the “aeration reactor” with minimum energy consumption. This last one, undoubtedly represents an interesting advantage for locations where there is no access to the electricity grid, like sea lochs or lagoons. In the “reversed U” version of this equipment, the top that connects the two vertical pipes is provided with a chimney, and therefore works as a “degassing chamber”. In the “lift” pipe, the air is introduced from the bottom of the pipe and therefore produces the desired bubbling while in the other vertical pipe, the bubbles are absent. This results in a density difference between the two vertical pipes, which is responsible of the “lifting” effect [12]. In fact, when the bubbling water arrives at the top of the equipment, it enters the “degassing chamber” where air separates from water and exits from a chimney; the bubble deprived water (still saturated by oxygen) then descends in the other vertical pipe and exits the equipment close to the bottom sediment. Normally, when the entrance and exit flows are directed horizontally, they do not perturb the sediment, even if they are very close to it. For the purpose outlined in the present paper, we chose this solution. However, the parameters that define the working conditions cannot be calculated by any mathematical or empirical correlation. Normally, all variables are mutually interdependent and determined by equipment geometry, scale, and by particular operative conditions. This makes extrapolations and generalizations difficult or impossible. Thus, there is no shortcut for performing laboratory experiments that are chiefly oriented to verify the feasibility of the project by exploring the working operative conditions closest to those encountered in reality [16,17]. The purpose of the present paper was to determine the best working conditions and the corresponding best working parameters of the mini-MODUS in order to efficiently aerate anoxic water in a reasonable lapse of time without perturbing the bottom sediment at all. Three parameters were deemed to be the most important for our study [16,17,18]: the oxygen global transfer coefficient, KLa; the oxygenation capacity, OC; and the oxygenation efficiency, OE%.

2. Materials and Methods

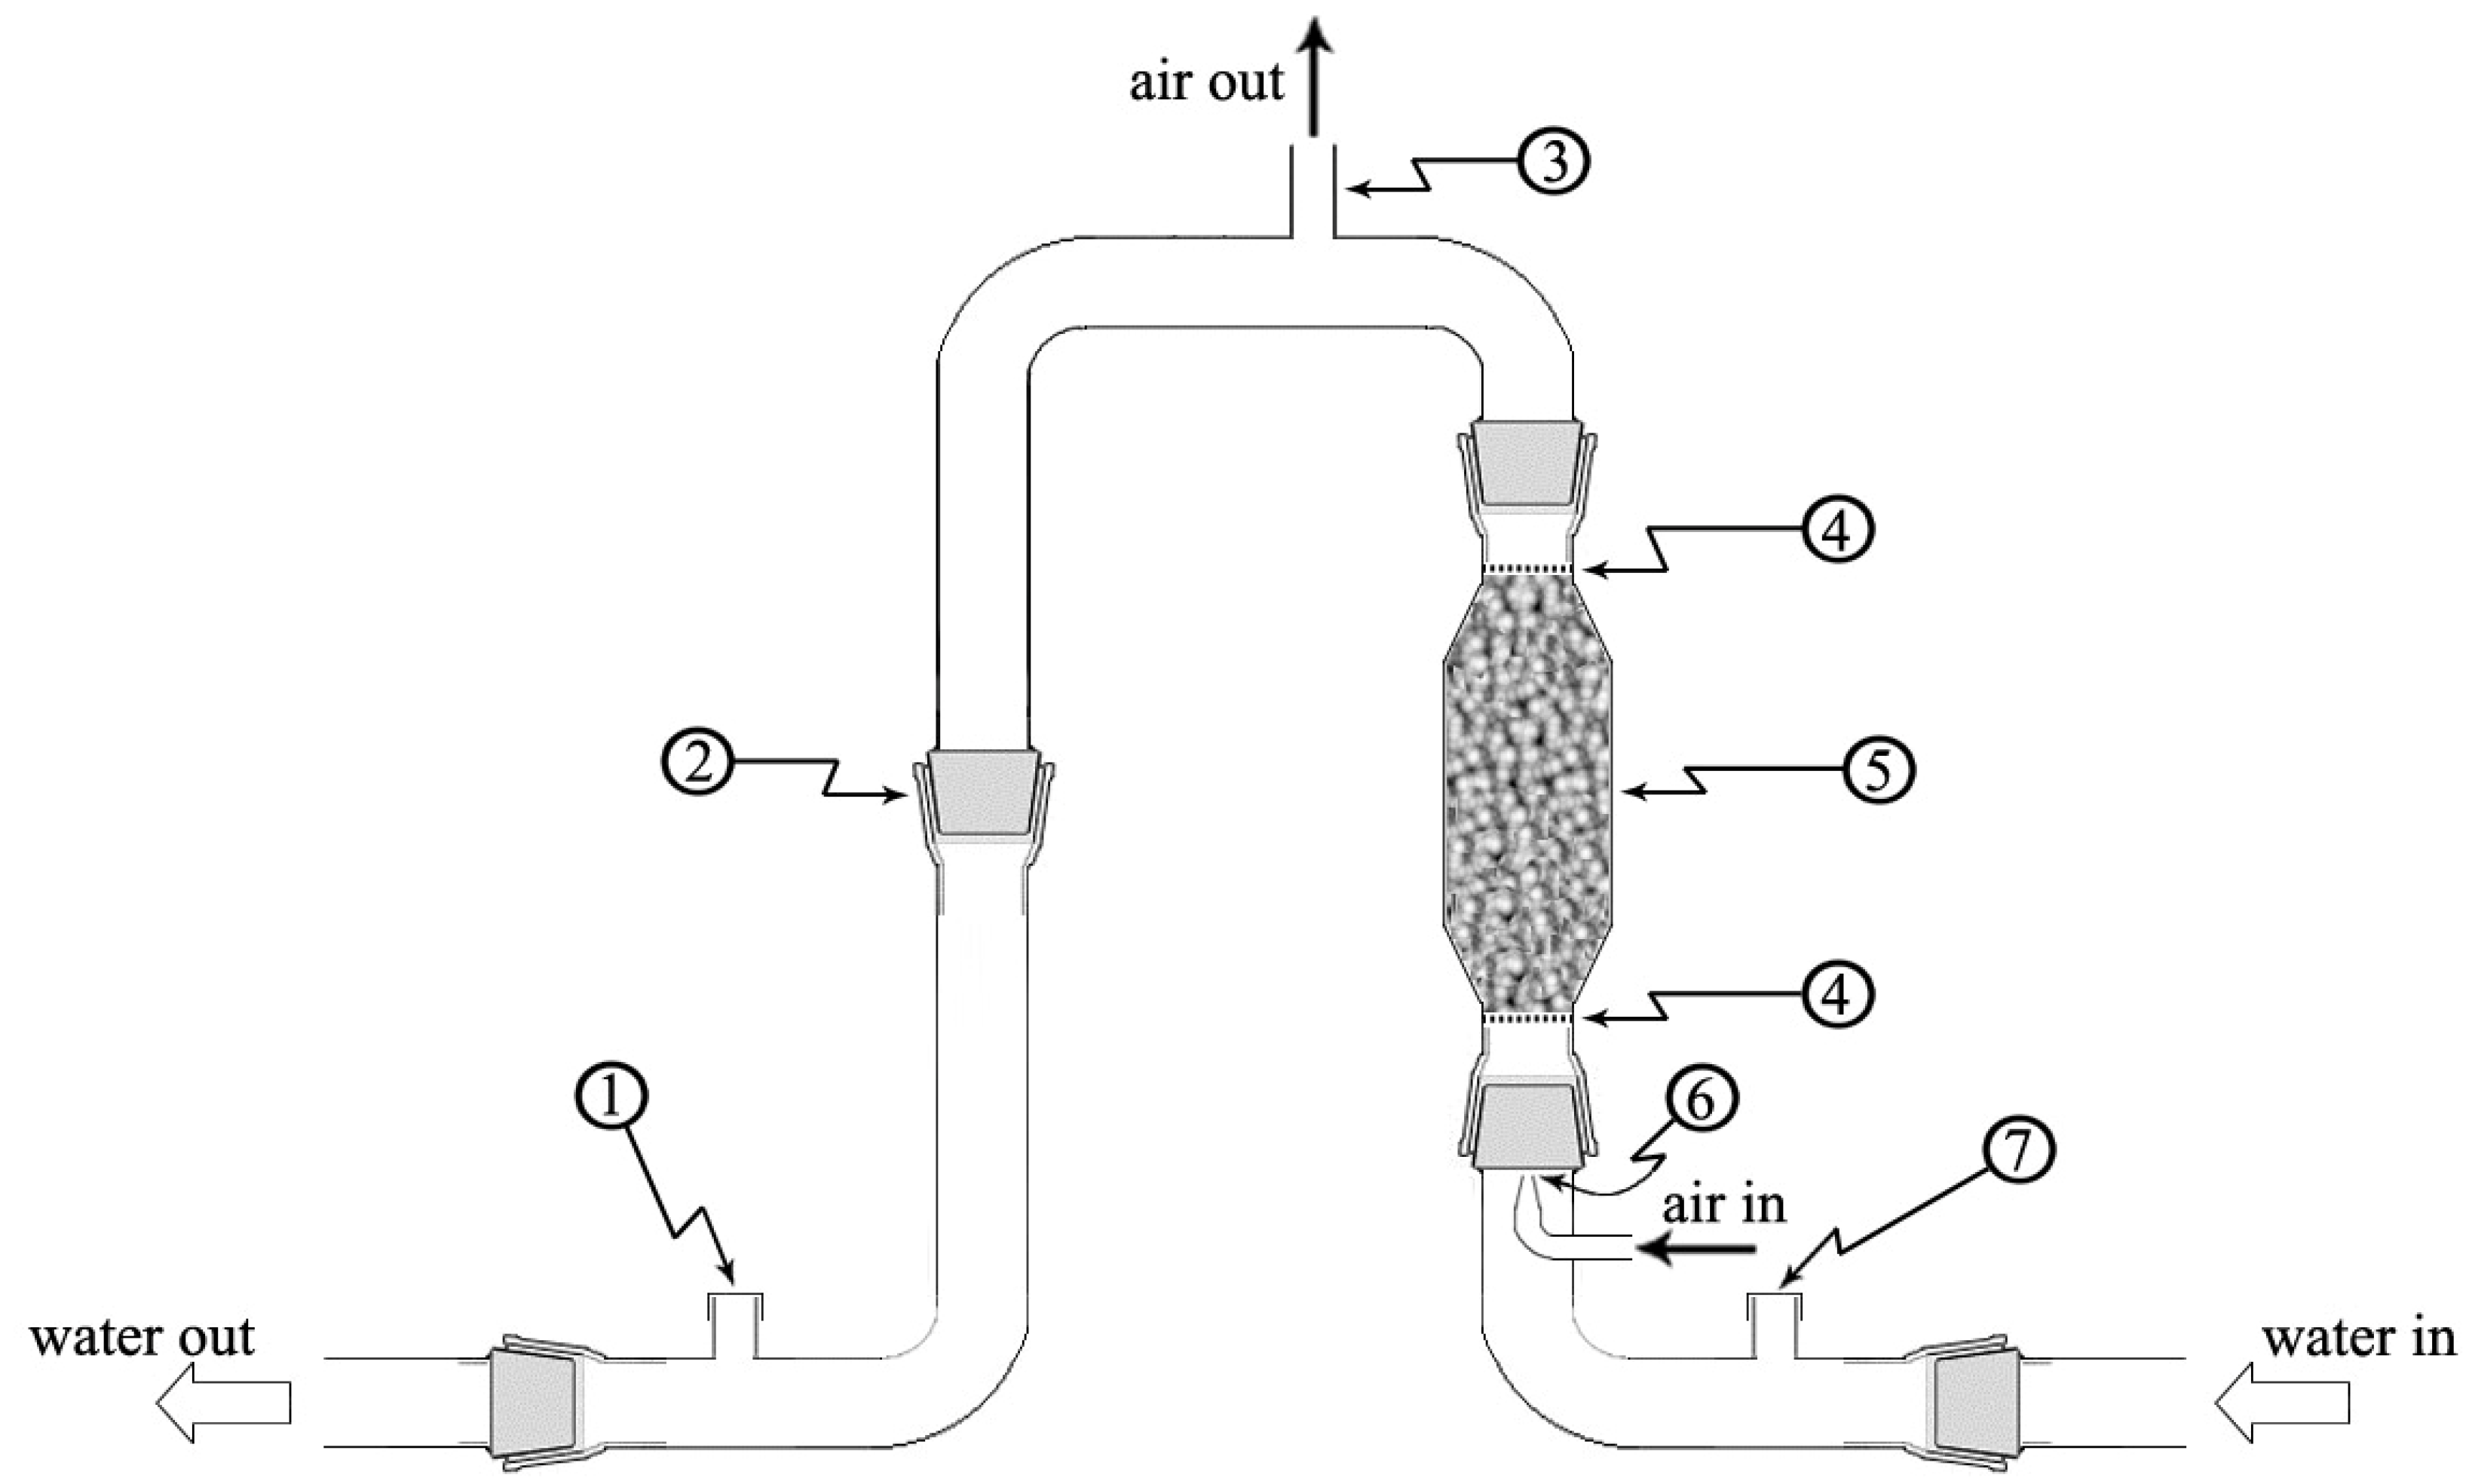
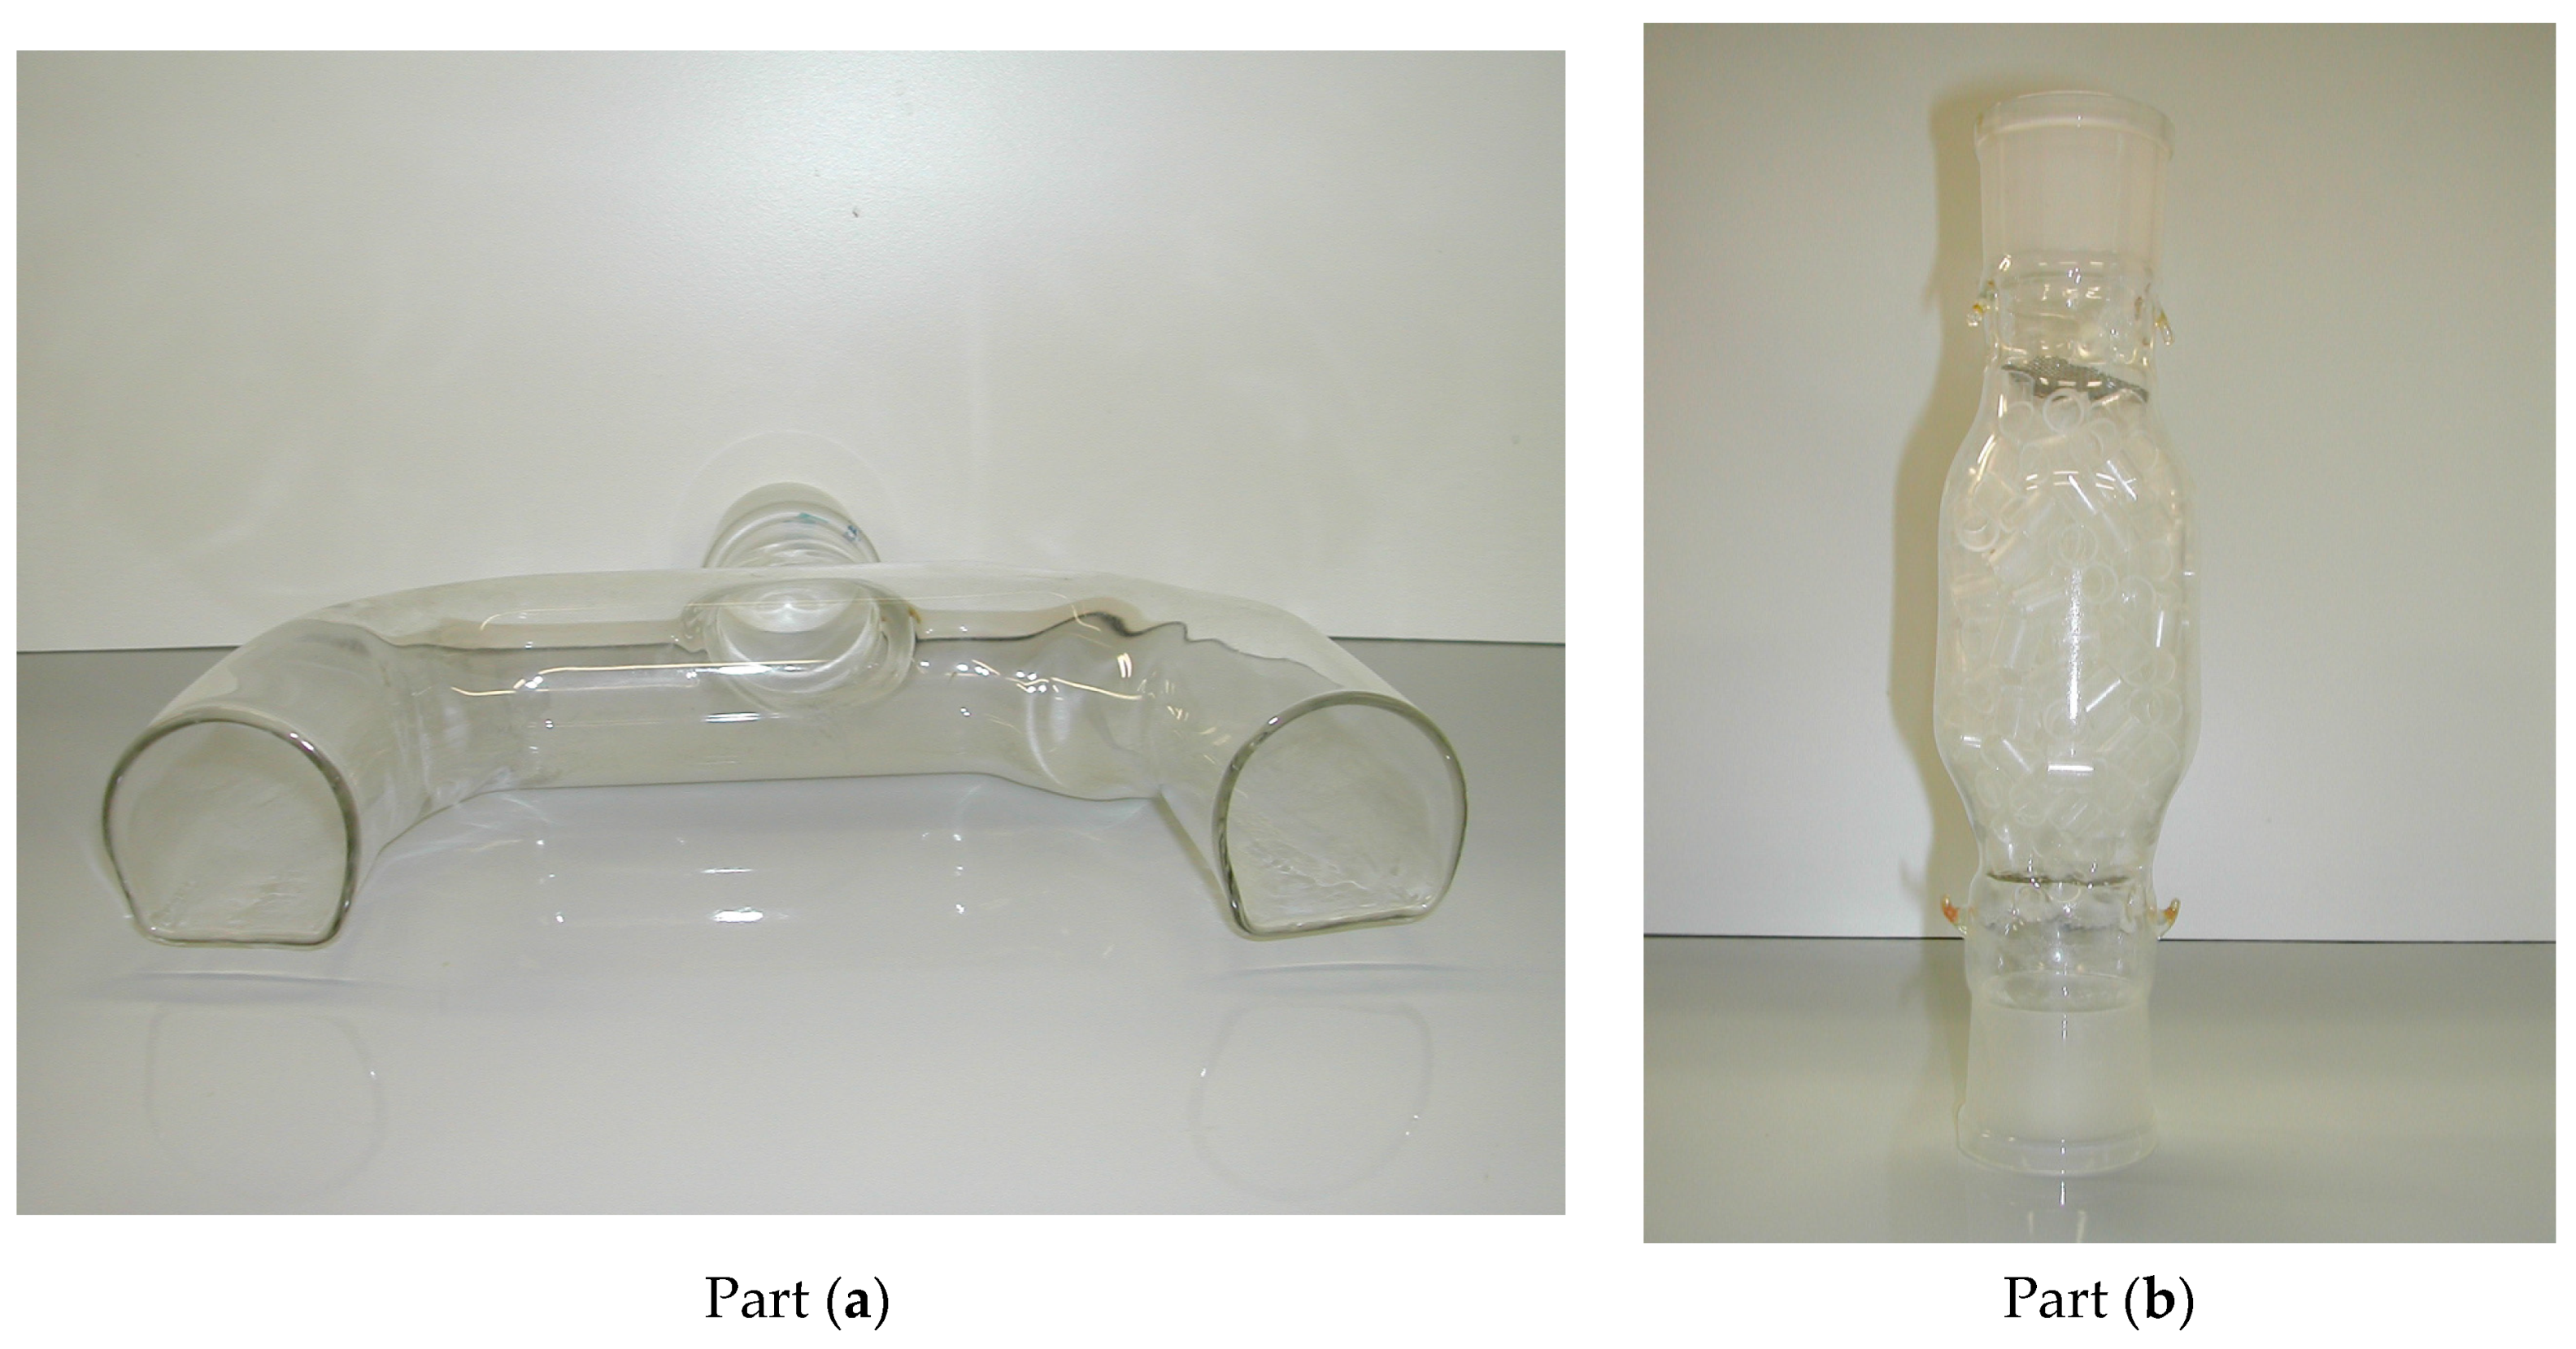
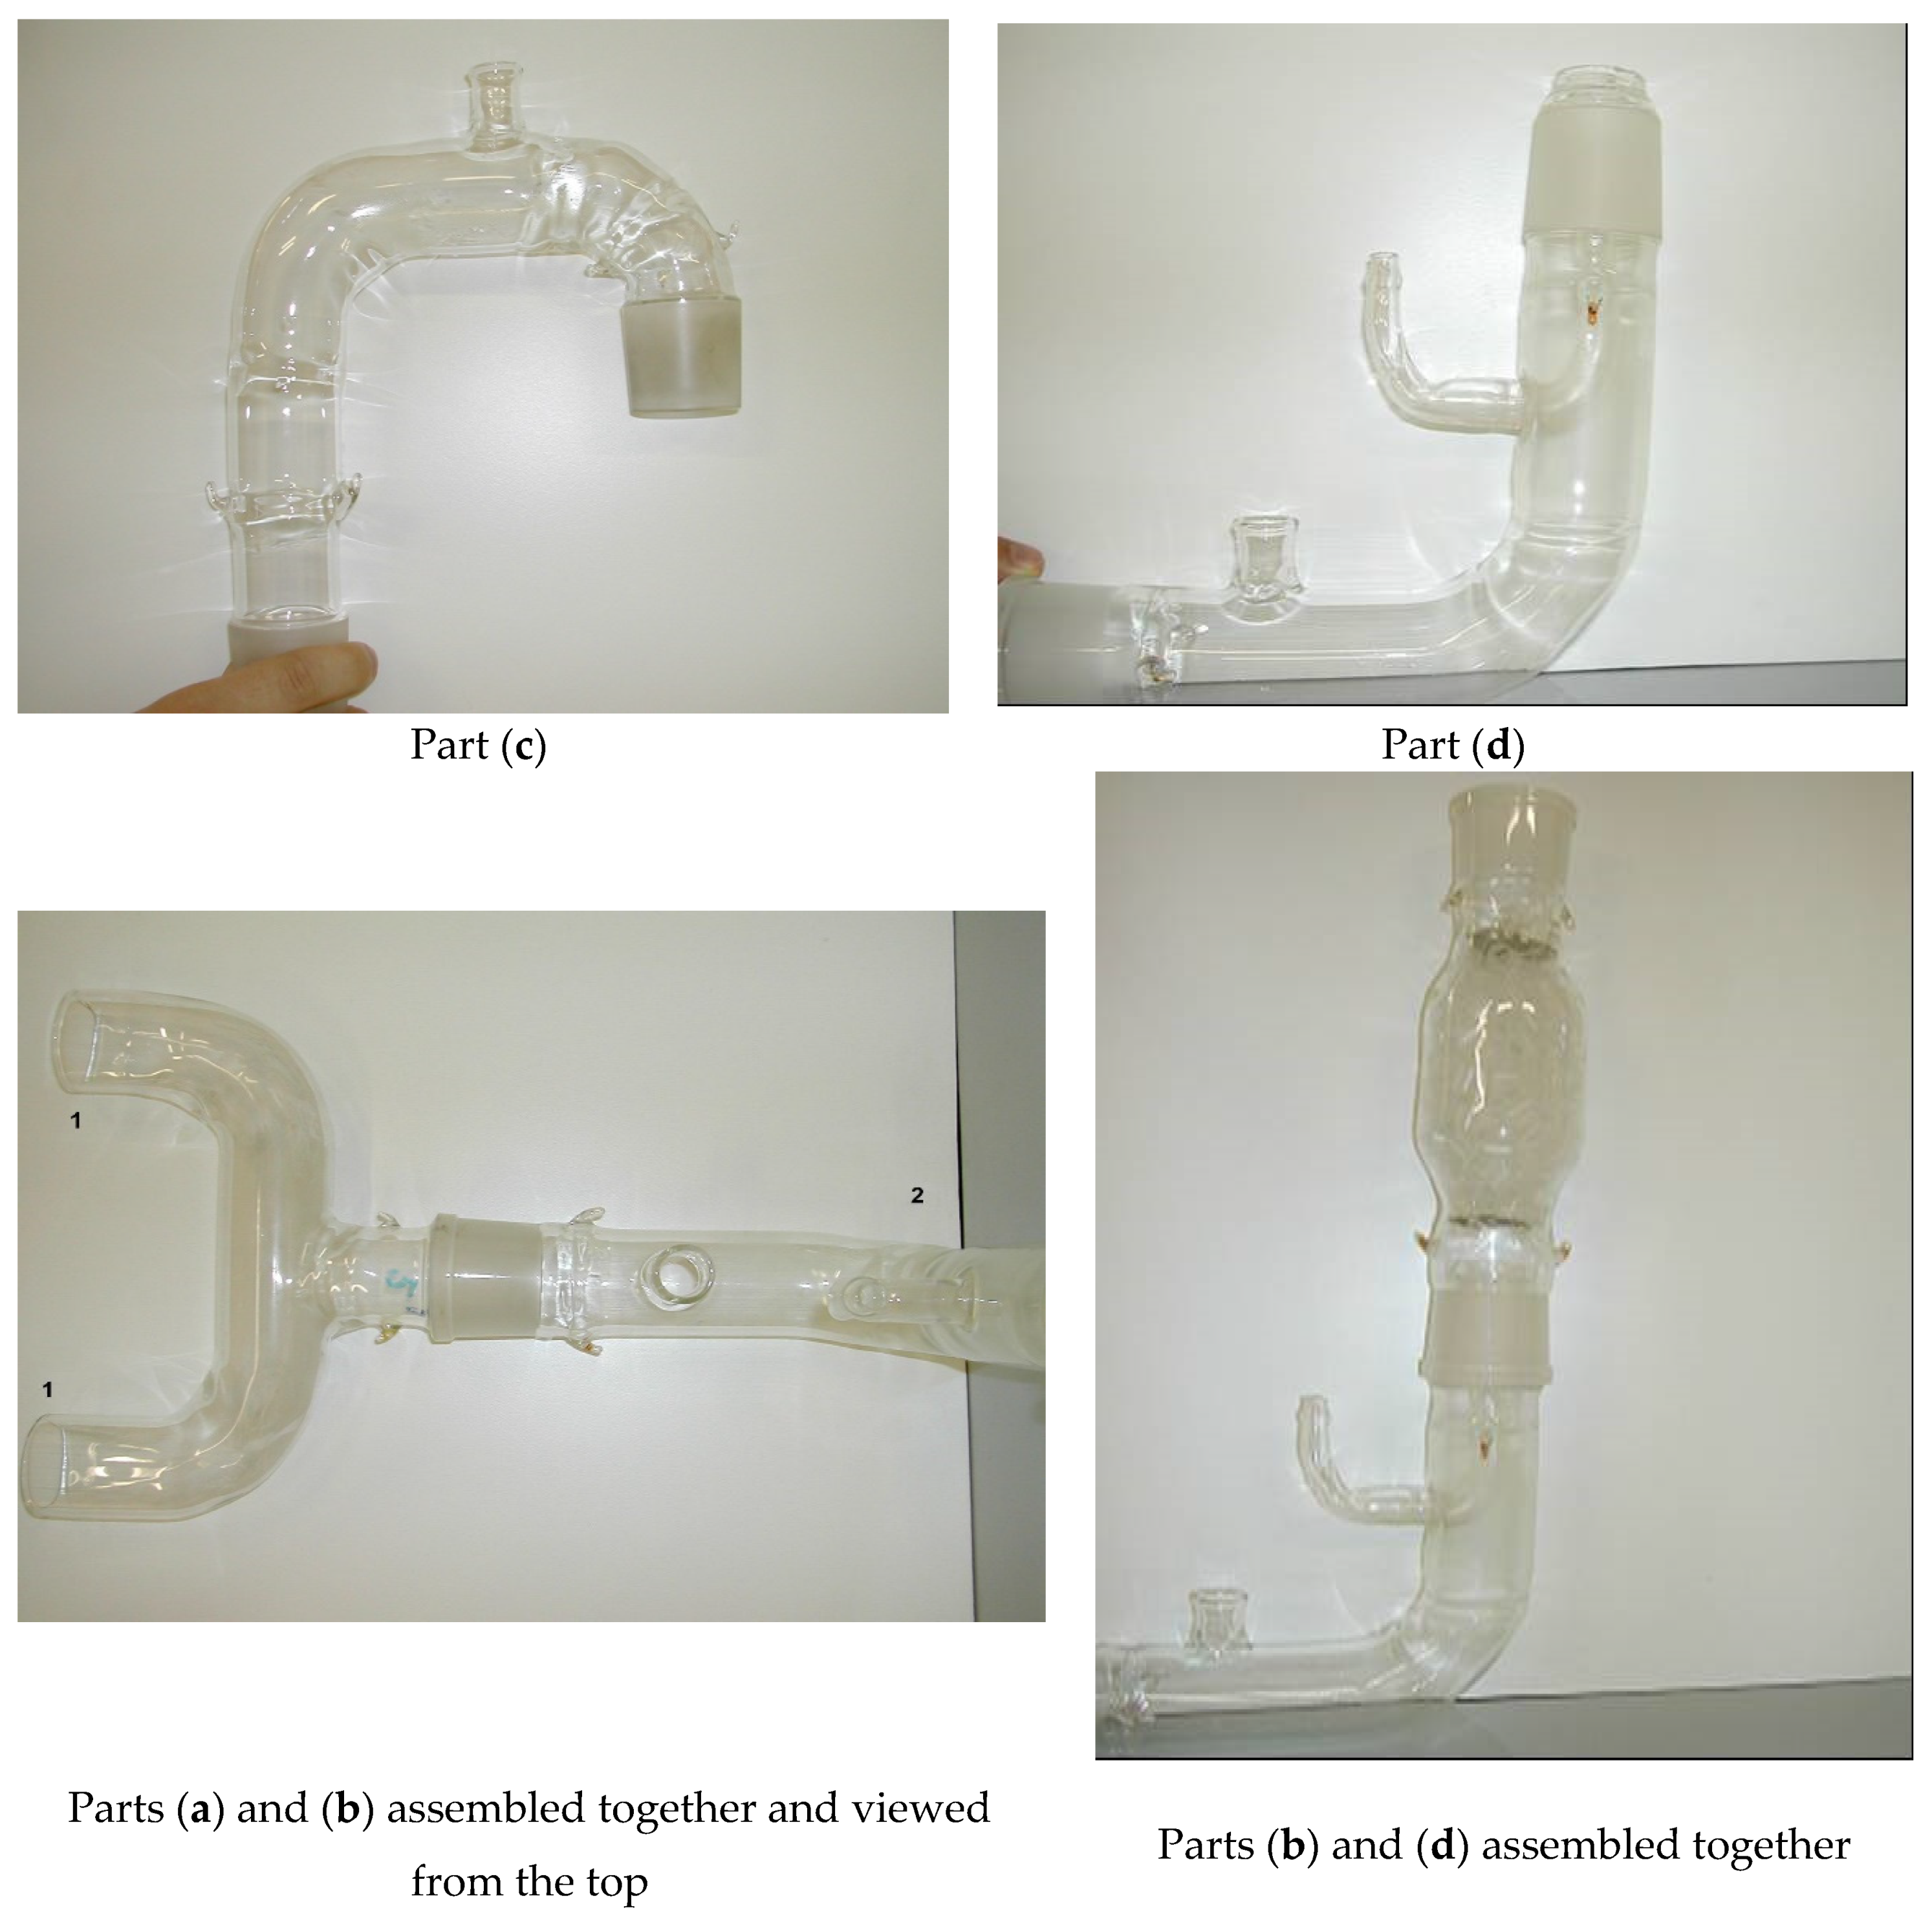
2.1. Equipment Description

The mini-MODUS (see Figure 1) is mainly composed of six glass parts: (1) the outlet mouth (equipped with an “exit water” sampling point); (2) the descent pipe; (3) the degassing chamber (equipped with a chimney); (4) the lift pipe, comprising the air-lift reactor (called also oxygenation/aeration reactor) filled with Rashig rings; (5) the associated sparger; and (6) an inlet mouth (equipped with an “entering water” sampling point).
The Rashig rings were chosen as an increase in the air–water contact time and the exchange surface would have the desired result of an efficient oxygen transfer from air to water. In this context, a bubble-breaker system would be useful while not worsening the air resistance. As a first attempt, we tried to use Rashig rings, which were chosen because of their sufficient weight (they did not accumulate on the top of the reactor bed), their rigidity, and their tendency to distribute regularly across the reactor bed.
Figure 2 shows the images of a few chosen crucial parts of the equipment: the mouth (exit and entrance mouths are identical), the reactor, the degassing chamber, the sparger (2) and the entrance mouth (1) along with the “water in” sampling point seen from the top.
All equipment parts were realized in Pyrex glass and connected to one another by standard ground glass joints (conically tapered joints). The pipes measured 40 mm in diameter. The oxygenation reactor, which measured 60 mm in diameter and 120 mm in height, was filled with a bed made of glass Rashig rings measuring 8 mm in diameter and 10 mm in height. This bed was maintained in position by two grids: one at the top of the bed, the other on the bottom, and both grids are clearly shown in Figure 1 and in Part (b) of Figure 2. The empty and the filled reactors measured 0.33 L and 0.24 L of free volume, respectively. The whole equipment, measuring 0.50 m in height and 0.6 m in length, was placed in a 2 m × 0.7 m × 0.4 m tank, filled with a few millimeters of sediment from the bottom and then filled with 480 L of tap water. The sediment, which was taken from the Venice Lagoon, oven dried, and then ground, was particularly soft. The temperature used during the oven drying guaranteed that the resulting ground sediment did not contain any biotic components. This was done because the biotic components could have interfered with the oxygenation experiments as the microorganisms could have used part of the introduced oxygen in metabolic processes.

2.2. Sampling, Analysis, and Data Elaboration

In order to determine the aeration efficiency, DO concentrations were measured in correspondence of the “water in” sampling point (see point “7” of Figure 1) and “water out” sampling point (see point “1” of Figure 1). DO concentrations were determined by a Vernier Dissolved Oxygen Probe whose accuracy was checked by the Winkler standard method [19] several times during a single experiment. For each sampling, DO measurements were repeated five times to calculate the average and standard deviations used for further elaborations.
Air flows were measured by a variable area flow meter, while water speeds (from which water flows were calculated) were determined by measuring the time needed for a drop of a green dye scarcely soluble in water to travel a determined stretch of the mini-MODUS’s pipe.
Dye drops (of the same green dye) were also used to analyze the level of turbulence generated around the two mouths during the turbulence tests.
In order to perform oxygenation tests, it was first necessary to remove all the DO present in the tap water in the tank. This was obtained by flushing such water for an appropriate time with a nitrogen stream [18]. Once the oxygen absence was confirmed, the experiments were started. Water temperatures were measured throughout the entire course of each experiment. Normally, during each experiment, the temperature remained constant within the experimental error of the thermometer we used (±0.1 °C). Air flows were chosen from 1 to 25 L min−1 using steps of 1 L min−1. The DO concentrations were measured each 5 min from the very beginning of each experiment (i.e., when the measured DO concentration was equal to zero) to the end of the experiment when the DO concentration at the entrance mouth was equal to that of the exit one (indicating the condition of oxygen saturation for the water present in the whole tank). In this way, for each air flow, we obtained an “oxygenation test” diagram reporting “DO concentrations” in the ordinate versus “elapsed time” in the abscissa (diagrams here not reported) [3,20,21]. From this data, three parameters were calculated: the oxygen global transfer coefficient, KLa; the oxygenation capacity, OC; and the oxygenation efficiency, OE%. The KLa was determined by considering the well-known expression dC/dt = KLa (Cs − C) where C is the DO at time t and Cs is the DO saturation concentration at the temperature at which that oxygenation test was performed. For each air flow, the KLa was determined by regression from the corresponding “oxygenation test” diagram, taking into account the temperature at which that specific test was performed [18,20] in the following way: seeing as some of the experiments were done on different days, the room temperature varied, therefore the variation of KLa with the temperature was estimated to be 1.8% per 1 °C, in full agreement with that reported in the literature [22]. The KLa data were then normalized at 20 °C. OC was calculated from KLa using the formula [3]: OC = KLa × Cs × V, where V is the volume of the tank occupied by the tap water. For different “oxygenation tests”, temperatures varied between 18 °C and 22.5 °C so that Cs was included in the interval 9.2–8.8 mg L−1. The OE% represents how much of the oxygen introduced in the equipment by the air flow during that specific experiment (O2int) was effectively transferred to the water. O2int was calculated assuming an oxygen concentration in the air of 20.95% and considering an atmospheric pressure of 1 atm (i.e., assuming 22.4 mole L−1). Therefore, for each air flow it will be OE% = (OC/O2int) × 100.

3. Results

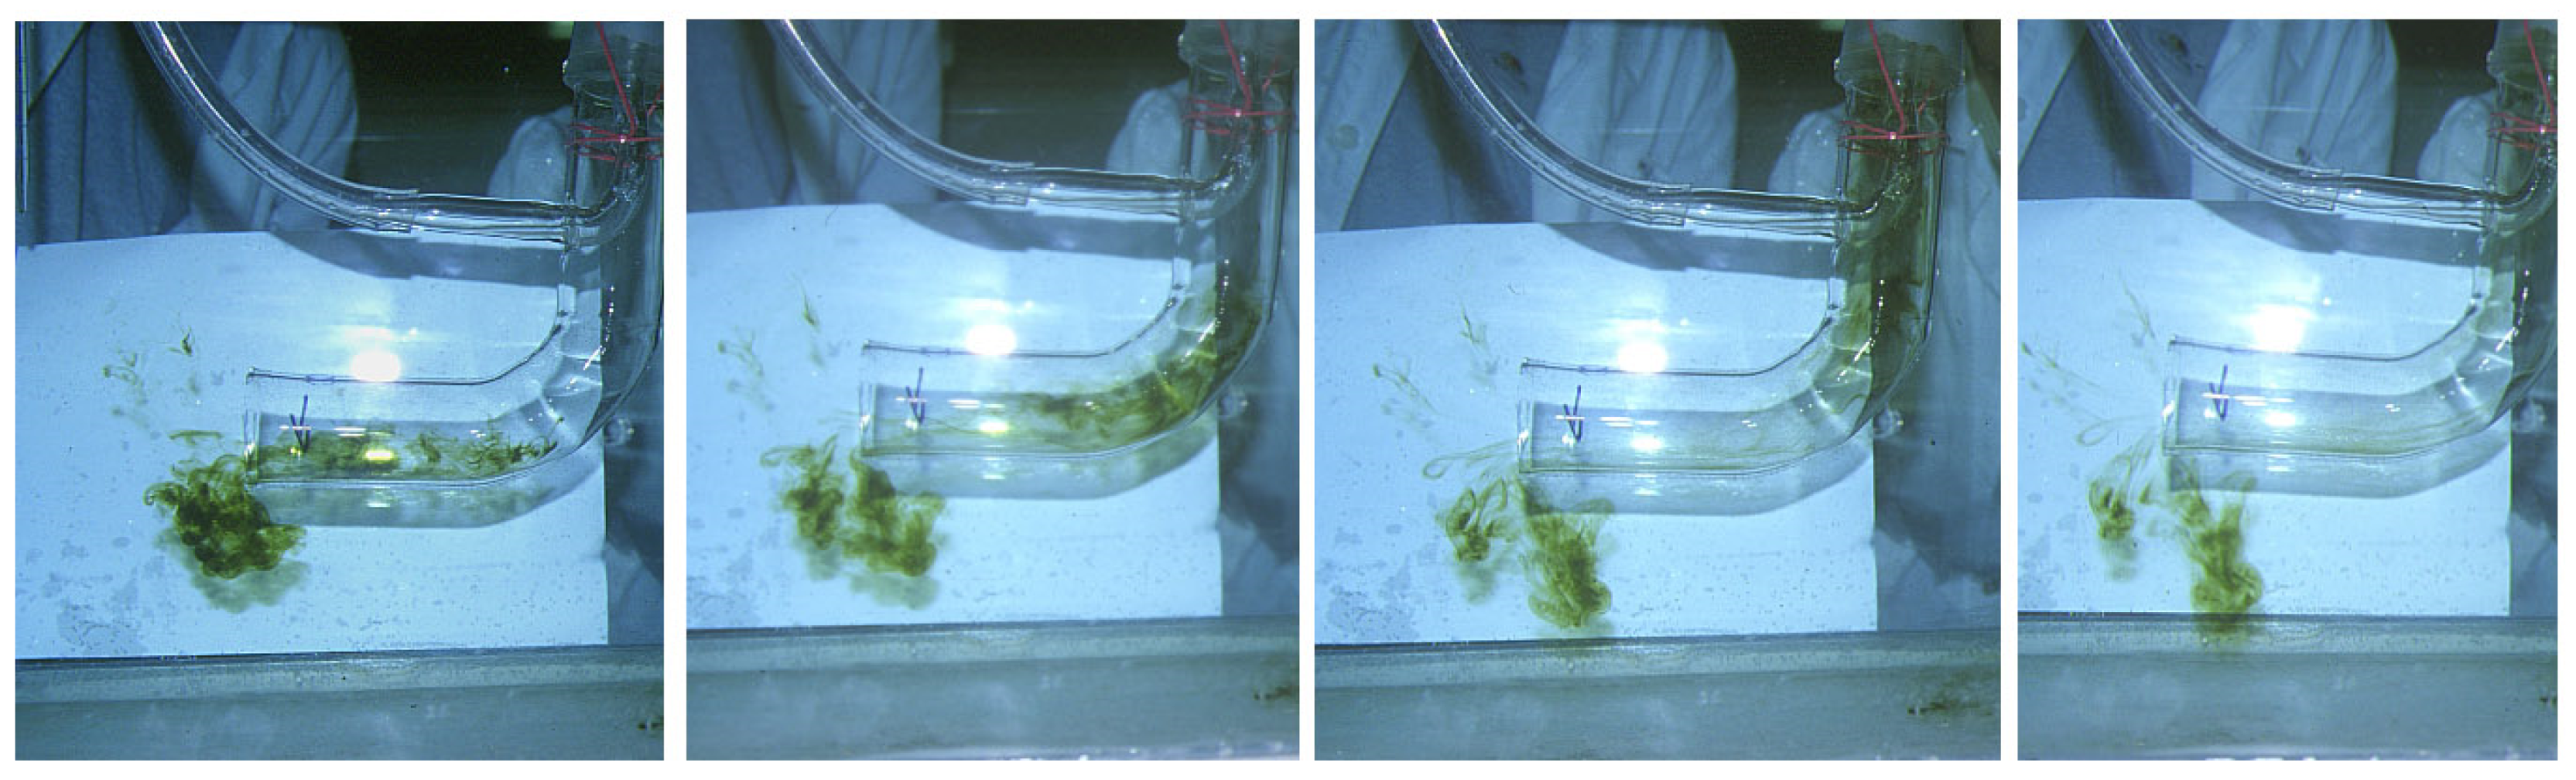
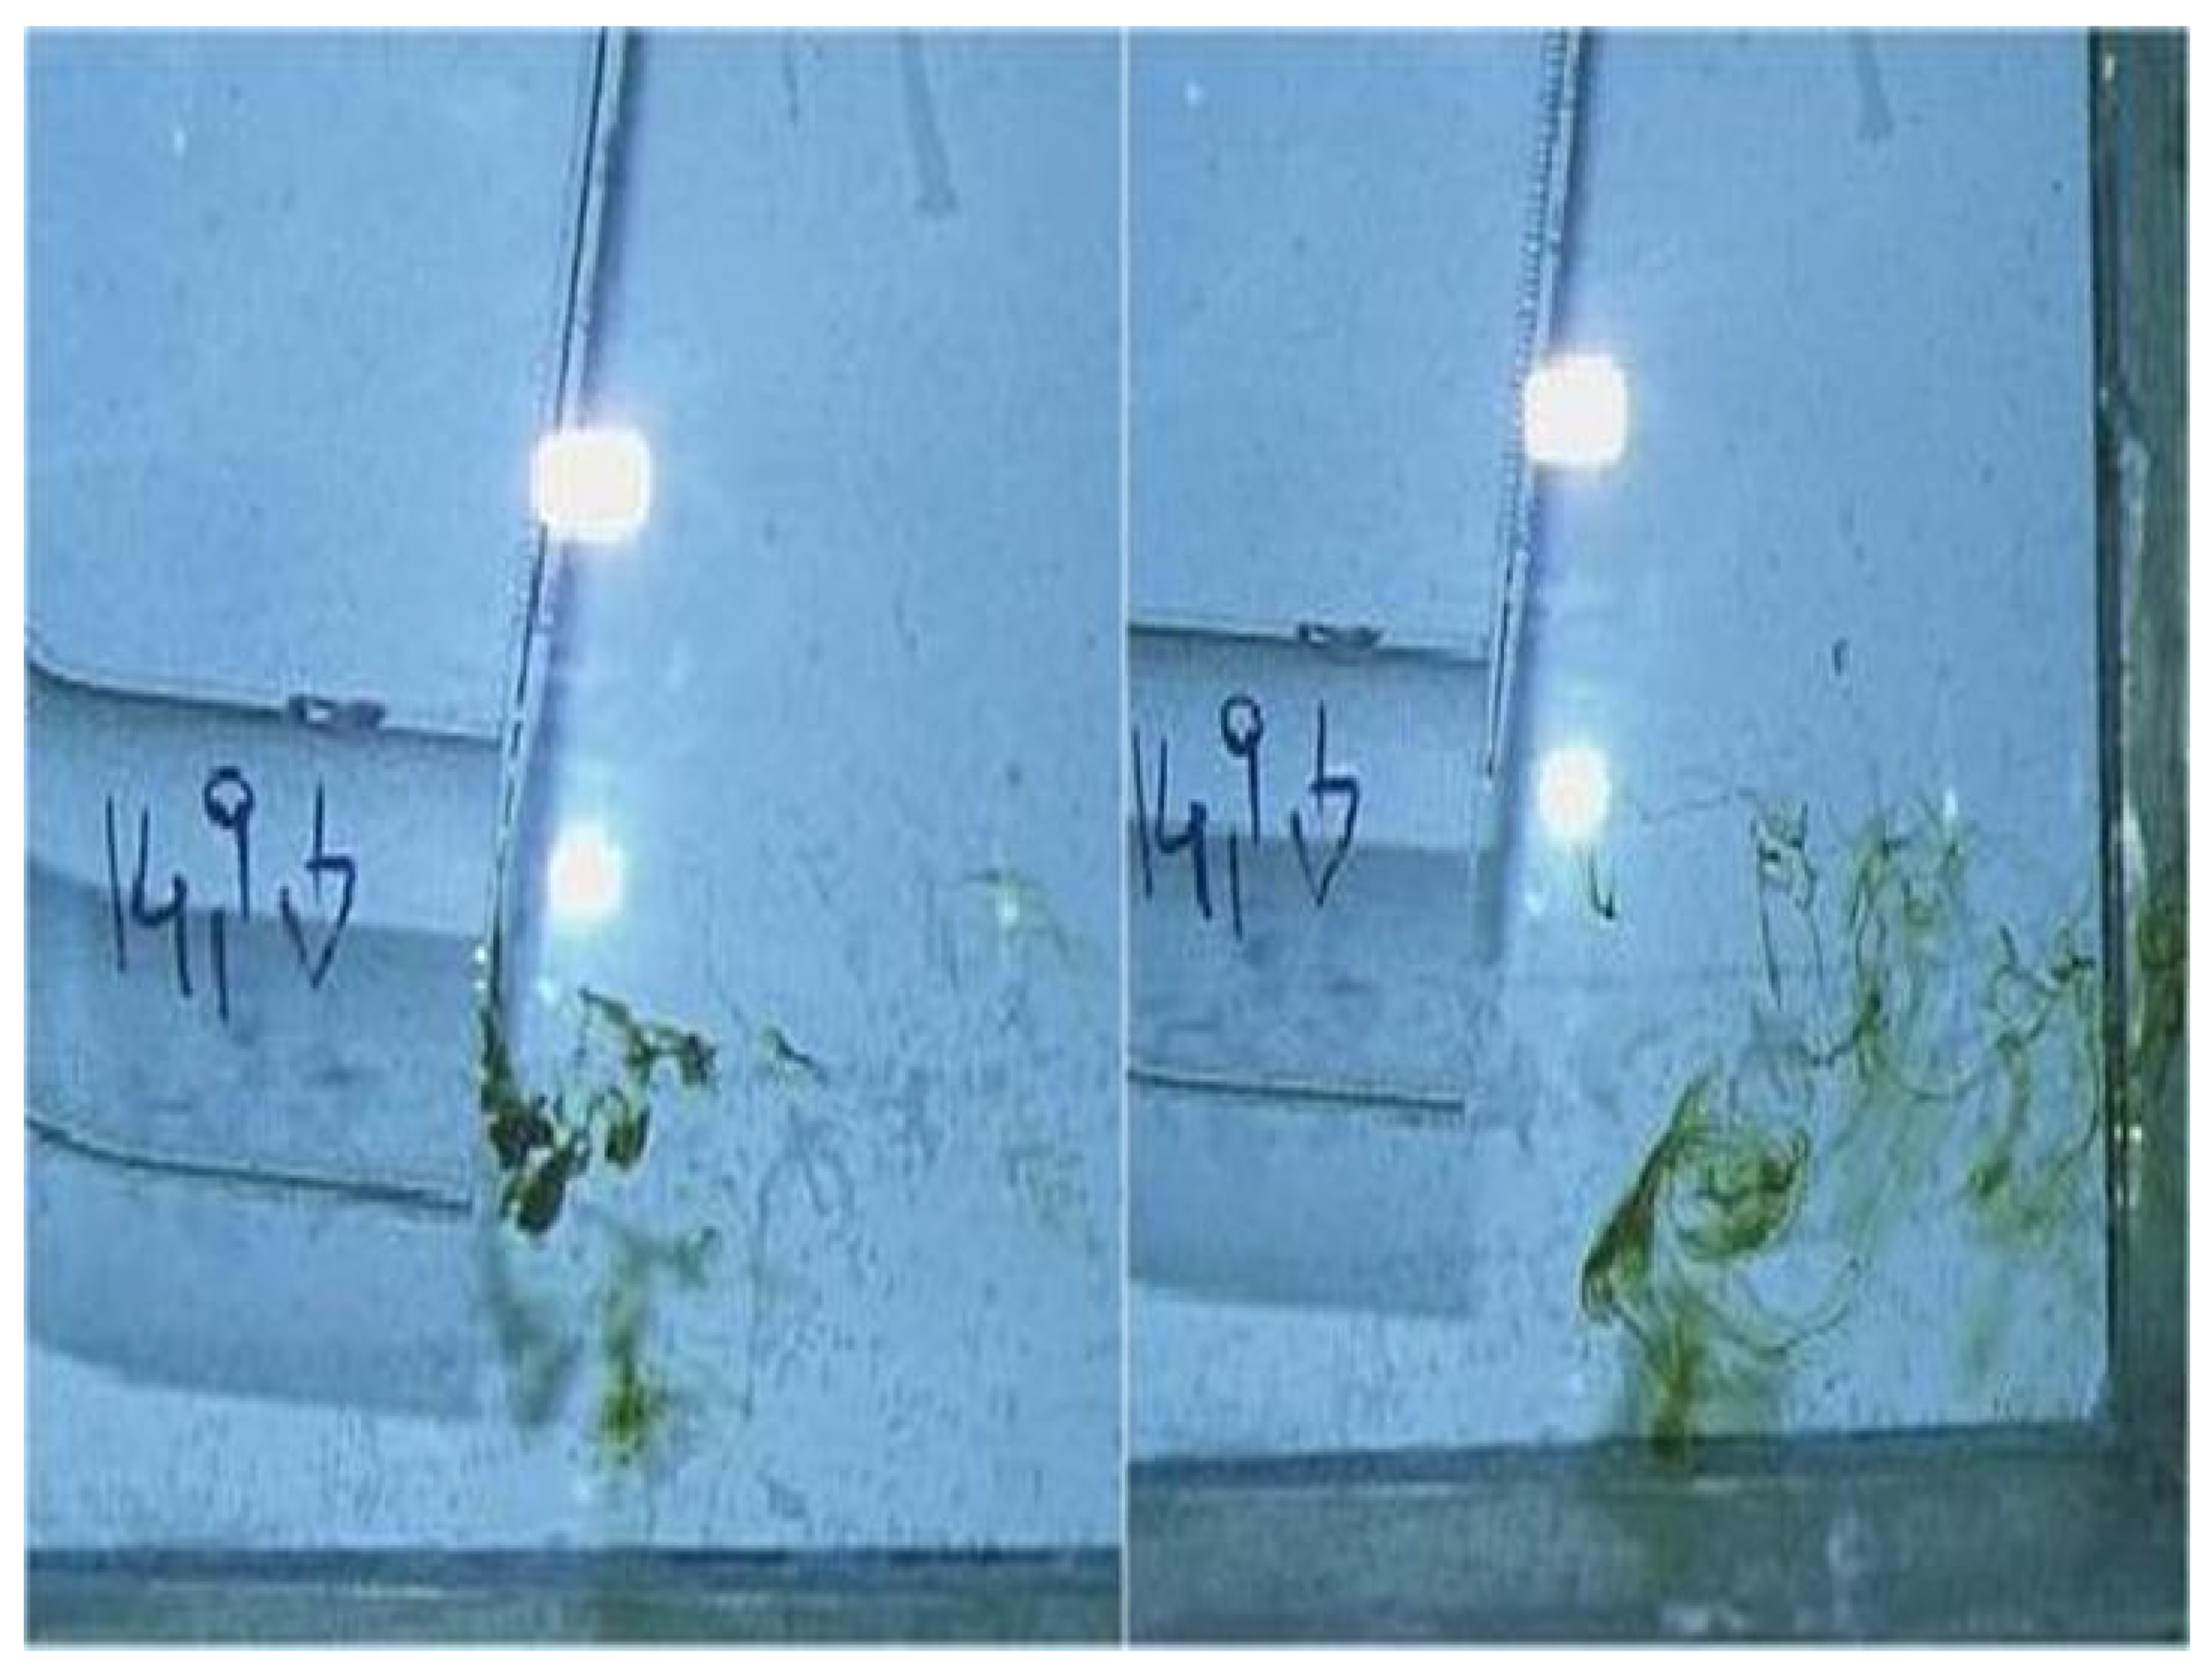
3.1. Turbulence Tests (Sediment Resuspension Tests)

It is evident that the first aim of our study was fulfilled as Figure 3 clearly shows that the water enters into the mini-MODUS without resuspending the sediment surface in any way, even though the sediment was very soft. The very same observation can be made for the exit mouth (Figure 4).
For these tests, the maximum air flow of 25 L min−1 (corresponding to the maximum water flow of 9 L min−1) was employed. This warrants that in any operative condition, the mini-MODUS would not perturb the sediment while oxygenating the bottom water layers that are immediately above the sediment.

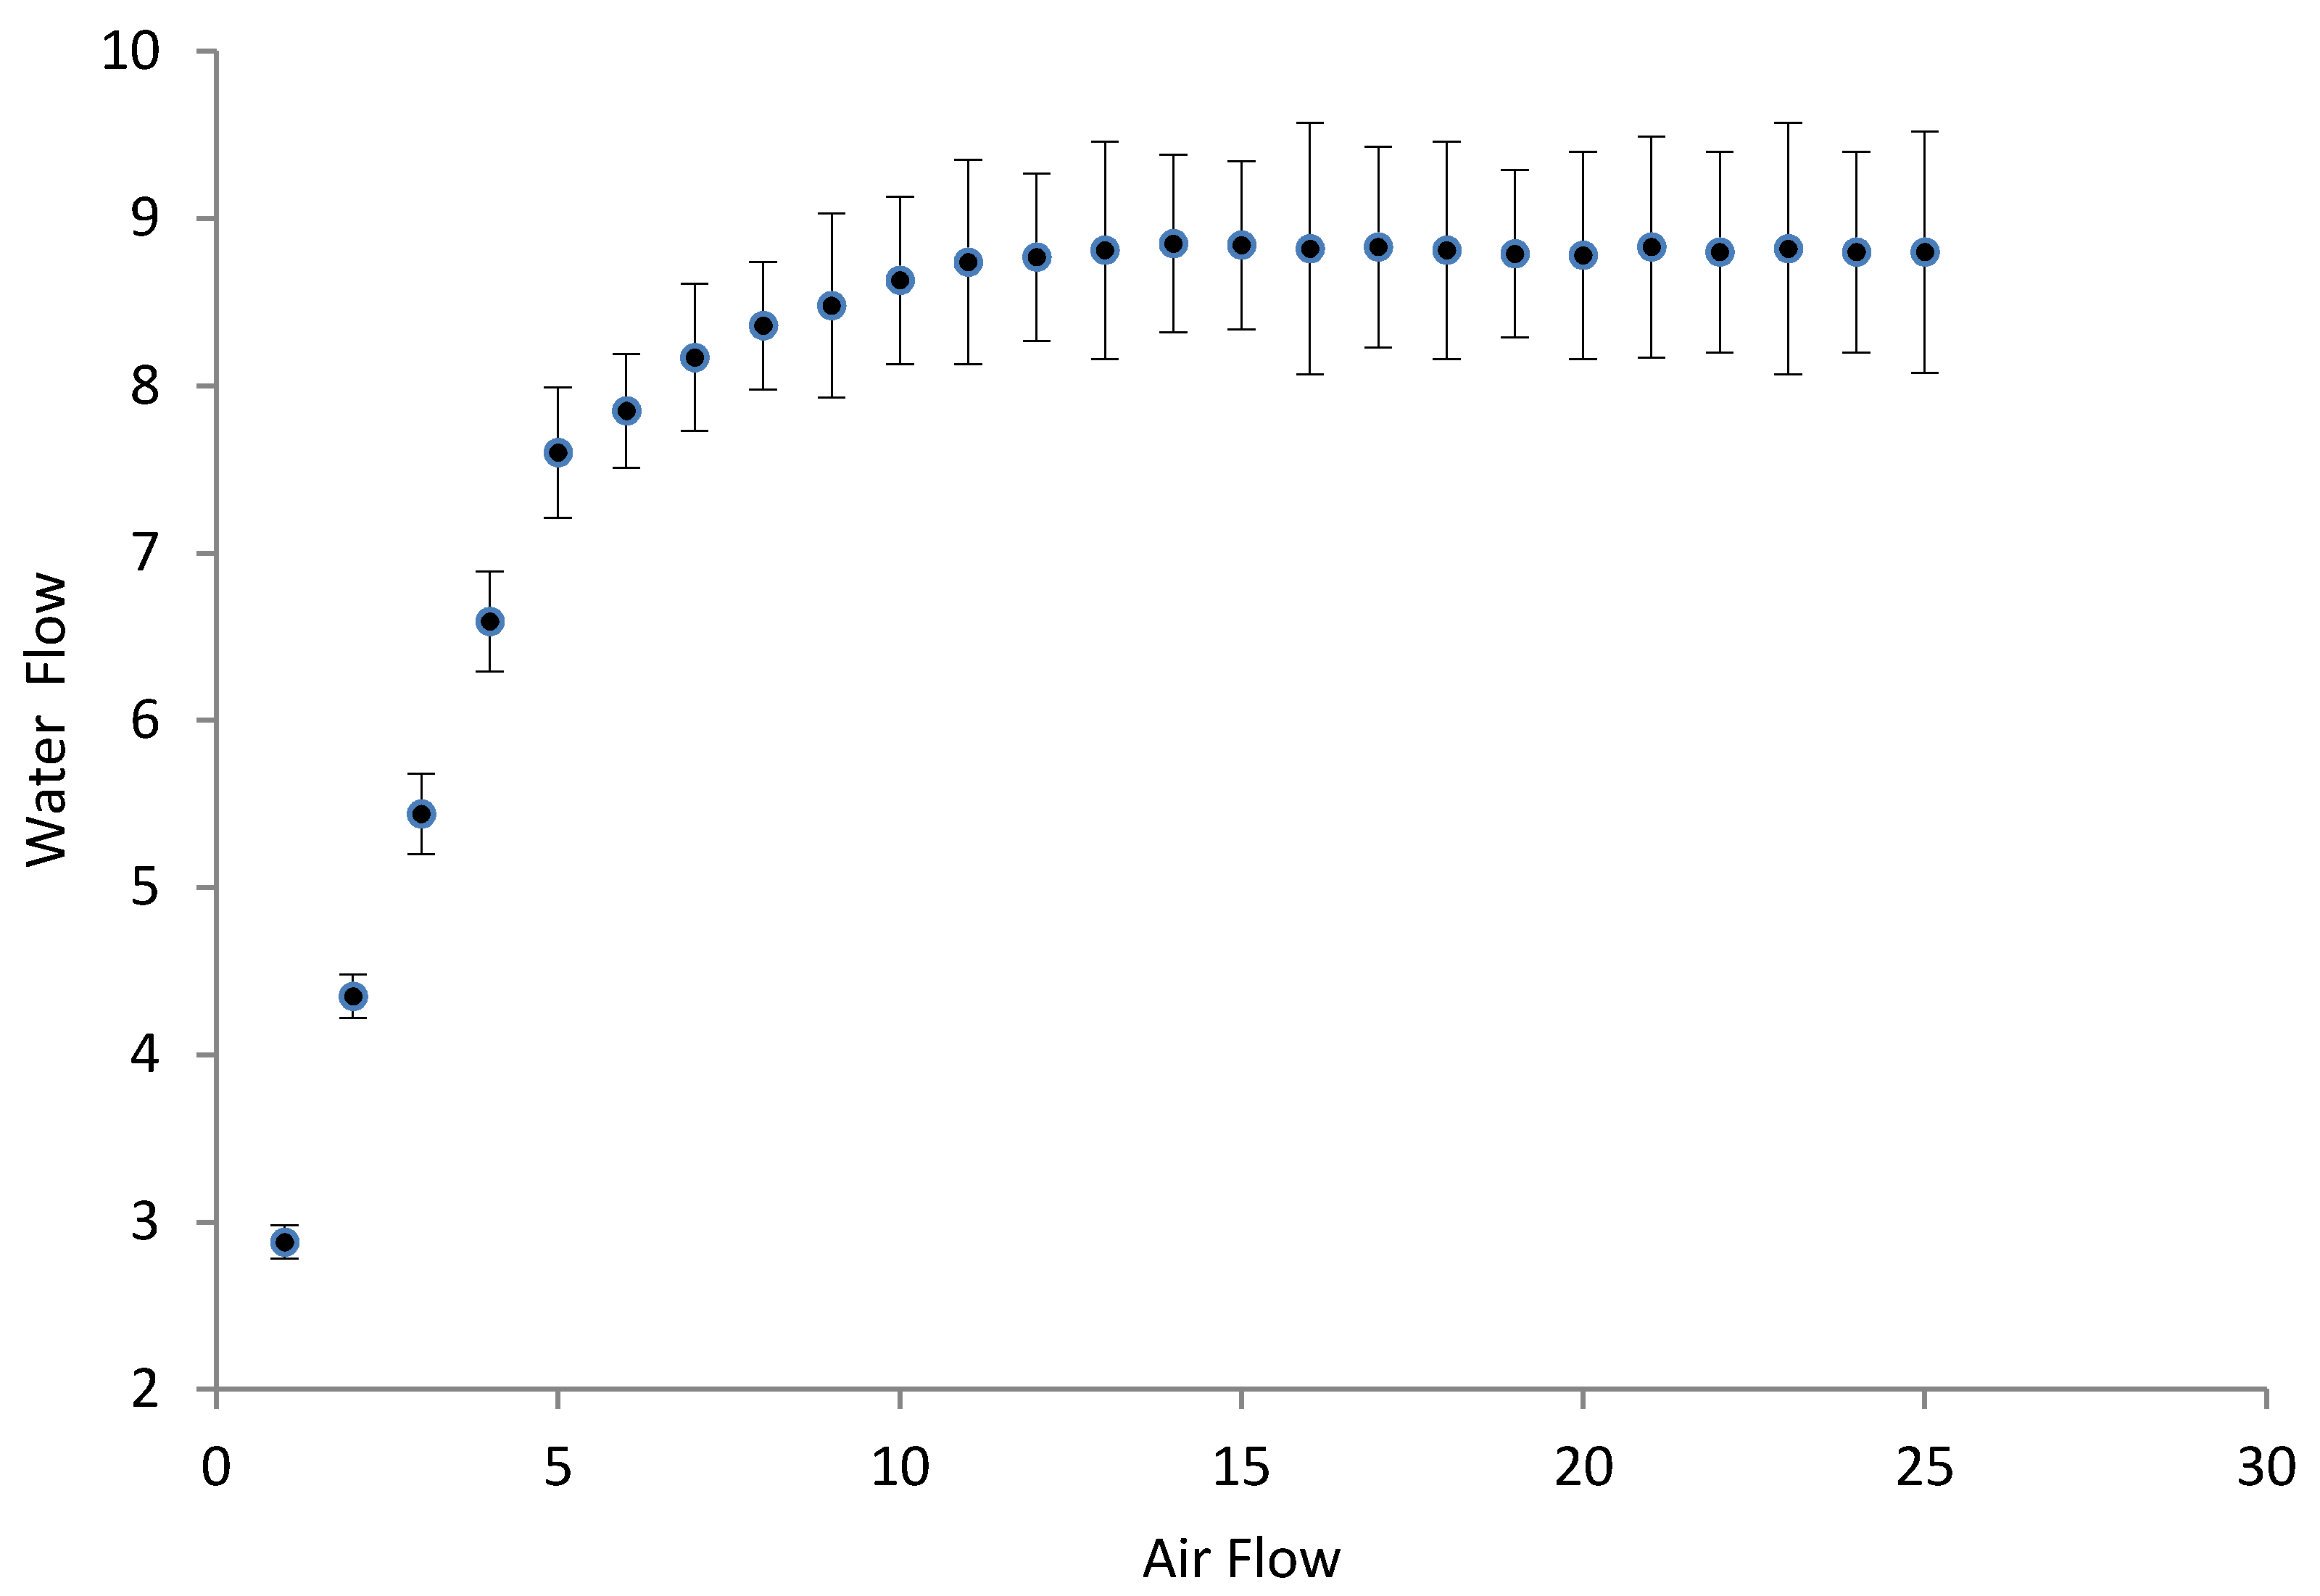
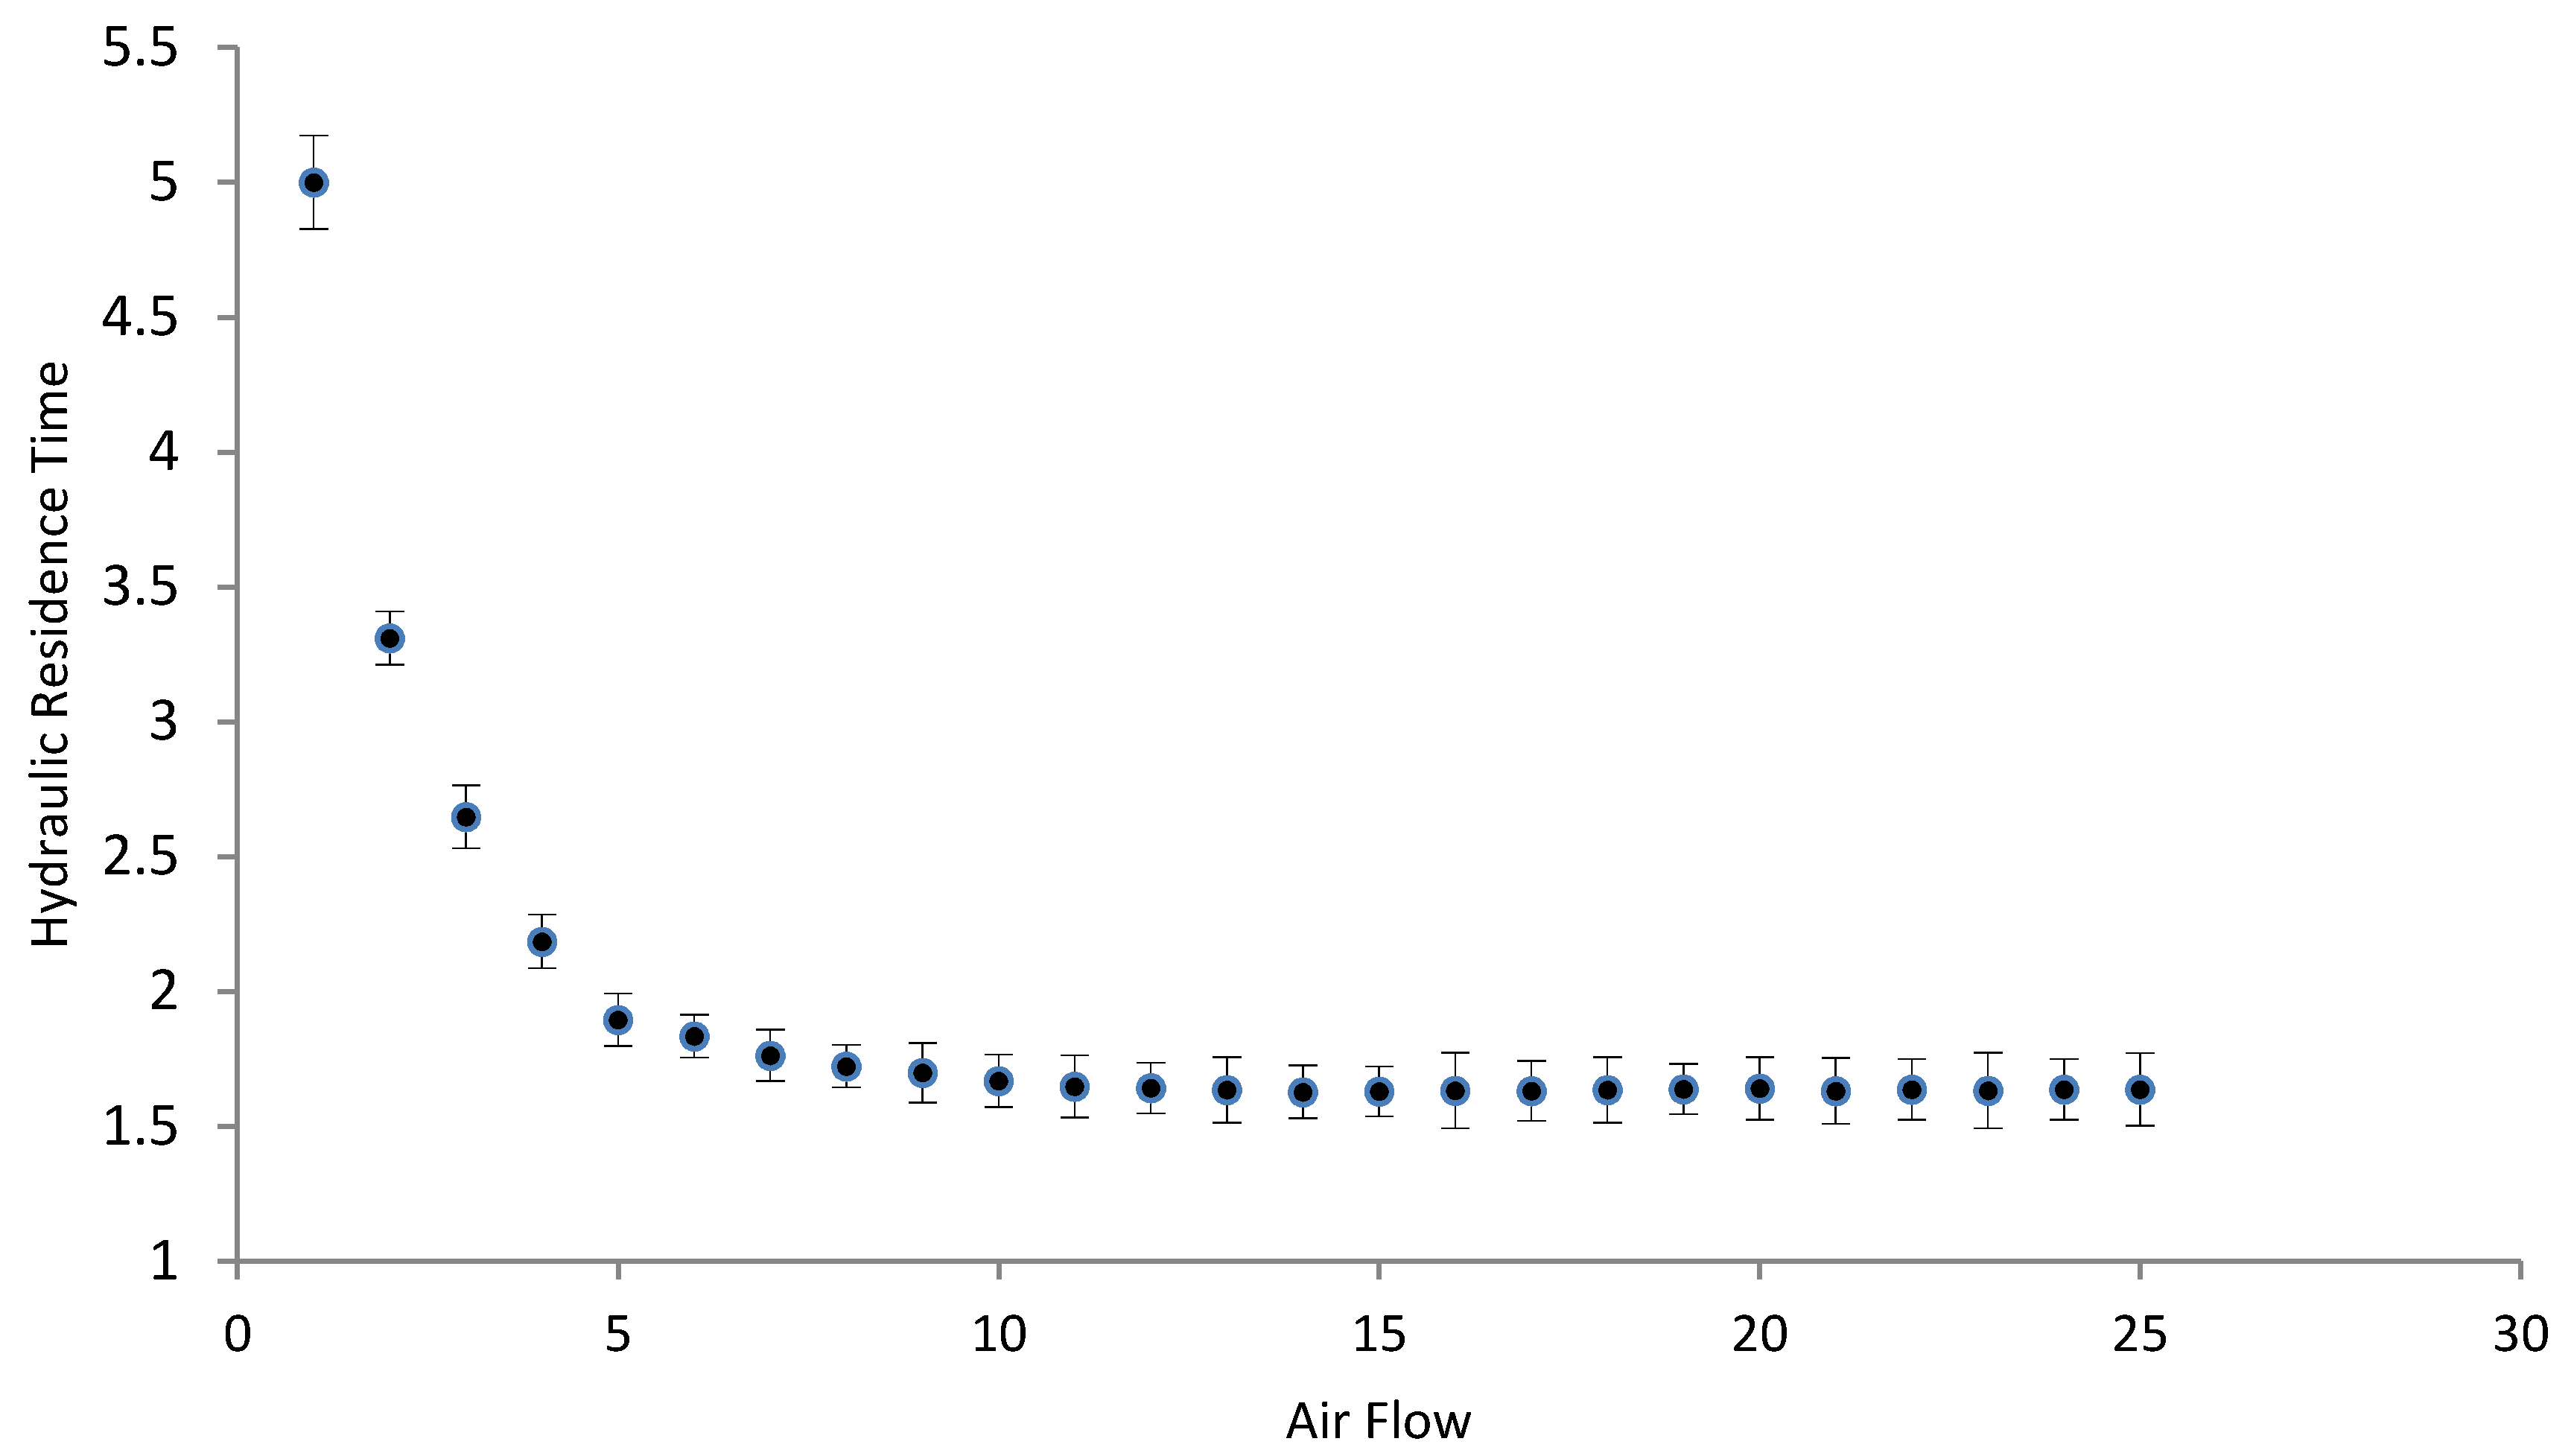
3.2. Hydrodynamic Tests

The results of the hydrodynamic tests are reported in Figure 5 and Figure 6.

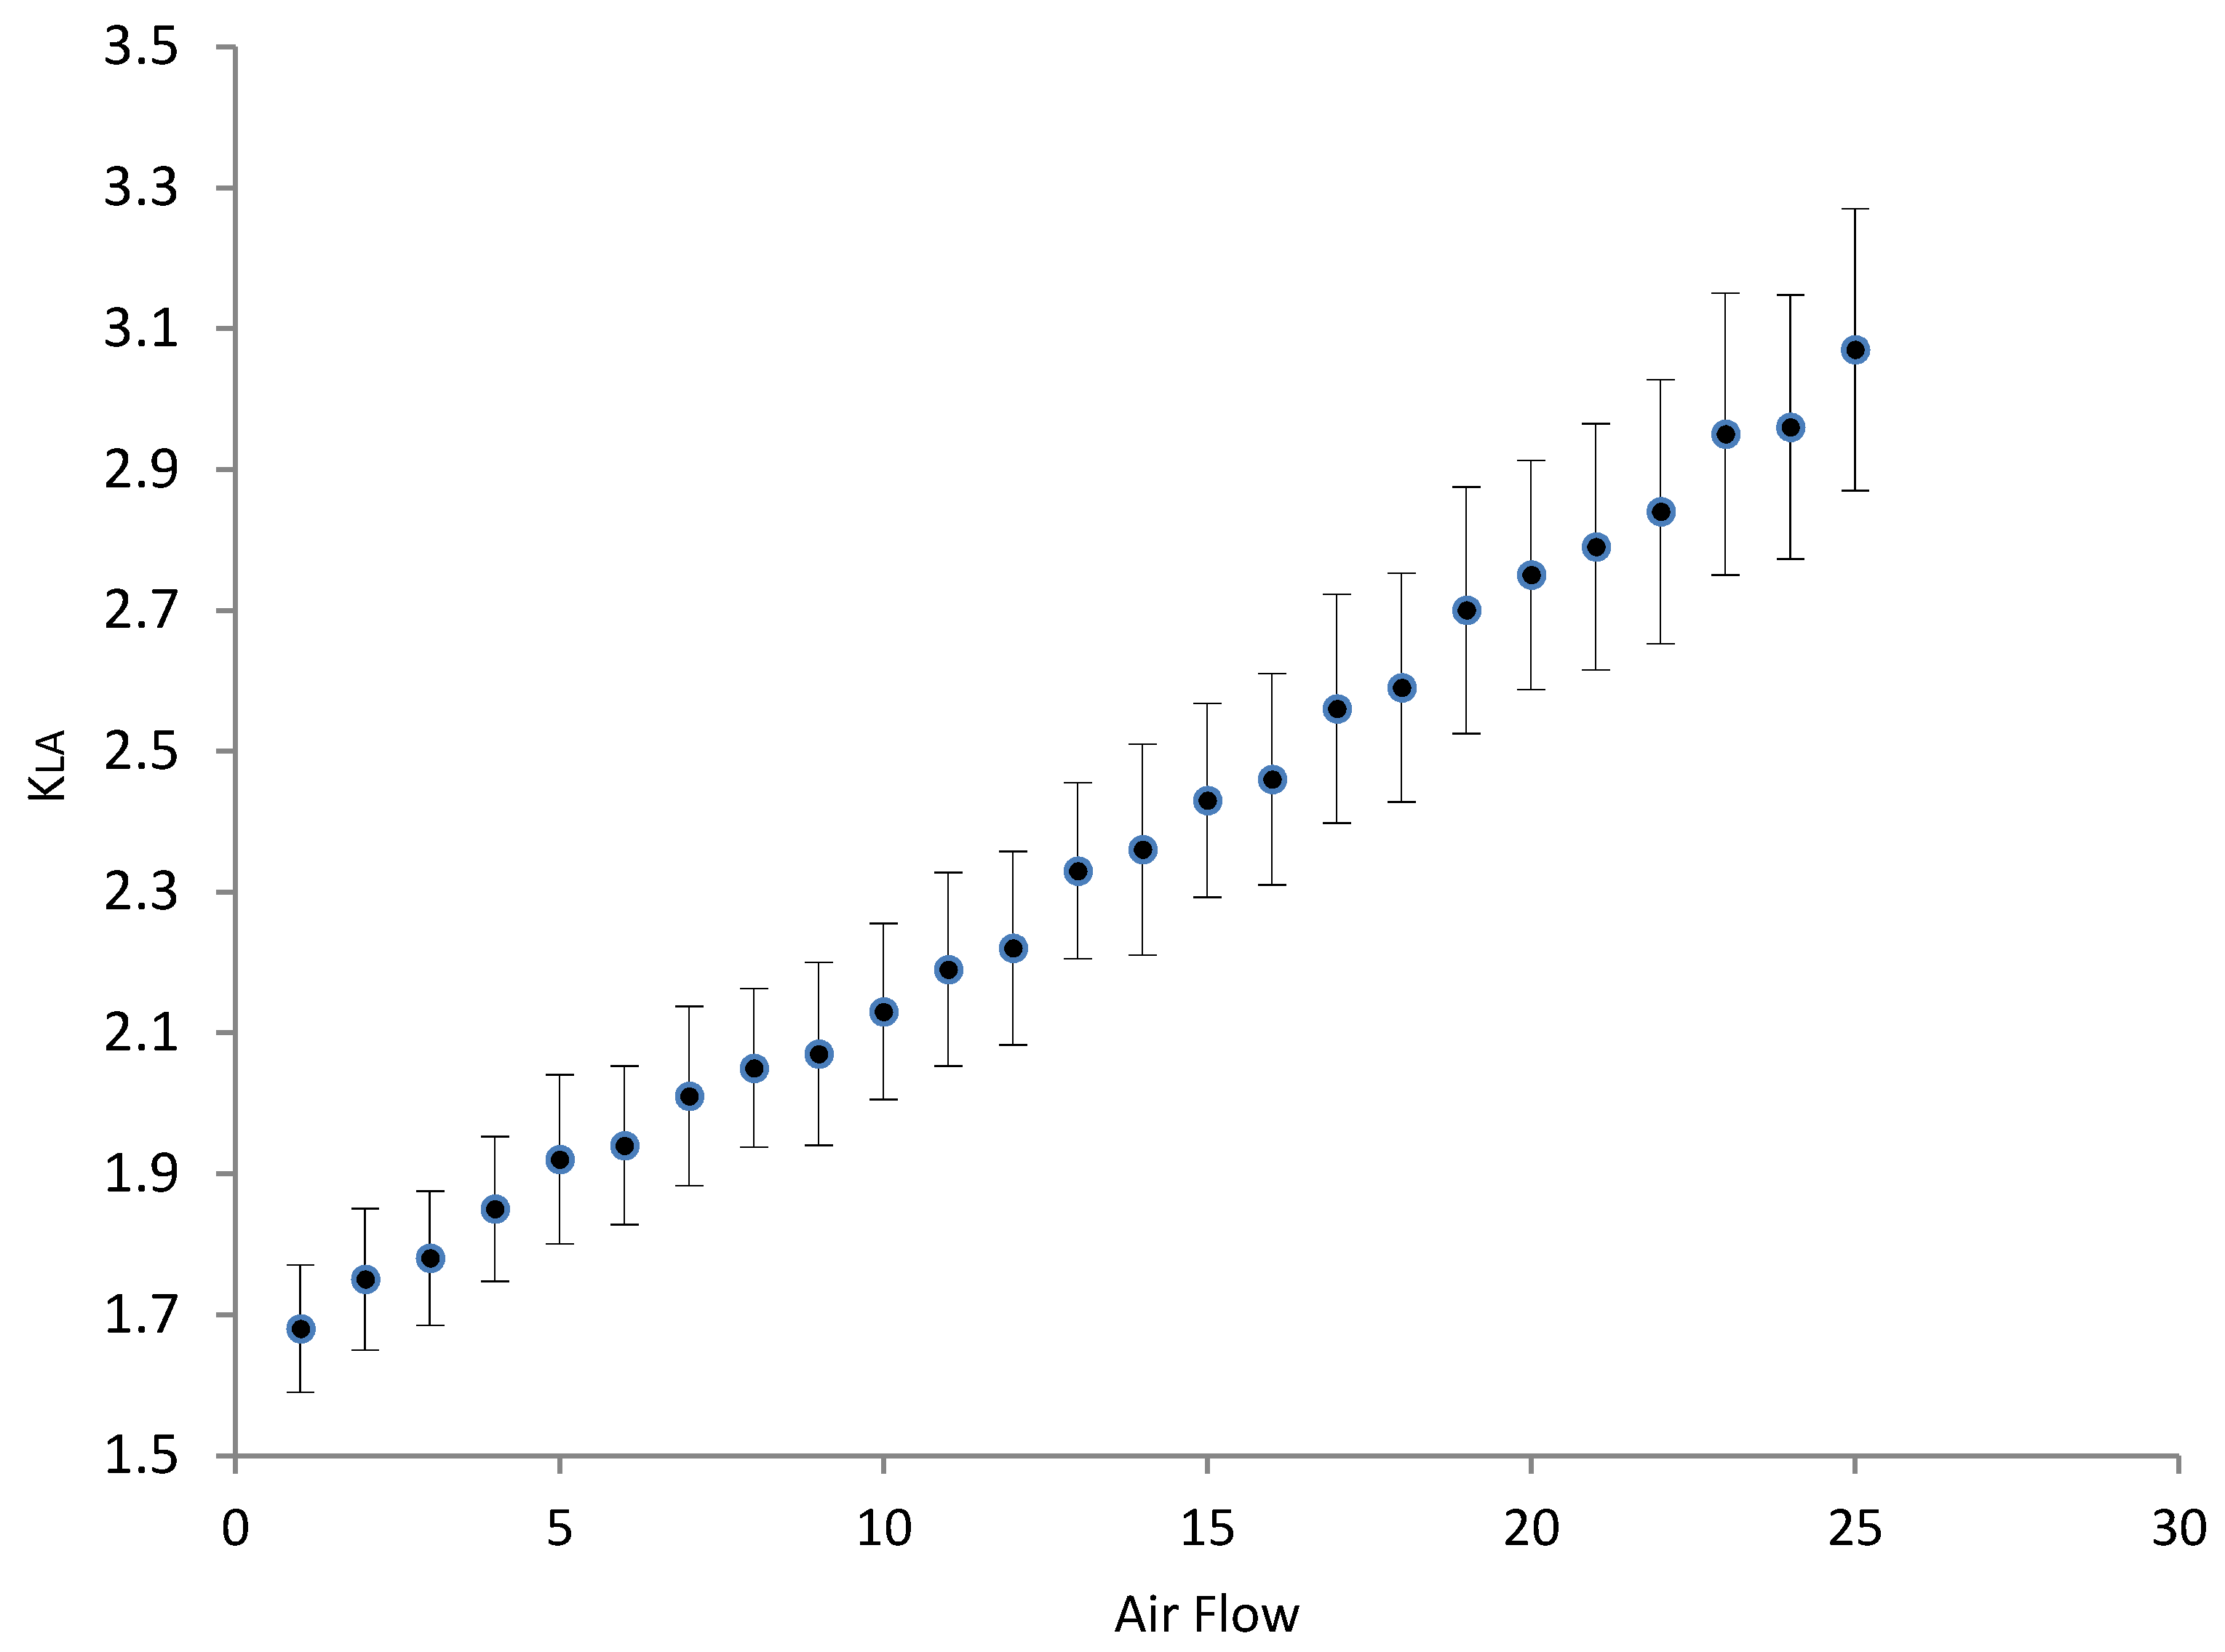
3.3. Oxygenation/Aeration Tests

From the data collected and appropriately averaged and elaborated, the three parameters KLa (measured in s−1) [16], OC (measured in kg of O2 per hour) [3], and OE% [23], which are useful to characterize the mini-MODUS behavior, were calculated (taking into account the temperature fluctuations) and graphed [16] as it can be seen here below in Figure 7, Figure 8 and Figure 9.
Some observations can be made. First of all, it is interesting to note that in the diagrams in Figure 7 and Figure 8, no plateau was observed [3,18,24,25]. This would likely suggest that the hydraulic behavior does not influence the aeration performance in a simple way. Second, the KLa behavior seems to be quite linear, which we found to be a common occurrence in the literature [16,18,22,25,26].

4. Discussion

The aim of the MODUS technology is to create a highly oxidized natural covering of the contaminated sediment (bio-ox-capping) by oxygenating the deep water present above the sediment without perturbing it. This would greatly favor the colonization of animals and benthic microorganisms, which will permit a definitive return of life to the sea sediment [4]. In order to prevent sediment perturbation, the technology here proposed would allow the contaminated sediments to be maintained unperturbed in situ while oxygenated water flows tangentially to it, as shown by our turbulence tests reported in Figure 3 and Figure 4. The experiments indicated that, even at the maximum possible water flow, no sediment resuspension was ever observed.
On the other hand, Figure 5 and Figure 6 show an interesting behavior of the mini-MODUS. First, the mini-MODUS appeared to work at very low levels of air flow [12,13,14,27,28]; an air flow of 1 L min−1 still produced a water flow of about 3 L min−1. Second, at the beginning, an increase in air flow produced a sharp linear increase [14] of water flow (Figure 5) and the induced water flow was systematically superior to the corresponding air flow (e.g., an air flow of 5 L min−1 generates a water flow of about 7.5 L min−1) [3,13,14,27]. This would likely suggest that the dragging effect (water pulled by air) was very strong. A third point can be said on the fact that despite the initial sharp linear increase, a plateau was quickly reached, and beyond an air flow of about 11 L min−1, no increase of water flow above about 9 L min1 was ever observed [12,13,14]. All these represent fundamental aspects of the mini-MODUS’s behavior that would probably be crucial in the design of a larger scale MODUS (for example on “pilot-plant” scale). The consequence of the presence of the water flow plateau is that the residence time (Figure 6) also experiences a horizontal segment beyond 11 L min−1. Indeed, from this air flow, the residence times do not decrease below 1.6 s.
The presence of the water flow plateau displayed in Figure 5 should guarantee that sediment resuspension is excluded, even if air flow is increased beyond 25 L min−1. The existence of such a water flow plateau can probably be rationalized, assuming that at strong air flows, the air occupies a large part of the oxygenation reactor, leaving a smaller volume for the water: the air–water mixture will be composed mainly of air while resulting poor in water, and so the ensuing water flow will be lowered. On the other hand, there could also be a dragging effect and the compromise between these two forces could be the plateau (beyond ca. 11 L min−1 of air flow) observed in the diagram. The consequent residence time plateau, from a practical point of view, means that for a certain specific geometry of the equipment and for given experimental conditions, an increase in the air flow does not produce a reduction of the residence time, for example, of polluted water. This is important because different residence times imply different contact times between air and water and therefore the possibility of having oxygen exchange between air and water: the presence of the horizontal segment assures that there will always be enough time for such an exchange. However, a better description of what happened in the aeration reactor will be provided by the oxygenation tests that were aimed to find the best oxygenation conditions. The three diagrams depicted in Figure 7, Figure 8 and Figure 9 provide some glimpse on the mini-MODUS behavior at a deeper level. Assuming KLa is linear within the considered air flow intervals, OC should also be linear [3], despite more noise added to the OC with respect to KLa due to Cs variations as a consequence of temperature fluctuations. In the hypothesis of KLa linearity, we can apply a linear regression to find the best fit, which would be y = m1x + q1 where x = air flow and y = KLa. Such a linear regression produced the following figures: m1 = 0.0566 10−4 min L−1 s−1 and q1 = 1.5988 10−4 s−1with R12 = 0.9947. As m1 and q1 are independent from the air flow, we suggest that these parameters can be used to characterize a specific equipment once fixed with certain “standard conditions” (for example: tap water, 20 °C, 1 atm of atmospheric pressure, etc.). If we also apply the linear regression to OC, we obtain m2 = 0.0843 10−3 kg min h−1 L−1 and q2 = 2.5394 10−3 kg h−1 with R22 = 0.9884. On the other hand, while an air flow increase results in an increase in both KLa and OC, vice versa the OE% decreases. Interestingly, similar to the residence time, OE% does not tend to zero for increasing air flows, but instead seems to reach a “plateau value”, this time beyond the air flow of ca. 25 L min−1. This is probably because the expression of OE is of the kind y = (m2x + q2)/kx, where y = OE, m2x + q2 = OC (in kg h−1), and kx = O2int (where k = 0.017957142 min kg L−1 h−1, x = air flow in L min−1, and so kx will be expressed in kg h−1). Therefore, when x→∞, it is y→m2/k = 4.7 10−3, which is 0.47% (i.e., in theory OE% would tend asymptotically to be 0.47%). However, it is necessary to point out that OE% ≠ y = (m2x + q2)/kx inasmuch, for example, for x→0 it is y→∞ while, obviously, OE% cannot overstep 100%. Therefore, a possible overlap between OE% and y = (m2x + q2)/kx should be considered as limited to an air flow interval of 1–25 L min−1 and not too far beyond it.
Together with the presence of the aforementioned water flow plateau, the KLa, OC, and OE% behaviors are also fundamental for the design of MODUS (at any scale). In addition, it is clear that the best working conditions (i.e., the better air flow) are a compromise between high KLa and OC, without the disadvantageous OE%. However, a compromise should be reached on a different basis of energy demand, and most importantly, the biological oxygen demand (BOD) reduction rate, for example, in polluted water. In fact, residence time together with oxygen concentration is crucial to determine the BOD reduction rate, while, on the other hand, the maximum BOD tolerated at the exit mouth will also be fundamental for both the MODUS design and the choice of the best air flow as well. Other subjects of further study could be the optimization of the speed at which a real scale MODUS should move with respect to the seabed in order to optimize bottom water oxygenation. This would probably depend on the different environments as well as their level of pollution. This issue will be addressed when a real scale MODUS will be built and tested in Guanabara Bay as already programmed in the framework of the TAGUBAR project. A further question could be addressed: How long would the aeration be needed in a real environment to oxygenate the bottom of a lake, sea loch, or lagoon (even in presence of water currents) in order to accomplish the formation of a bio-oxi layer on the top of the sediment? Other interesting topics could be the investigation of energy efficiency and the costs of MODUS construction and maintenance. The output of the TAGUBAR project will determine whether or not it is both technically and economically feasible. The literature seems to tell us that this is the most promising technology, which is why the Brazilian and Italian Governments have bet on it. If the results are successful for Guanabara Bay, we hope that they can also be applied to other cases of severely polluted sediments in aquatic ecosystems. However, these important aspects will not be addressed here as they will be the topic of the next paper.

Author Contributions

G.P. had the original idea for the study and was responsible for data collection, F.R. was responsible for data analysis, A.G. drafted the manuscript, and F.P. reviewed it. All authors have read and agreed to the published version of the manuscript.

Funding

This research received no external funding.

Acknowledgments

We are thankful to the Italian “Ministero degli Esteri d’Italia-Direzione Generale per la Cooperazione allo Sviluppo”-Rome (Italy) and the “IUCN-International Union for the Nature Conservation”-Gland (Switzerland). We are particularly indebted to Miss Luisa Witney and to Miss Caterina Floretta (both English native speakers) for revising the manuscript.

Conflicts of Interest

The authors declare no conflicts of interest.

References

  1. Huang, J.-C.; Shi, T.-L.; Wen, G.; Liu, F.; Qiu, X.-P.; Wang, B.-S. The Variation Characteristic of Sulfides and VOSc in a Source Water Reservoir and Its Control Using a Water-Lifting Aerator. Int. J. Environ. Res. Public Health 2016, 13, 427. [Google Scholar]
  2. Chern, J.M.; Yu, C.F. Volatile organic compound emission from diffused aeration systems: Experiment and modeling. Ind. Eng. Chem. Res. 1999, 38, 2156–2159. [Google Scholar] [CrossRef]
  3. Loyless, J.C.; Malone, R.F. Evaluation of air-lift pump capabilities for water delivery, aeration and degasification for application to recirculating aquaculture systems. Aquac. Eng. 1998, 18, 117–133. [Google Scholar] [CrossRef]
  4. Soltero, R.A.; Sexton, L.M.; Ashley, K.I.; McKee, K.O. Partial and full lift hypolimnetic aeration of medical Lake, WA to improve water quality. Water Res. 1994, 28, 2297–2308. [Google Scholar] [CrossRef]
  5. Shimizu, K.; Takada, S.; Minekawa, K.; Kawase, Y. Phenomenological model for bubble column reactors prediction of gas hold-ups and volumetric mass transfer coefficients. Chem. Eng. J. 2000, 78, 21–28. [Google Scholar] [CrossRef]
  6. Nakamura, Y.; Inoue, T. A theoretical study on operational condition of hypolimnetic aerators. Water Sci. Technol. 1996, 34, 211–218. [Google Scholar] [CrossRef]
  7. Vickie, L.; Singleton, J.; Little, C. Designing Hypolimnetic Aeration and Oxygenation Systems—A Review. Environ. Sci. Technol. 2006, 4024, 7512–7520. [Google Scholar]
  8. Shuklaa, B.K.; Goel, A. Study on oxygen transfer by solid jet aerator with multiple openings. Eng. Sci. Technol. 2018, 21, 255–260. [Google Scholar] [CrossRef]
  9. Zhang, Q.; Liu, S.; Yang, C.; Chen, F.; Lu, S. Bioreactor consisting of pressurized aeration and dissolved air flotation for domestic wastewaters. Sep. Purif. Technol. 2014, 138, 186–190. [Google Scholar] [CrossRef]
  10. Research and Development Office Science and Technology Program. Top-Down Water Storage Mixing Systems Scoping Report, Final Report No. ST-2016-6415-01. 2016. Available online: https://www.google.com.sg/url?sa=t&rct=j&q=&esrc=s&source=web&cd=1&cad=rja&uact=8&ved=2ahUKEwi46LC58ajoAhUCCqYKHV0DCRMQFjAAegQIBRAB&url=https%3A%2F%2Fwww.usbr.gov%2Fresearch%2Fprojects%2Fdownload_product.cfm%3Fid%3D2495&usg=AOvVaw2diCkUCDLU-Rw2vEkCrmHy (accessed on 13 November 2019).
  11. Punnett, R.E. Design and Operation of Axial Flow Pumps for Reservoir Destratification; US Army Corps of Engineers: Washington, DC, USA, 1991.
  12. Khalil, M.F.; Elshorbagy, K.A.; Kassab, S.Z.; Fahmy, R.I. Effect of air injection method on the performance of an air lift pump. Int. J. Heat Fluid Flow 1999, 20, 598–604. [Google Scholar] [CrossRef]
  13. Couvert, A.; Roustan, M.; Chatellier, P. Two-phase hydrodynamic study of a rectangular air-lift loop reactor with an internal baffle. Chem. Eng. Sci. 1999, 54, 5245–5252. [Google Scholar] [CrossRef]
  14. Couvert, A.; Bastoul, D.; Roustan, M.; Line, A.; Chatellier, P. Prediction of liquid velocity and gas hold-up in rectangular air-lift reactors of different scales. Chem. Eng. Process. 2001, 40, 113–119. [Google Scholar] [CrossRef]
  15. Camarasa, E.; Meleiro, L.A.C.; Carvalho, E.; Domingues, A.; Maciel Filho, R.; Wild, G.; Poncin, S.; Midoux, N.; Bouillard, J. A Complete model for oxidation air-lift reactors. Computers and Chemical Engineering 2001, 25, 577–584. [Google Scholar] [CrossRef]
  16. Bekassy–Molnar, E.; Majeed, J.G.; Vatai, G. Overall volumetric oxygen transfer coefficient and optimal geometry of airlift tube reactor. Chem. Eng. J. 1997, 68, 29–33. [Google Scholar] [CrossRef]
  17. Dudley, J. Mass transfer in bubble columns: A comparison of correlations. Water Res. 1995, 29, 1129–1138. [Google Scholar] [CrossRef]
  18. Drandev, S.; Penev, K.I.; Karamanev, D. Study of the hydrodynamics and mass transfer in a rectangular air-lift bioreactor. Chem. Eng. Sci. 2016, 146, 180–188. [Google Scholar] [CrossRef]
  19. Parkhill, K.L.; Gulliver, J.S. Indirect measurement of oxygen solubility. Water Res. 1997, 31, 2564–2572. [Google Scholar] [CrossRef]
  20. Chern, J.M.; Yu, C.F. Oxygen transfer modeling of diffused aeration systems. Ind. Eng. Chem. Res. 1997, 36, 5447–5453. [Google Scholar] [CrossRef]
  21. Oliveira, M.E.C.; Franca, A.S. Simulation of oxygen transfer in aeration systems. Int. Commun. Heat Mass Transf. 1998, 25, 853–862. [Google Scholar] [CrossRef]
  22. Lee, J. Development of a model to determine mass transfer. Heliyon 2017, 3, e00248. [Google Scholar] [CrossRef] [Green Version]
  23. Gillot, S.; Heduit, A. Effect of air flow rate on oxygen transfer in an oxidation ditch equipped with fine bubble diffusers and slow speed mixers. Water Res. 2000, 34, 1756–1762. [Google Scholar] [CrossRef]
  24. Morchain, J.; Maranges, C.; Fonade, C. CFD modelling of two-phase jet aerator under influence of a crossflow. Water Res. 2000, 34, 3460–3472. [Google Scholar] [CrossRef]
  25. Moraveji, M.K.; Fakhari, M.E.; Mohsenzadeh, E.; Davarnejad, R. Hydrodynamics and oxygen mass transfer in a packed bed split-cylinder airlift reactor containing dilute alcoholic solutions. Heat Mass Transf. 2013, 49, 11–19. [Google Scholar] [CrossRef]
  26. Chisti, Y.; Jauregui-Haza, U.J. Oxygen transfer and mixing in mechanically agitated airlift bioreactors. Biochem. Eng. J. 2002, 10, 143–153. [Google Scholar] [CrossRef] [Green Version]
  27. Camarasa, E.; Carvalho, E.; Meleiro, L.A.C.; Maciel Filho, R.; Domingues, A.; Wild, G.; Poncin, S.; Midoux, N.; Bouillard, J. A hydrodynamic model for air-lift reactors. Chem. Eng. Process. 2001, 40, 121–128. [Google Scholar] [CrossRef]
  28. Camarasa, E.; Carvalho, E.; Meleiro, L.A.C.; Maciel Filho, R.; Domingues, A.; Wild, G.; Poncin, S.; Midoux, N.; Bouillard, J. Development of a complete model for an air-lift reactor. Chem. Eng. Sci. 2001, 56, 493–502. [Google Scholar] [CrossRef]
Figure 1. Schematic representation of the bench-scale module for the decontamination of units of sediment (mini-MODUS). Legend: (1) “water out” sampling point, (2) ground glass joint (conically tapered joint), (3) degassing chamber chimney, (4) grids, (5) air-lift reactor (oxygenation/aeration reactor) filled with Rashig rings, (6) sparger, and (7) “water in” sampling point.
Environments 07 00023 g001
Figure 2. Main parts of the mini-MODUS glass components: (a) entrance/exit mouth, (b) oxygenation reactor filled with Rashig rings, (c) degassing chamber, and (d) sparger.
Environments 07 00023 g002aEnvironments 07 00023 g002b
Figure 3. Turbulence test for the mini-MODUS inlet mouth. Using a pipette, a few dye drops were put just in front of the mini-MODUS entrance (water in) in order to make the water flow detectable. The influence of the water flow due to the air lift pumping was localized only very close to the mouth. The water results unaffected in the immediate proximity below the mouth. The figure shows no disturbance of the sediment at a 9 L min−1 water flow. The time elapsed between each frame (shot from left to right) was half a second.
Environments 07 00023 g003
Figure 4. Turbulence test for the mini-MODUS exit mouth. Using a pipette (which can be seen in both frames), a few dye drops were put just in front of the mini-MODUS exit (water out) in order to make the water flow detectable. The influence of the water flow due to the air lift pumping was localized only very close to the mouth. The water results unaffected in the immediate proximity below the mouth. The figure shows no disturbance of the sediment at 9 L min−1 water flow. The time elapsed between these two frames (shot from left to right) was half a second.
Environments 07 00023 g004
Figure 5. Water flow (L min−1) in the ordinate vs. air flow (L min−1) in the abscissa.
Environments 07 00023 g005
Figure 6. Hydraulic residence time (s) within the aeration reactor in the ordinate vs. air flow (L min−1) in the abscissa.
Environments 07 00023 g006
Figure 7. The oxygen global transfer coefficient KLa (s−1) values (normalized at 20 °C) in the ordinate vs. air flow (L min−1) in the abscissa. The ordinate values were multiplied by 104.
Environments 07 00023 g007
Figure 8. The oxygenation capacity OC (kg O2 h−1) in the ordinate vs. air flow (L min−1) in the abscissa. The ordinate values were multiplied by 103.
Environments 07 00023 g008
Figure 9. The oxygenation efficiency OE% in the ordinate vs. air flow (L min−1) in the abscissa.
Environments 07 00023 g009

