Article

A New Multi-Index Method for the Eutrophication Assessment in Transitional Waters: Large-Scale Implementation in Italian Lagoons

1
ISPRA, Italian National Institute for Environmental Protection and Research, Località Brondolo 5, 30015 Chioggia, Italy
2
Regional Agency for Environmental Protection in the Emilia-Romagna Region (ARPAE), Daphne Oceanographic Structure, Viale Amerigo Vespucci, 47042 Cesenatico, Italy
3
Environmental Prevention and Protection Agency of the Veneto Region, Via Ospedale Civile, 35121 Padua, Italy
4
Apulian Regional Agency for the Environmental Prevention and Protection, Corso Trieste, 70126 Bari, Italy
5
Regional Agency for Environmental Protection of Friuli Venezia Giulia Region, Via Cairoli, 33057 Palmanova, Italy
6
Sardinian Environmental Protection Agency, Via Contivecchi, 09122 Cagliari, Italy
7
Department of Environmental Sciences, Informatics & Statistics, University Ca’ Foscari Venice, Via Torino, 30123 Mestre, Italy
8
Department of Chemistry, Life Sciences and Environmental Sustainability, University of Parma, Parco Area delle Scienze 11/a, 43121 Parma, Italy
*
Author to whom correspondence should be addressed.
Environments 2022, 9(4), 41; https://doi.org/10.3390/environments9040041
Submission received: 7 February 2022 / Revised: 10 March 2022 / Accepted: 18 March 2022 / Published: 24 March 2022

Abstract

:
Eutrophication represents one of the most impacting threats for the ecological status and related ecosystem services of transitional waters; hence, its assessment plays a key role in the management of these ecosystems. A new multi-index method for eutrophication assessment, based on the ecological index MaQI (Macrophyte Quality Index), the trophic index TWQI (Transitional Water Quality Index), and physicochemical quality elements (sensu Dir. 2000/60/EC), was developed including both driver and impact indicators. The study presents a large-scale implementation of the method, which included more than 100 Italian lagoon sites, covering a wide variability of lagoon typologies and conditions. Overall, 35% of sites resulted in eutrophic status, 45% in mesotrophic, and 25% in oligotrophic status.

1. Introduction

Eutrophication is widely recognized as one of the most impacting threats for the ecological status and integrity of transitional waters (TWs) [1]. In Europe, in recent decades, several policies have been adopted in the framework of EU legislation to prevent or attenuate the impacts of nutrient pollution and its consequences on aquatic ecosystems [2]. Above all, the Urban Wastewater Treatment Directive (UWWT, 91/271/EEC) addresses the major point sources, and the Nitrates Directive (ND, 91/676/EEC) deals with diffuse pollution of nitrogen from agriculture. Through the assessment of eutrophication risk, both directives require the identification of “sensitive” and “vulnerable” areas, where mandatory measures (e.g., higher treatment requirements, fertilizer limitations) must be applied.
The monitoring and assessment of eutrophication play a key role in the protection of aquatic ecosystems. The development of smart and easy-to-use indicators, not requiring high sampling and analytic efforts [3,4], but effective in providing reliable detection of the trophic status and trend, remains an open issue. Indeed, on one hand, these indicators should be suitable for operational and large-scale applications, but on the other hand, whereas formally adopted, the results may have huge potential implications in terms of measures to carry out and of related costs.
Several indicators and indices are available for assessing trophic status in TWs [5,6,7,8,9], overcoming the previous approach based on the evaluation of single variables (e.g., nutrients or chlorophyll-a concentration, macroalgae blooms) that was demonstrated to be not a sufficient diagnostic tool under high spatial and temporal fluctuations [6,10,11]. In addition, since 2000, the Water Framework Directive (WFD, 2000/60/EC) implementation stimulated the development of a high number of indices based on the integrity of aquatic flora and fauna [12] that contribute to assessing the direct and indirect response to eutrophication [10] as a deviation from the reference conditions [1]. Phytoplankton, macroalgae, and angiosperms are biological quality elements [13,14,15] directly sensitive to nutrient enrichment, while macroinvertebrates [16,17] and fish fauna [18] are representative of the indirect effects of eutrophication in relation to oxygen depletion [2]. The use of WFD ecological classification in eutrophication assessments could enhance the quantification of “an undesirable disturbance of the balance of organisms present in the water and to the quality of the water concerned” (UWWT, Council Directive 91/271/EEC) that was recognized as an essential condition for there to be eutrophication [4] and was referenced therein, even in legal pronouncement [2], in addition to and in relationship with nutrient enrichment and accelerated growth of algae.
In the framework of an attempt to provide a unified conceptual framework to understand eutrophication across different policies, in this paper a multi-index method for transitional water eutrophication assessment (TWEAM) is proposed. The TWEAM method gathers a selection of WFD ecological status indicators and the multi-metric Transitional Water Quality Index [7], with the latter including the main causal factors of eutrophication (N and P concentrations), key primary producers (phytoplankton chlorophyll-a, benthic phanerogams, and macroalgal cover) and an indicator of eutrophication effects (dissolved oxygen saturation).
The study presents and discusses a large-scale implementation of the TWEAM method, applied to more than 100 Italian lagoon sites, covering a wide variability of lagoon typologies and conditions.

2. Materials and Methods
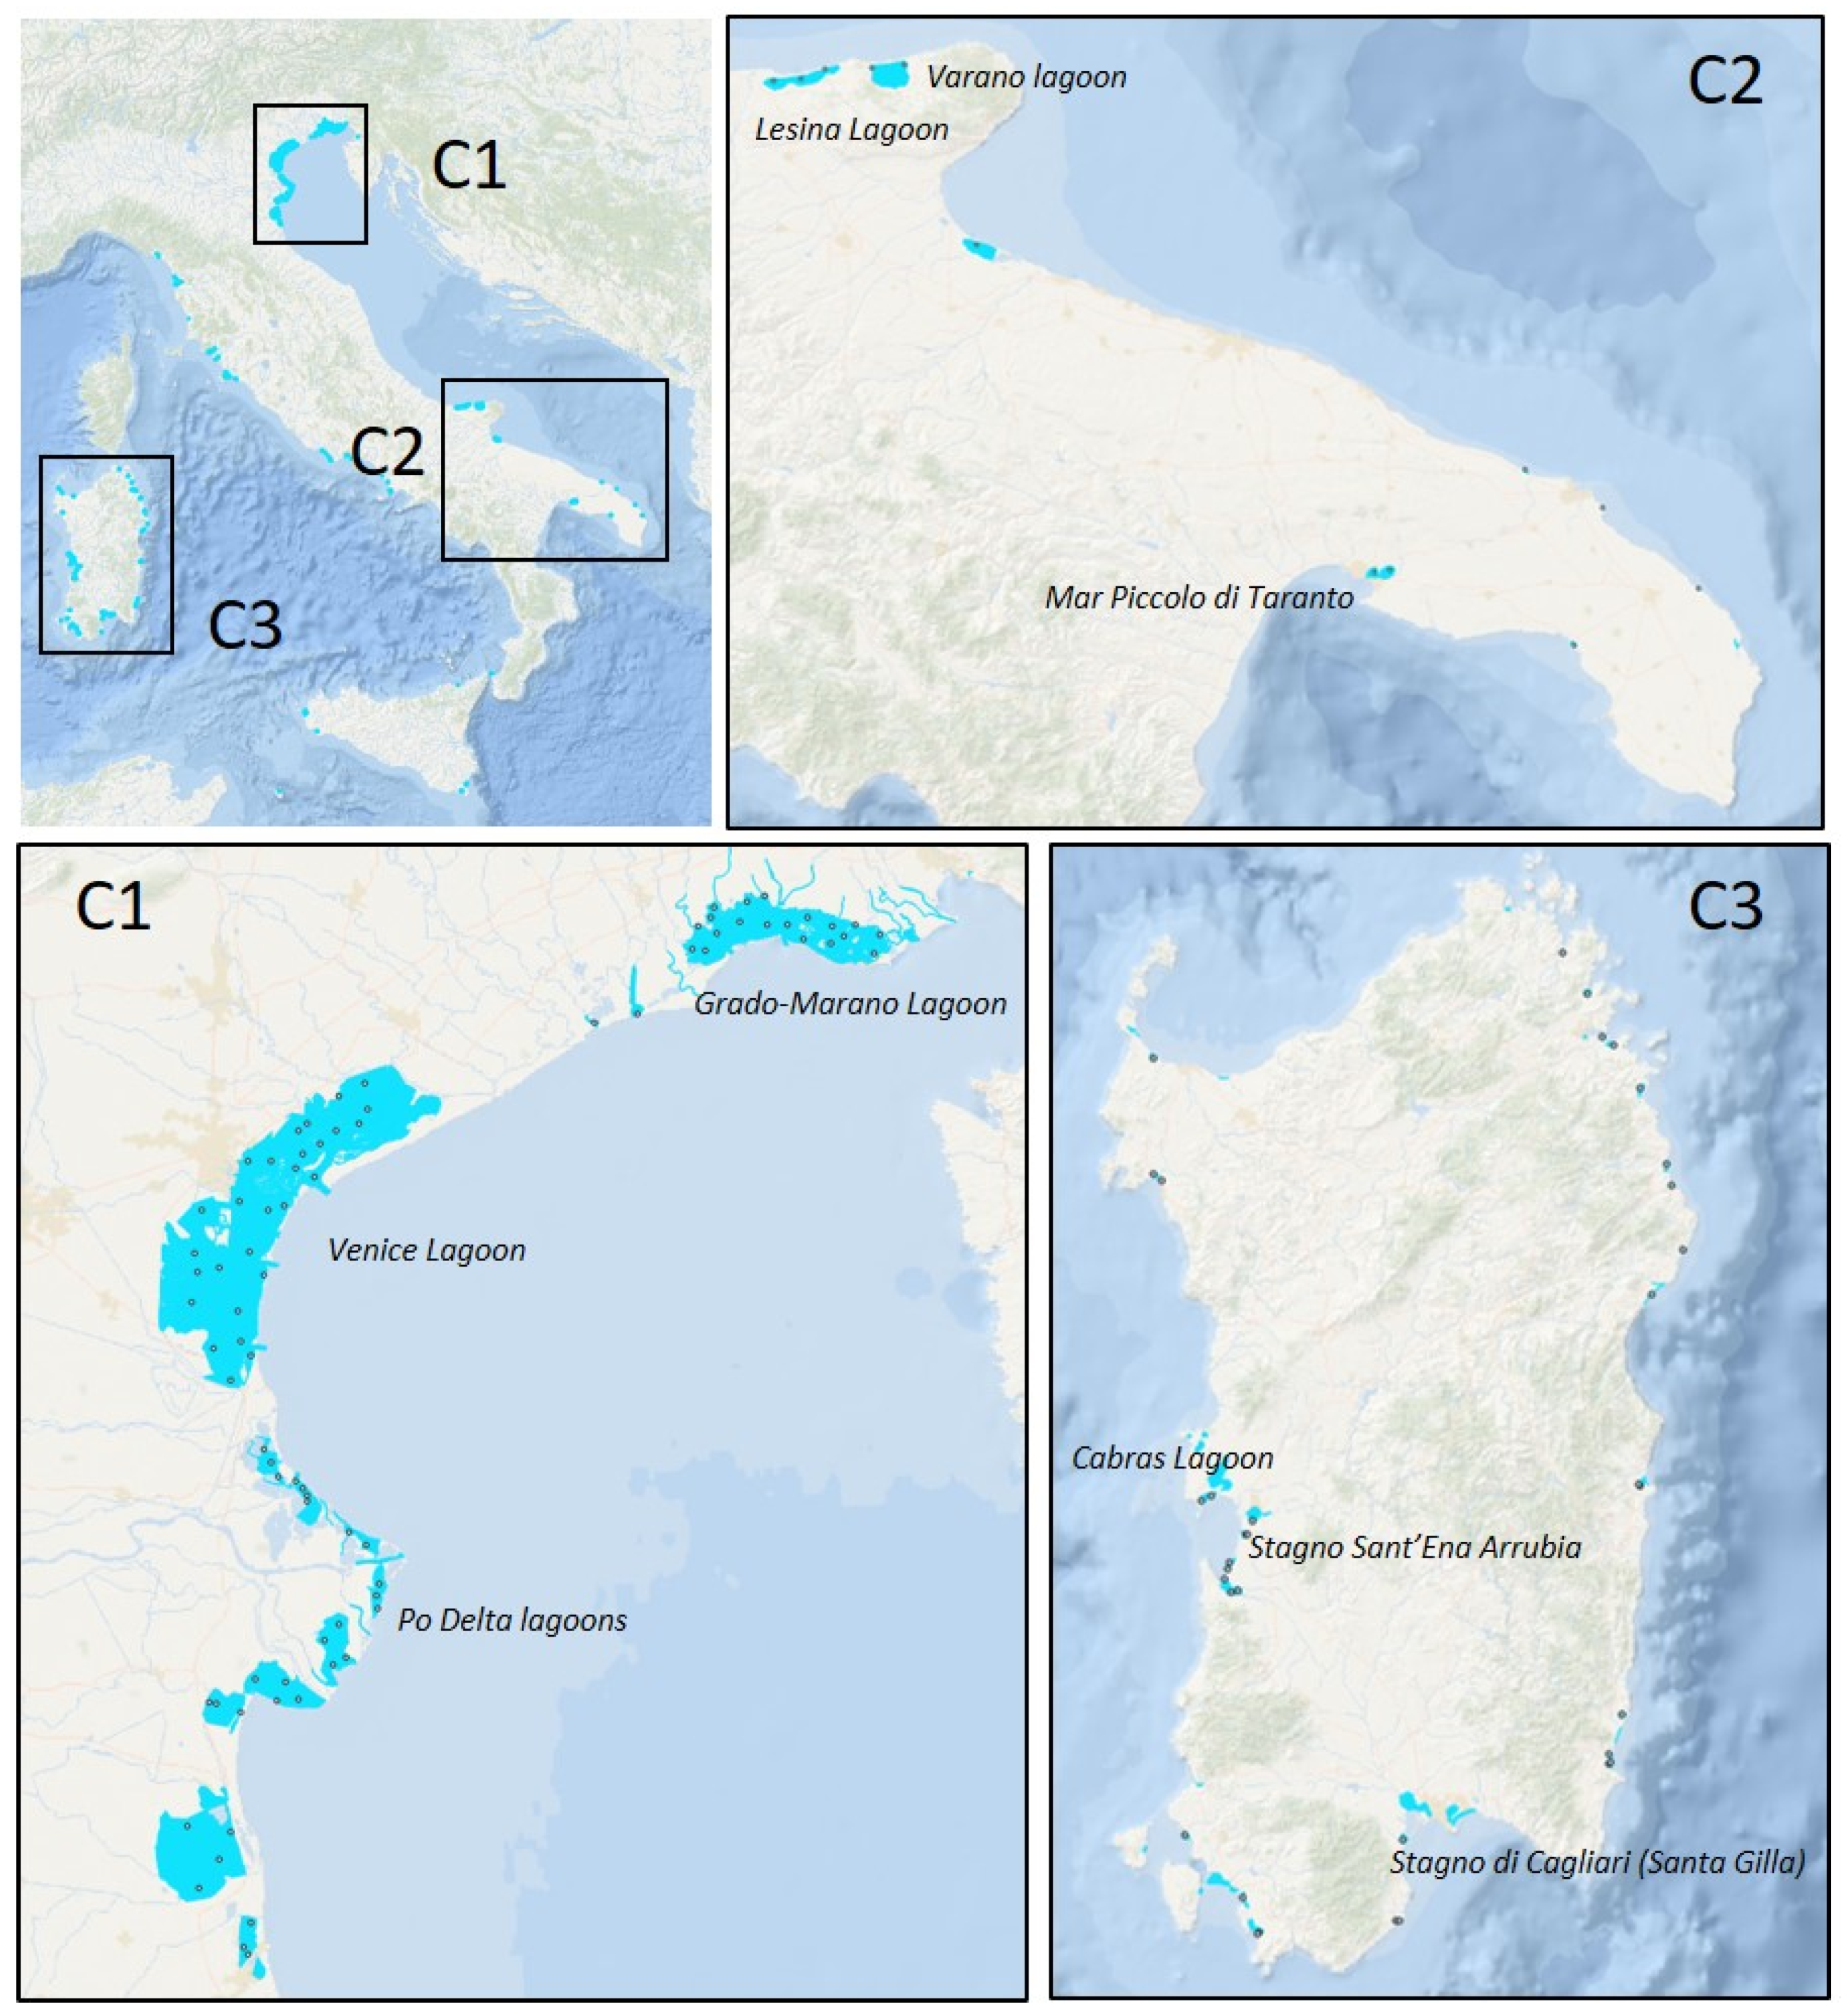
2.1. Study Area

The transitional water eutrophication assessment method (TWEAM) was tested on an extensive and heterogeneous dataset, which included most of the Italian transitional systems (5 Regions, 52 among coastal lagoons, coastal lakes, coastal ponds, and saltworks, for a total of 126 stations). The dataset collected for this study may be considered representative of the geomorphological, hydrobiological, functional, and ecological variability existing at the Italian scale. Both salinity and tidal regime conditions were well represented by the dataset (69 stations with salinity <30, 57 stations with salinity >30; 54 non-tidal stations, 72 tidal stations).
For the purpose of this paper, sites were divided into 3 macro regions: Northern Adriatic Sea, Apulian, and Sardinian compounds (Figure 1).

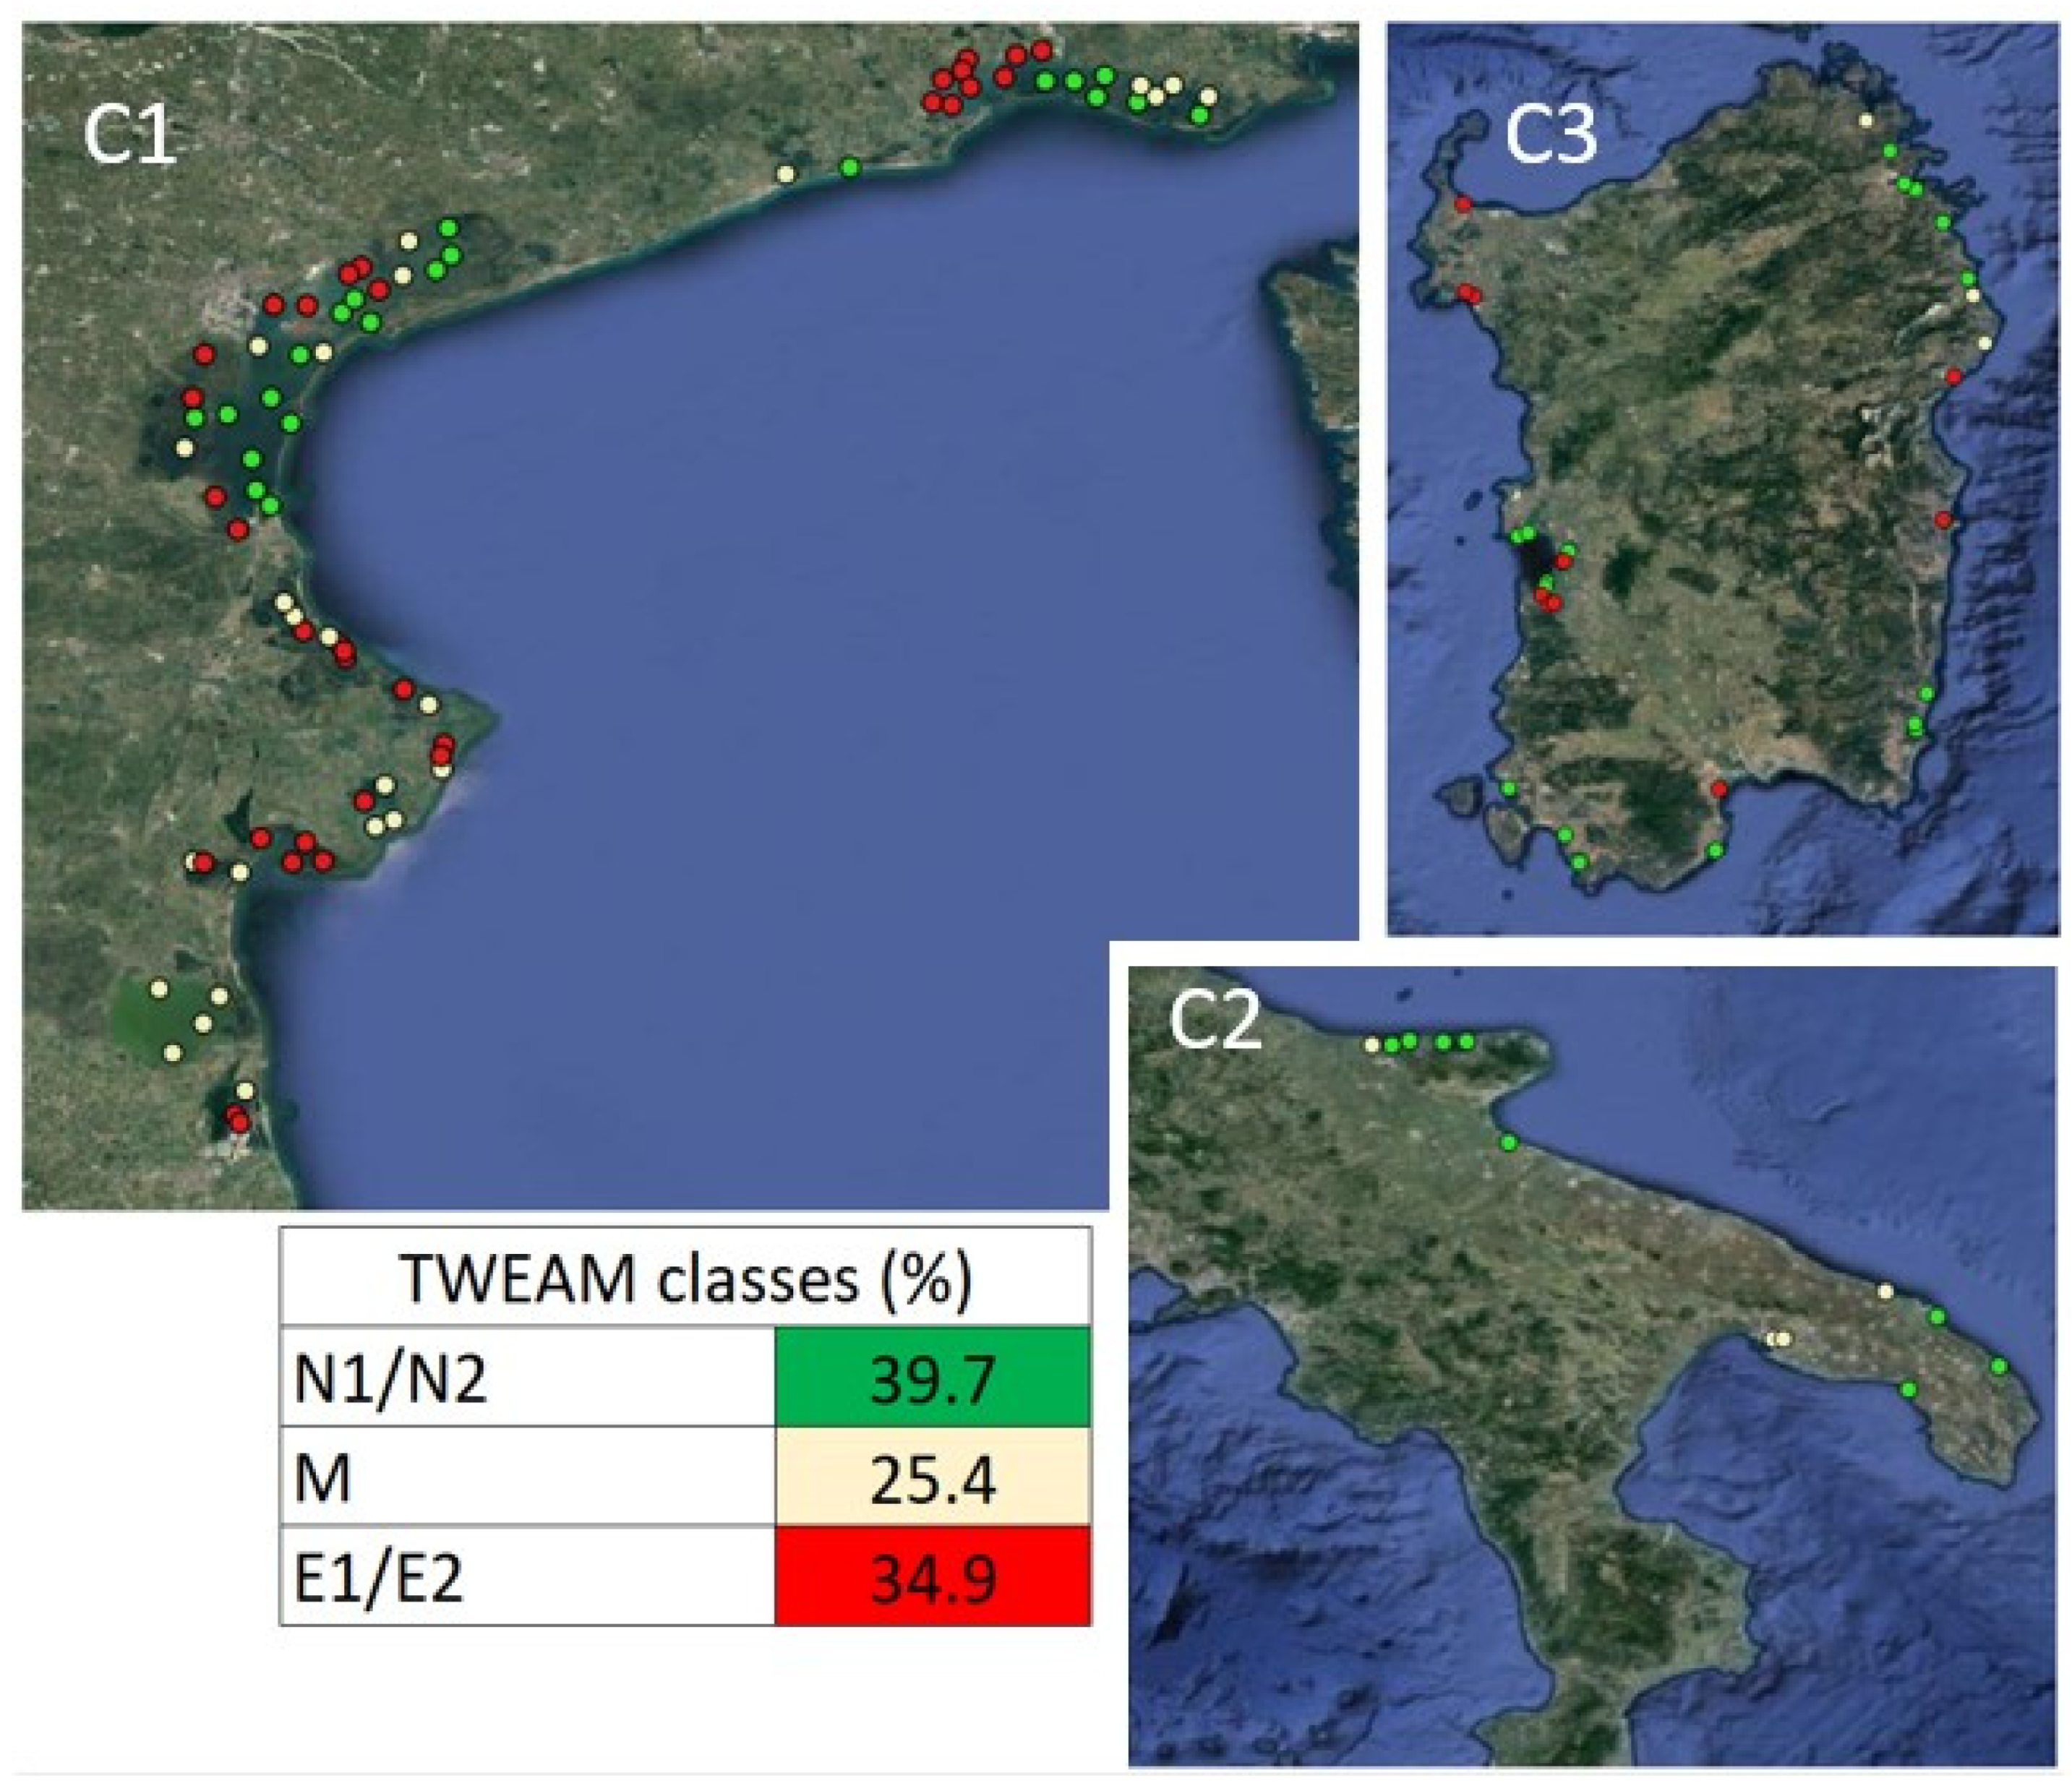
2.1.1. Northern Adriatic Sea Compound (C1: 15 Transitional Systems, 79 Sampling Sites)

This compound includes the largest transitional systems found in Italy such as Venice lagoon, Grado-Marano lagoon, and the transitional water systems of the Po Delta area. The dataset includes the following systems along the coastal stretch between Trieste (NE) and Ravenna (S): Grado Marano lagoon (160 km2); Caorle/Baseleghe valleys (approximately 6 km2); Venice lagoon (549 km2); Po Delta lagoons of Caleri (10.5 km2), Marinetta (2.5 km2), Vallona (9.1 km2), Barbamarco (7.5 km2), Canarin (9.2 km2), Scardovari (28 km2), Goro (37 km2), Valle Cantone (6 km2), Valle Nuova (14 km2), Lago Nazioni (1 km2), Comacchio (118 km2), and Pialassa Baiona (12 km2). The tidal regime is generally microtidal, with the exception of Comacchio, Valle Nuova, Lago Nazioni, and Valle Cantone (non-tidal).

2.1.2. Apulian Compound (C2: 8 Transitional Systems, 12 Sampling Sites)

This compound includes 30 non-tidal coastal systems (coastal lagoons, coastal ponds, and saltworks) for a total area of 220.2 km2 [19]. The dataset used in this study includes the two main lagoons of the region (Lesina, 51.4 km2 and Varano, 60.5 km2) and the following transitional systems: Lago Salpi (30 km2 approximately), Torre Guaceto (1.2 km2), Punta della Contessa (2.0 km2), Cesine (0.7 km2), Baia di Porto Cesareo (2.0 km2), and Mar Piccolo di Taranto (20.7 km2).

2.1.3. Sardinian Compound (C3: 34 Transitional Systems, 35 Sampling Sites)

The Sardinian coastal systems contain over 50 non-tidal transitional ecosystems, generally of small dimension, which cover a total area of approximately 160 km2 [20]. The dataset used in this study includes 34 transitional systems of different typologies (coastal lagoons, coastal ponds, and saltworks) and salinities, located along the entire coastline of the Sardinia coastline.

2.2. Data Collection and Analyses

Data were collected by the Regional Environmental Protection Agencies (ARPAs) in the framework of the institutional WFD monitoring activities. The dataset considered in this study includes data from the period 2014–2016, with the exception of Sardinia, for which data were collected in the period 2016–2018.
At all sites, physicochemical parameters were collected seasonally (4 times a year) in each year; macrophyte data were collected twice (spring and autumn) in only one year over the studied period.
Sampling and laboratory activities were performed according to the national protocols, described in [21]. Water samples were filtered by 0.45 µm porosity filters and analyzed for determination of orthophosphates (P-PO4), ammonium (NH4+), nitrites (NO2−), and nitrates (NO3−) by spectrophotometric analyzers. Oxygen saturation was determined by portable oximeters. Samples of chlorophyll-a were mostly obtained by filtration of waters in Whatman GF/F filters (porosity 0.7 µm) and then determined in acetone extract by spectrofluorometric analyzers. In some sites, it was determined in situ by portable fluorimeters.
Macrophyte cover and species identification were determined following [13,21].

2.3. The TWEAM Description

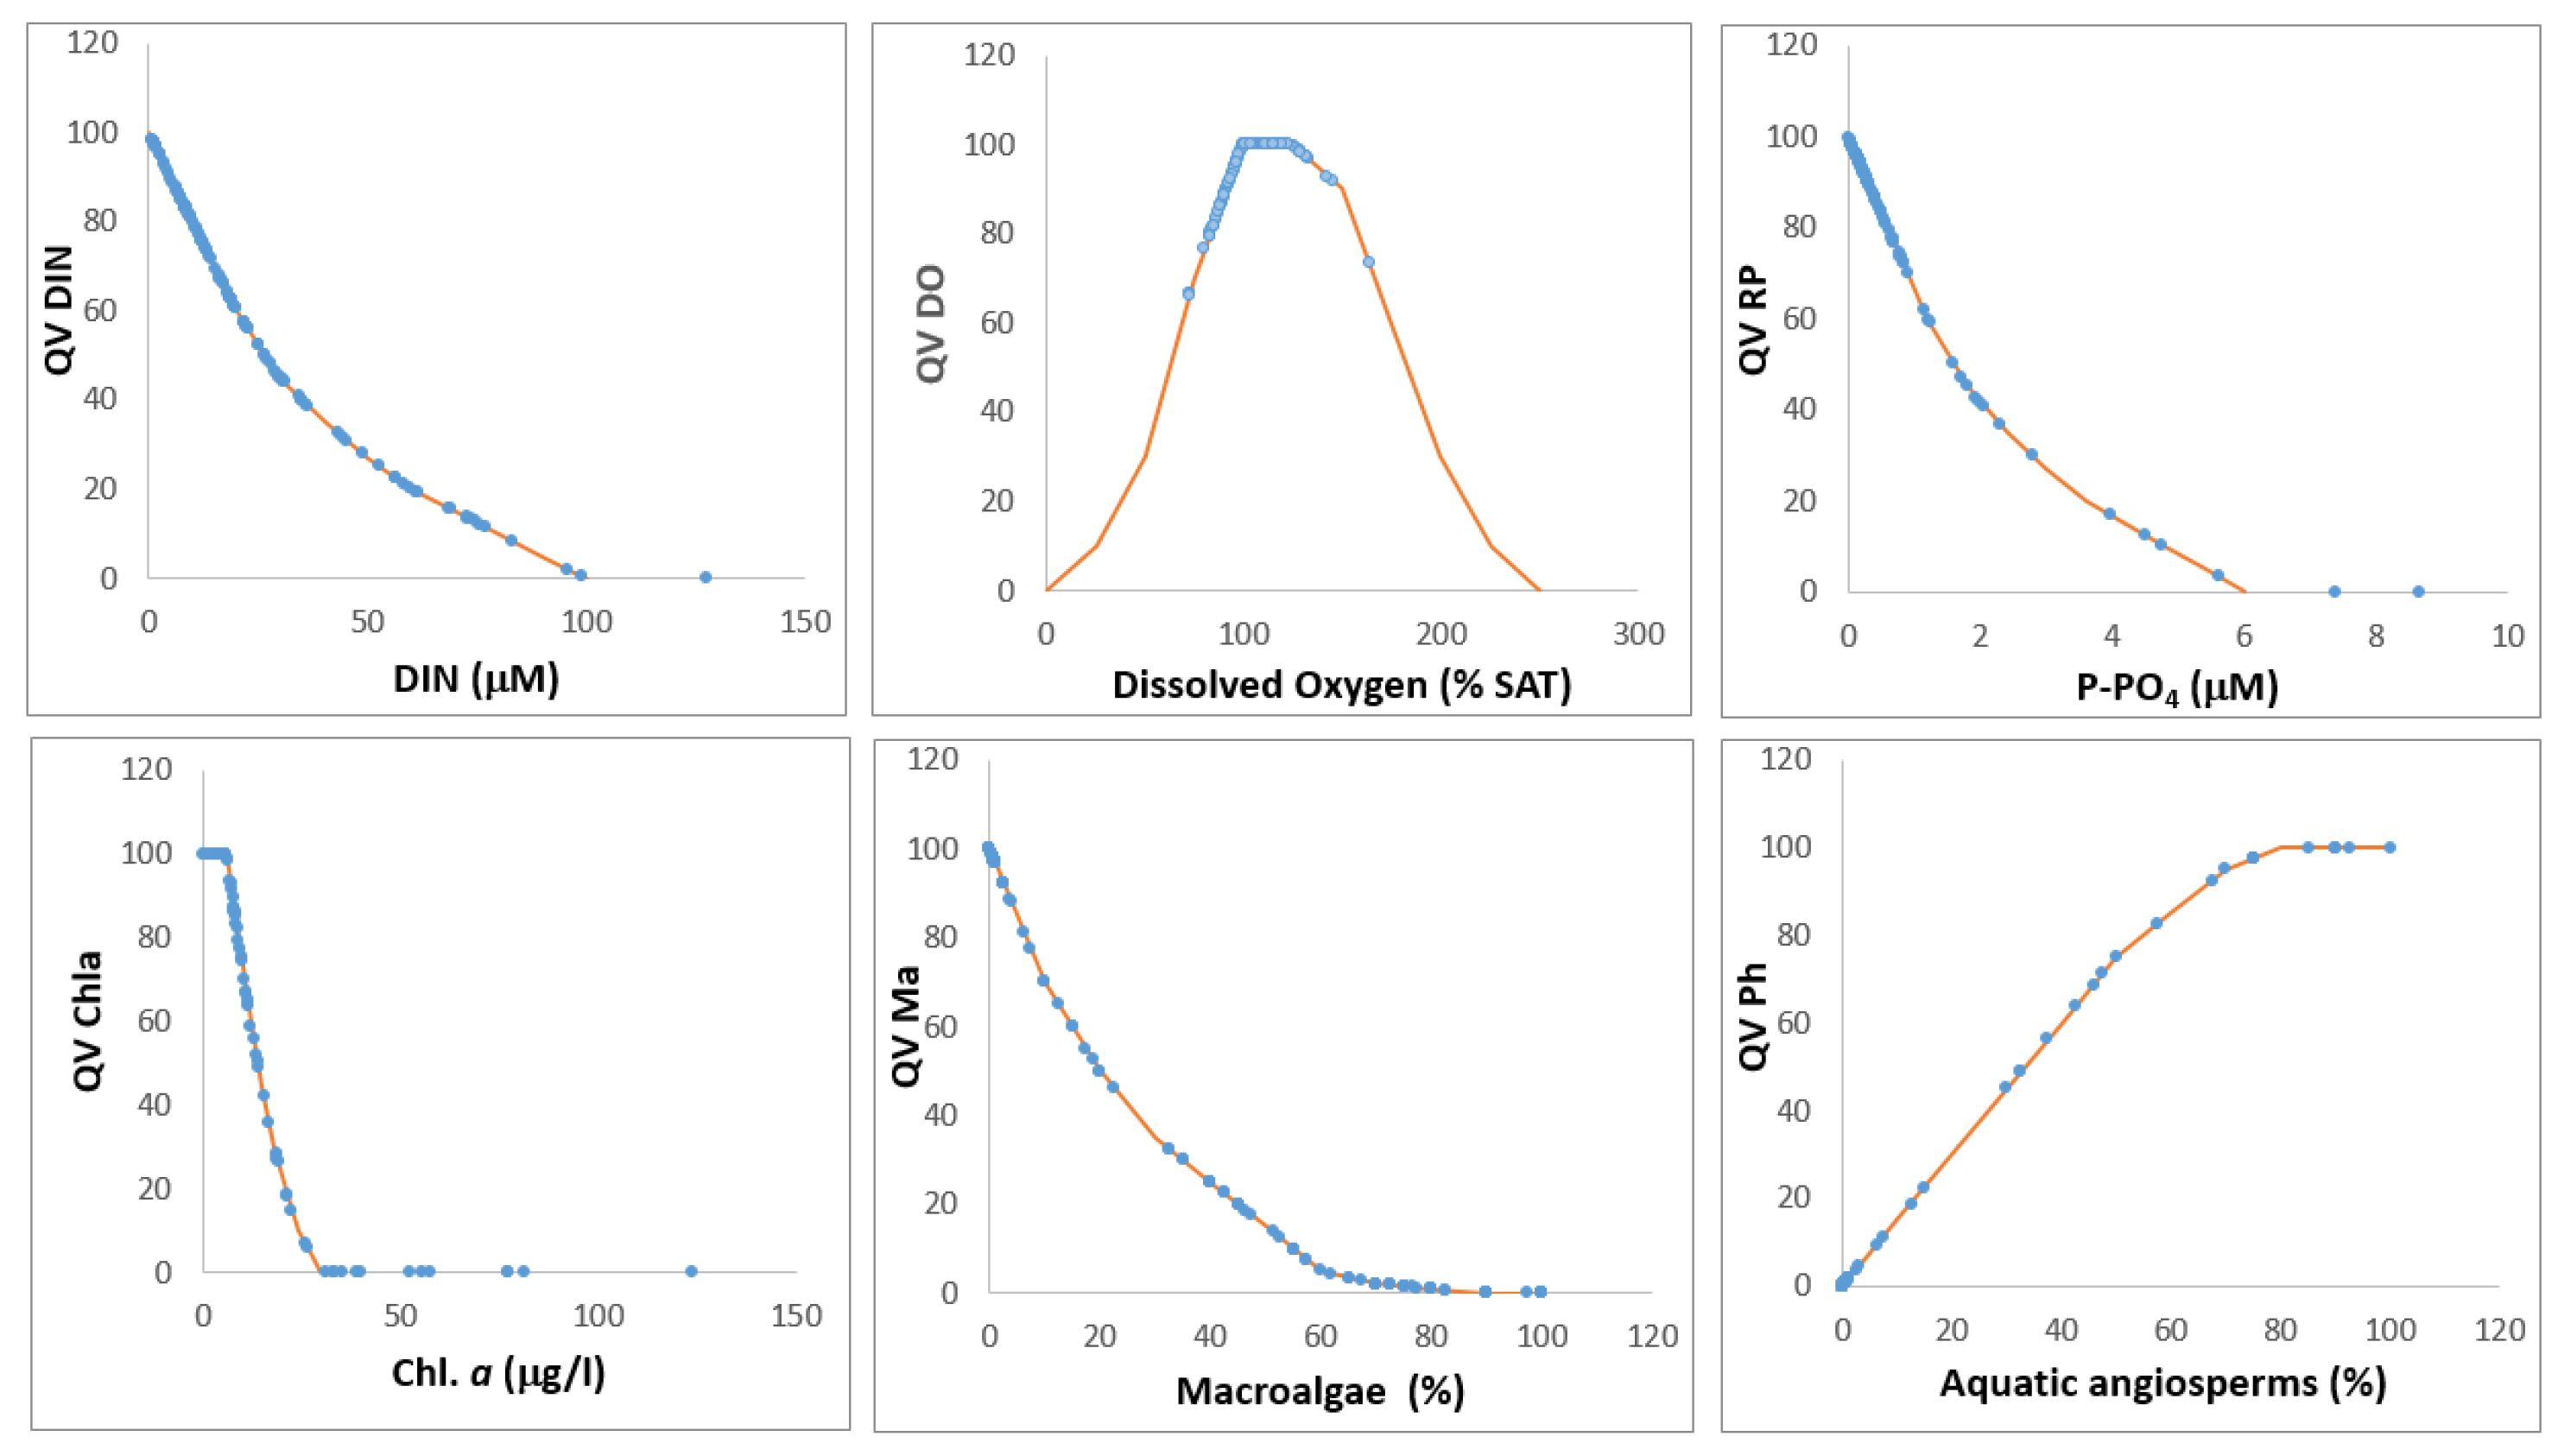
2.3.1. Indices and Metrics Included in the Method

TWEAM is a multi-metric and multi-index method, based on the Macrophyte Quality Index MaQI [13], the physicochemical quality elements supporting good ecological status (sensu Dir. 2000/60/EC), and the Transitional Water Quality Index TWQI [7].
MaQI is the index adopted by the Italian law in agreement with the WFD requirements for ecological classification of both macroalgae and aquatic angiosperms in TWs [13]. The MaQI ecological assessment is based on several metrics: number and percentage of sensitive macroalgal taxa, relative abundance (wet weight) of Chlorophyta and Rhodophyta, benthic phanerogams, and macroalgal cover. The frequency of macrophyte monitoring for the application of MaQI is two seasonal samples every three years for operational monitoring and every 6 years for surveillance monitoring (Italian Environmental Ministry Decree (MD 260/2010)).
Dissolved inorganic nitrogen (DIN) and orthophosphates (P-PO4) were included in the TWEAM, as a representative of the physicochemical quality elements to support biological element classification. According to the MD 260/2010, thresholds for DIN are defined for two different salinity typologies: <30, including oligohaline, mesohaline, and polyhaline water bodies; >30 including euhaline and hyperhaline water bodies. Currently, the threshold for orthophosphates is set only for water bodies with salinity >30 (Table 1).
TWQI is a multimetric index for assessing the trophic status in shallow transitional water ecosystems that integrates the main causal factors of eutrophication (N and P concentrations), the key biological elements (chlorophyll-a, aquatic angiosperm, and macroalgal cover), and an indicator of the eutrophication effects (dissolved oxygen).
Each variable is transformed with non-linear functions into dimensionless quality value (QV) ranging from 0 (low quality) to 100 (high quality). The QV was then multiplied by a weighting factor to take into account the relative contribution of each variable to the overall water quality value. The final score of the index is calculated as the sum of the contribution of each variable [7,11], provided in the Supplementary Materials (Table S1).
In this study, the TWQI was calculated by averaging, over the same year, the values of water quality data (nutrients, chlorophyll-a, and oxygen saturation), sampled quarterly, and the percentage of angiosperms and macroalgae covers, sampled twice (spring and autumn).

2.3.2. Method Calculation

The methodology is based on a three-step evaluation procedure. Phase 1 (Table 2) consists of a preliminary screening based on the use of the WFD ecological quality status indicator for macrophytes, i.e., MaQI, and DIN and P-PO4 concentrations (averaged over 3 years) and thresholds (Table 1).
PHASE 1. Phase 1 allows the classification of the eutrophication status in case of a match in compliance for nutrients and biological elements.
The possible outcomes of phase 1 are:
E1: Eutrophic site. Physicochemical supporting elements (DIN and P-PO4) indicate a condition of nutrient enrichment in the water column, and biological sensitive elements (macrophytes) indicate a significant alteration of the community structure. Both nutrient concentrations exceed the moderate/good class boundary and the macrophyte ecological status is bad or poor.
N1: Not eutrophic site. Both nutrient concentrations are below the moderate/good class boundary and the macrophyte ecological status is good or high, indicating a negligible probability of alteration of the functioning or the structure of the ecosystem due to nutrient enrichment.
Current national legislation (MD 260/2010) does not indicate any threshold for P-PO4 concentration for sites with salinity < 30, therefore, the threshold defined for sites with salinity > 30 is also temporarily applied for these sites, assuming that nutrients are usually higher at low salinities. In the case of P-PO4 concentrations exceeding this threshold, phase 2 is requested.
PHASE 2. In cases of mismatches between nutrients or among nutrients and MaQI classification (sensu WFD), the site is not clearly attributable to eutrophic or non-eutrophic conditions and further analysis is required.
Phase 2 (Table 3) integrates TWQI values in the analysis of the eutrophication status, using the boundary classification inferred by [22]: TWQI score < 40 represents bad conditions, while 41–50, poor; 51–60, moderate; 61–80, good; and >80, high conditions.
The classes identified in this phase are:
E2: Eutrophic site based on the integrated analysis;
N2: Non-eutrophic site based on the integrated analysis;
M: Mesotrophic site, at risk of eutrophication in the case of the current trend, indicates a worsening.
The five classes of trophic status can be reduced to three major classes, considering that both N1 and N2 refer to a non-eutrophic status. The same applies for E1 and E2, which refer to a eutrophic status (Table 4).
Sites classified in M status need a further phase (phase 3) in order to determine whether or not the mesotrophic status can be considered a sustainable condition stable over time, linked to the natural background of high productivity typical of transitional waters (non-eutrophic), or, on the contrary, there is a latent risk of eutrophication.
Phase 3 is based on a quali-quantitative assessment, including expert judgment, the analysis of trends, the use of other indicators, the evaluation of trophic status of the surrounding stations, and the assessment of the implemented measures.

2.4. Statistical Analysis

In order to visualize the variance and the association between parameters and station typologies, principal component analysis (PCA) was applied to standardized data by using R software with packages Rcmdr, RcmdrFactoMine, and factorextra [23].
Distributions of stations among station typologies (tidal, salinity) were assessed using the chi-square test.

3. Results

3.1. TWEAM Metrics

All input data and results are reported in the Supplementary Materials in Tables S1 and S2.

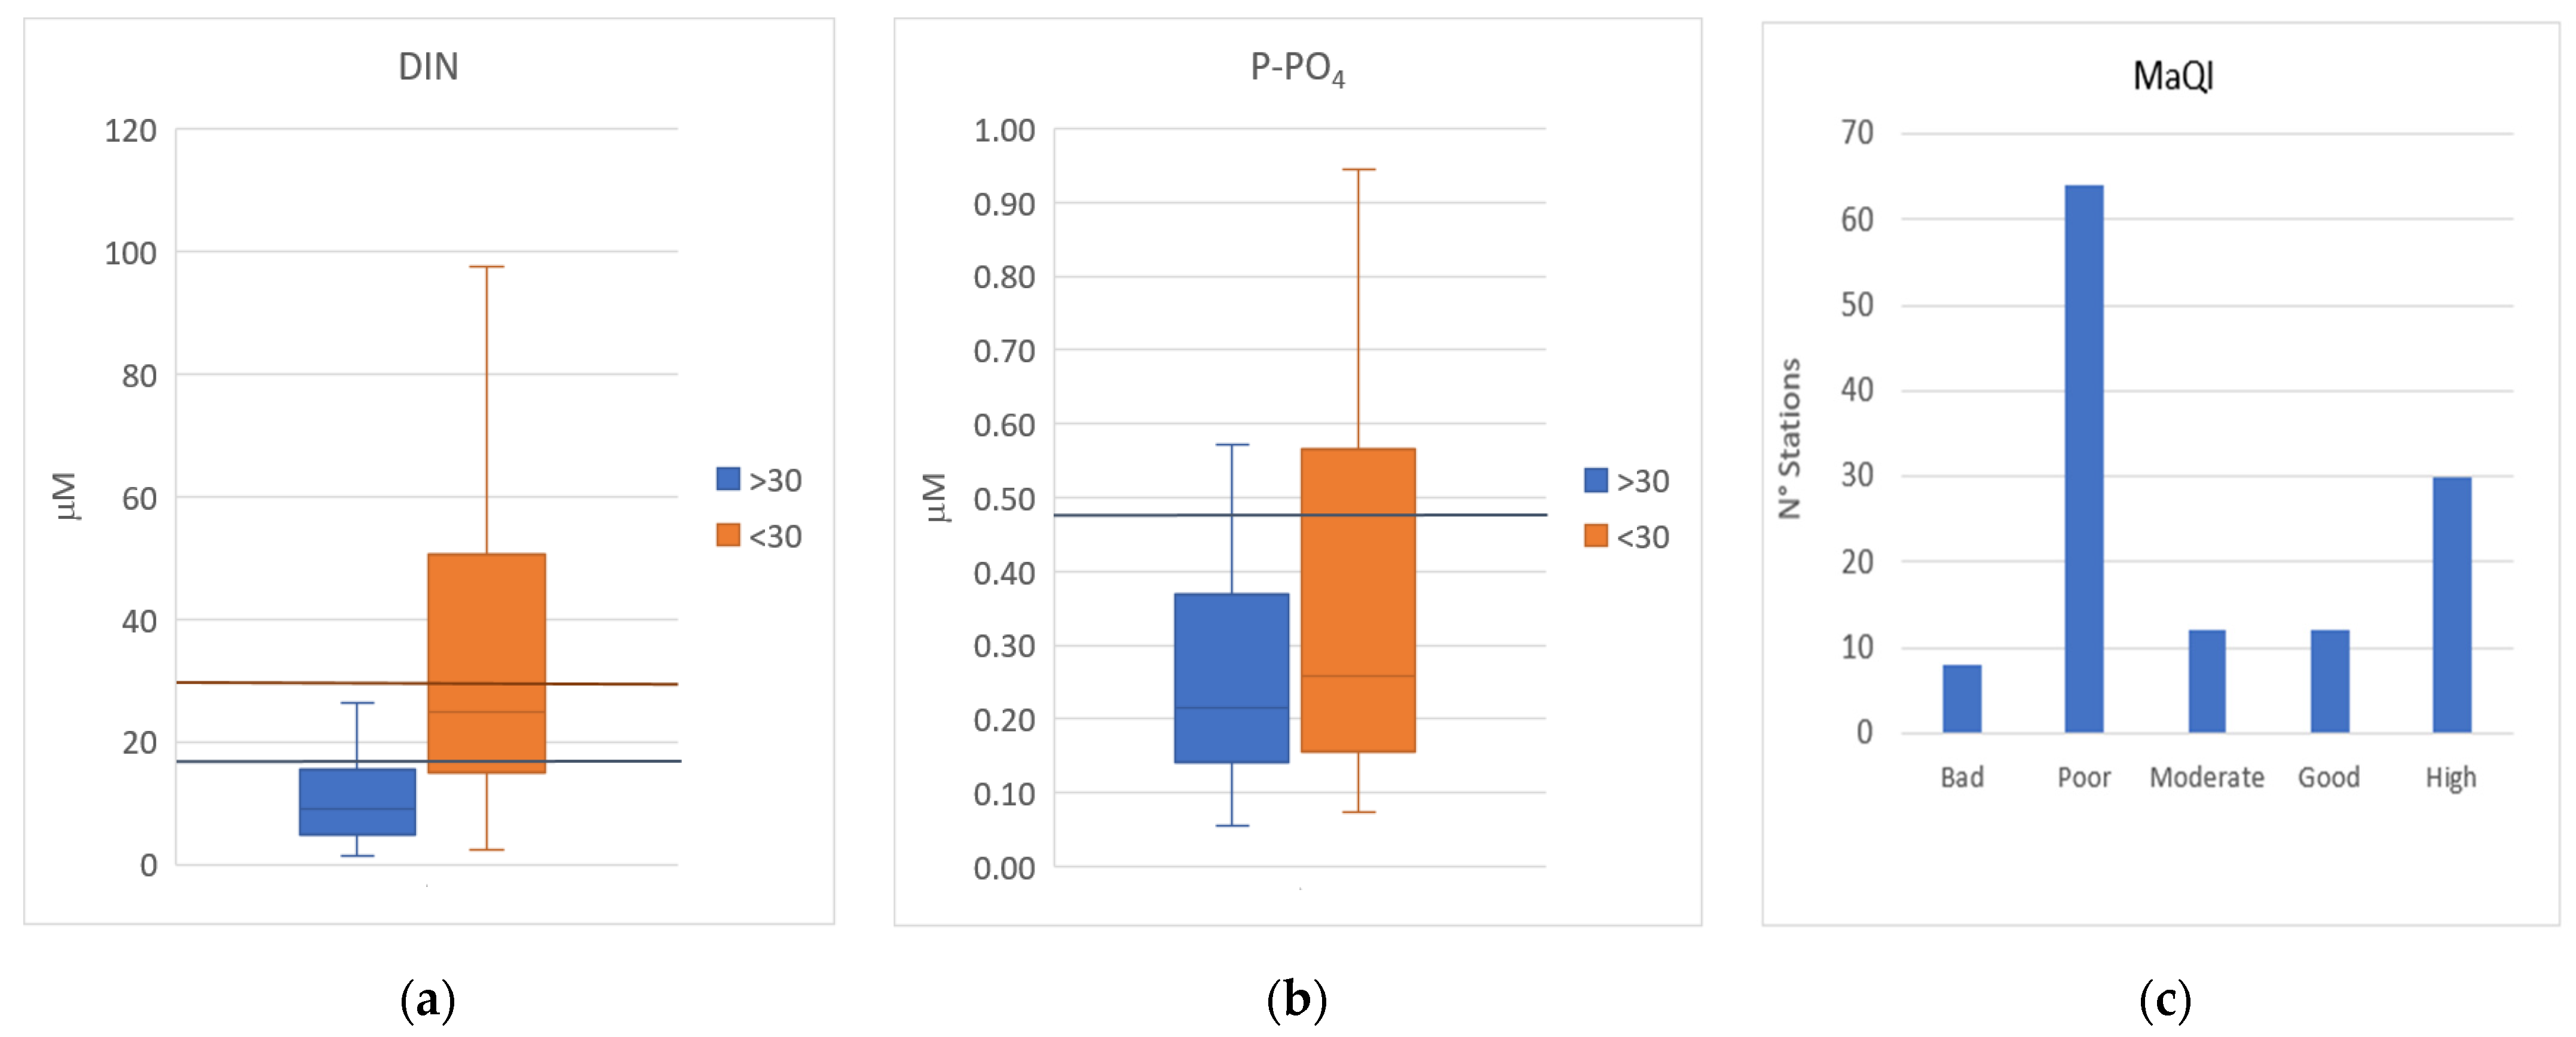
3.1.1. Phase 1: Nutrients and MaQI

Nutrient data used in phase 1 covered a wide range of concentrations (Figure 2a,b). DIN concentrations (range 4.1–184.3 μM) resulted below the good/moderate threshold (Table 1) in 68.3% of the stations. Concentrations of P-PO4 (range 0.06–4.88 μM) resulted below the threshold in 73.8% of the stations. A total of 8.7% of the stations resulted in less than good status, while 17.5% were not classified for P-PO4, due to the absence of a specific threshold for water bodies with salinity <30.
The dataset covers all the ecological quality classes of the macrophyte status attributed by the MaQI index (Figure 2c), with a prevalence of stations in “poor” (50.8%) and “high” (23.8%) status.

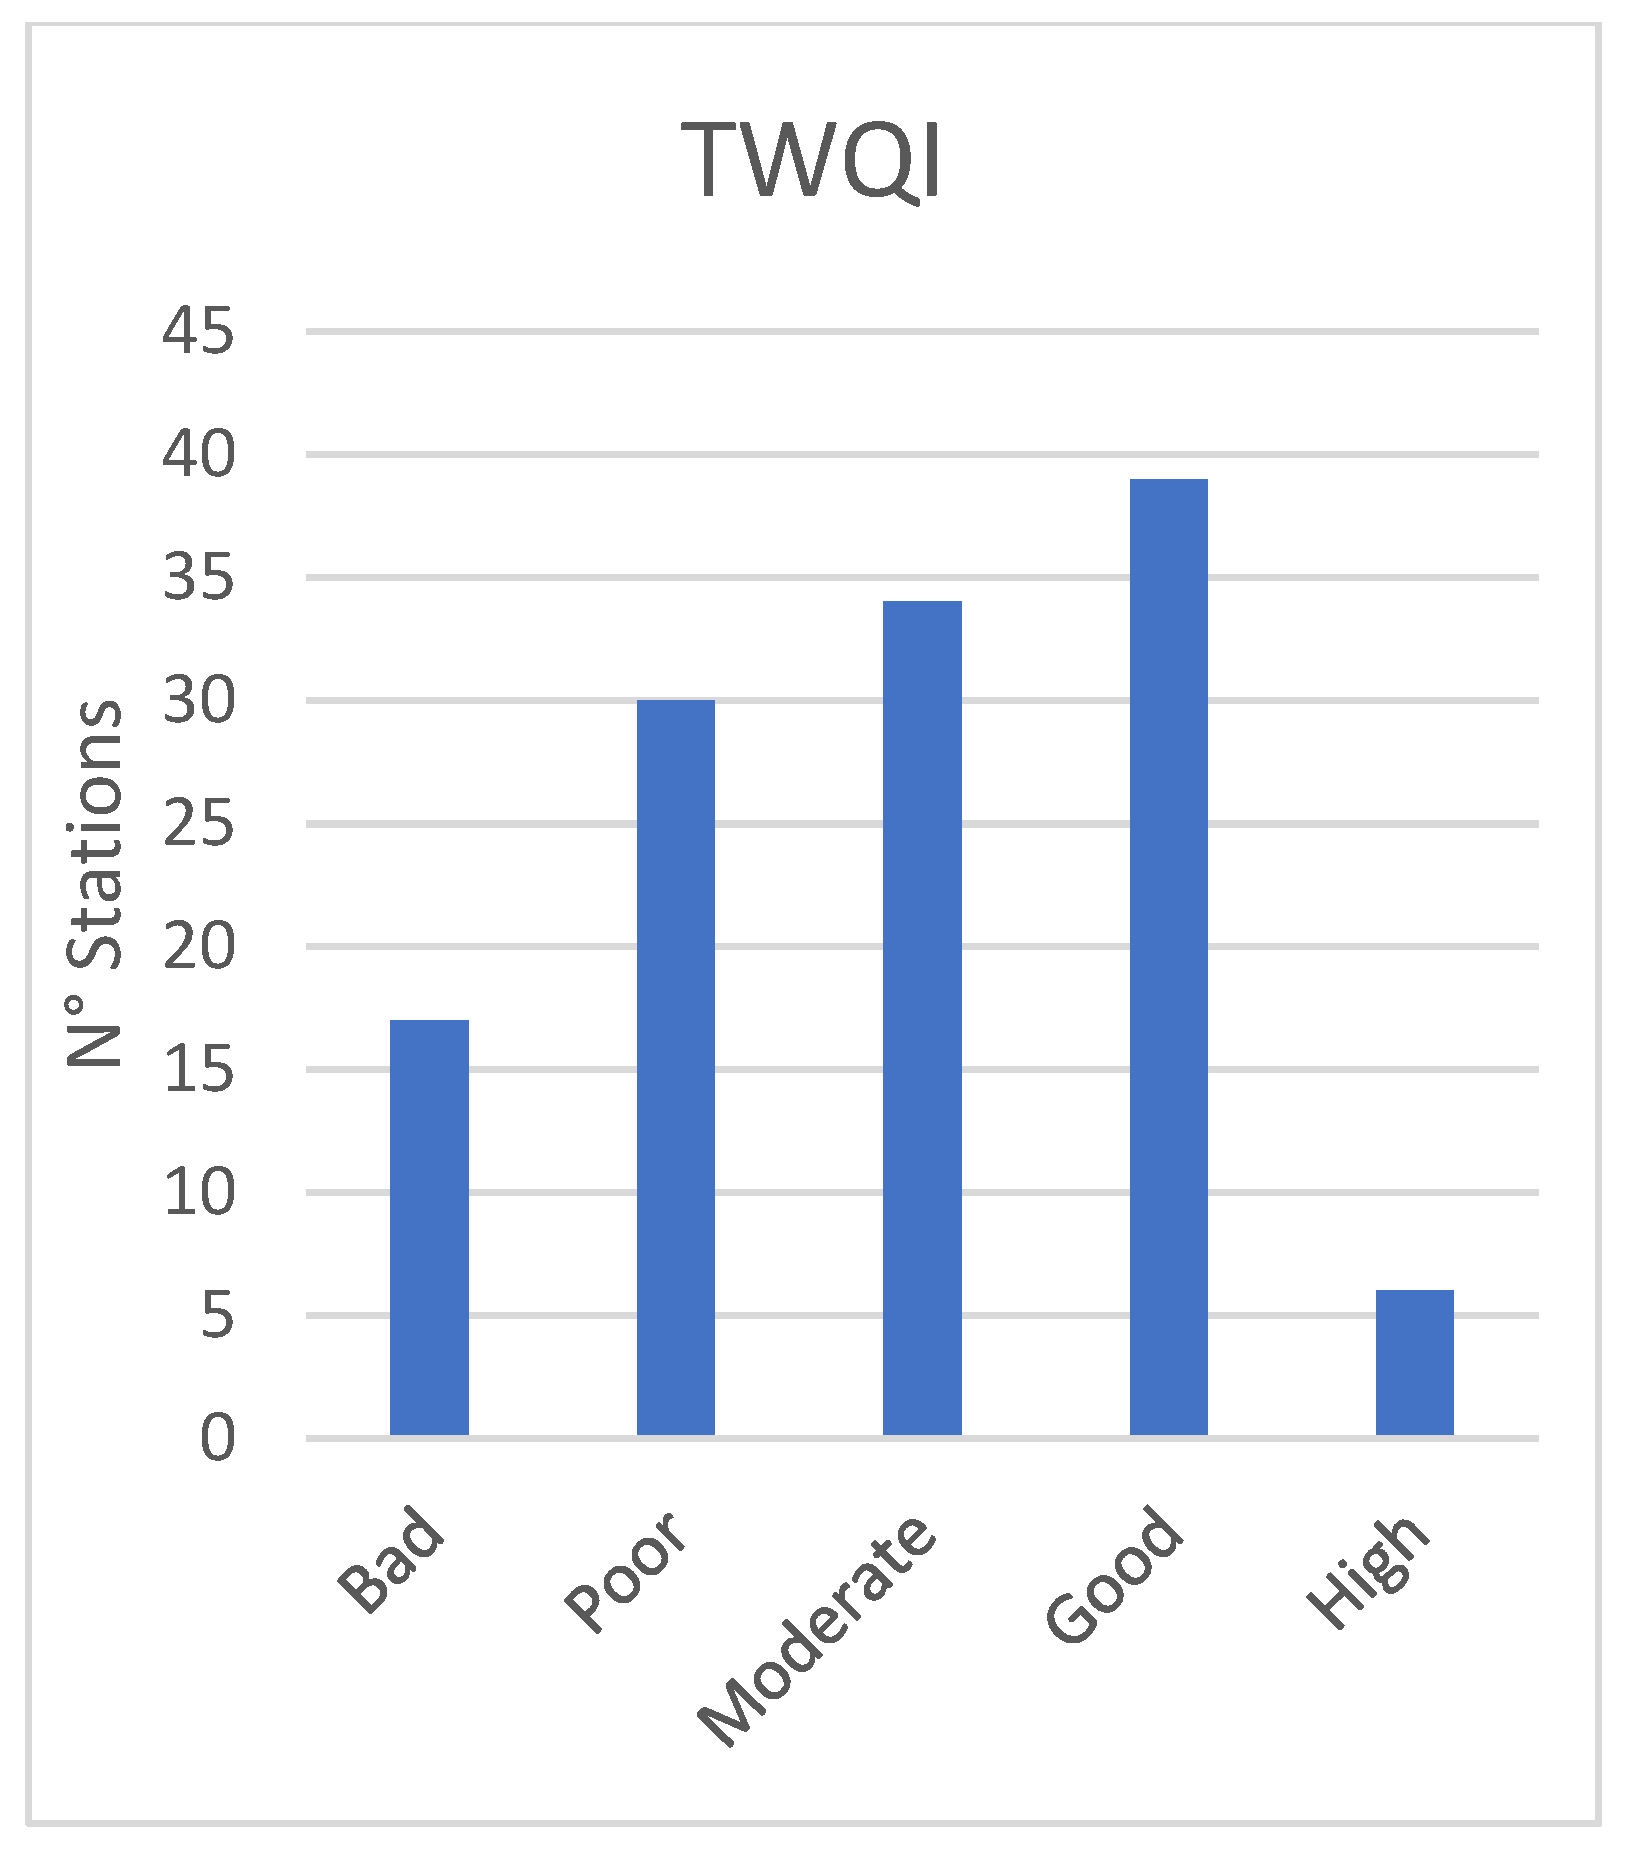
3.1.2. Phase 2: TWQI

The variables used for the TWQI calculation, with the exception of DO, covered the whole range 0–100 of the corresponding quality values (QV) defined by the quality functions of each metric (Figure 3). Overall, the TWQI values cover all five classes of trophic conditions (Figure 4). “Bad” and “poor” classes were present in 37% of the stations, the “moderate” class in 27% of the stations, while the remaining 36% of the stations were in a “good” trophic status.

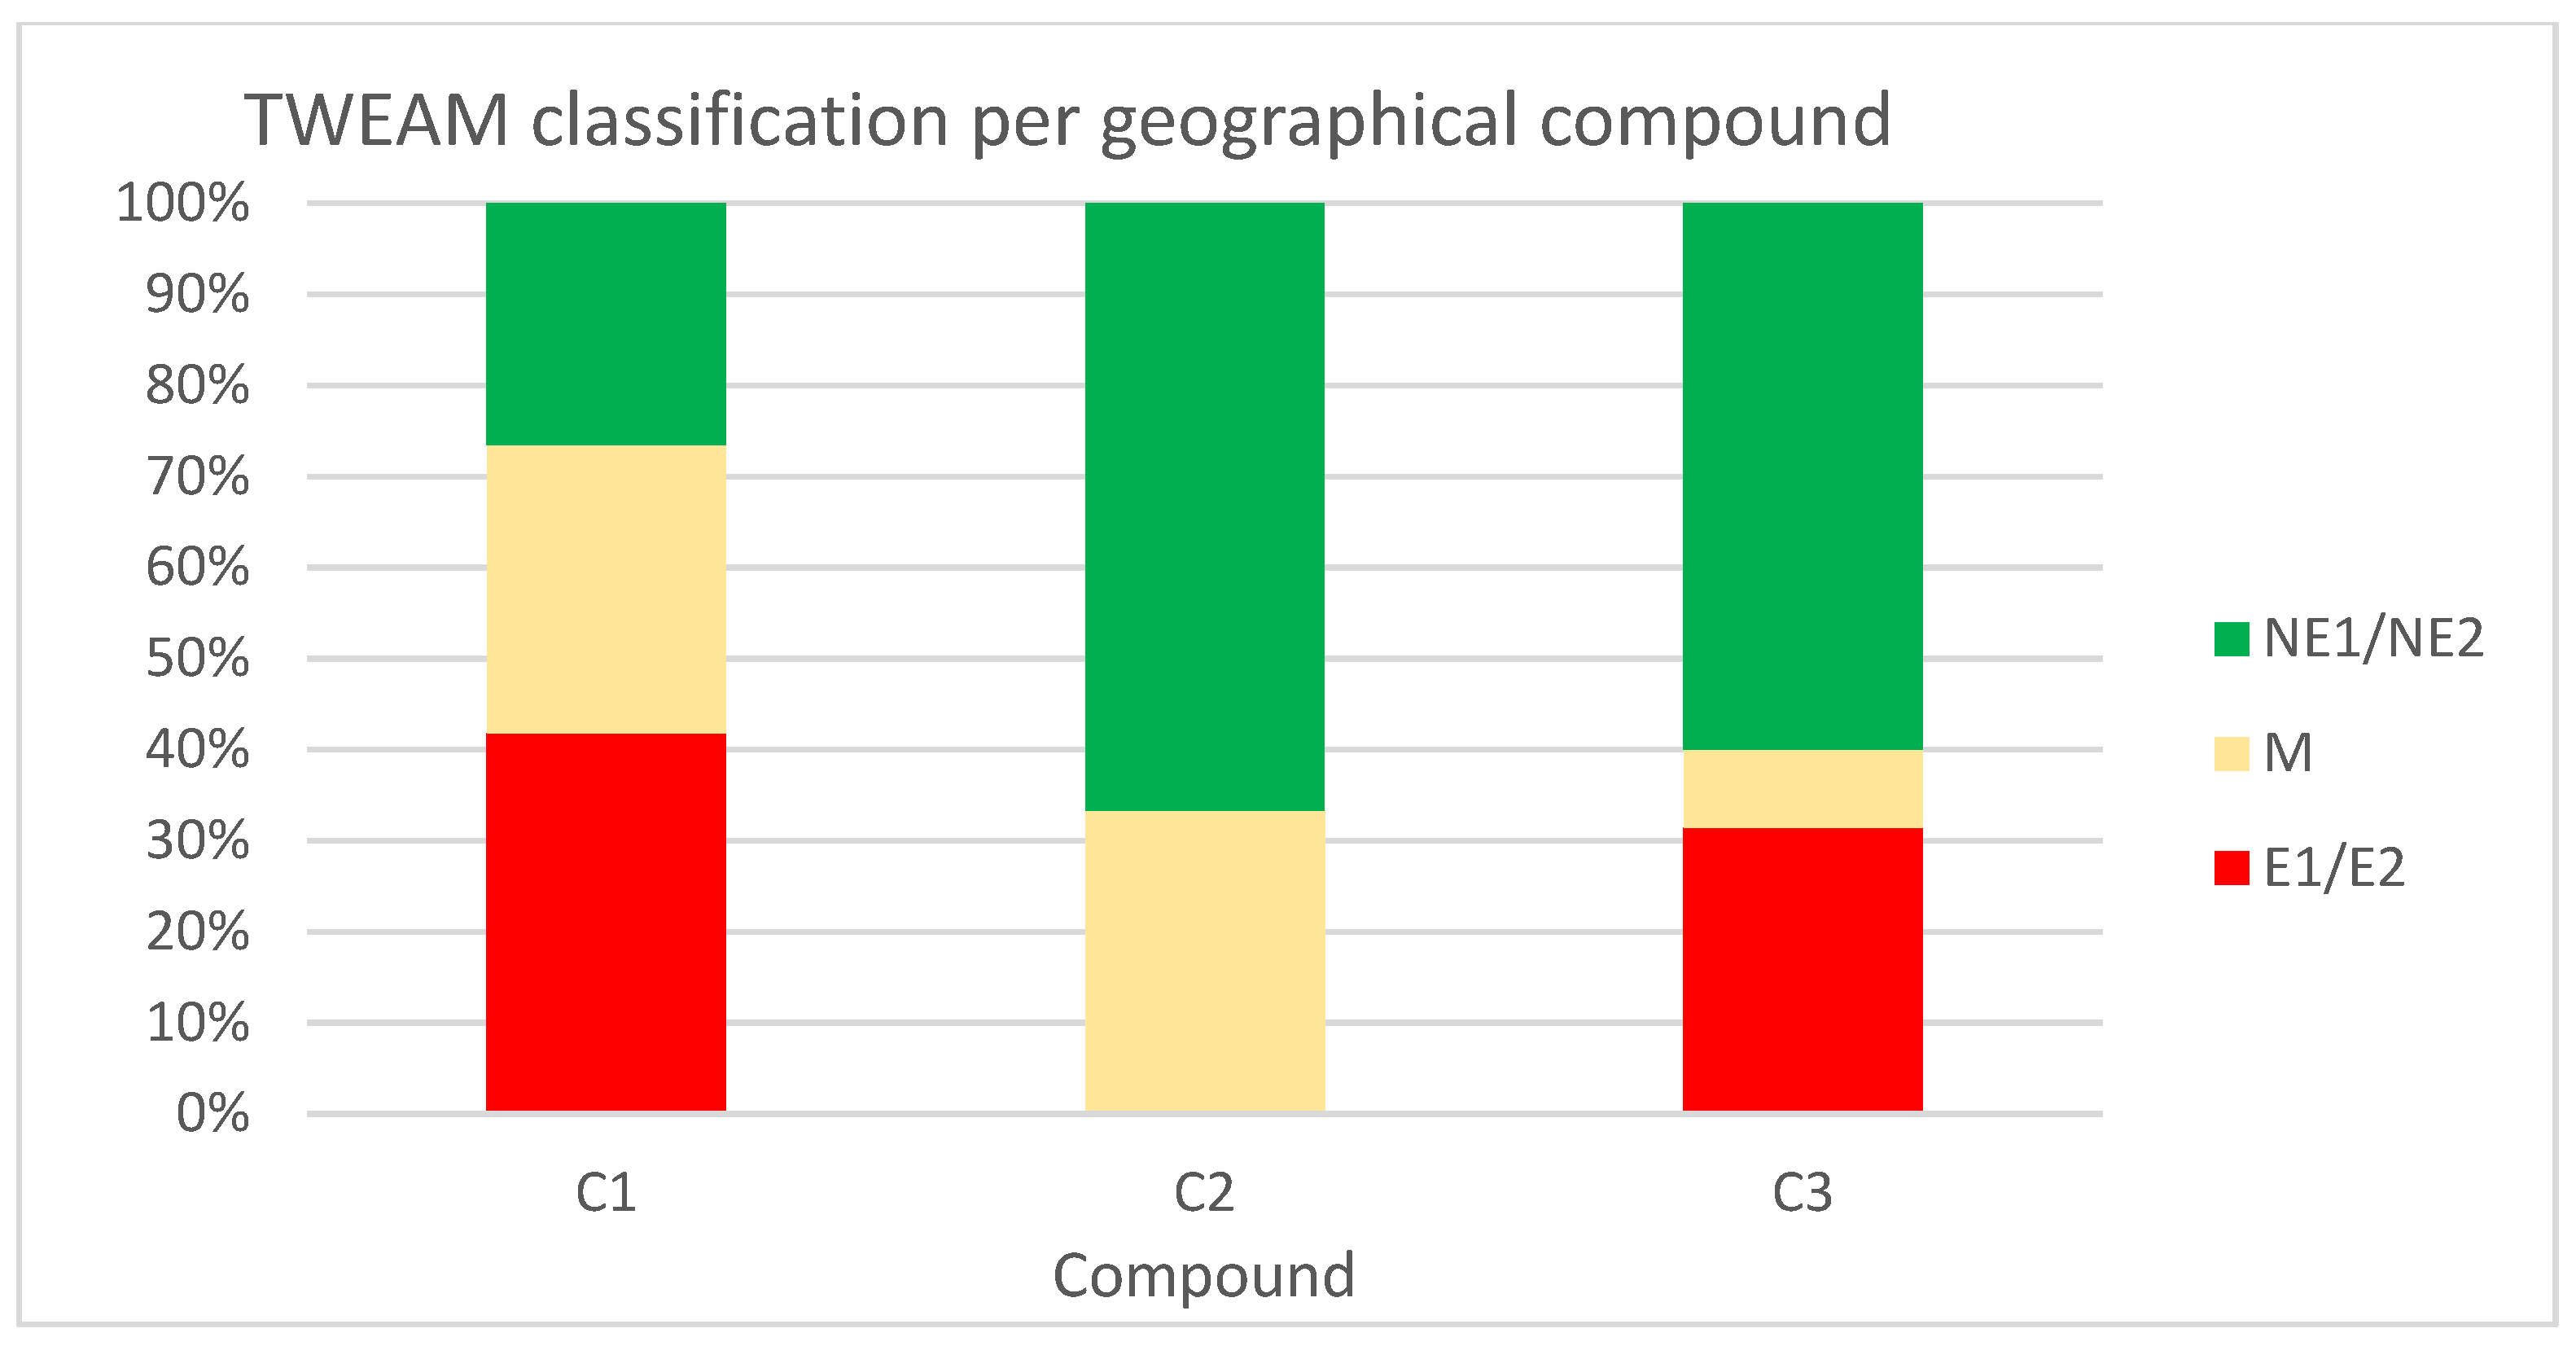
3.2. TWEAM Application

The application of the TWEAM method to the dataset (Table S2) led to a classification of 39.7% of stations in a non-eutrophic status (NE1, NE2 classes), 34.9% in a eutrophic status (E1, E2 classes), and 25.4% in a mesotrophic status.
Considering the geographical compounds (Figure 5 and Figure 6), most of the eutrophic conditions were found in Northern Adriatic lagoons (C1) and, to a lesser extent, in Sardinia (C3) (41.8% and 31.4% of stations classified in E1/E2 status, respectively). No eutrophic station was detected in the Apulian sites (C2). The majority of the stations located in C2 and C3 compounds are classified in a non-eutrophic status (66.7% and 60.0%, respectively), while approximately 30% of the stations of the C1 and C2 compounds and 8.6% of the C3 compound resulted in a mesotrophic condition.
Similar patterns resulted by aggregating the study stations by tidal regime (microtidal and non-tidal). A total of 44.4% of the microtidal stations, which represent most of the Northern Adriatic sites, resulted in eutrophic status, 26.3 in mesotrophic status, and 29.2% in non-eutrophic status. Conversely, most of the non-tidal stations are in a non-eutrophic status (53.7%) and only 22.2% resulted in eutrophic status (Figure 7). The difference in the distribution of TWEAM classes among the two tidal typologies is significant (χ2 = 9.1, p < 0.05).
Most of the stations with salinity < 30 resulted in eutrophic (53.6%) and mesotrophic status (30.4%), while the non-eutrophic status was found in 15.9% of the sites (Figure 8). An opposite pattern was found in stations > 30 in which the non-eutrophic class prevails (68.4% of stations) and the eutrophic status was found only in 12.3% of the stations. The difference in the distribution of TWEAM classes among the two salinity typologies is significant (χ2 = 38.5 p < 0.0001).
By integrating salinity and tidal regime, the stations were grouped into four main types (NT > 30; MT > 30; NT < 30; and MT < 30), and a PCA was applied to investigate the factors that mainly affect the variance of each group (Figure 9). The first (PC1) and second (PC2) components of the PCA explained together 75.9% of the total variance. PC1 was mainly associated with MaQI, TWQI and, to a minor extent, nutrient concentrations of phase 1 (DIN, P-PO4). The PC2 was associated to DIN and P-PO4 only.

4. Discussion

Different methods were developed for assessing the trophic status of superficial water bodies, starting from the influential works by [24] on marine coastal water (TRIX index) and by [25] on lakes (TSI). The assessment of trophic conditions in transitional waters is particularly critical because these systems support a high degree of anthropogenic activity and natural productivity and it may be difficult to discriminate among anthropogenic eutrophication and a trophic status supported by a natural background [2]. Moving from the state-of-art of the previous multimetric indices assessed for TWs [5,6,7,8,9], in this paper, a new method for transitional water eutrophication assessment was presented and widely tested in Italian lagoons. TWEAM is a screening method based on the most common sampling data, usually available by water quality monitoring programs. It is a multi-metric and multi-index method that provides an integrated analysis of drivers, status, and impact indicators of eutrophication. With reference to the previously published TWQI [7,22], the most important development is the inclusion of MaQI [13], which allows a more robust quantitative evaluation of the impact on most sensitive biological quality elements (sensu WFD) and, therefore, of the “disturbance of the balance of organisms present in the water” (UWWT Directive) deriving from nutrient enrichment. Indeed, in transitional waters macrophytes are considered the most sensitive community to the nutrient enrichment of both the water column and sediments with fast response to trophic condition changes [2,26,27,28,29]. Although two metrics related to macrophytes—macroalgae cover and seagrass cover—were already included in TWQI, these were representative of the contribution of the primary producers, together with chlorophyll-a concentrations as proxy of phytoplankton biomass. The integration with MaQI enhances the comprehensive analysis of the impact on the benthic macrophyte, including metrics on macroalgae and aquatic angiosperms species composition.

4.1. Eutrophic Status in Italian Transitional Waters

TWEAM was applied to a consistent and heterogeneous dataset of Italian lagoons, coastal ponds, and saltworks, covering the geomorphological, hydrobiological, and ecological variability existing at the national scale. The use of such a large dataset (5 regions, 52 transitional systems, and 126 stations) allowed disposal of a large range of values for each metric composing the method and to have a wide representation of all of the different trophic classes. All data were collected in the framework of institutional monitoring programs, with the minimum frequency stated by WFD. Other studies [11] observed that multimetric indicators are less affected by temporal fluctuations than single environmental variables, providing a reliable assessment of eutrophication with lower and cost-effective sampling effort.
The results highlighted the ability of TWEAM to take into account the heterogeneity of the eutrophic conditions existing in the different compounds. At the national scale, 39.7% of stations were found in a non-eutrophic status, 34.9% in a eutrophic status, and 25.4% in a mesotrophic status. Each single considered geographical compound showed a proper pattern.
C1: The northwestern Adriatic Sea is a closed shallow basin where various rivers flow, draining the Po Valley. Among them, the Po River collects most of the civil, industrial, and agricultural discharges of the most populated and industrialized area of Northern Italy. The transitional systems of the compound are directly influenced by the freshwater inputs and by the loads of nutrients coming in [30,31,32]. Therefore, it is not surprising that the frequency of stations classified as eutrophic was quite consistent (>40%) in this compound. In the two largest lagoons of the area (Grado-Marano and Venice), all of the trophic classes are well represented, with eutrophic stations mostly located in inner areas, characterized by low exchanges with the sea inlets and more directly influenced by freshwater inputs. In the Po delta area, no stations were found in a non-eutrophic status, while eutrophic and mesotrophic classes were equally represented (50% each). Analyzing the single components of the TWEAM, these lagoons were generally characterized by higher DIN levels and by a more degraded status of macrophytes (TWQI and MaQI in poor/bad classes).
C2: In the Apulian compound, eight stations were classified as a non-eutrophic class and four in the mesotrophic class; the latter exhibited good nutrient status (except one case), a bad/poor status of MaQI, and a moderate/good class of TWQI. The mesotrophic status in Mar Piccolo of Taranto is coherent with the reduction in nutrient inputs into the basin and the shift from relatively eutrophic to moderately oligotrophic conditions observed by the finding of [33]. The non-eutrophic status found in the Lesina and Varano lagoons is consistent with the recent analysis of anthropogenic pressures and relative impacts carried out by [34]. The variability of trophic status that resulted is mainly driven by MaQI classification, while most stations showed low nutrient concentrations and high values of TWQI.
C3: In the Sardinian compound, all the different classes of TWEAM were represented, with a prevalence of non-eutrophic stations (21 out of 35), followed by eutrophic stations (11 out of 35), and by mesotrophic stations (3 out 35), coherently, with an estimation of about one half of the Sardinian lagoons (in terms of areas) in eutrophic or hypertrophic conditions reported in [35]. This is the case of some of the largest lagoons, such as Cabras, Cagliari (Santa Gilla), Santa Giusta, and S’Ena Arrubia; the latter resulted eutrophic (E2) by TWEAM (data for Cagliari and Cabras lagoons were not available for this study). The most relevant parameters in discriminating eutrophic stations were aquatic angiosperm cover, the high chlorophyll-a content, and orthophosphates concentrations.

4.2. TWEAM Functioning

Regarding the three-step evaluation procedure (Section 2.2), phase 1, based on WFD indicators of pressure (nutrient thresholds) and status (MaQI), allowed the rapid classification of approximately 25% of stations, of which, approximately 2% were classified in eutrophic status (DIN and P-PO4 concentrations failed the G/M thresholds and MaQI showed less than good status), and 23% in a non-eutrophic status (both nutrients under the thresholds and MaQI in good or high status) (Table S2). In the remaining 75% of investigated sites, phase 1 did not allow the assessment of eutrophication status due to mis-matching between DIN and P-PO4 classification (approximately 35%) or between nutrients and MaQI status (approximately 40%). The mis-matching between nutrients and MaQI classification could be caused by several factors. Despite the efforts in setting the nutrient thresholds based on the pressure–response relationships with the most sensitive biological elements [36], the classification system is affected by an intrinsic uncertainty, introduced by the reference conditions and class boundaries [37]. In addition, the presence of pressures on macrophytes other than nutrient enrichment could impact the agreement between MaQI and DIN or P-PO4 classification. In these cases, the introduction of TWQI in phase 2 allowed to provide a more comprehensive and less influenced by class boundaries evaluation, not imposing thresholds for every single metric, but only class boundaries for the final score.
The results highlighted that the classification based on a single indicator or metric (e.g., nutrient concentrations) could provide misleading indications. Several stations resulted in non-eutrophic status, even if exceeding the threshold for nutrients (e.g., stations FM 401, TEU 201, TEU 401 in Grado-Marano lagoon, FVG Region, C1, and AT_PC01, AT_PU01, in Apulia Region, C3, in Porto Cesareo and Punta della Contessa water bodies, respectively) because of the good or high status of MaQI and TWQI. This mainly depended on the high coverage of aquatic angiosperms, low concentration of chlorophyll-a, and oxygen saturation being close to 100% (Table S1). This should be carefully taken into account in the rigid application of the “one out all out” approach proposed by the WFD, where the exceeding of nutrient thresholds, whose role is to support the pristine status of biological communities, could lead to a downgrade in the overall ecological status classification.
On the contrary, some stations resulted in eutrophic status even if both DIN and P-PO4 concentrations were below the G/M threshold (i.e., in good status). In these cases, MaQI and TWQI resulted in poor/bad status, mainly because of the dominance of opportunistic macroalgae, absence of aquatic angiosperms (stations ENC1_3 in Venice Lagoon, Veneto Region, C1, and AT50110-0105 in Stagno di Tortoli, Sardinia Region, C2) and high concentration of chlorophyll-a (st. AT50110-0105) (Table S1).
The 32% of the stations resulted in mesotrophic status. For these stations, TWEAM does not automatically provide the assessment of the risk of eutrophication, and further site-specific analysis is required (Section 2.2). The transitional systems are generally characterized by high background productivity. Hence, the identification of a pressure-specific signal (such as eutrophication) against a highly variable natural background compounded by competing effects of impacts arising from other pressures may be difficult [1,2]. Mesotrophic status in transitional waters can represent a sustainable condition stable over time, linked to a background of high productivity typical of these environments and, therefore, it may not represent a risk of eutrophication [2], even in the absence of further restoration measures.

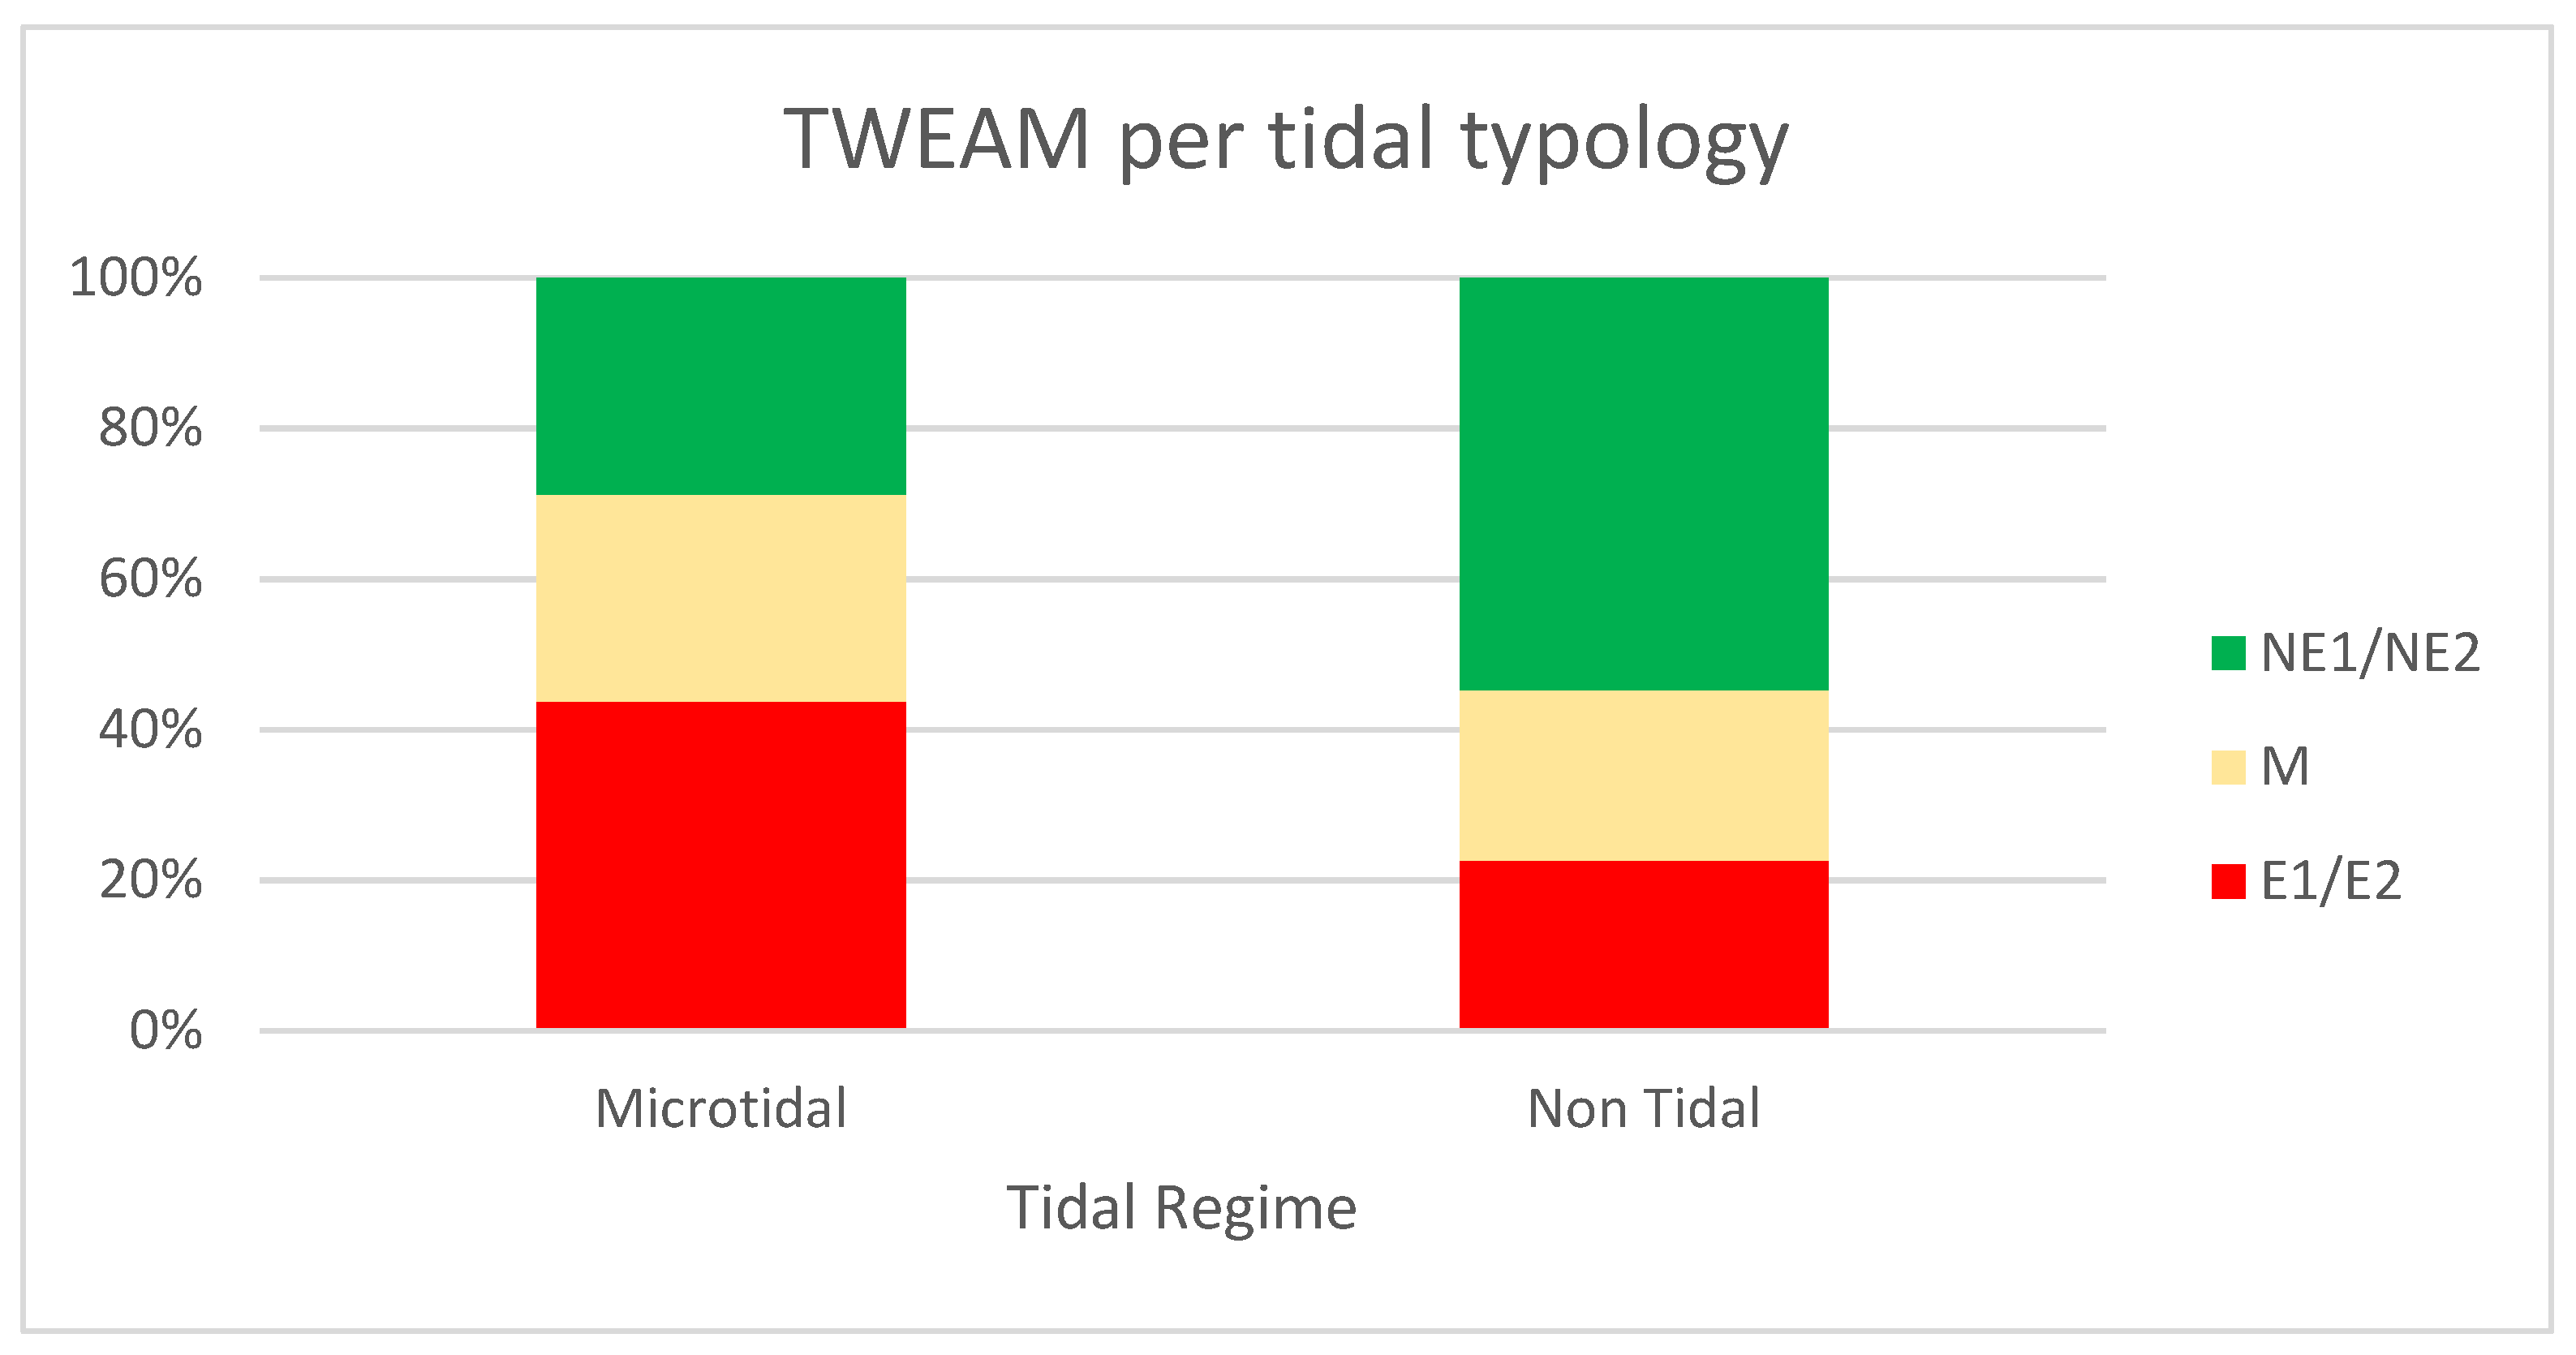
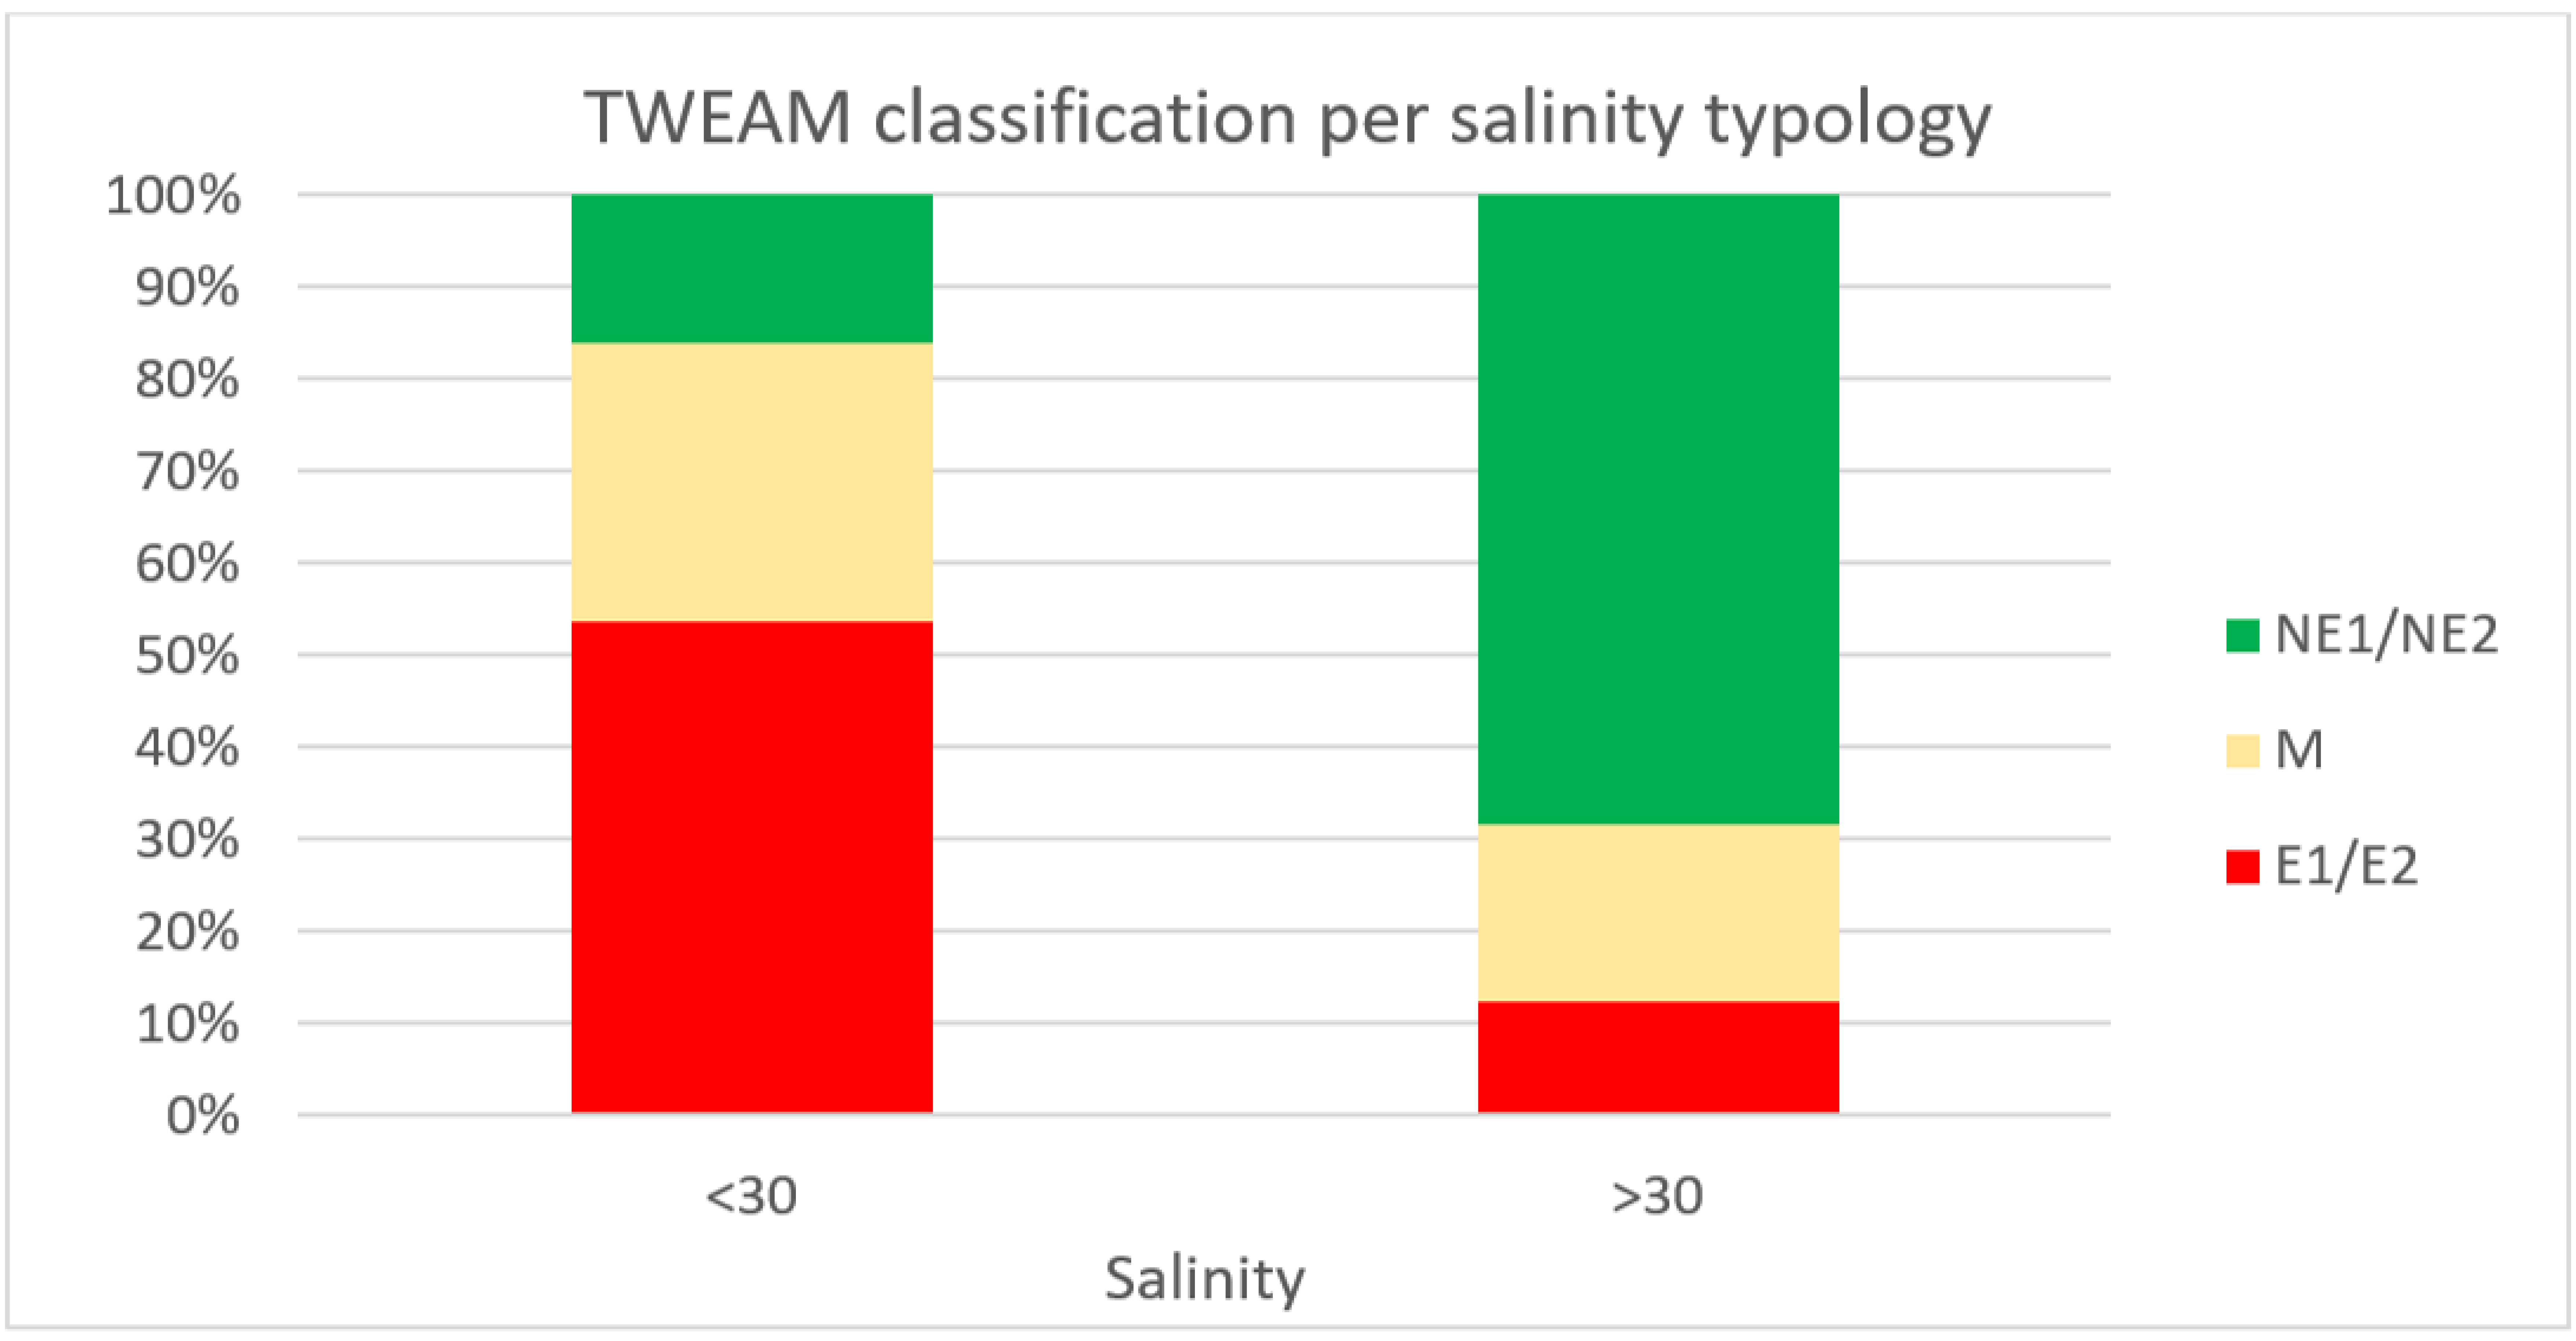
4.3. Relationship between Eutrophic Status and WB Types

Coastal lagoons present a wide variability of their hydrological and morphological conditions (both natural and human modified) [38] that control the ecological functioning of the system and influence the vulnerability of water bodies to nutrient enrichment [1]. Freshwater inputs from the watershed directly impact on the nutrient loads and the magnitude of water exchanges with the sea, which in microtidal systems, are strictly related to tide excursion. Moreover, the interaction between freshwater and seawater inflows (as well as rain, evaporation, and wind-driven forces) controls the salinity patterns of lagoons [39], which could be used as an indicator of the relative contribution of inland and marine dominance, other than directly influencing the aquatic flora composition [40].
The study stations cover all salinity classes, with a prevalence of polyhaline stations (69/126) and eu-hyperhaline stations (57/126), while only 12 stations were oligo-mesohaline. On average, the results confirmed that oligo-meso-polyhaline stations are generally more sensitive to eutrophication, than eu-hyperhaline (53% and 12% in eutrophic status, respectively). Differently, microtidal lagoons resulted in worse eutrophication status (44% eutrophic) than non-tidal (22% eutrophic). Apparently, these results contrast with the assumption that higher seawater exchange, usually characterizing the tidal waterbody, reduces the risk of eutrophication by oxygenation and nutrient dilution [1]. Actually, 43% of microtidal stations are in meso-polyhaline waterbodies, and most of them are located in the Po Delta lagoons, directly influenced by the Po River nutrient loads, or in the inner sub-basin of larger Northern Adriatic lagoons [38], characterized by higher residence time [41,42] and directly receiving input from their small river basins. Limiting the analysis to euhaline microtidal stations, only 4/26 resulted in eutrophic status.
In addition, in Mediterranean lagoons, the tidal flow is often a major driver of seawater exchange and circulation. Indeed, even if classified as “non-tidal”, these lagoons are often subject to a tidal range just below 50 cm, e.g., in the Southern Adriatic sea (Apulia compound), and should be more properly defined as “nanotidal”, as suggested by [38].
Despite the above-discussed patterns, in all the above-mentioned groups, a large variation of trophic status was observed, demonstrating TWEAM’s ability to discriminate trophic status among stations belonging to similar typology and indicating that, at least for the Mediterranean basin and, mostly, in the Italian lagoons, salinity and tide excursion do not prevent, per se, the effectiveness of this method to provide a reliable assessment taking into account the natural variability of TWs.
Overall, MaQI and TWQI highly contributed to the TWEAM eutrophication assessment, being the factors that mainly explained the PC1 in the PCA analysis. In addition, in meso-polyhaline stations, the variability of the trophic status is also explained by the P-PO4 and DIN concentrations (phase 1), in NT and MT sites, respectively. Differently, nutrient concentrations (phase 1) seem to have a minor impact on the TWEAM score for eu-polyhaline microtidal stations (MT > 30), where, generally, the values resulted under the settled thresholds. However, it must be taken into consideration that nutrient concentrations also contribute to the TWQI score, through the quality functions, and therefore, assessment is not influenced by the thresholds. Hyperhaline non-tidal sites (NT > 30) showed less clear patterns.

4.4. Further Developments

Further implementation of TWEAM could include the integration of quantitative indicators for the trend of nutrients and phytoplankton status assessment, in particular in phase 3 for the evaluation of the eutrophication risk in sites classified as mesotrophic in phase 2. In the current version of TWEAM, phytoplankton, a key element of primary production in transitional systems, is only indirectly considered as chlorophyll-a content in the determination of TWQI, and no information on biodiversity and abundance are taken into account. Therefore, inclusion of the Multimetric Phytoplankton Index [43], adopted for Italian lagoon classification, in the TWEAM will be considered. Another issue worthy of future investigation concerns a site-specific analysis of the TWEAM response to the different sources of point and non-point pressures, both at metric and variable levels.

5. Conclusions

This study demonstrated the effectiveness of TWEAM to provide a rapid and reliable quantitative assessment of eutrophication risk in most Italian transitional waters. The TWEAM approach could be easily adaptable for application to other European TWs, modifying the type-specific boundaries for nutrients (phase 1). Nutrients and TWQI can be easily applied, with the former being commonly monitored and regulated in most European member states and the latter being previously tested and validated in six transitional water ecosystems. Moreover, the non-linear utility functions and weighting factors for TWQI calculation were also derived from a wide international literature [7]. MaQI is not used in all member states, but it was intercalibrated with other macrophyte indices used in the Mediterranean Ecoregion [44]; therefore, it can be directly applicable in that context.

Supplementary Materials

The following supporting information can be downloaded at: https://www.mdpi.com/article/10.3390/environments9040041/s1, Table S1. TWQI data input and results; Table S2. TWEAM data input and results.

Author Contributions

Conceptualization, A.B., E.P. and R.B.B.; methodology, A.B., E.P., R.B.B., M.N., P.P., S.P., E.R. and N.U.; software, A.B. and E.P.; validation, A.B., E.P., F.C., E.R., S.P., P.P., M.N., N.U., A.A., P.M. and R.B.B.; investigation, E.R., S.P., P.P., M.N., N.U., A.A. and P.M.; data curation, A.B., E.P., R.B.B. and F.C.; writing—original draft preparation, E.P., A.B. and F.C.; writing—review, R.B.B., A.S. and G.G. All authors have read and agreed to the published version of the manuscript.

Funding

This research received no external funding. The work was carried out by the ISPRA and the Regional Environmental Agencies in the framework of institutional activities of the National System for Environmental Protection (SNPA) and of the Italian Ministry for Ecological Transition for the development of the methodologies for the eutrophication assessment in surface waterbodies (DD 408/2017).

Institutional Review Board Statement

Not applicable.

Informed Consent Statement

Not applicable.

Data Availability Statement

All data used in this study are included in the Supplementary Materials.

Acknowledgments

The authors would like to thank the colleagues of the Italian Ministry for Ecological Transition—Direzione generale USSRI—AT Sogesid—Claudia Vendetti, Silverio Abati, and Maria Camilla Mignuoli, for their useful input and review during the development of the TWEAM. We also thank Carla Rita Ferrari (ARPAE), Oriana Blasutto (ARPA FVG), Antonietta Porfido and Erminia Sgaramella (ARPA Puglia), and Roberto Angius (ARPA Sardegna), for their active contribution in the finalization and testing of the method. Finally, we thank all colleagues of the involved Regional Environmental Agencies who contributed to producing the data used in this paper.

Conflicts of Interest

The authors declare no conflict of interest.

References

  1. Zaldívar, J.M.; Cardoso, A.C.; Viaroli, P.; Newton, A.; de Wit, R.; Ibanez, C.; Reizopoulou, S.; Somma, F.; Razinkovas, A.; Basset, A.; et al. Eutrophication in transitional waters: An overview. Transit. Waters Monogr. 2008, 1, 1–78. [Google Scholar] [CrossRef]
  2. European Commission. Eutrophication Assessment in the Context of European Water Policies. Common Implementation Strategy Guidance for the Water Framework Directive (2000/60/EC); Guidance Document No. 23; Office for Official Publications of the European Union: Luxembourg, 2009; p. 137. Available online: https://circabc.europa.eu/sd/a/9060bdb4-8b66-439e-a9b0-a5cfd8db2217/Guidance_document_23_Eutrophication.pdf (accessed on 6 February 2022).
  3. Kuuppo, P.; Blauw, A.; Møhlenberg, F.; Kaas, H.; Henriksen, P.; Krause-Jensen, D.; Ærtebjerg, G.; Bäck, S.; Erftemeijer, P.; Gaspar, M.; et al. Nutrients and eutrophication in coastal and transitional waters. In Indicators and Methods for the Ecological Status Assessment under the Water Framework Directive; EUR 22314 EN; Publications Office of the European Union: Luxembourg, 2005; pp. 33–80. [Google Scholar]
  4. Ferreira, J.G.; Andersen, J.H.; Borja, A.; Bricker, S.B.; Camp, J.; Cardoso da Silva, M.; Garces, E.; Heiskanen, A.-S.; Humborg, C.; Ignatiades, L.; et al. Overview of eutrophication indicators to assess environmental status within the European Marine Strategy Framework Directive. Estuar. Coast. Shelf Sci. 2011, 93, 117.e131. [Google Scholar]
  5. Souchu, P.; Ximenes, M.C.; Lauret, M.; Vaquer, A.; Dutriex, E. Mise a Jour D’indicateurs du Niveau D’eutrophisation des Milieux Lagunaires Mediterraneens; Ifremer-Creocean-Universite Montpellier II: Montpellier, France, 2000; Volume II, 412p. [Google Scholar]
  6. Bricker, S.B.; Ferreira, J.G.; Simas, T. An integrated methodology for assessment of estuarine trophic status. Ecol. Model. 2003, 169, 39–60. [Google Scholar]
  7. Giordani, G.; Zaldivar, J.M.; Viaroli, P. Simple tools for assessing water quality and trophic status in transitional water ecosystems. Ecol. Ind. 2009, 9, 982–991. [Google Scholar]
  8. Wu, Z.; Yu, Z.; Song, X.; Yuan, Y.; Cao, X.; Liang, Y. Application of an integrated methodology for eutrophication assessment: A case study in the Bohai Sea. Chin. J. Ocean. Limnol. 2013, 31, 1064–1078. [Google Scholar] [CrossRef]
  9. Fertig, B.; Kennish, M.J.; Sakowicz, G.P.; Reynolds, G. Mind the Data Gap: Identifying and Assessing Drivers of Changing Eutrophication Condition. Estuaries Coasts 2014, 37, 198–221. [Google Scholar] [CrossRef]
  10. Cloern, J. Our Evolving Conceptual Model of the Coastal Eutrophication Problem. Mar. Ecol. Prog. Ser. 2001, 210, 223–253. [Google Scholar]
  11. Bonometto, A.; Giordani, G.; Ponis, E.; Facca, C.; Boscolo Brusà, R.; Sfriso, A.; Viaroli, P. Assessing eutrophication in transitional waters: A performance analysis of the Transitional Water Quality Index (TWQI) under seasonal fluctuations. Est. Coast. Shelf Sci. 2019, 216, 218–228. [Google Scholar]
  12. Birk, S.; Bonne, W.; Borja, A.; Brucet, S.; Courrat, A.; Poikane, S.; Solimini, A.; Bund, W.; Zampoukas, N.; Hering, D. Three hundred ways to assess Europe’s surface waters: An almost complete overview of biological methods to implement the Water Framework Directive. Ecol. Ind. 2012, 18, 31–41. [Google Scholar]
  13. Sfriso, A.; Facca, C.; Bonometto, A.; Boscolo, R. Compliance of the macrophyte quality index (MaQI) with the WFD (2000/60/EC) and ecological status assessment in transitional areas: The Venice lagoon as study case. Ecol. Ind. 2014, 46, 536–547. [Google Scholar]
  14. Orfanidis, S.; Panayotidis, P.; Stamatis, N. An insight to ecological evaluation index (EEI). Ecol. Ind. 2003, 3, 27–33. [Google Scholar] [CrossRef]
  15. Scanlan, C.; Foden, J.; Wells, E.; Best, M. The monitoring of opportunistic macroalgal blooms for the Water Framework Directive. Mar. Pollut. Bull. 2007, 55, 162–171. [Google Scholar] [CrossRef] [PubMed]
  16. Muxika, I.; Borja, A.; Bald, J. Using historical data, expert judgement and multivariate analysis in assessing reference conditions and benthic ecological status, according to the European Water Framework Directive. Mar. Pollut. Bull. 2007, 55, 16–29. [Google Scholar] [PubMed]
  17. Mistri, M.; Munari, C. BITS: A SMART indicator for soft-bottom, non-tidal lagoons. Mar. Pollut. Bull. 2008, 56, 587–599. [Google Scholar] [CrossRef]
  18. Zucchetta, M.; Capoccioni, F.; Franzoi, P.; Ciccotti, E.; Leone, C. Fish Response to Multiple Anthropogenic Stressors in Mediterranean Coastal Lagoons: A Comparative Study of the Role of Different Management Strategies. Water 2021, 13, 130. [Google Scholar] [CrossRef]
  19. Varvaglione, B.; Sabetta, L.; Basset, A. Tra Terra e Mare. Ecoguida alla Scoperta Delle Lagune e dei Laghi Costieri in Puglia; Università degli Studi di Lecce: Lecce, Italy, 2006. [Google Scholar]
  20. Cataudella, S.; Crosetti, D.; Massa, F. Mediterranean Coastal Lagoons: Sustainable Management and Interactions among Aquaculture, Capture Fisheries and the Environment; Food and Agriculture Organization of the United Nations (FAO) Studies and Reviews General Fisheries Commission for the Mediterranean: Rome, Italy, 2015; p. 293. [Google Scholar]
  21. ISPRA. Protocolli per il Campionamento e la Determinazione Degli Elementi di Qualità Biologica e Fisico-Chimica Nell’ambito dei Programmi di Monitoraggio ex 2000/60/CE delle Acque di Transizione; El-Pr-TW-Protocolli Monitoraggio-03.06; ISPRA: Roma, Italy, 2019.
  22. Christia, C.; Giordani, G.; Papastergiadou, E. Assessment of ecological quality of coastal lagoons with a combination of phytobenthic and water quality indices. Mar. Poll. Bull. 2014, 86, 411–423. [Google Scholar]
  23. R Core Team. R: A Language and Environment for Statistical Computing. R Foundation for Statistical Computing, Vienna, Austria. 2019. Available online: https://www.R-project.org/ (accessed on 6 February 2022).
  24. Vollenweider, R.A.; Rinaldi, A.; Montanari, G. Eutrophication, structure and dynamics of a marine coastal system: Results of a ten years monitoring along the Emilia-Romagna coast (Northwest Adriatic Sea). In Marine Coastal Eutrophication; Vollenweider, R.A., Marchetti, R., Viviani, R., Eds.; Elsevier: Amsterdam, The Netherlands, 1992; pp. 63–196. [Google Scholar]
  25. Carlson, R.E. A trophic state index for lakes. Limnol. Oceanogr. 1997, 22, 361–369. [Google Scholar] [CrossRef] [Green Version]
  26. Sfriso, A.; Marcomini, A.; Pavoni, B. Relationship between macroalgal biomass and nutrient concentrations in a hypertrophic area of the Venice lagoon. Mar. Environ. Res. 1987, 22, 297–312. [Google Scholar]
  27. McGlathery, K.J.; Sundback, K.; Anderson, I.C. Eutrophication in shallow coastal bays and lagoons: The role of plants in the coastal filter. Mar. Ecol. Prog. Ser. 2007, 348, 1–18. [Google Scholar]
  28. Viaroli, P.; Bartoli, M.; Giordani, G.; Naldi, M.; Orfanidis, S.; Zaldivar, J.M. Community shifts, alternative stable, biogeochemical controls and feedbacks in eutrophic coastal lagoons: A brief overview. Aquat. Conserv. Mar. Freshwat. Ecosyst. 2008, 18, 105–117. [Google Scholar]
  29. Sfriso, A.; Buosi, A.; Facca, C.; Sfriso, A.A. Role of environmental factors in affecting macrophyte dominance in transitional environments: The Italian lagoons as a study case. Mar. Ecol. 2017, 38, e12414. [Google Scholar] [CrossRef]
  30. Provini, A.; Binelli, A. Environmental quality of the Po River delta. In The Handbook of Environmental Chemistry; Wangersky, P.J., Ed.; Springer: Berlin, Germany, 2006; Volume 5, pp. 175–195. [Google Scholar]
  31. Sfriso, A.; Buosi, A.; Mistri, M.; Munari, C.; Franzoi, P.; Sfriso, A.A. Long-term changes of the trophic status in transitional ecosystems of the northern Adriatic Sea, key parameters and future expectations: The lagoon of Venice as a study case. Nat. Conserv. 2019, 34, 193–215. [Google Scholar] [CrossRef]
  32. Acquavita, A.; Aleffi, F.; Benci, C.; Bettoso, N.; Crevatin, E.; Milani, L.; Tamberlich, F.; Toniatti, L.; Barbieri, P.; Licen, S.; et al. Annual characterization of the nutrients and trophic state in a Mediterranean coastal lagoon: The Marano and Grado Lagoon (northern Adriatic Sea). Reg. Stud. Mar. Sci. 2015, 2, 132–144. [Google Scholar] [CrossRef] [Green Version]
  33. Kralj, M.; De Vittor, C.; Comici, C.; Relitti, F.; Auriemma, R.; Alabiso, G.; Del Negro, P. Recent evolution of the physical-chemical characteristics of a Site of National Interest-the Mar Piccolo of Taranto (Ionian Sea)-and changes over the last 20years. Environ. Sci. Pollut. Res. Int. 2016, 23, 12675–12690. [Google Scholar] [CrossRef] [PubMed]
  34. Malcangio, D.; Manella, N.; Ungaro, N. Environmental quality characteristics of the Apulian transitional waters. Case study: Lagoons of Lesina and Varano (Italy). Aquat. Ecosyst. Health Manag. 2020, 23, 427–435. [Google Scholar] [CrossRef]
  35. Padedda, B.; Pulina, S.; Satta, C.; Lugliè, A.; Magni, P. Eutrophication and Nutrient Fluxes in Mediterranean Coastal Lagoons. In Encyclopedia of Water: Science, Technology Society; Maurice, P., Ed.; John Wiley & Sons, Inc.: Hoboken, NJ, USA, 2019. [Google Scholar] [CrossRef]
  36. Carstensen, J. Statistical principles for ecological status classification of Water Framework Directive monitoring data. Mar. Pollut. Bull. 2007, 55, 3.e15. [Google Scholar]
  37. Salas Herrero, F.; Teixeira, H.; Poikane, S. A Novel Approach for Deriving Nutrient Criteria to Support Good Ecological Status: Application to Coastal and Transitional Waters and Indications for Use. Front. Mar. Sci. 2019, 06, 255. [Google Scholar] [CrossRef]
  38. Tagliapietra, D.; Volpi Ghirardini, A. Notes on coastal lagoon typology in the light of the EU Water Framework Directive: Italy as a case study. Aquat. Cons. 2006, 16, 457–467. [Google Scholar] [CrossRef]
  39. Boutron, O.; Paugam, C.; Luna-Laurent, E.; Chauvelon, P.; Sous, D.; Rey, V.; Meulé, S.; Chérain, Y.; Cheiron, A.; Migne, E. Hydro-Saline Dynamics of a Shallow Mediterranean Coastal Lagoon: Complementary Information from Short and Long Term Monitoring. J. Mar. Sci. Eng. 2021, 9, 701. [Google Scholar] [CrossRef]
  40. Le Fur, I.; De Wit, R.; Plus, M.; Oheix, J.; Simier, M.; Ouisse, V. Submerged benthic macrophytes in Mediterranean lagoons: Distribution patterns in relation to water chemistry and depth. Hydrobiologia 2018, 808, 175–200. [Google Scholar] [CrossRef]
  41. Cucco, A.; Umgiesser, G. Modeling the Venice Lagoon Residence Time. Ecol. Model. 2006, 193, 34–51. [Google Scholar]
  42. Ferrarin, C.; Umgiesser, G.; Scroccaro, I.; Matassi, G. Hydrodynamic Modeling of the Lagoons of Marano and Grado. GEO-ECO-MARINA 2009, 15, 13–19. [Google Scholar]
  43. Facca, C.; Bernardi Aubry, F.; Socal, G.; Ponis, E.; Acri, F.; Bianchi, F.; Giovanardi, F.; Sfriso, A. Description of a Multimetric Phytoplankton Index (MPI) for the assessment of transitional waters. Mar. Poll. Bull. 2014, 79, 145–154. [Google Scholar]
  44. Orfanidis, S.; Sfriso, A.; Laugier, T.; Derolez, V.; Ramfos, A.; Nakou, K.; Birk, S.; Zampoukas, N.; Bonne, W. An intercalibration exercise for benthic macrophyte indices across the Mediterranean Sea coastal lagoons. In Proceeding of the VI EUROLAG & VII LAGUNET Conference, Lecce, Italy, 16–19 December 2013. [Google Scholar]
Figure 1. Study sites. C1: Northern Adriatic Sea compound; C2: Apulian compound; and C3: Sardinian compound.
Environments 09 00041 g001
Figure 2. Distribution of data used in phase 1. (a) Box plots of DIN concentrations collected over three years (n = 126). Orange line indicates threshold set by Italian legislation (DM 260/2010) for water bodies with salinity <30. Blue line indicates the threshold set by Italian legislation (DM 260/2010) for water bodies with salinity >30. (b) Box plots of P-PO4 concentrations collected over three years (n = 126). Blue line indicates the threshold set by Italian legislation (DM 260/2010) for water bodies with salinity >30. (c) Frequency of distribution of MaQI status results of the stations sampled over one year (n = 126).
Environments 09 00041 g002
Figure 3. Phase 2. Distribution of collected data (blue dots) over the quality values curves (orange lines) set for the assessment of the metrics composing the TWQI index.
Environments 09 00041 g003
Figure 4. Frequency of distribution of TWQI classes calculated on the dataset (n = 126).
Environments 09 00041 g004
Figure 5. Eutrophic status assessment by the TWEAM method at sampled stations. N1/N2 (green dots)—not eutrophic; M (yellow dots)—mesotrophic; and E1/E2 (red dots)—eutrophic. (C1): Northern Adriatic compound; (C2): Apulian compound; and (C3): Sardinian compound.
Environments 09 00041 g005
Figure 6. TWEAM classification for each compound C1: Northern Adriatic compound; C2: Apulian compound; and C3: Sardinian compound. Data are expressed as a percentage of stations in each class.
Environments 09 00041 g006
Figure 7. TWEAM classification according to the tidal regime of the sampled stations.
Environments 09 00041 g007
Figure 8. TWEAM classification according to the salinity typology of the sampled stations.
Environments 09 00041 g008
Figure 9. PCA biplot of the two main components for the whole dataset, including the TWEAM metrics as variables and TWEAM score as a supplementary quantitative variable. Data are grouped per salinity (<30, >30) and tidal (MT = microtidal, NT = non-tidal) typologies. For each group, centroids and the confidence ellipses (95% of samples) are shown.
Environments 09 00041 g009
Table 1. Thresholds set for physicochemical quality elements supporting biological elements by national legislation for the implementation of WFD (MD 260/2010).
WB Type (Salinity)Threshold Good/Moderate
salinity < 30Dissolved inorganic nitrogen
(DIN)
30 μM
salinity > 3018 μM
salinity > 30Orthophosphates
(P-PO4)
0.48 μM
Table 2. Application of TWEAM in phase 1 and possible outcomes: integration of nutrients (DIN and P-PO4) and macrophyte (MaQI) status according to MD 260/2010.
PHASE 1Physicochemical Elements
Supporting Biological Elements in the Water Column (MD 260/2010)
MaQI Status
Poor/BadModerateHigh/Good
DIN > Threshold
P-PO4 > Threshold
E1PHASE 2PHASE 2
DIN >Threshold P-PO4 < Threshold (or n.a.)
or
DIN < Threshold P-PO4 > Threshold (or n.a.)
PHASE 2PHASE 2PHASE 2
DIN < Threshold
P-PO4 < Threshold
PHASE 2PHASE 2N1
n.a. = not available.
Table 3. Application of the TWEAM in phase 2 and possible outcomes: integration of nutrients according to MD 260/2010, MaQI, and TWQI.
PHASE 2Physicochemical Elements Supporting Biological Elements in the Water Column (DM 260/2010)TWQIMaQI Status
Poor/BadModerateHigh/Good
DIN > Threshold
P-PO4 > Threshold
High/GoodPHASE
E1
N2N2
ModerateMN2
Poor/BadE2M
DIN > Threshold P-PO4 < Threshold (or n.a.)
or
DIN < Threshold P-PO4 > Threshold (or n.a.)
High/GoodMN2N2
ModerateMMN2
Poor/BadE2E2M
DIN < Threshold
P-PO4 < Threshold
High/GoodMN2PHASE
N1
ModerateMN2
Poor/BadE2M
n.a. = not available.
Table 4. Integrated TWEAM outcomes of phase 2.
N1/N2NON-EUTROPHIC
MMESOTROPHIC
E1/E2EUTROPHIC
Publisher’s Note: MDPI stays neutral with regard to jurisdictional claims in published maps and institutional affiliations.

