Article

An Age Scale for the First Shallow (Sub-)Antarctic Ice Core from Young Island, Northwest Ross Sea

1
Ice Dynamics and Paleoclimate, British Antarctic Survey, Cambridge CB3 0ET, UK
2
Department of Earth Sciences, University of Cambridge, Cambridge CB2 3EQ, UK
3
Research School of Earth Science, The Australian National University, Canberra, ACT 2601, Australia
4
Physics of Ice, Climate and Earth (PICE), Niels Bohr Institute, University of Copenhagen, 2200 Copenhagen, Denmark
5
Institute for Arctic and Alpine Research, University of Colorado, Boulder, CO 80309-0399, USA
6
Australian Antarctic Division, Kingston, TAS 7050, Australia
7
Australian Antarctic Program Partnership, Institute for Marine and Antarctic Studies, University of Tasmania, Hobart, TAS 7004, Australia
8
Department of Environmental Sciences, Informatics and Statistics, Ca’ Foscari University of Venice, 30170 Mestre, Italy
9
CNR-Institute of Polar Sciences (ISP-CNR), 30170 Mestre, Italy
*
Author to whom correspondence should be addressed.
Geosciences 2021, 11(9), 368; https://doi.org/10.3390/geosciences11090368
Submission received: 7 July 2021 / Revised: 24 August 2021 / Accepted: 25 August 2021 / Published: 1 September 2021

Abstract

:
The climate of the sub-Antarctic is important in understanding the environmental conditions of Antarctica and the Southern Ocean. However, regional climate proxy records from this region are scarce. In this study, we present the stable water isotopes, major ion chemistry, and dust records from the first ice core from the (sub-)Antarctic Young Island. We present and discuss various dating approaches based on commonly used ice core proxies, such as stable water isotopes and seasonally deposited ions, together with site-specific characteristics such as melt layers. The dating approaches are compared with estimated precipitation rates from reanalysis data (ERA5) and volcanic cryptotephra shards likely presenting an absolute tie point from a 2001 CE eruption on neighboring Sturge Island. The resulting ice core age scale spans the period 2016 to 1995, with an uncertainty of ±2 years.

1. Introduction

The sub-Antarctic atmospheric and oceanic circulation patterns play a key role in setting the climate conditions of the Antarctic. They are particularly important to the stability of Antarctica’s outlet glaciers, and for this reason, sub-Antarctic sites are increasingly in the spotlight of glaciological research, e.g., [1,2,3,4]. However, field-based records of environmental changes in the region are sparse [5], particularly before the satellite era (since 1979). With the sub-Antarctic highly sensitive to shifts in circulation and potentially in danger of losing the glaciers on its islands as climate archives, there is urgent need to investigate the geochemical proxies preserved in local ice cores to evaluate their potential for climate reconstruction, e.g., of position and strength of westerly winds and regional sea ice extent [2,6]. These parameters will help to understand the drivers and anticipate changes in the Antarctic climate at large.
To assess the sites’ potential for longer paleoclimate records, five shallow ice cores were retrieved from Antarctic and sub-Antarctic sites during the Sub-Antarctic Ice-Coring Expedition 2016–2017 (SubICE [2]). In this study, we present the first glacio-chemical and microparticle records of a 17 m ice core from Young Island.
Young Island (Figure 1) is located ~240 km northwest of Cape Adare, Victoria Land, in the Somov Sea, and represents the northernmost subaerial part of the volcanic Balleny Island ridge [7]. It extends 30 km N–S and 6 km W–E [8] and is entirely glaciated [9]. In this area NW of the Ross Sea, pack ice develops regularly [7,10], and a polynya is known to reoccur annually, especially during austral spring and summer [11,12,13]. Its position and extent appear to vary according to short-term atmospheric circulation with a tendency of the polynya opening up leeward, east of the Balleny Islands (Supplementary Material). Young Island is a valuable ice core site, as it lies in an otherwise data-sparse region. However, accessing the site which is positioned in the so-called stormy sixties and bound by steep cliffs is very challenging. This ice core is further unique due to its position in the seasonal sea ice zone at the interface of circumpolar Westerlies and Antarctic Easterlies and could hold novel information about their interplay in the NW Ross Sea region.
To use the Young Island ice core data for climate reconstructions, we must first define a chronology. A preliminary estimate based on a Herron–Langway densification model driven by the annual average precipitation from ERA5 reanalysis for this site suggests a bottom age of 2002 ± 4 years [2]. However, Young Island is too small to be considered a land grid point in ERA5 and thus the precipitation bears significant uncertainty. This approach also fails to consider the impact of wind scouring or post-depositional changes. Thus, a more robust dating approach is needed to establish the time span of this ice core and ascertain if annual average climate information can be extracted.
Ice core chronologies from high-accumulation sites can be developed using annual layer counting in stable water isotope and geochemistry records [14,15]. Based on their sensitivity to temperature, stable water isotopes are well-established proxies for past air-temperature variations in Antarctica [16,17], providing seasonal cycles for annual layer counting. Glacio-chemical profiles show distinct seasonality based on the source, transport and preservation history of each aerosol species. Marine aerosols include sodium (Na+) from the open ocean [18,19] and sea–ice surfaces [20]; bromide (Br), primarily emitted via sea spray [21] and secondarily through autocatalyzed bromine explosions above fresh, acidic sea ice in spring [22]; sulfate (SO42−), emitted indirectly via sea spray from biogenic dimethylsulfate (~70%, [23]), and to a lesser extent from sulfur dioxide of volcanic and anthropogenic origin [24]; and methanesulfonate (MSA, [18]), a product of marine algae and phytoplankton activity. Nitrate (NO3) aerosols are produced naturally during soil and ocean denitrification [25], and have an additional extraterrestrial source through nitrogen fixation during lightning [26,27,28]. Hydrogen peroxide (H2O2), a proxy for identifying annual layers in Antarctic ice cores with high accumulation (>0.22 m a−1, [29]), stems from photolysis during the sunlight season [30]. Br, SO42−, MSA, and NO3 concentrations peak during summer, mainly driven by the biogenic cycle, so that their similar phasing in ice cores can be used for dating. The concentration, size distribution and geochemical composition of insoluble particulate matter in ice cores, which we refer to as dust using the convention of Tetzner et al. [31], give further insight into environmental conditions of the past [32,33]. In the NW Ross Sea, dust is expected to stem largely from Australia and New Zealand [34].
The objectives of this study are to (1) evaluate meteorological information available from a local automatic weather station (AWS) and ERA5 reanalysis; (2) present multiple dating approaches based on stable water isotopes, glacio-chemical data, and physical characteristics; (3) evaluate a potential absolute age marker of volcanic source, and (4) determine an age scale for future climate interpretation. Consequently, this study aims to contribute to a first glaciological characterization of Young Island and lay a foundation for future ice core studies at the site.

2. Materials and Methods

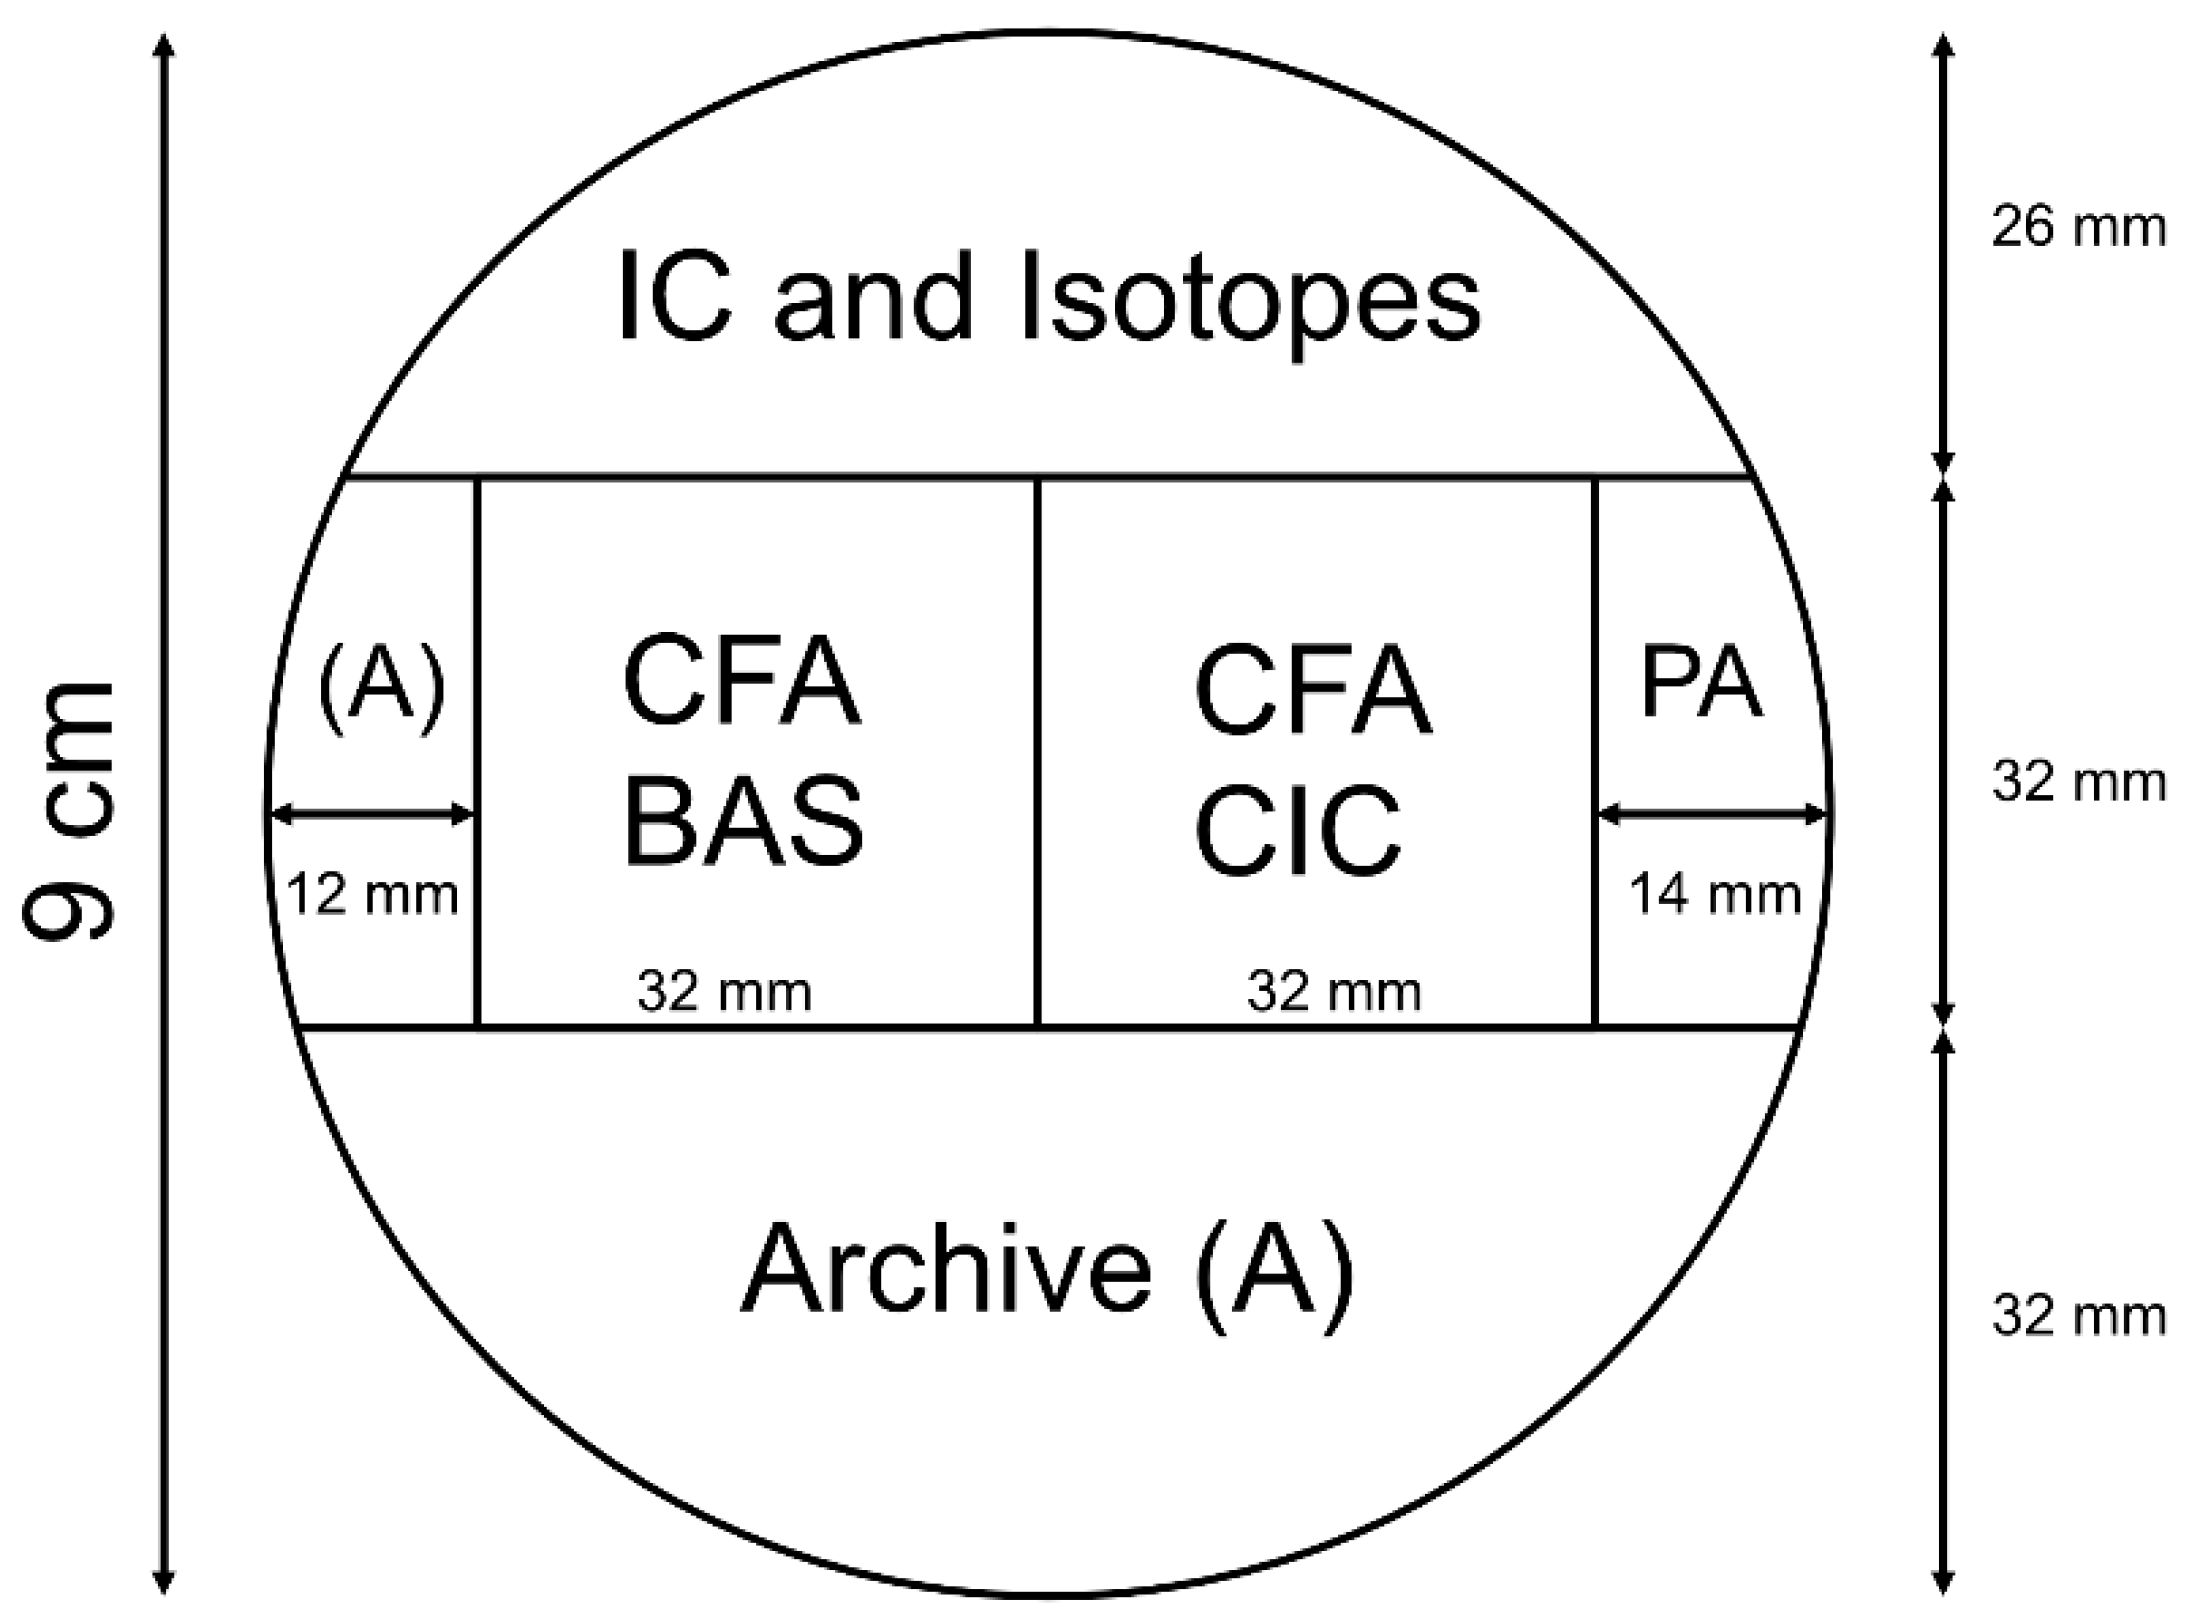
2.1. Ice Core Drilling and Processing

On 4 February 2017, a shallow ice core was drilled to a depth of 16.92 m on Young Island (66°31′44.3″ S, 162°33′21.5″ E). The ice core site is an ice saddle at the southern tip of Young Island (Figure 1b), 238 m above sea level (a.s.l.). With the drilling location situated in an extensional flow regime, ground-penetrating radar revealed several crevasses near the ice core position covered by 4–5 m of well-stratified snow [2]. The core was drilled using a motorized Kovacs ice-core drill (Mark II) powered by a 4-stroke Honda generator, with core retrieval aided by a sidewinder winch. Ice core sections of 0.20–0.81 m length were retrieved, logged, sealed in ethylene-vinyl-acetate-treated (EVA) polythene bags, and packed in insulating boxes [2]. They were kept at −20 °C during the Antarctic Circumpolar Expedition (ACE cruise) and shipped to the British Antarctic Survey (BAS), Cambridge UK, where the cores were stored at −25 °C.
In August 2017, the Young Island ice core was sampled for various discrete and continuous analyses (Figure 2) using a stainless-steel bandsaw in the cold lab facilities at BAS. The weight and length of each bag and ice core fragment were measured, respectively, to calculate density and convert the firn depth scale to a water depth scale (meters water equivalent, m w.eq.) for the presented dating approaches. The positions and thickness of homogeneous, bubble-sparse ice lenses visible to the unaided eye, i.e., >1 mm thick, were recorded and interpreted as melt layers. A strip for ion-chromatographic (IC) and stable water isotope measurements was discretely cut into 5 cm slices, sealed in tritan copolyester jars, and kept at −23 °C to avoid temperature-induced alteration of the sample chemistry.
The methods and results for physical characteristics, discrete stable water isotopes, and major ion concentrations presented in Section 3.2.1, Section 3.2.2 and Section 3.2.3. were based on previously unpublished work by D.E. Moser [35].

2.2. Ice Core Discrete Chemistry

Isotope measurements (δ18O) were conducted at BAS in April–May 2018 using a Picarro L2130-i device, using cavity ring down spectroscopy [36,37]. Each sample was measured with seven injections. After removing the first three injections to avoid memory effects, we used the mean of the final four measurements to calculate δ18O with an accuracy of 0.3‰. The measurements are reported against the international standard of Vienna Standard Mean Ocean Water (V-SMOW), and 2σ precision lies at 0.1‰ for δ18O.
Using the same discrete sample material (IC, Figure 2), major ion concentrations were measured using a high-performance Dionex Integrion ion chromatograph with an injection volume of 250 μL in a class-100 cleanroom. For the cation chromatograph, we applied a guard column type CS16-4μm (2 × 50 mm) and a CS16-4μm separator column (2 × 250 mm). For the anion chromatograph, we used an AG17-C guard column (2 × 50 mm) together with an AS17-C analytical column (2 × 250 mm). Here, we specifically focused on SO42−, MSA, Br, and NO3 concentrations. Non-sea-salt SO42− (nssSO42−) and sea-salt Na+ (ssNa+) were calculated using the following equations:
[nssSO42−] = [SO42−] − RSO4-Na sea water × [Na+]
[ssNa+] = [Na+] − [nssCa2+]/Rcrust
[nssCa2+] = [Ca2+] − [ssNa+] × RCa-Na sea water
where RSO4-Na sea water correspond to the mean ratio (weight by weight, abbreviated as: w/w) in bulk sea water (RSO4-Na seawater = 0.252; [38]). Rcrust and RCa-Na sea water correspond to the mean ratios (w/w) in the earth crust (Rcrust = 1.78) and in bulk sea water (RCa-Na sea water = 0.038), respectively [39]. The nssSO42− and ssNa+ were calculated to obtain the nssSO42−:ssNa+ ratio, which has been shown as a valuable tool to enhance austral summer peaks and winter troughs [40].

2.3. Ice Core Continuous Flow Analysis Data

An inner section of the core 32 × 32 mm was shipped to Copenhagen for continuous flow analysis (CFA). The setup resembles the one described by Bigler et al. [41] for the analysis of dust in the particle size range 0.9–15.0 µm and hydrogen peroxide (H2O2, [42]). The core was analysed in May 2018 and melted from the top down. The melt rate was kept at ~5 cm min−1. Standards used for calibration were run for every 3 to 5 m of core, dependent on the core density.
At BAS, continuous flow analysis [41] was used to acquire the liquid hydrogen peroxide concentration based on enzymatic fluorometry, first applied by Lazrus et al. [42], in December 2017. The contamination risk for both CFA sections was considered negligible, because they lay centrally, i.e., ≥0.7 cm inside the ice core rims (Figure 2), and the CFA melt head was set up for decontamination [43].

2.4. Microparticle Analysis

Microscopy analyses of microparticles were performed to examine the presence of cryptotephra shards, indicative of the 2001 CE eruption on Sturge Island, Balleny Islands, reported by Tetzner et al. [44]. For this, ice samples of ~30 cm were cut below a 10 m snow depth, then melted and filtered. Meltwater was filtered through 13 mm diameter 1.0-μm pore-size Whatman™ polycarbonate membrane filters. Filters were analysed on a Quanta-650F Scanning Electron Microscope (SEM) at the Earth Sciences Department of the University of Cambridge. Filters were imaged using backscattered electrons (BSE) on a low-pressure mode at ×800 magnification for cryptotephra shard identification and characterization, following the method presented by Tetzner et al. [31].

2.5. Meteorological Data

An AWS on the northern tip of Young Island (66°13′44.4″ S, 162°16′30.0″ E) at 30 m a.s.l. was operated by the University of Wisconsin-Madison Antarctic Meteorology Program from January 1991 to December 1997. Here, we used 3-hourly, 2-m air temperature that showed a median data coverage of ~88% over this time period after excluding a persistent data gap from November 1994 to February 1996.
In addition, we applied the KNMI Climate Explorer to extract monthly 2-m air temperature averages and monthly precipitation estimates for the region 66.0–67.5° S, 162–165° E from ERA5 reanalysis. ERA5 has a spatial grid resolution of 31 km and is available from January 1979 to the present [45].

3. Results

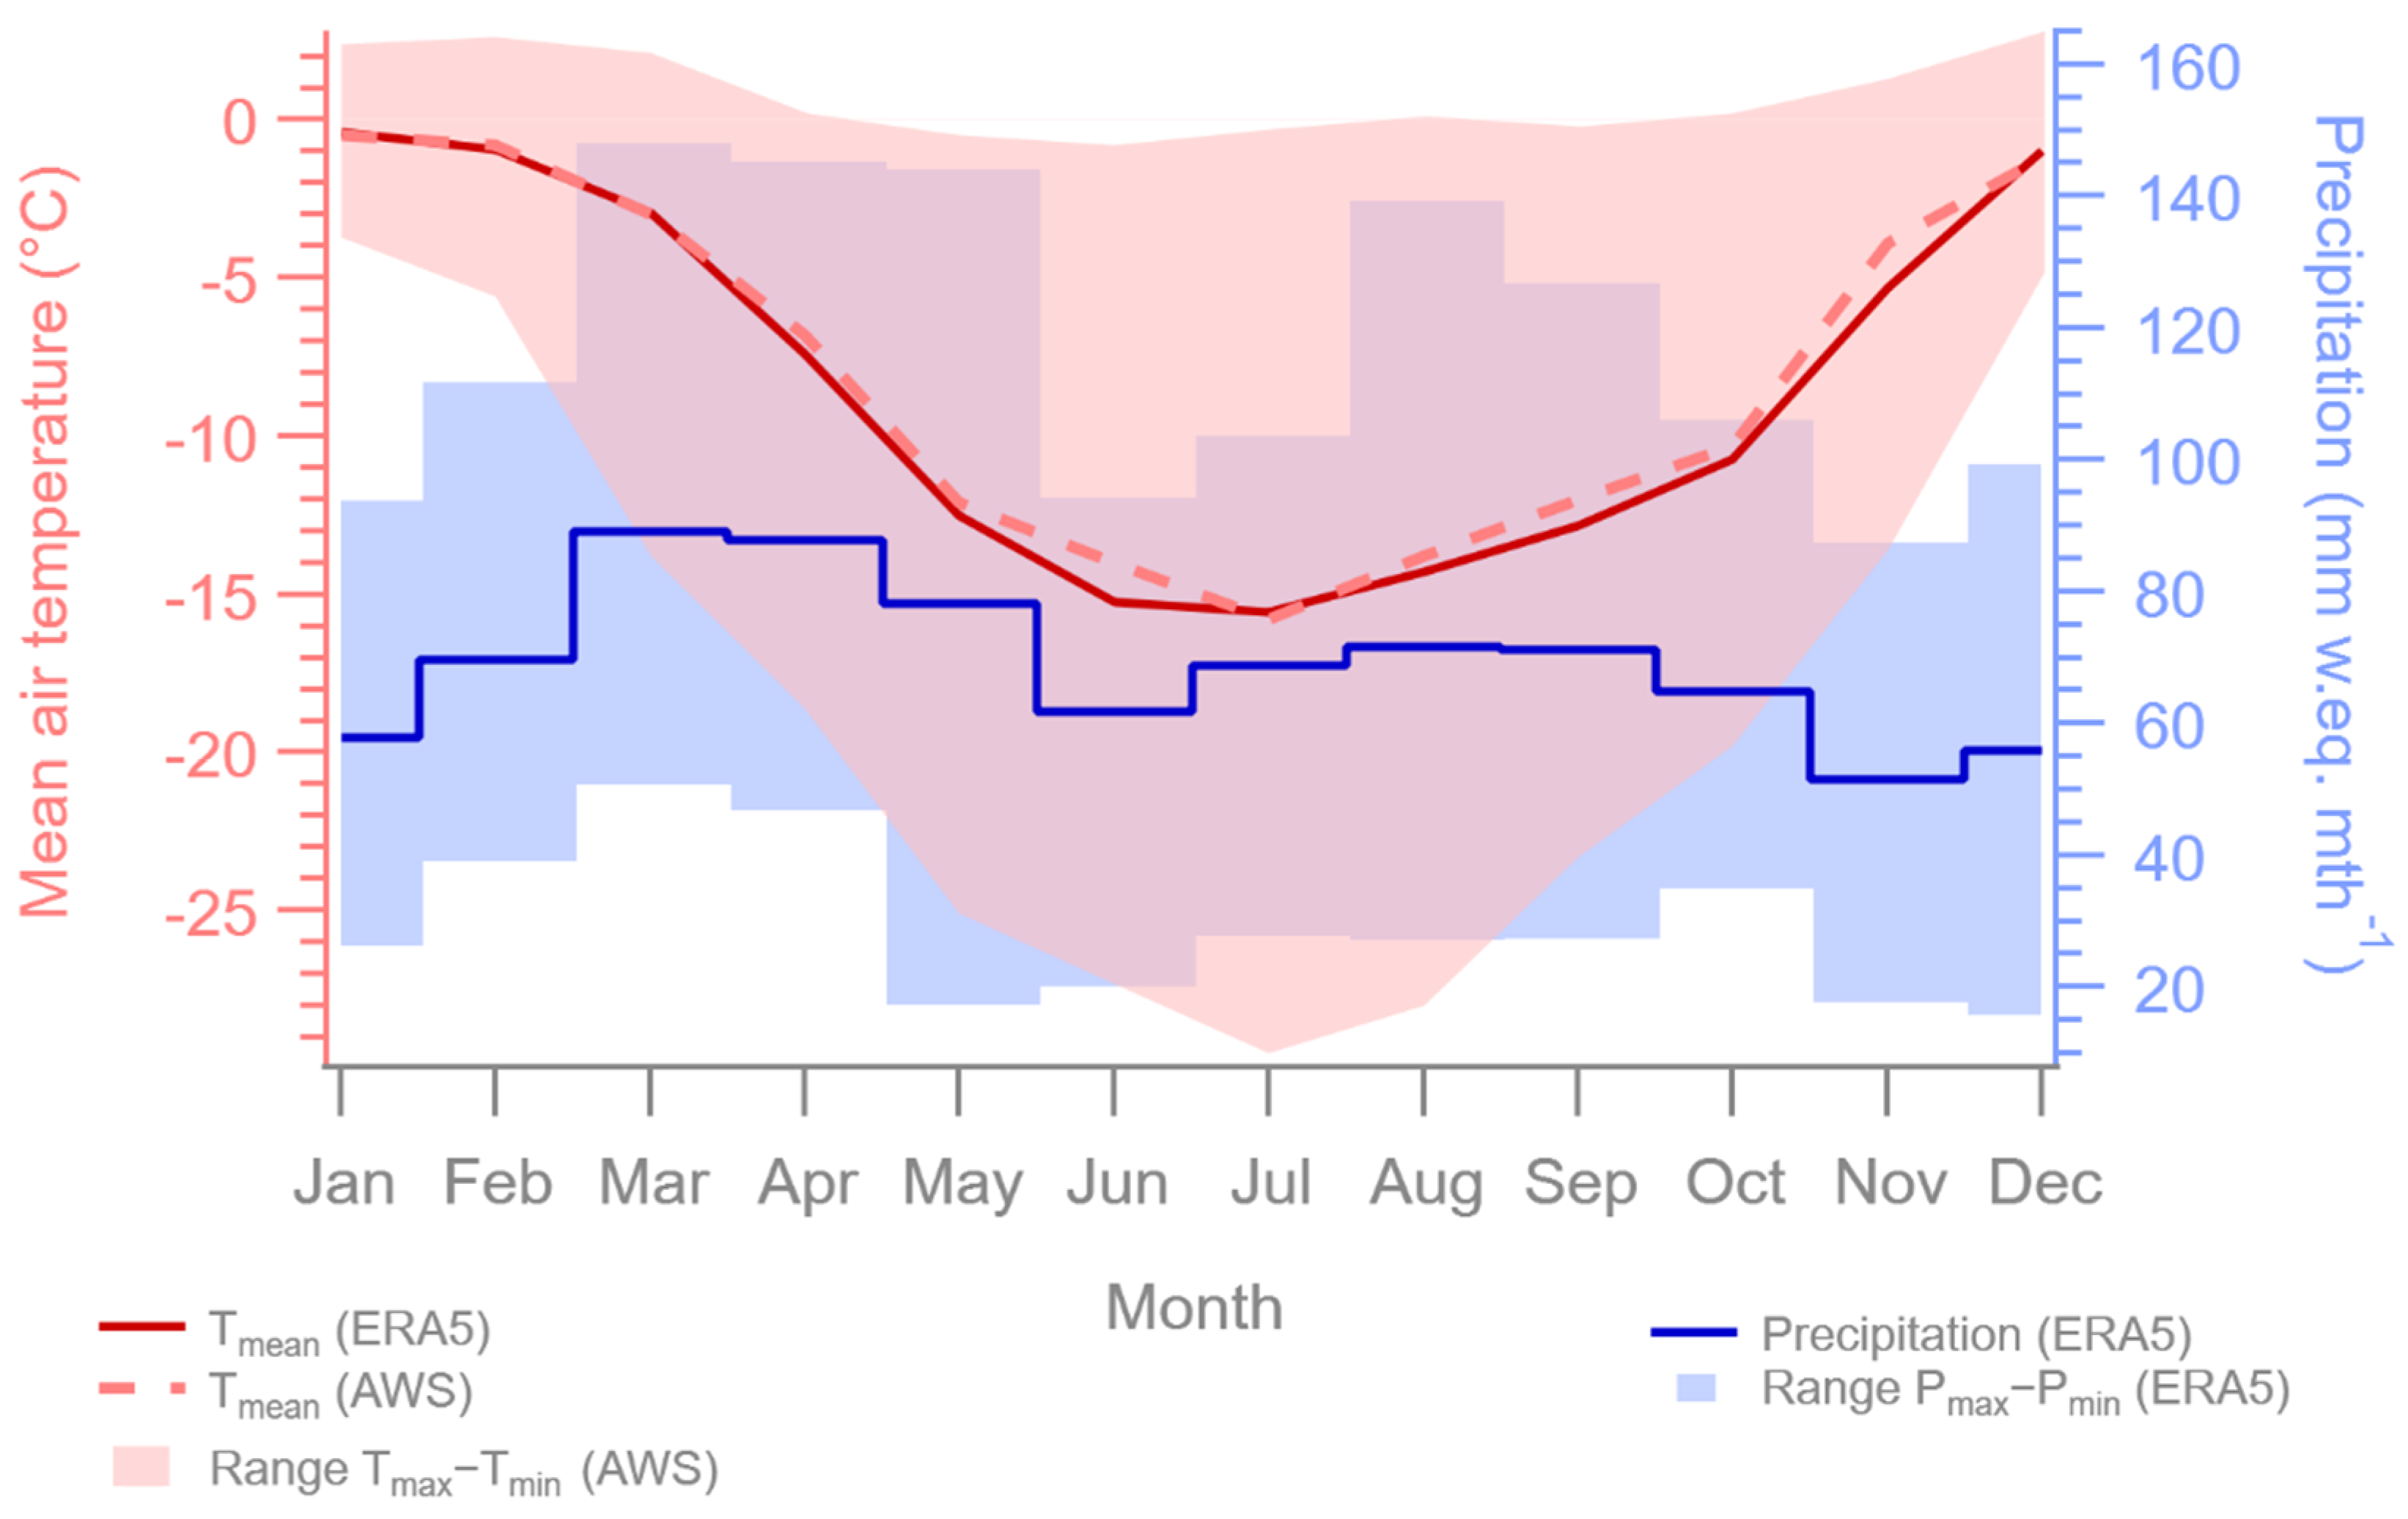
3.1. Meteorological Conditions

The annual mean 2-m air temperature at Young Island derived from the low-elevation AWS (209 m below the drilling site) was −7.9 °C with 3-h mean temperature values spanning from −35.0 °C to +4.2 °C (Figure 3). Seasonal mean air temperatures varied between −1.6 °C in austral summer (November–February) and −13.9 °C during austral winter (May–August; [2]). For the larger Balleny Island area defined above, ERA5 reanalysis yielded a slightly cooler annual mean temperature of −8.3 °C that was driven by a winter-seasonal mean of −15.0 °C. The regional precipitation estimate from ERA5 averaged ~83 cm a1 with interannual variability 67–103 cm a1 and a slight seasonal bias towards austral autumn and spring snowfall (Figure 3).

3.2. Data for Ice Core Dating

3.2.1. Physical Characteristics of the Ice Core

The Young Island ice core was characterized by a substantial densification. The mean density derived from ice core pieces rose from ~500 kg m3 near the surface to ~870 kg m3 at the bottom of the profile (Figure 4a). Based on the binary, unaided-eye identification, the ice core contained a total number of 126 melt layers (Figure 4). Their thickness averaged 6.4 cm and ranged from 0.1 cm to 58 cm [2]. Melt layers occurred throughout the profile but were distributed unevenly in clusters. Most of the observed melt-affected sections appeared as bubble-containing ice (Figure 4b), but a minority of thinner layers were bubble-free or a blending of large crystals with refrozen bubble-containing ice [35].
Thomas et al. [2] estimated a bottom age for the Young Island ice core of 2002 ± 4 years using its density at bag resolution (0.2 m to 0.81 m resolution). Unfortunately, as melt phases were unequally distributed throughout the profile, so was their accelerating effect on snow metamorphism [46]. If extensive melting takes place during a year, the respective annual snow layer will thin more quickly due to facilitated densification. Consequently, temporal resolution in this ice core varies between non-melt (higher) and melt-affected sections (lower) [35].

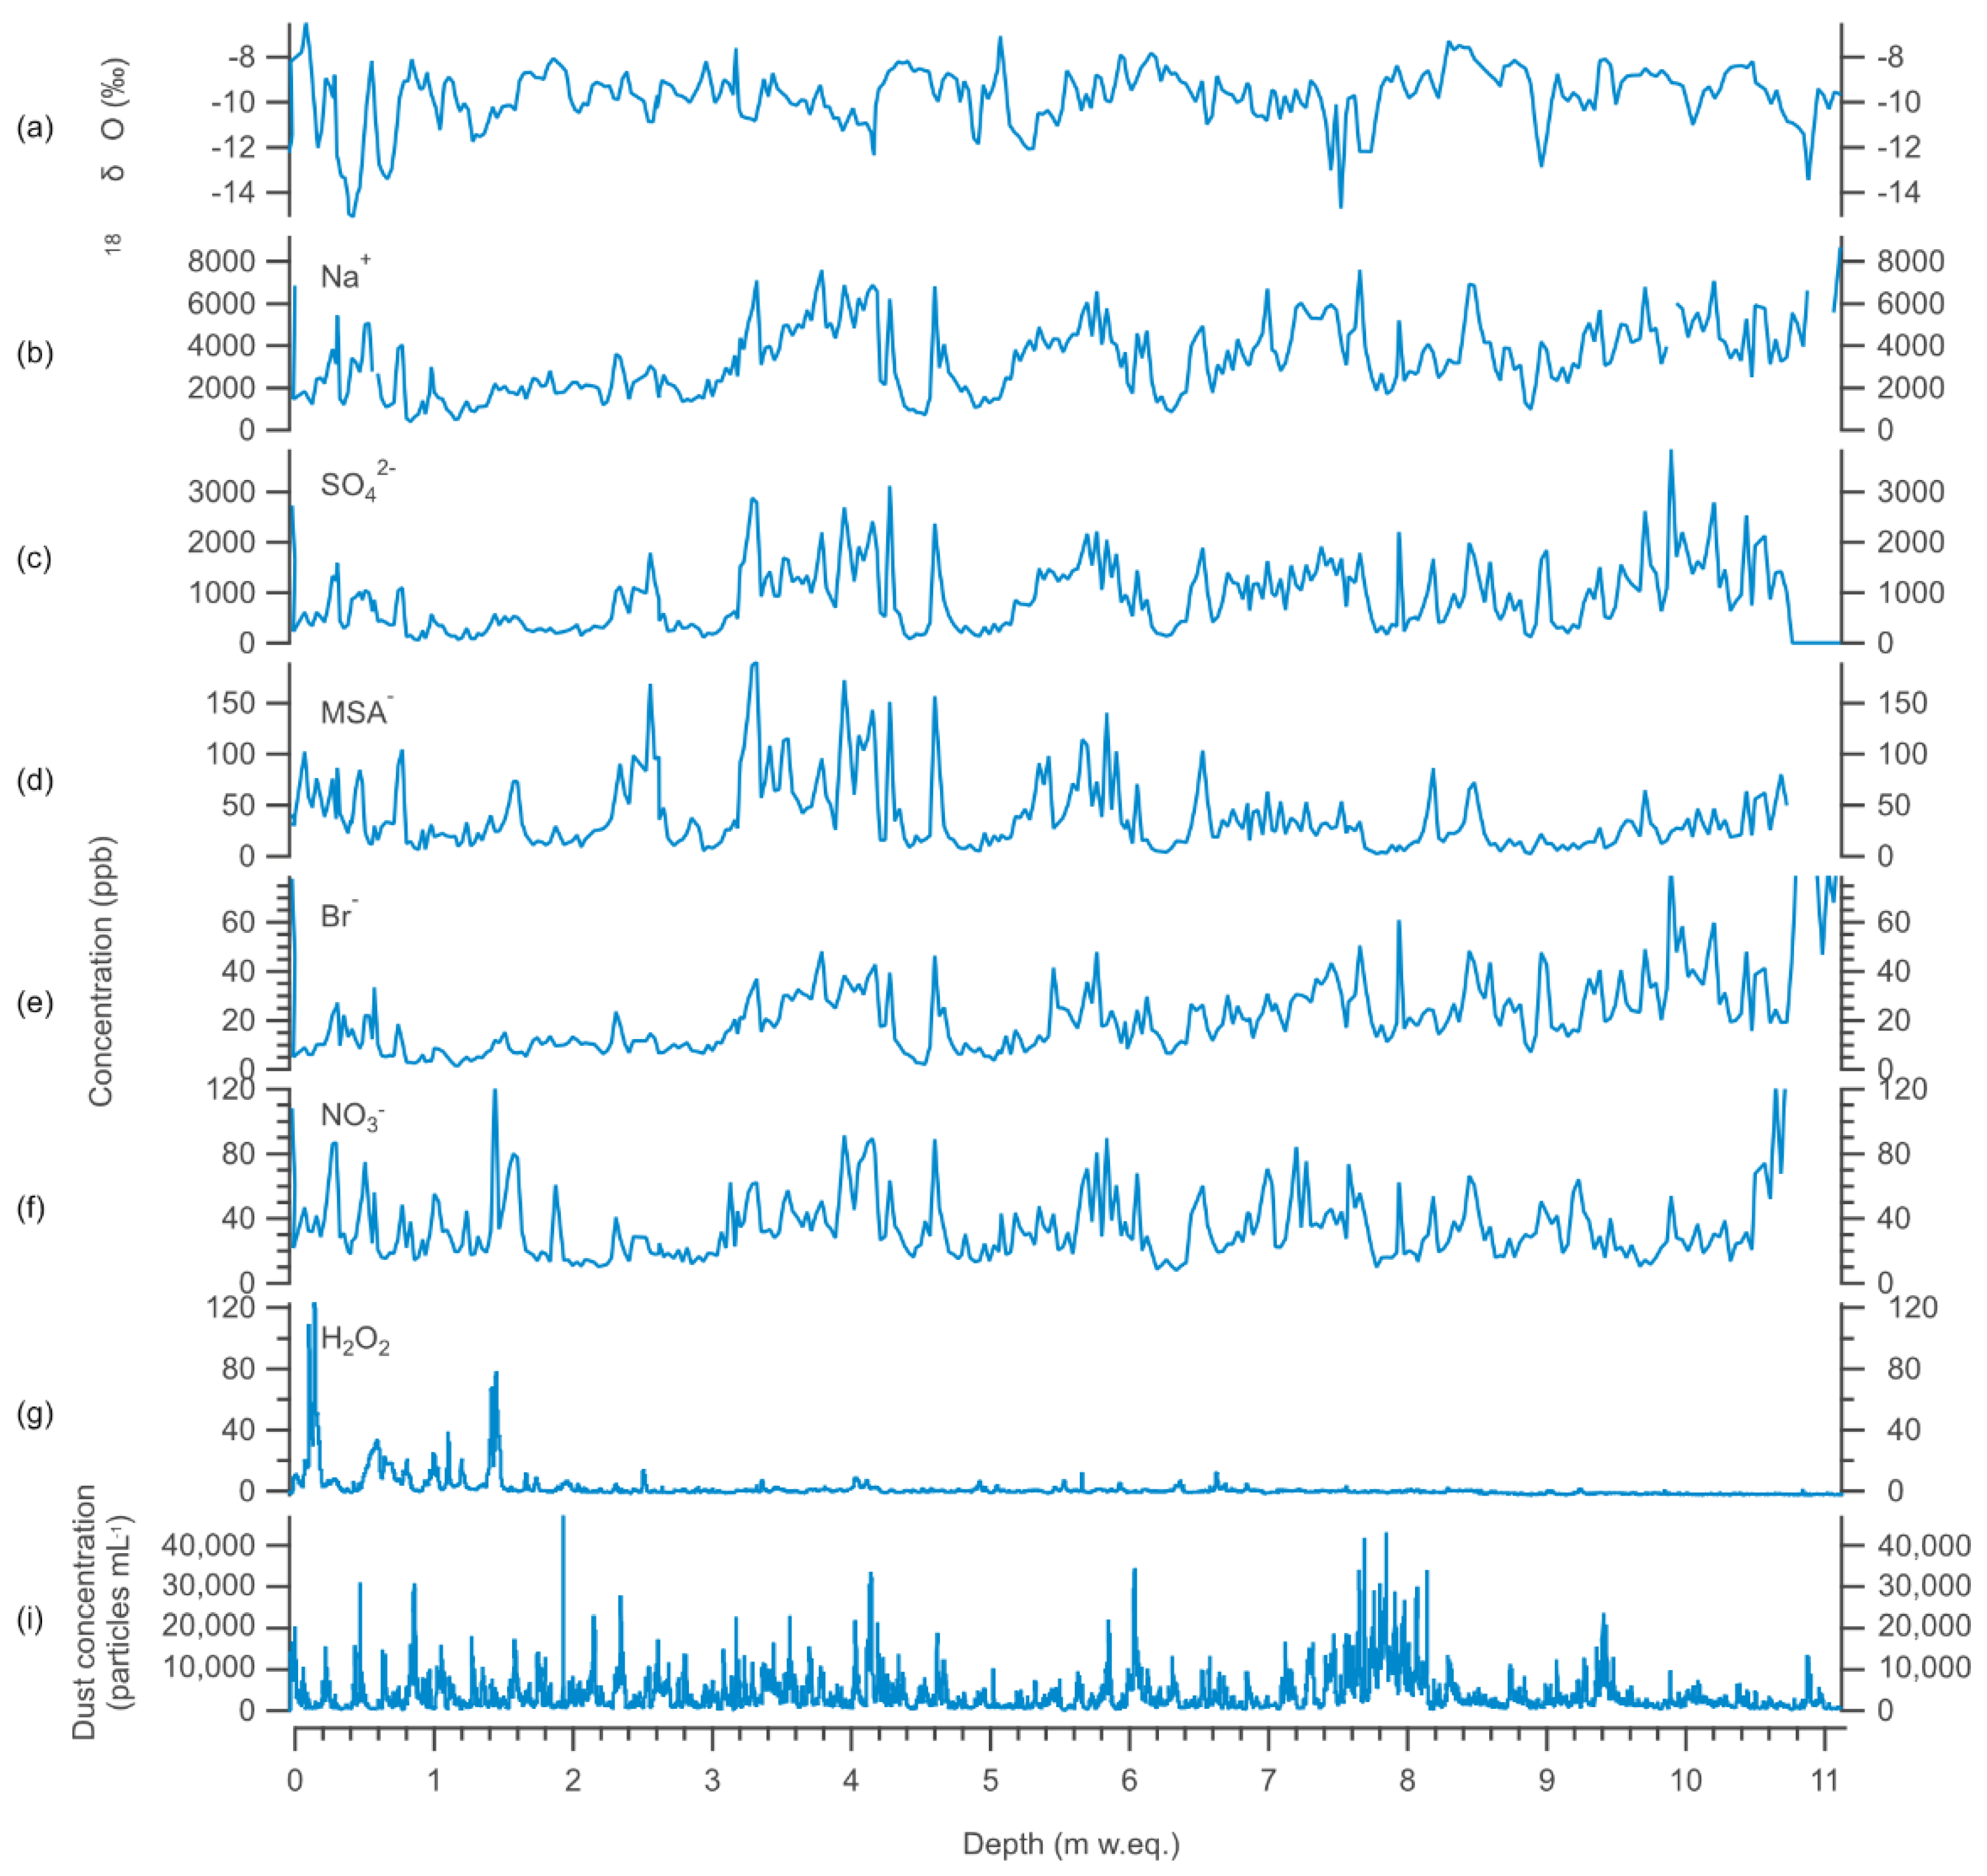
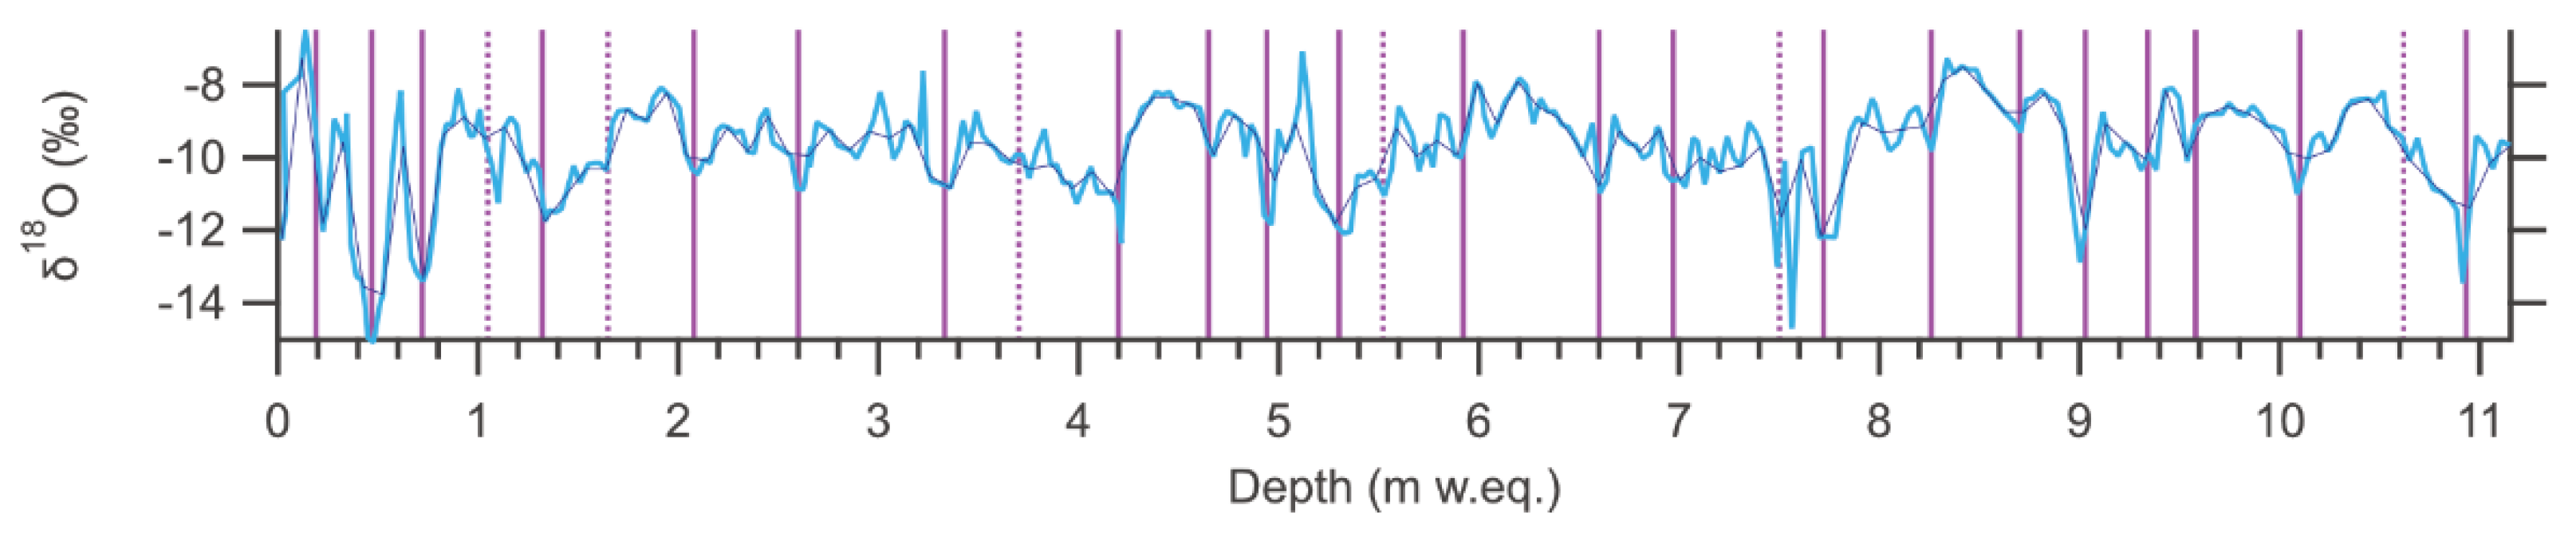
3.2.2. Stable Water Isotopes (δ18O)

δ18O ranged between −15.1‰ and −6.5‰ and exhibited short-term variations over the entire profile (Figure 5a). While the overall mean for δ18O lay at −9.8‰, a slight increase was detected from −10.3‰ (profile top) to −9.3‰ (profile bottom). In the top ~0.75 m w.eq. of the core, δ18O fluctuated with an amplitude of up to ±4.4‰ and at a depth interval of 0.24 ± 0.07 m w.eq. This fit the cyclicity simulated for coastal Adélie Land (±4.5‰, [47]), suggesting that δ18O carries a seasonal signature in this part of the Young Island ice core. At depths >0.75 m w.eq., the amplitude of the local peaks and troughs became more dampened, lying within an amplitude of ±2.2‰. Attenuation of amplitude complicated the identification of annual δ18O cycles but was consistent with vapor diffusion in firn [48].

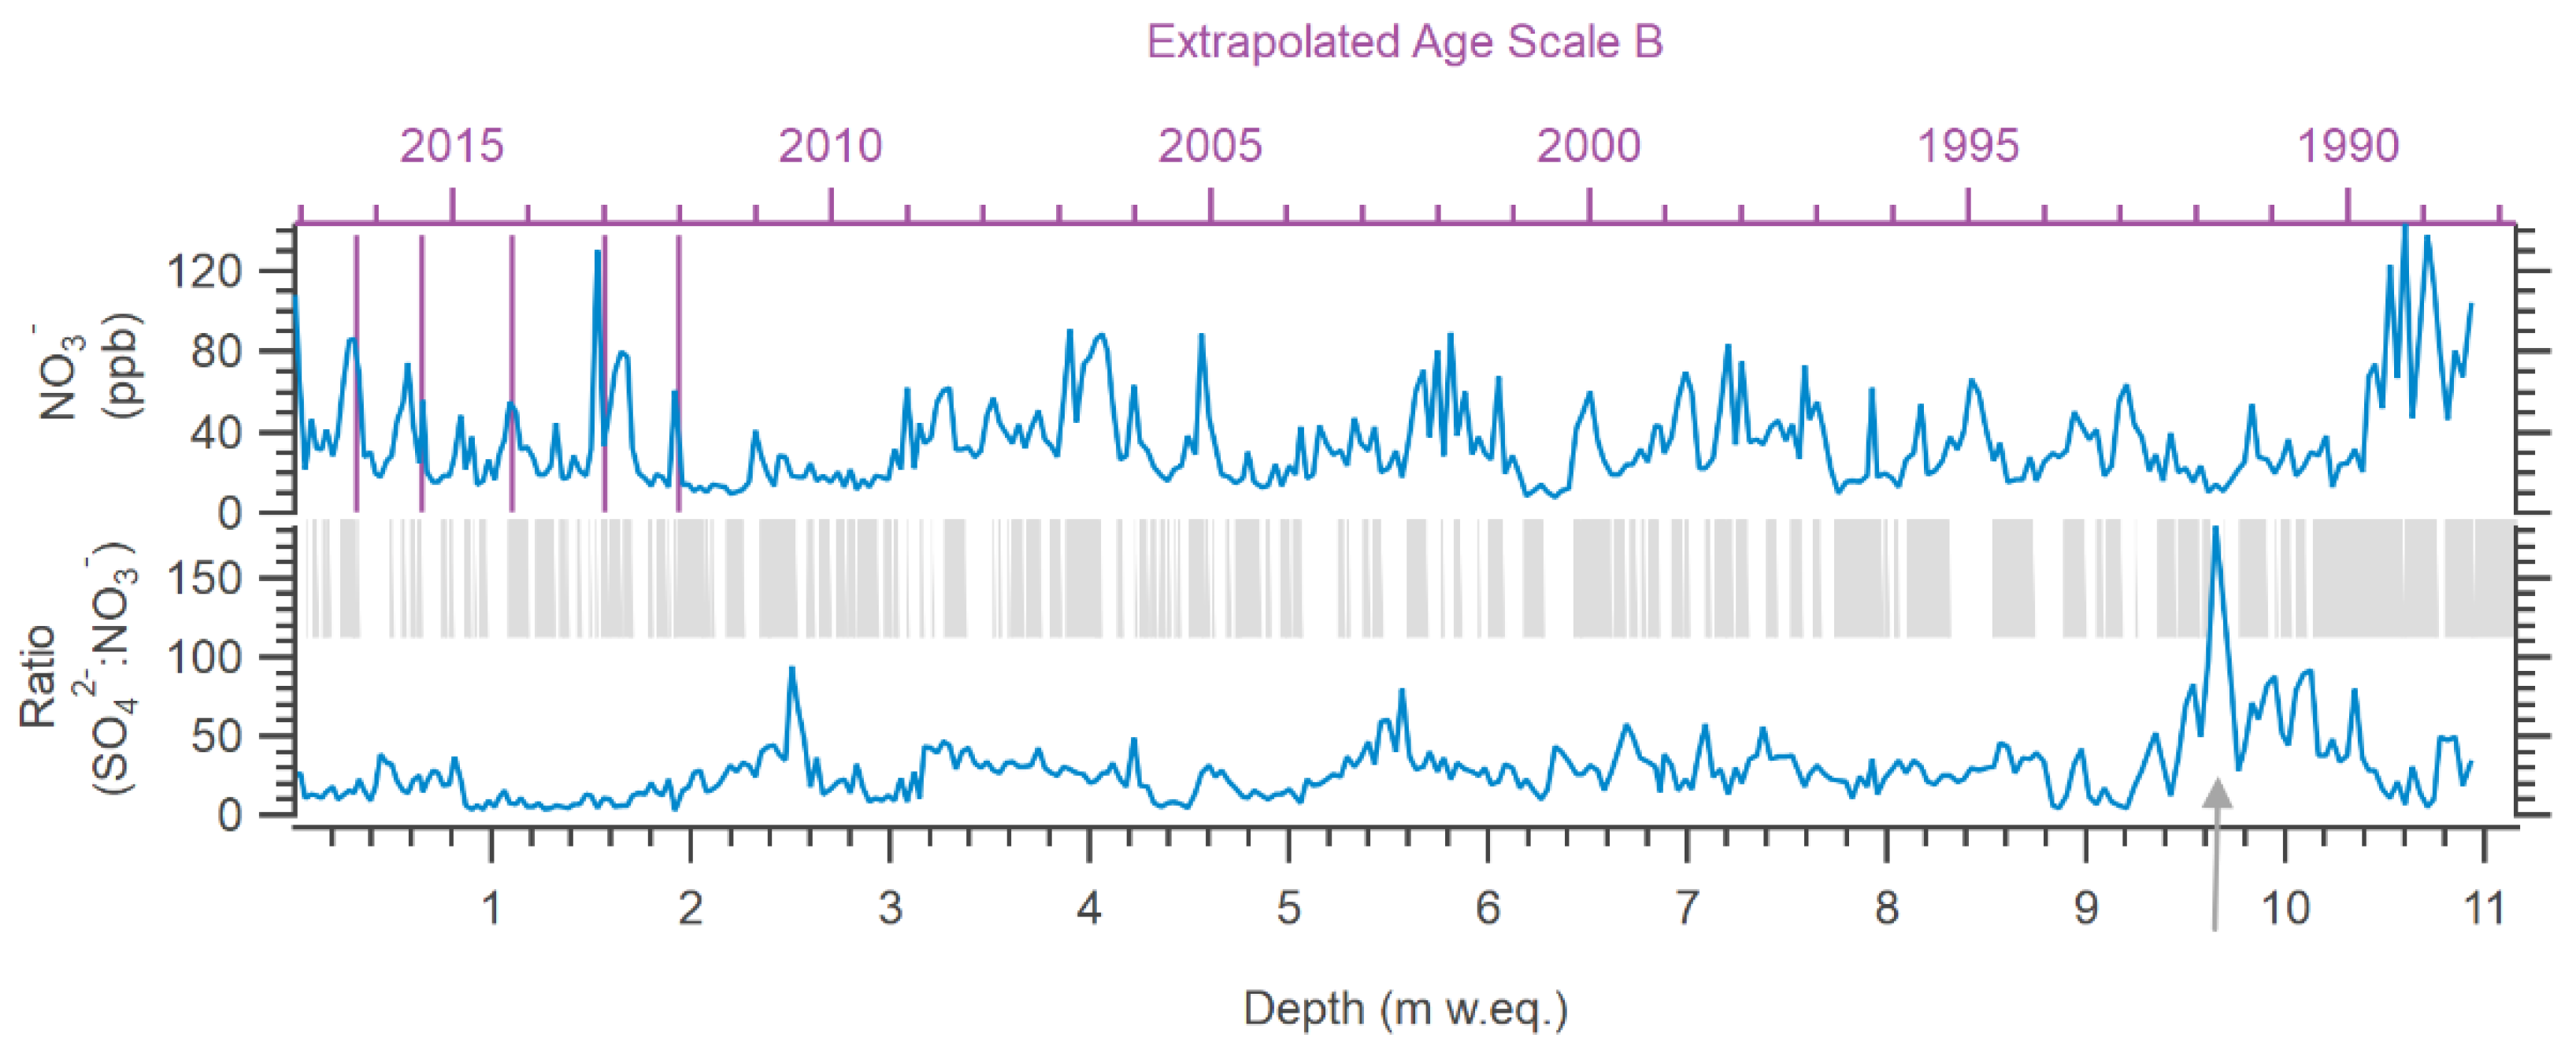
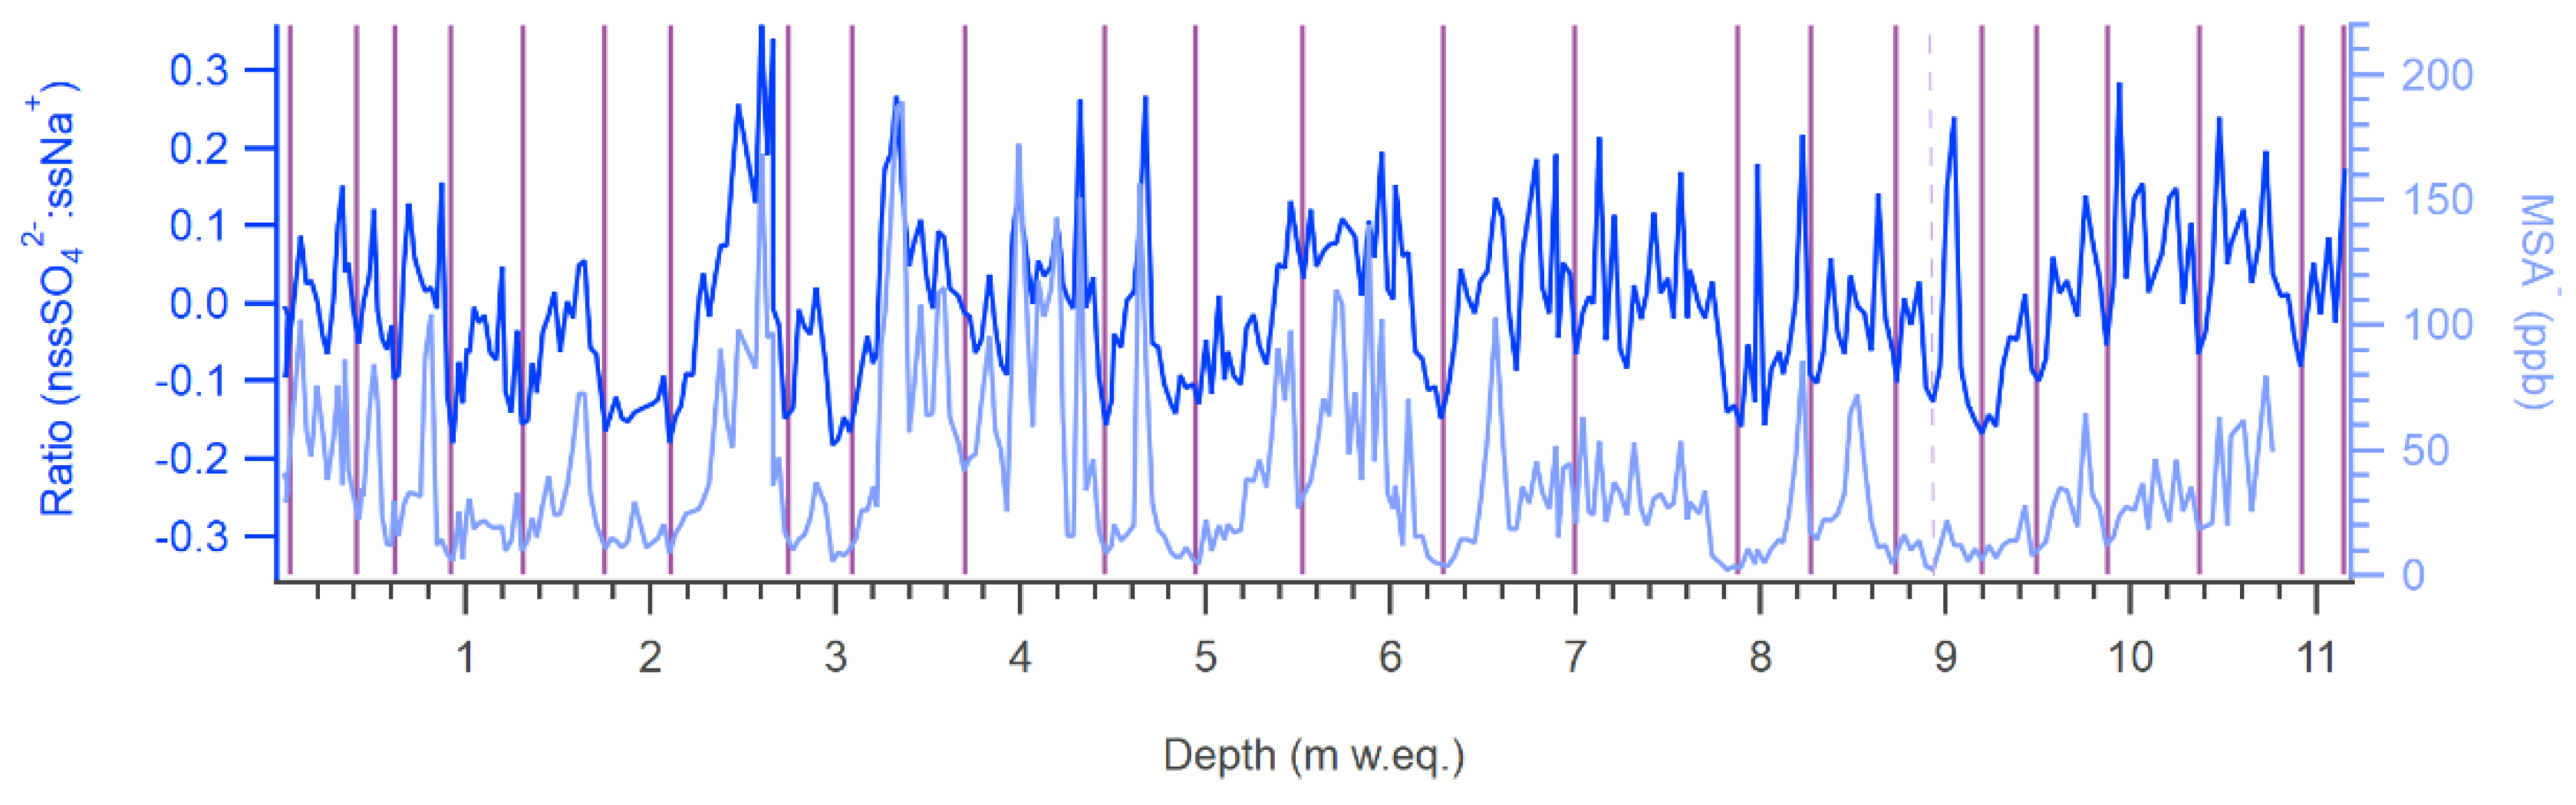
3.2.3. Major Ion Concentration Records
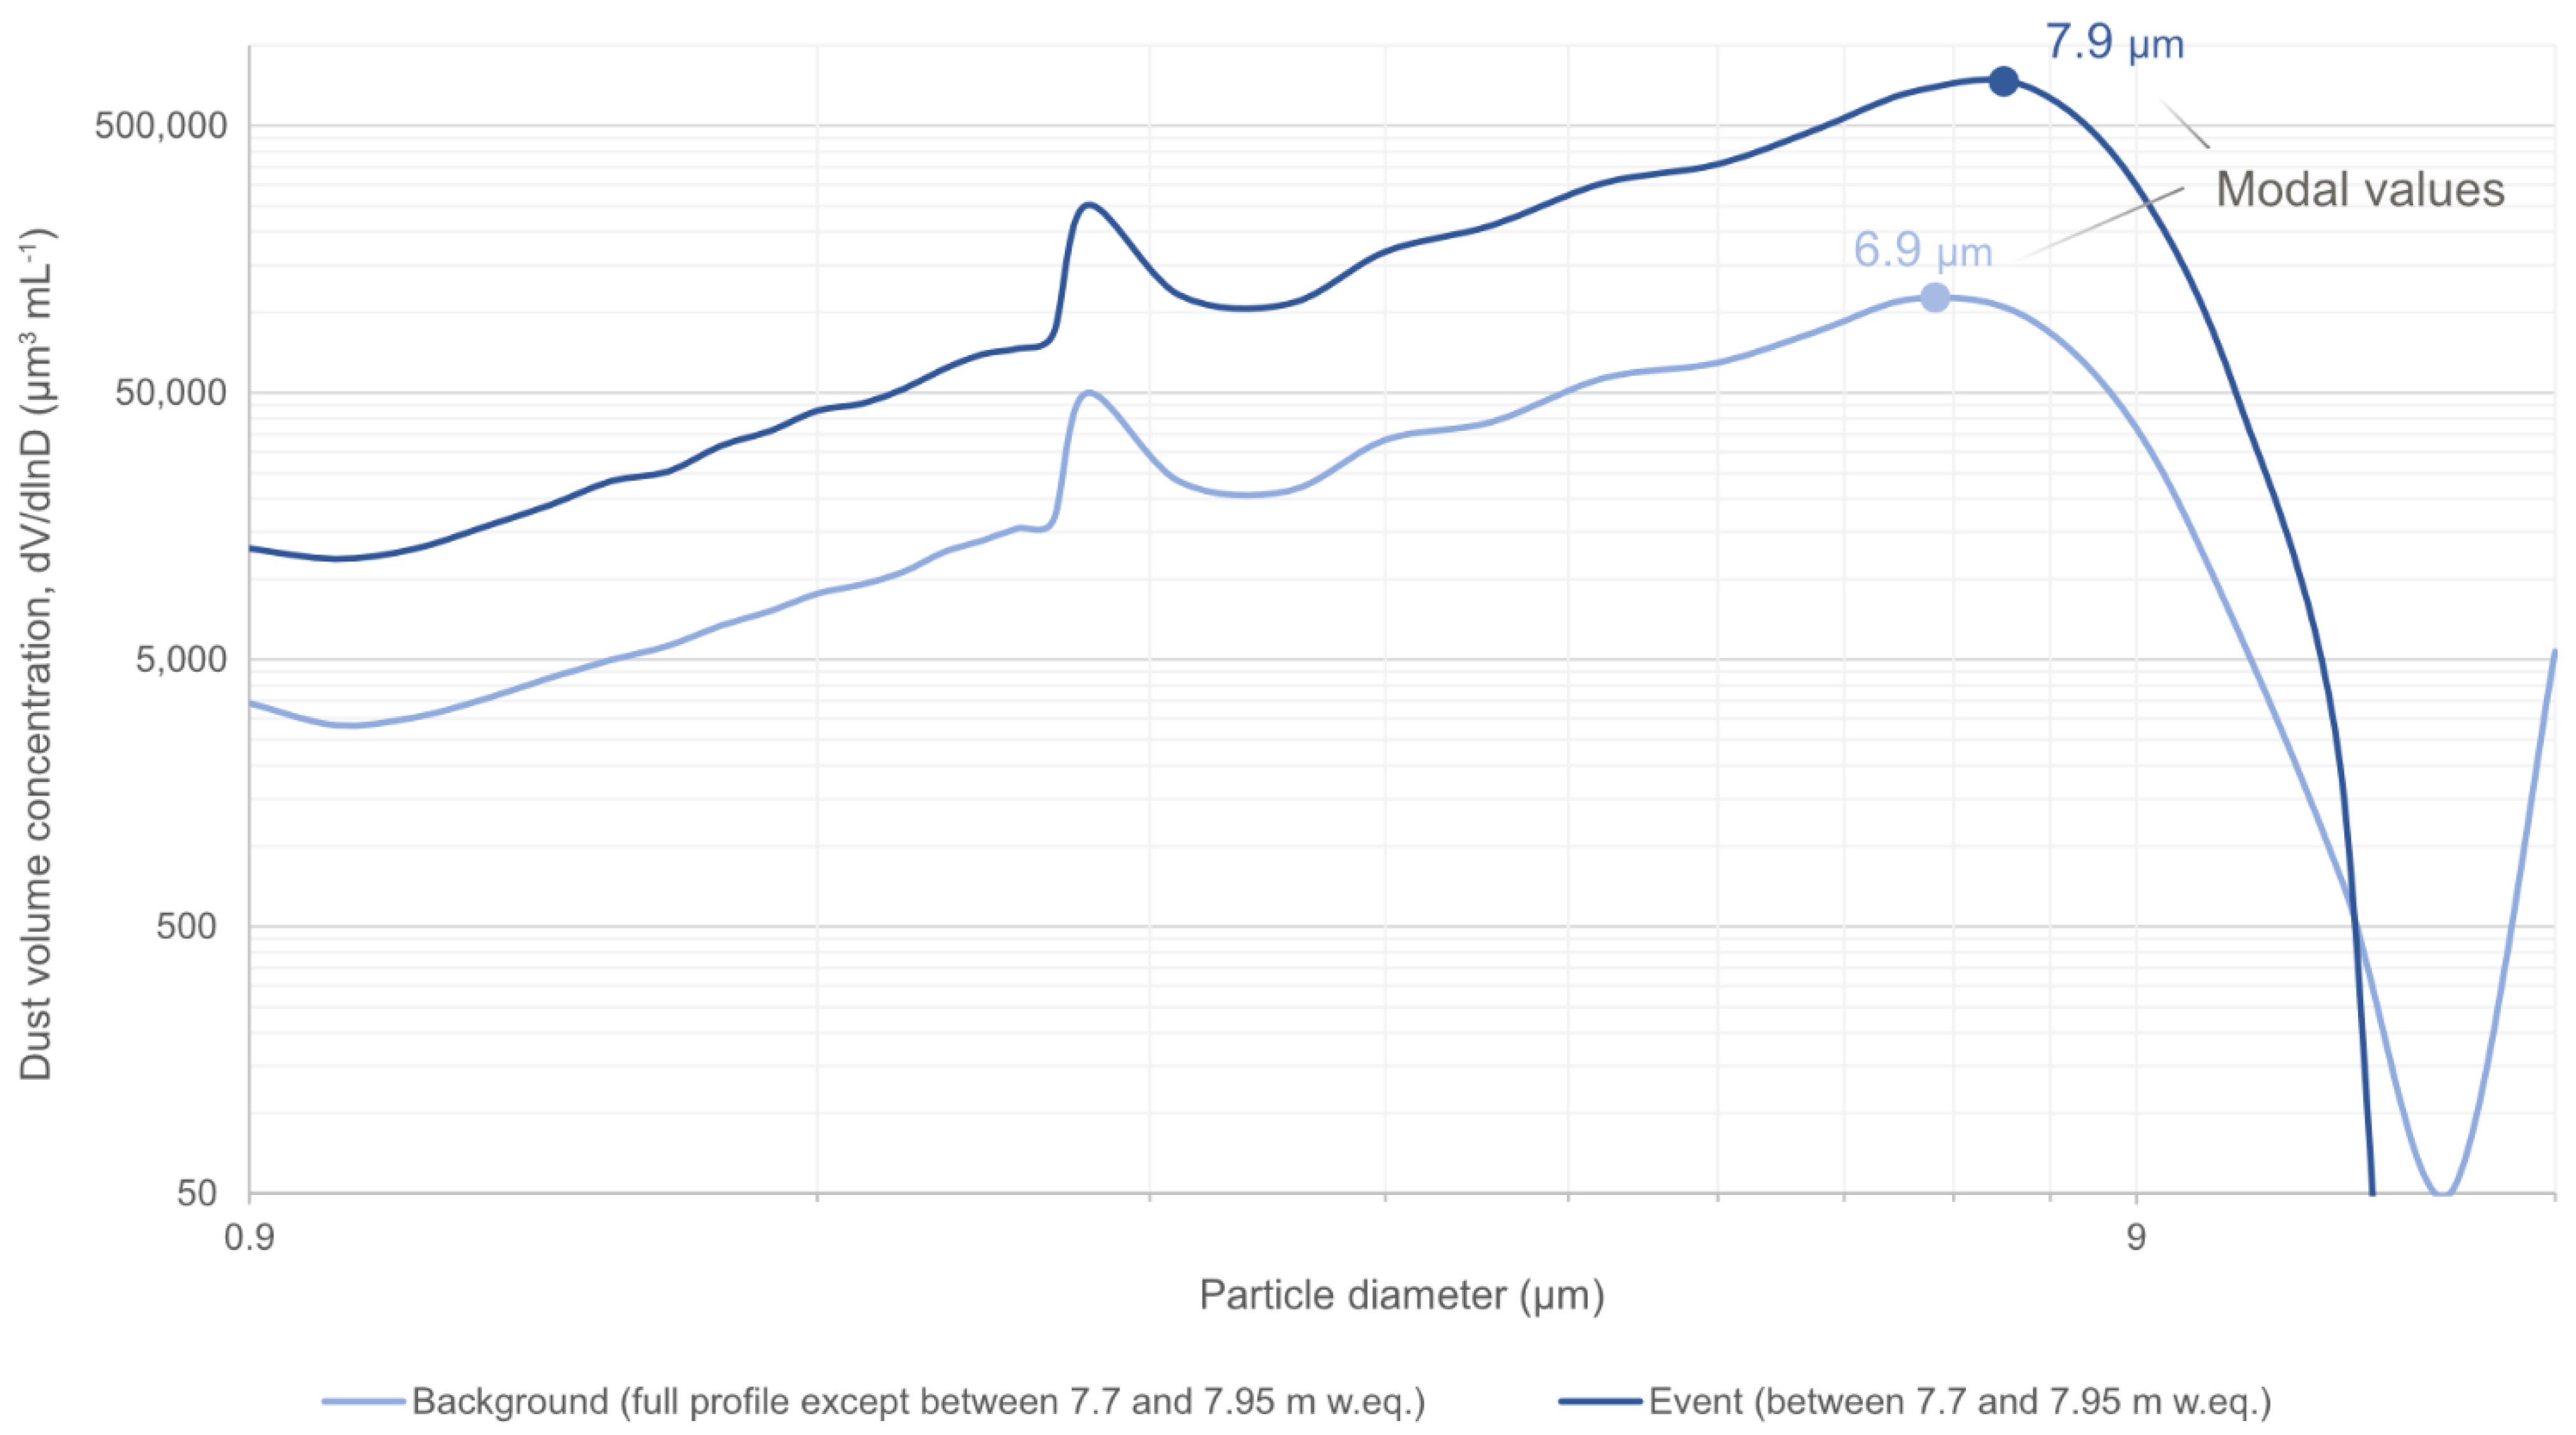
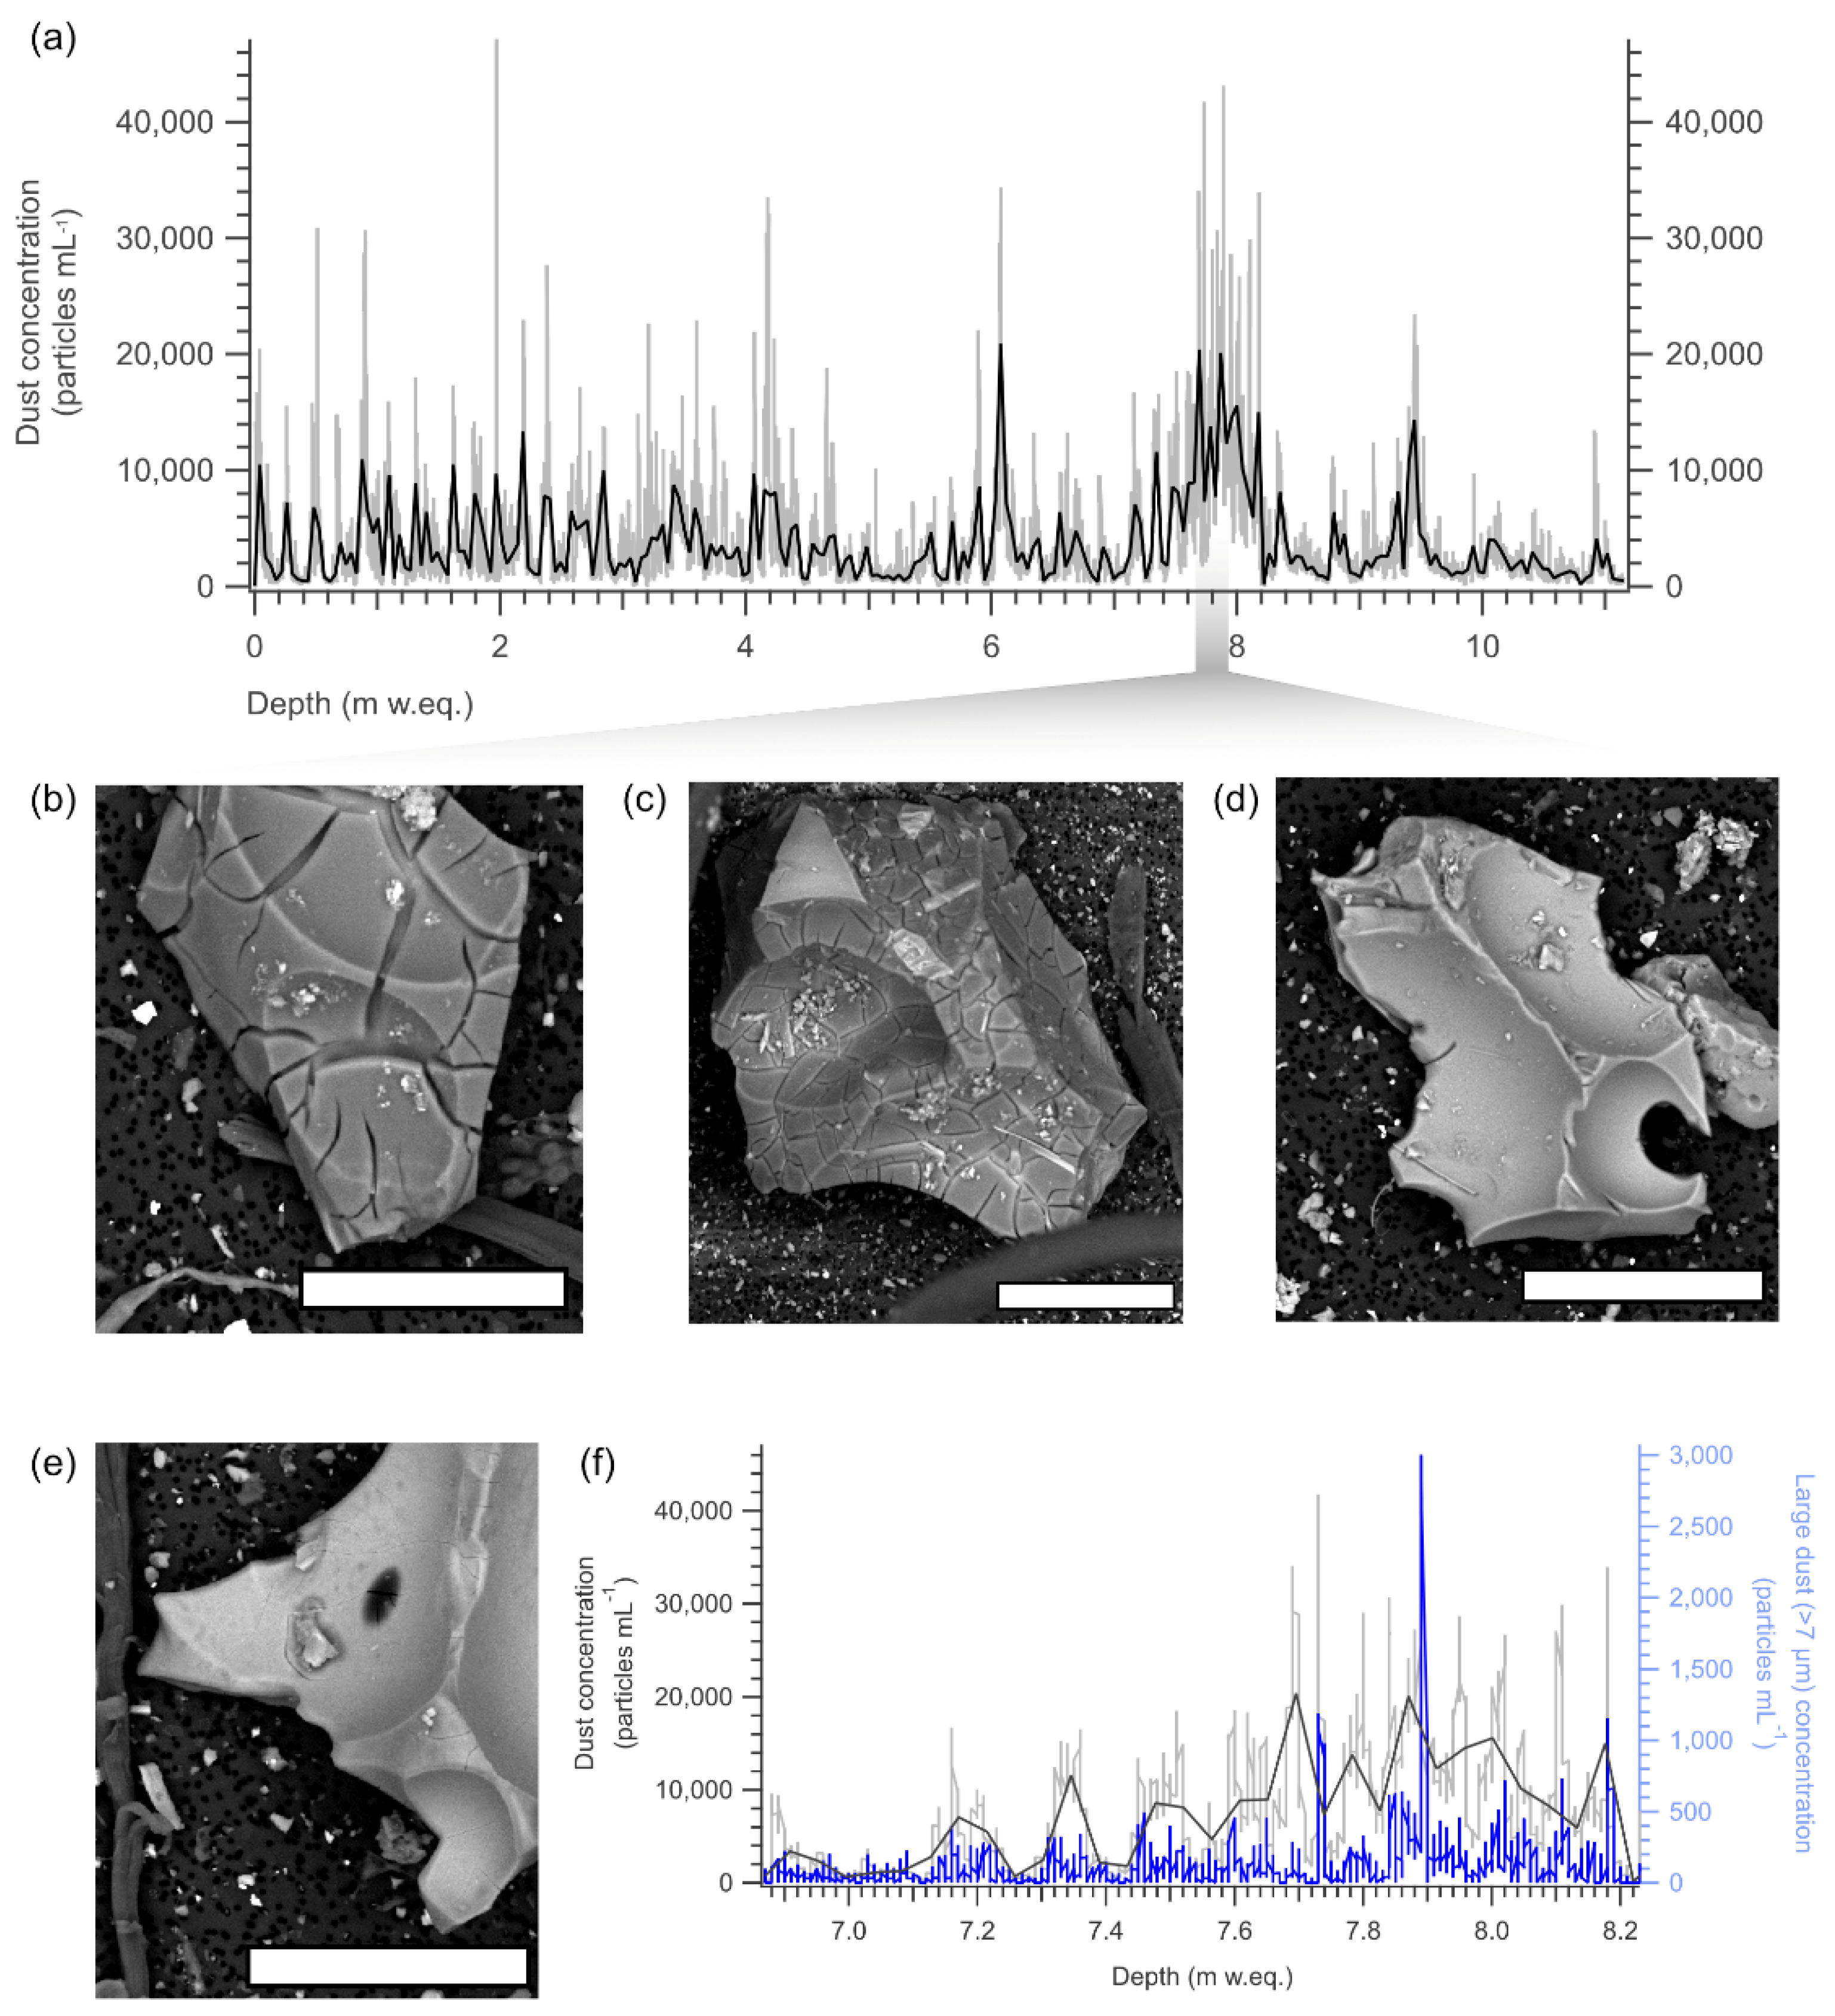
Na+ was the largest contributor to the ion budget at Young Island. Its concentrations ranged between 394 ppb and 8674 ppb with a profile average of 3362 ppb (Figure 5b).
SO42− concentrations ranged between 62 ppb and 2872 ppb, averaging 490 ppb in the upper more recent part of the core (~3.1 m w.eq.), and 1062 ppb in the deeper sections (Figure 5c). SO42− was the second largest contributor to the ion budget. There were no clear peaks that could be associated with a volcanic eruption in the SO42− record, which would otherwise be useful as an absolute marker for ice core dating at Young Island.
Mean MSA concentration declined from 44 ppb (top) to 29 ppb (bottom, Figure 5d). Concentrations of the troughs mostly remained below 30 ppb and could be distinguished from local MSA maxima by sharp transitions. The total MSA variability spanned a range from 142 ppb (~4 m w.eq. depth) to 2.4 ppb (~8.9 m w.eq. depth). MSA and SO42− concentrations had a correlation coefficient of +0.66 (p < 0.05), indicating over 40% shared variance between these two records.
Br concentration ranged between 1.5 ppb and 59.5 ppb (Figure 5e). Mean Br concentration increased from 7.9 ppb (top) to 31.0 ppb (bottom). Thereby, Br evolved analogously to Na+ concentration in most parts of the profile (r ≈ +0.89, p < 0.05) and the Br:Na+ ratio averaged 0.0065 similar to the standard sea water ratio (0.006; [49]). An exception was the depth interval between 5.1 m w.eq. and 5.8 m w.eq. depth, where the Na+ profile showed a high plateau, whereas the Br concentration exhibited stronger fluctuations.
NO3 concentrations ranged between 7.9 ppb and 93.0 ppb (Figure 5f). They fluctuated strongly with an amplitude up to 73 ppb between trough and peak positions but maintained a stable average of 34.1 ppb throughout the profile. Most of the NO3 peaks were confined to a narrow depth interval and therefore unambiguous (e.g., ~8.2 m w.eq.).

3.2.4. Dust

The dust record of the Young Island ice core was characterized by a strong down-core variability (mean = 3638.5 ± 4031.4 particles mL1) and a three-fold increase (mean = 326.37 ± 191.35 particles mL1) in the total dust particle concentration (>1 µm) between 7.6 m and 8.2 m w.eq. depth (mean = 11374.8 ± 6712.6 particles mL1, Figure 5i). This major increase in dust particle concentration was also identified in the coarser particle concentration (>7 µm), i.e., between 7.83 m and 7.90 m w.eq. depth (see Section 3.5: Figure 12f). This section was characterized by a short and steep increase, reaching its highest value (3000.3 particles mL1) at 7.89 m w.eq. depth. This sharp increase was an order of magnitude higher than the adjacent coarse particle concentration, standing out as a single feature in the coarse particle record from the Young Island ice core.
To obtain the particle size distribution (PSD) of insoluble dust, the volume concentration parameter (dV/dlnD) was calculated for the range of particle diameters (Figure 6). The background PSD, excluding the dust event, showed a log-normal distribution with a local peak around 2.5 μm and a mode particle diameter of 6.9 μm. The distribution for the dust event was similar but with a 1-µm rise in the mode particle diameter (7.9 μm). Furthermore, the PSD of the dust event exhibited volume concentration values on average five times higher than the background.

3.2.5. Hydrogen Peroxide Record

The H2O2 record for the Young Island ice core was measured continuously at both BAS and CIC, and variability was seen in the upper layers with peaks up to 40 ppb as expected for this relative high-temperature site compared to other Antarctic sites [29]. At depths >1.5 m w.eq. the signal was mostly absent with only a few peaks up to ~5 ppb and thus did not capture seasonal changes (Figure 5g). Whether this is due to dissolution during melt events [30], consumption during reaction with the oxidant SO42− [50], or with dust particles [51] demands further investigation. Until then, any longer-term trend of H2O2 is difficult to assess.

3.3. Dating Approaches

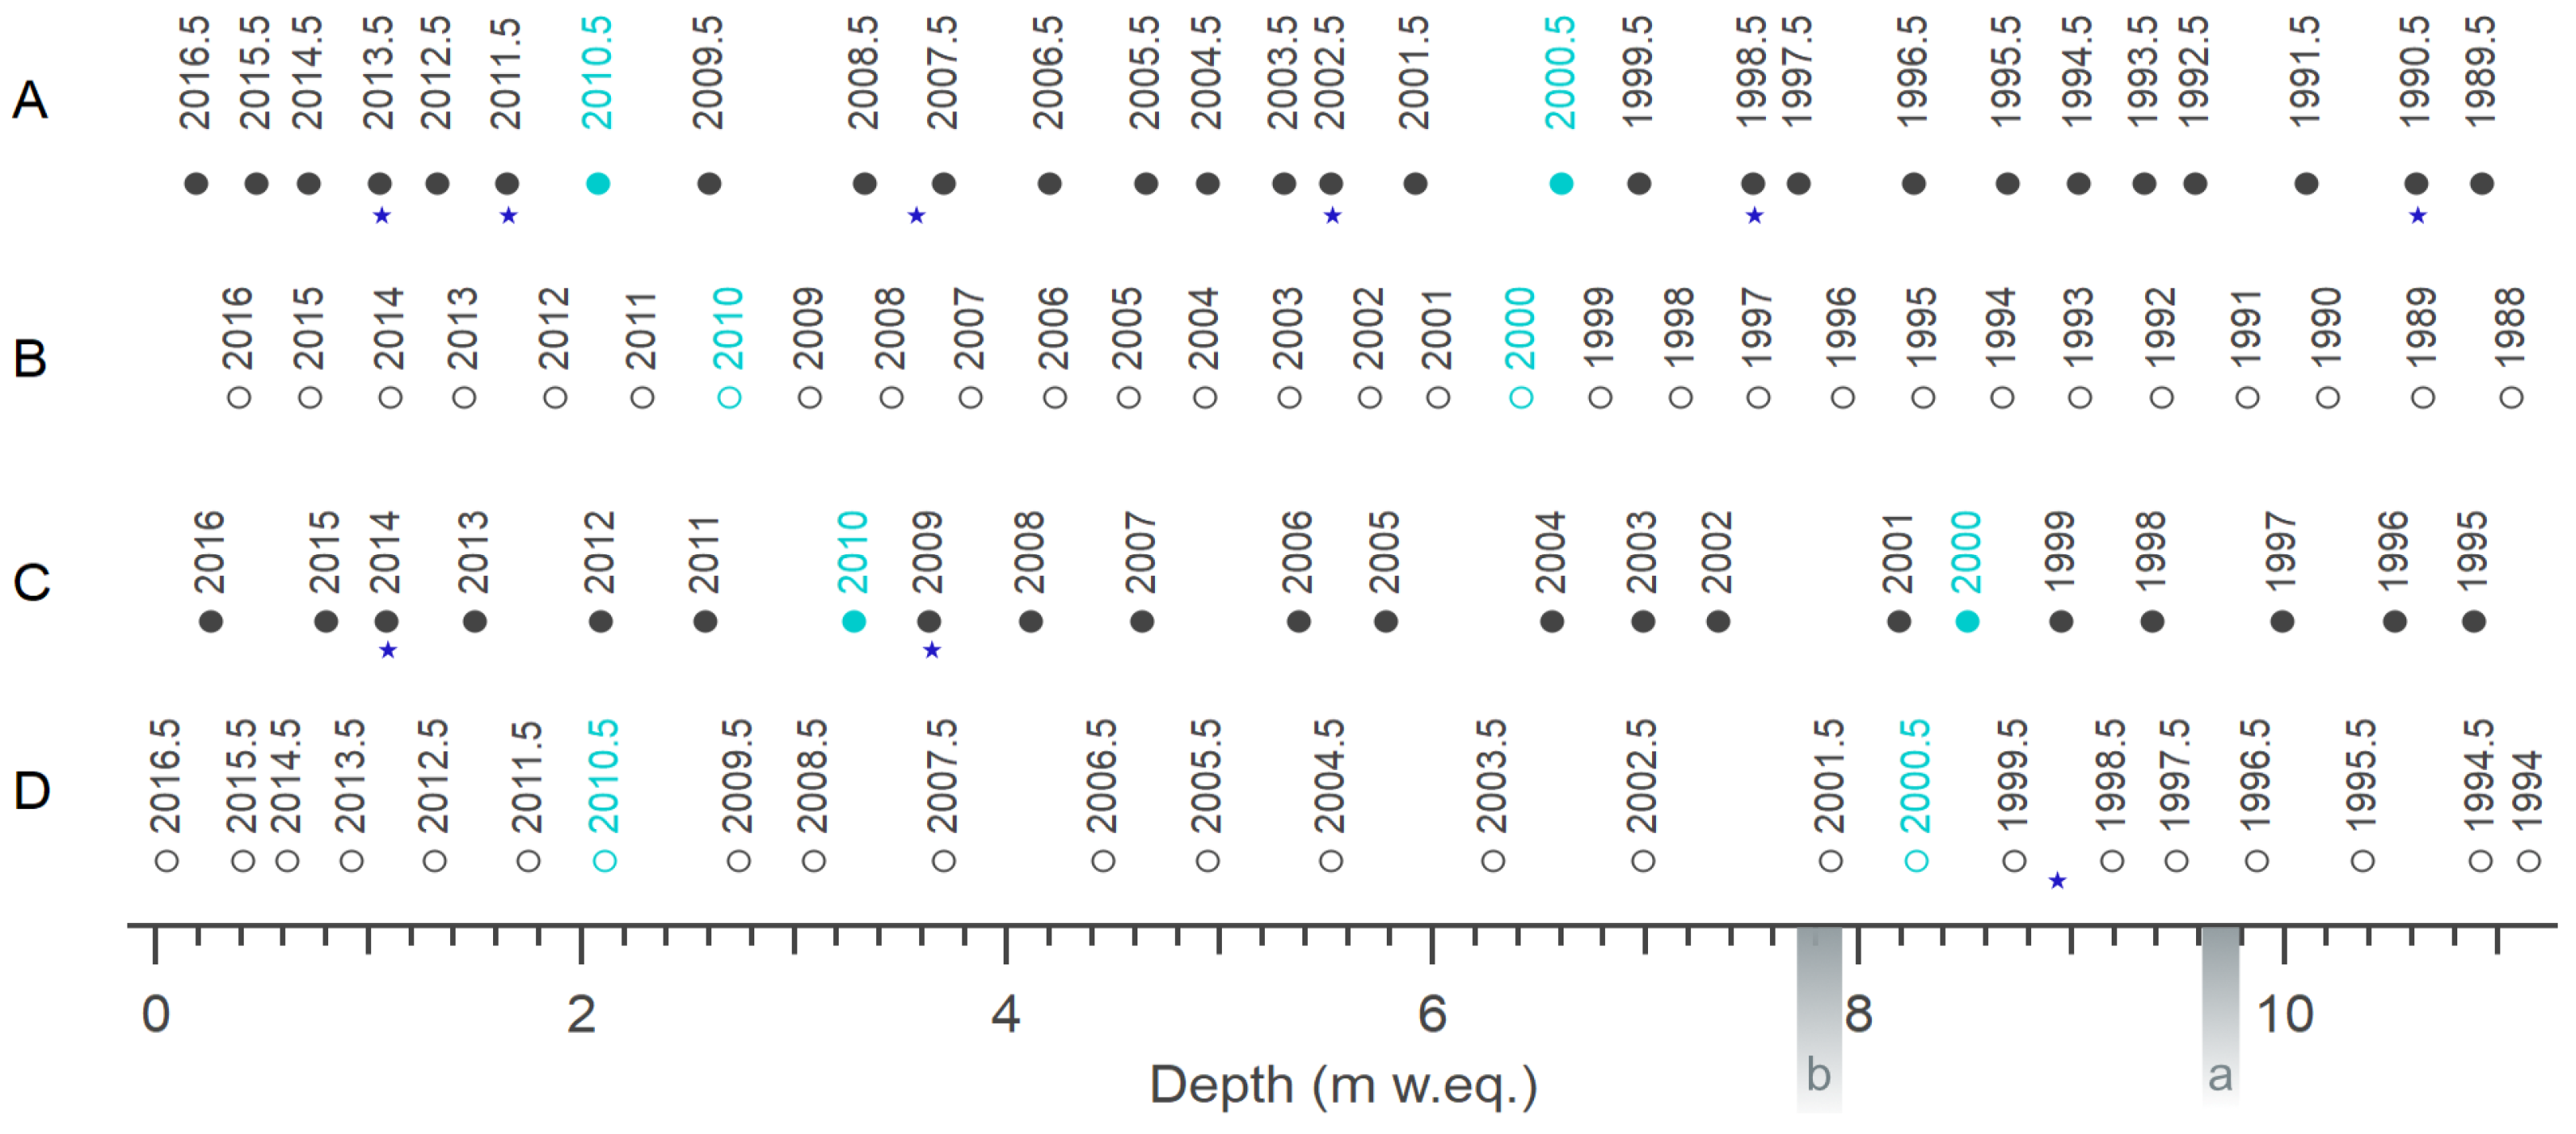
3.3.1. Dating Approach A—Based on δ18O

For the Young Island profile, 28 ± 6 winter markers could be set based on δ18O troughs (Figure 7), leading to a 27-year annual record from 2016 to 1989. According to Moser [35], a caveat to this approach is that “distinct troughs in the δ18O profile potentially represent extreme cold events rather than seasonal signatures. Using them as primary markers in ice core dating could lead to an under-/overestimation of annual cycles, depending on the interannual frequency of such events”. This is because stable water isotope records in ice cores are especially dependent on the frequency of precipitation events [52,53]. Furthermore, stable water isotope diffusion and amplitude reduction prohibit us from using δ18O as the foundation of an age scale alone.

3.3.2. Dating Approach B—Based on NO3 Record

Another approach was based on a continuous annual layer thickness derived from the nitrate concentration record, which appeared to have a seasonal signal with peaks assumed during summer [54] in the upper 2 m w.eq. of the Young Island ice core (Figure 8). Post-depositional processes are known to drive the loss of nitrate from the snowpack, mainly through volatilization and photolysis [55,56,57]. However, in coastal high-accumulation sites such as Young Island this is expected to have only a minor influence on the signal.
Annual layers could be counted for the first ~6 years with the distance between peaks ranging 29–45 cm w.eq. with an average of 37 cm w.eq. The seasonality of the signal was less striking further down, so that layer counting bore a larger uncertainty below 2 m w.eq. depth. The annual net accumulation (28–43 cm w.eq.) derived from this approach was lower than the estimated regional precipitation from ERA5 (67–103 cm w.eq.), which does not account for melting and wind drift. Based on the net accumulation derived from individual layer counting for NO3 in the top 2 m, and assuming an overall stable accumulation over the last 30 years, we applied a linear fit to obtain age scale B. The error of this age scale was obtained calculating a maximum and minimum accumulation using the (average ± standard deviation) and applying the linear fit. On this basis, the Young Island ice core contains layers until 1988 ± 6 years. The large uncertainty shows that an absolute marker is essential for developing an age scale for this difficult site. For this, we calculated the SO42−:NO3 ratio record, which showed a peak at 9.6–9.8 m w.eq. (Figure 8, vertical grey arrow) that could correspond to the 1991 Pinatubo eruption, but geochemical analyses of tephra layers and volcanic tracers are necessary to confirm this hypothesis.

3.3.3. Dating Approach—Based on Marine Species and Large Melt Layers

Another approach to dating was based on marine species. MSA and SO42− from marine biogenic activity are assumed to peak during the spring and summer similar to NO3[54]. They have provided reliable seasonal signals at several coastal Antarctic ice core sites [58] and on the only other annually dated sub-Antarctic island site at Bouvet Island [6], where the MSA, SO42−, and Br concentration were fundamental in developing the age scale. In the Bouvet ice core, and in the Young Island ice core presented here, the three species covary, suggesting a similar marine or sea ice source. Their phasing is supported by nitrate in large parts of the profile. Unfortunately, the solubility of the ions makes them susceptible to migration [59], as is evident when comparing with the melt layers (Figure 9). However, if we assume solar radiation as the major driver of surface melt [60], then at least the larger melt layers (layers >10 cm snow depth plotted for comparison) also peaked during the summer months. Peaks in marine species also occur without the presence of large melt layers, suggesting that melt is not the sole driver of variability in the record. The approach of relying on summer marine proxies (MSA, SO42− and Br) suggested a bottom age of 1995/1994 CE. We found a total of three years within the profile, where a peak is missing in one or more species and thus, we estimate the error to be ±2 years.

3.3.4. Dating Approach D—Based on nssSO42−:ssNa+ Ratio and MSA Concentration

A fourth approach was conducted using the nssSO42−:ssNa+ ratio, which was analyzed to identify troughs as winter markers. Potential winter troughs in the nssSO42−:ssNa+ profile were corroborated using the MSA minima, commonly used as a winter marker (Figure 10). A total of 23 ± 1 winter troughs were identified, resulting in an age scale extending from austral summer 2017 to 1993 CE. Despite nssSO42−:ssNa+ ratio being a useful tool to enhance peaks and troughs in the nssSO42− signal, this parameter is highly dependent on the magnitude and seasonality of Na+, SO42−, and Ca2+. This makes the nssSO42−:ssNa+ ratio vulnerable to interannual and/or seasonal variability in the input of these ions to the ice core site. Therefore, the nssSO42−:ssNa+ ratio should be used in addition to other dating approaches.

3.4. Summary of Age Scales

Though each of the dating approaches were based on cyclic variability, they were not unequivocal (Table 1, Figure 11) and showed an eight-year spread of bottom ages. Further, the results differed significantly from the preliminary bottom age of 2002 ± 4 based on density only [2]. Consequently, both the combination of multiple proxies and a tie point are necessary to reliably date this melt-affected archive.

3.5. Tie Point of the Age Scale

Ice core age scales, in addition to annual layer counting, can be constrained by reference horizons such as volcanic acid or tephra layers. In order to constrain the age scale of the Young Island ice core, the dust record was taken into account. Elevated levels of dust input between 7.4 m and 8.1 m w.eq. depth raised the idea of a short-term event increasing dust concentration (Figure 12a). As the particle size distribution (Figure 6) exhibited an increase both in total particle concentration and mode particle diameter for this depth interval, an additional, proximal source supplying larger particles to the ice core site should be considered. A large eruption from Buckle Island in 1839 CE increased the mode particle size to ~10 µm in the WAIS Divide core [61]. In the period covered by the Young Island ice core, Tetzner et al. [44] recently presented that a volcanic eruption on nearby Sturge Island occurred in 2001 CE based on increased dust input and tephra shards found in ice cores from the Antarctic Peninsula and West Antarctica. Thus, we filtered the ice core to collect insoluble particles for tephra analysis. We observed large (≤200 µm) and angular cryptotephra shards, with little evidence of corrosion, pointing to a proximal eruption on Sturge Island at ~140 km distance. Among the cryptotephra shards found, many exhibited angular morphologies and concave features (vesicles, Figure 12b–e). Additionally, most of the cryptotephra shards identified presented quenching cracks, indicative of the interaction with water during the eruption [62]. Though geochemical analysis of the tephra could contribute to a clearer allocation to the mentioned Sturge eruption in 2001, the combination of strong dust and tephra input are compelling arguments for this absolute time marker in our age scale. This tie point supports the dating approaches C and D, based on marine ion species and nssSO42−:ssNa+ ratio respectively, back to 2001. We propose on this basis that the Young Island ice core contains annual layers from 2016 to 1995 ± 2 years. This is of critical importance for all further climate interpretation in future studies.

4. Discussion

Up to this point, we have presented various approaches for dating the ice core and identified the 2001 CE Sturge eruption as an absolute time marker. Now, we discuss briefly whether our derived age scale with annual layers back until 1995 is probable in the light of ERA5 and NCEP/NCAR reanalyses, i.e., their 2-m air temperature and annual precipitation estimates.
The top 3 years with the highest melt content in our ice core were in declining order 2011 (69%), 1997 (65%), and 2002 (52%). These coincided with the top two warmest summers (December−February) in ERA5 [45], i.e., 1997 and 2011, and the top three warmest summers derived from NCEP/NCAR [63], i.e., 2011, 2002, and 1997. This overlap supported our interpretation of melt layers as predominantly summer features and our summer-based dating approaches (e.g., Dating approach C, Figure 9). It further suggested that both reanalyses can depict important aspects of the local microclimate. Based on the strong correlations between melt layer >10 cm and summer temperatures, these features might even be a valuable hot summer proxy at Young Island, similar to previous studies in the Antarctic [60,64].
In a next step, we conducted an interannual comparison of annual layer thickness in the Young Island ice core converted to accumulation (m w.eq.) with annual precipitation derived from ERA5 and NCEP. It showed that our final dating approach produced accumulation rates in the expected range, especially of the NCEP reanalyses (Figure 13), which was important to show its plausibility. It must be noted that the annual layer thickness, though ideally representative of the local accumulation, was probably affected by various factors including glacier flow, topography, wind-scouring, and melting that have not been quantified and therefore cannot be corrected for this site yet. Further, significant uncertainty exists in the ability of the reanalyses to reproduce precipitation at the island’s scale properly [65], e.g., the large grid cell overlooks localized orographic effects on precipitation. Resolving the constraints for local net accumulation requires further investigation beyond the scope of this paper. For now, annual layer thickness in the ice core lay permanently below the precipitation estimates given by ERA5 but partly resembled NCEP variability, especially in the years 2006−2012 (Figure 13). We conclude that ice core net accumulation lies in the lower yet reasonable range of NCEP estimates and that covariance of local precipitation and accumulation should be investigated using a higher-resolution density record.

5. Conclusions

Here, we have presented the first glacio-chemical records of the Young Island ice core. Despite the presence of surface melt at this maritime location, our findings indicate that it is possible to date the melt-affected Young Island ice core. We have applied multiple-proxy dating approaches based on winter and summer signatures and developed an ice core chronology including a proximal volcanic tie point in 2001 CE [44]. The final age scale suggests that the Young Island ice core covers the period from 2016 to 1995 ± 2 years. The age scale gains independent support from reanalysis records and a strong correlation of melt layers >10 cm and warm summer temperatures. By developing a reliable ice core chronology, this study provides the crucial foundation for all future studies discussing regional climate proxies from the Young Island ice core. Going forward, resolving the effects of surface melt on chemical records and how these features could be proxies themselves will be one of the key challenges at this interesting site.

Supplementary Materials

The following are available online at https://www.mdpi.com/article/10.3390/geosciences11090368/s1, Figure S1: Landsat-8 RGB image acquired on (a) 23/10/2019 shows open water prevailing west of the Balleny Islands, and (b) 09/12/2013 open water east of the islands; red marker: Young Island drilling site; blue background: ocean; data available from the U.S. Geological Survey.

Author Contributions

When multiple authors have contributed, they are mentioned in alphabetical order. Conceptualization, D.E.M. and E.R.T.; data curation—field work, B.M. and J.B.P.; data curation—continuous flow analysis, H.A.K., D.E.M., E.N., E.R.T., P.V.; data curation—discrete data, S.J.; data curation—tephra collection, D.T.; formal analysis, H.A.K., D.E.M., E.N., D.S., A.S., D.T., E.R.T.; writing—original draft preparation, D.E.M.; writing—review and editing, H.A.K., B.M., D.E.M., J.B.P., D.S., D.T., E.R.T.; funding acquisition, J.B.P. and E.R.T. All authors have read and agreed to the published version of the manuscript.

Funding

Funding was provided to subICE by École Polytechnique Fédérale de Lausanne, the Swiss Polar Institute, and Ferring Pharmaceuticals Inc (grant no. subICE). ERT received core funding from NERC to the British Antarctic Survey’s Ice Dynamics and Palaeoclimate programme. DEM was supported by BAS, Cambridge, and the NERC C-CLEAR doctoral training programme (grant no. NE/S007164/1). JBP received grant funding from the Australian Government.

Data Availability Statement

The data presented in this study will be made openly available through the UK Polar Data Centre. Furthermore, publicly available AWS and reanalysis datasets were analysed in this study. AWS data can be found here: https://amrc.ssec.wisc.edu/aws/index.php?region=Ocean%20Islands&station=Young%20Island&year=1993 (accessed on 15 May 2021).

Acknowledgments

The authors would like to acknowledge the coordinators and participants of the Antarctic Circumnavigation Expedition for facilitating collection of the subICE cores, especially Guisella Gacitúa and Julia Schmale. The authors appreciate the support of the University of Wisconsin-Madison Automatic Weather Station program for the data set, data display, and information as well as the NSF (grant no. ANT-1543305) and ECMWF for providing ERA5 reanalysis data. Finally, the authors want to thank the two anonymous reviewers for their critical comments on the manuscript, as they significantly improved the clarity of this paper.

Conflicts of Interest

The authors declare no conflict of interest. The funders had no role in the design of the study; in the collection, analyses, or interpretation of data; in the writing of the manuscript; or in the decision to publish the results.

References

  1. Bakke, J.; Paasche, Ø.; Schaefer, J.M.; Timmermann, A. Long-term demise of sub-Antarctic glaciers modulated by the Southern Hemisphere Westerlies. Sci. Rep. 2021, 11, 1–10. [Google Scholar] [CrossRef] [PubMed]
  2. Thomas, E.R.; Gacitúa, G.; Pedro, J.B.; King, A.C.F.; Markle, B.; Potocki, M.; Moser, D.E. Physical properties of shallow ice cores from Antarctic and sub-Antarctic islands. Cryosphere 2021, 15, 1173–1186. [Google Scholar] [CrossRef]
  3. Strother, S.L.; Salzmann, U.; Roberts, S.J.; Hodgson, D.A.; Woodward, J.; van Nieuwenhuyze, W.; Verleyen, E.; Vyverman, W.; Moreton, S. Changes in Holocene climate and the intensity of Southern Hemisphere Westerly winds based on a high-resolution palynological record from sub-Antarctic South Georgia. Holocene 2015, 25, 263–279. [Google Scholar] [CrossRef] [Green Version]
  4. Adams, N. Climate trends at Macquarie Island and expectations of future climate change in the sub-Antarctic. In Papers and Proceedings of the Royal Society of Tasmania; The Royal Society of Tasmania: Hobart, Australia, 2009; Volume 143, pp. 1–8. [Google Scholar]
  5. PAGES2k Consortium. A global multiproxy database for temperature reconstructions of the Common Era. Sci. Data 2017, 4, 170088. [Google Scholar] [CrossRef]
  6. King, A.C.F.; Thomas, E.R.; Pedro, J.B.; Markle, B.; Potocki, M.; Jackson, S.L.; Wolff, E.; Kalberer, M. Organic compounds in a sub-Antarctic ice core: A potential suite of sea ice markers. Geophys. Res. Lett. 2019, 46, 9930–9939. [Google Scholar] [CrossRef] [Green Version]
  7. Hatherton, T.; Dawson, E.W.; Kinsky, F.C. Balleny Islands reconnaissance expedition, 1964. N. Zealand, J. Geol. Geophys. 1965, 8, 164–179. [Google Scholar] [CrossRef]
  8. USGS Geographic Names Information System: Young Island. Available online: https://geonames.usgs.gov/apex/f?p=gnispq:5:0::NO::P5_ANTAR_ID:16891 (accessed on 28 April 2020).
  9. Johnson, G.L.; Kyle, P.R.; Vanney, J.R.; Campsie, J. Geology of Scott and Balleny Islands, Ross Sea, Antarctica, and morphology of adjacent seafloor. N. Z. J. Geol. Geophys. 1982, 25, 427–436. [Google Scholar] [CrossRef] [Green Version]
  10. Mawson, D. Basaltic Lavas of the Balleny Islands. ANARE Report. Trans. R. Soc. S. Aust. 1950, 73, 223–231. [Google Scholar]
  11. Martin, S.; Steffen, K.; Comiso, J.; Cavalieri, D.; Drinkwater, M.R.; Holt, B.; Carsey, F.D. Microwave remote sensing of polynyas. In Extreme Events; American Geophysical Union (AGU): Washington DC, USA, 1992; Volume 68, pp. 303–311. [Google Scholar]
  12. Naval Oceanography Command. Sea Ice Climatic Atlas; US Department of the Navy, Oceanographic Office: Washington, DC, USA, 1985; Volume 1, Antarctica (NAVAIR 50–1C–540). [Google Scholar]
  13. Ballard, G.; Toniolo, V.; Ainley, D.G.; Parkinson, C.L.; Arrigo, K.R.; Trathan, P.N. Responding to climate change: Adélie Penguins confront astronomical and ocean boundaries. Ecology 2010, 91, 2056–2069. [Google Scholar] [CrossRef] [Green Version]
  14. Winstrup, M.; Svensson, A.M.; Rasmussen, S.O.; Winther, O.; Steig, E.J.; Axelrod, A.E. An automated approach for annual layer counting in ice cores. Clim. Past 2012, 8, 1881–1895. [Google Scholar] [CrossRef] [Green Version]
  15. Svensson, A.; Andersen, K.K.; Bigler, M.; Clausen, H.B.; Dahl-Jensen, D.; Davies, S.M.; Johnsen, S.J.; Muscheler, R.; Parrenin, F.; Rasmussen, S.O.; et al. A 60 000 year Greenland stratigraphic ice core chronology. Clim. Past 2008, 4, 47–57. [Google Scholar] [CrossRef] [Green Version]
  16. Masson-Delmotte, V.; Hou, S.; Ekaykin, A.; Jouzel, J.; Aristarain, A.; Bernardo, R.T.; Bromwich, D.; Cattani, O.; Delmotte, M.; Falourd, S.; et al. A review of Antarctic surface snow isotopic composition: Observations, atmospheric circulation, and isotopic modeling. J. Clim. 2008, 21, 3359–3387. [Google Scholar] [CrossRef] [Green Version]
  17. Stenni, B.; Curran, M.A.J.; Abram, N.J.; Orsi, A.; Goursaud, S.; Masson-Delmotte, V.; Neukom, R.; Goosse, H.; Divine, D.; van Ommen, T.; et al. Antarctic climate variability on regional and continental scales over the last 2000 years. Clim. Past 2017, 13, 1609–1634. [Google Scholar] [CrossRef] [Green Version]
  18. Abram, N.; Wolff, E.; Curran, M.A. A review of sea ice proxy information from polar ice cores. Quat. Sci. Rev. 2013, 79, 168–183. [Google Scholar] [CrossRef]
  19. Wolff, E.; Barbante, C.; Becagli, S.; Bigler, M.; Boutron, C.; Castellano, E.; de Angelis, M.; Federer, U.; Fischer, H.; Fundel, F.; et al. Changes in environment over the last 800,000 years from chemical analysis of the EPICA Dome C ice core. Quat. Sci. Rev. 2010, 29, 285–295. [Google Scholar] [CrossRef]
  20. Frey, M.M.; Norris, S.J.; Brooks, I.M.; Anderson, P.S.; Nishimura, K.; Yang, X.; Jones, A.E.; Mastromonaco, M.G.N.; Jones, D.H.; Wolff, E.W. First direct observation of sea salt aerosol production from blowing snow above sea ice. Atmos. Chem. Phys. Discuss. 2020, 20, 2549–2578. [Google Scholar] [CrossRef] [Green Version]
  21. Greenwood, N.N.; Earnshaw, A. The halogens: Fluorine, chlorine, bromine, iodine and astatine. In Chemistry of the Elements; Butterworth-Heinemann: Amsterdam, The Netherlands, 2012; pp. 789–887. [Google Scholar]
  22. Spolaor, A.; Vallelonga, P.; Plane, J.M.C.; Kehrwald, N.; Gabrieli, J.; Varin, C.; Turetta, C.; Cozzi, G.; Kumar, R.; Boutron, C.; et al. Halogen species record Antarctic sea ice extent over glacial—Interglacial periods. Atmos. Chem. Phys. Discuss. 2013, 13, 6623–6635. [Google Scholar] [CrossRef] [Green Version]
  23. Wagenbach, D.; Görlach, U.; Moser, K.; Münnich, K.O. Coastal Antarctic aerosol: The seasonal pattern of its chemical composition and radionuclide content. Tellus B Chem. Phys. Meteorol. 1988, 40, 426–436. [Google Scholar] [CrossRef]
  24. Shaw, G.E. Antarctic aerosols: A review. Rev. Geophys. 1988, 26, 89–112. [Google Scholar] [CrossRef]
  25. Wolff, E.W. Ice sheets and nitrogen. Philos. Trans. R. Soc. B Biol. Sci. 2013, 368, 20130127. [Google Scholar] [CrossRef] [Green Version]
  26. Legrand, M.R.; Kirchner, S. Origins and variations of nitrate in south polar precipitation. J. Geophys. Res. Space Phys. 1990, 95, 3493–3507. [Google Scholar] [CrossRef]
  27. Wolff, E.W. Nitrate in polar ice. In Ice Core Studies of Global Biogeochemical Cycles. NATO ASI Series (Series I: Global Environmental Change); Delmas, R.J., Ed.; Springer: Berlin/Heidelberg, Germany, 1995; Volume 30, pp. 195–224. [Google Scholar] [CrossRef]
  28. Röthlisberger, R.; Hutterli, M.A.; Sommer, S.; Wolff, E.W.; Mulvaney, R. Factors controlling nitrate in ice cores: Evidence from the Dome C deep ice core. J. Geophys. Res. Space Phys. 2000, 105, 20565–20572. [Google Scholar] [CrossRef] [Green Version]
  29. Frey, M.M.; Bales, R.C.; McConnell, J.R. Climate sensitivity of the century-scale hydrogen peroxide (H2O2) record preserved in 23 ice cores from West Antarctica. J. Geophys. Res. Space Phys. 2006, 111, 1–18. [Google Scholar] [CrossRef] [Green Version]
  30. Sigg, A.; Neftel, A. Seasonal variations in hydrogen peroxide in polar ice cores. Ann. Glaciol. 1988, 10, 157–162. [Google Scholar] [CrossRef] [Green Version]
  31. Tetzner, D.; Thomas, E.R.; Allen, C.S.; Wolff, E.W. A Refined method to analyze insoluble particulate matter in ice cores, and its application to diatom sampling in the Antarctic Peninsula. Front. Earth Sci. 2021, 9. [Google Scholar] [CrossRef]
  32. Delmonte, B.; Winton, H.; Baroni, M.; Baccolo, G.; Hansson, M.; Andersson, P.; Baroni, C.; Salvatore, M.C.; Lanci, L.; Maggi, V. Holocene dust in East Antarctica: Provenance and variability in time and space. Holocene 2019, 30, 546–558. [Google Scholar] [CrossRef]
  33. Lambert, F.R.; Delmonte, B.; Petit, J.-R.; Bigler, M.; Kaufmann, P.R.; Hutterli, M.A.; Stocker, T.F.; Ruth, U.; Steffensen, J.P.; Maggi, V. Dust-climate couplings over the past 800,000 years from the EPICA Dome C ice core. Nature 2008, 452, 616–619. [Google Scholar] [CrossRef] [PubMed] [Green Version]
  34. Neff, P.; Bertler, N. Trajectory modeling of modern dust transport to the Southern Ocean and Antarctica. J. Geophys. Res. Atmos. 2015, 120, 9303–9322. [Google Scholar] [CrossRef] [Green Version]
  35. Moser, D.E. Climate Proxies in a Shallow (sub-)Antarctic Ice Core from Young Island. Master’s Thesis, University of Muenster, Münster, Germany, 2020; pp. 1–111, Unpublished work. [Google Scholar]
  36. Gupta, P.; Noone, D.; Galewsky, J.; Sweeney, C.; Vaughn, B. Demonstration of high-precision continuous measurements of water vapor isotopologues in laboratory and remote field deployments using wavelength-scanned cavity ring-down spectroscopy (WS-CRDS) technology. Rapid Commun. Mass Spectrom. 2009, 23, 2534–2542. [Google Scholar] [CrossRef]
  37. Gkinis, V.; Popp, T.J.; Blunier, T.; Bigler, M.; Schüpbach, S.; Kettner, E.; Johnsen, S.J. Water isotopic ratios from a continuously melted ice core sample. Atmos. Meas. Tech. 2011, 4, 2531–2542. [Google Scholar] [CrossRef] [Green Version]
  38. Piel, C.; Weller, R.; Huke, M.; Wagenbach, D. Atmospheric methane sulfonate and non-sea-salt sulfate records at the European Project for Ice Coring in Antarctica (EPICA) deep-drilling site in Dronning Maud Land, Antarctica. J. Geophys. Res. Space Phys. 2006, 111, 1–13. [Google Scholar] [CrossRef] [Green Version]
  39. Bowen, H.J.M. Environmental Chemistry of the Elements; Academic Press: London, UK, 1979. [Google Scholar]
  40. Hoffmann, K.; Fernandoy, F.; Meyer, H.; Thomas, E.R.; Aliaga, M.; Tetzner, D.; Freitag, J.; Opel, T.; Arigony-Neto, J.; Göbel, C.F.; et al. Stable water isotopes and accumulation rates in the Union Glacier region, Ellsworth Mountains, West Antarctica, over the last 35 years. Cryosphere 2020, 14, 881–904. [Google Scholar] [CrossRef] [Green Version]
  41. Bigler, M.; Svensson, A.; Kettner, E.; Vallelonga, P.; Nielsen, M.E.; Steffensen, J.P. Optimization of high-resolution continuous flow analysis for transient climate signals in ice cores. Environ. Sci. Technol. 2011, 45, 4483–4489. [Google Scholar] [CrossRef]
  42. Lazrus, A.L.; Kok, G.L.; Lind, J.A.; Gitlin, S.N.; Heikes, B.G.; Shetter, R.E. Automated fluorometric method for hydrogen peroxide in air. Anal. Chem. 1986, 58, 594–597. [Google Scholar] [CrossRef]
  43. Grieman, M.M.; Hoffmann, H.M.; Humby, J.D.; Mulvaney, R.; Nehrbass-Ahles, C.; Rix, J.; Thomas, E.R.; Tuckwell, R.; Wolff, E.W. Continuous flow analysis methods for sodium, magnesium and calcium detection in the Skytrain ice core. J. Glaciol. 2021, 1–11. [Google Scholar] [CrossRef]
  44. Tetzner, D.; Thomas, E.R.; Allen, C.S.; Piermattei, A. Evidence of recent active volcanism in the Balleny Islands (Antarctica) from ice core records. Earth Sp. Sci. Open Arch. 2021, 1–31. [Google Scholar] [CrossRef]
  45. Hersbach, H.; Bell, B.; Berrisford, P.; Hirahara, S.; Horanyi, A.; Muñoz-Sabater, J.; Nicolas, J.; Peubey, C.; Radu, R.; Schepers, D.; et al. The ERA5 global reanalysis. Q. J. R. Meteorol. Soc. 2020, 146, 1999–2049. [Google Scholar] [CrossRef]
  46. Wakahama, G. The role of meltwater in densification processes of snow and firn percolation of meltwater into a snow cover. Int. Assoc. Hydrol. Sci. Publ. 1975, 114, 66–72. [Google Scholar]
  47. Goursaud, S.; Masson-Delmotte, V.; Favier, V.; Preunkert, S.; Fily, M.; Gallée, H.; Jourdain, B.; Legrand, M.; Magand, O.; Minster, B.; et al. A 60-year ice-core record of regional climate from Adélie Land, coastal Antarctica. Cryosphere 2017, 11, 343–362. [Google Scholar] [CrossRef] [Green Version]
  48. Johnsen, S.J. Stable isotope homogenization of polar firn and ice. In Isotopes and Impurities in Snow and Ice. Proceedings of the Grenoble Symposium 1975; International Association of Hydrological Sciences Publications: Grenoble, France, 1977; Volume 118, pp. 210–219. [Google Scholar]
  49. Turekian, K.K. Oceans; Foundations of Earth Science Series; Prentice-Hall: Englewood, NJ, USA, 1968. [Google Scholar]
  50. Sigg, A.; Neftel, A. Evidence for a 50% increase in H2O2 over the past 200 years from a Greenland ice core. Nature 1991, 351, 557–559. [Google Scholar] [CrossRef]
  51. Neftel, A.; Jacob, P.; Klockow, D. Long-term record of H2O2 in polar ice cores. Tellus B Chem. Phys. Meteorol. 1986, 38, 262–270. [Google Scholar] [CrossRef]
  52. Turner, J.; Phillips, T.; Thamban, M.; Rahaman, W.; Marshall, G.J.; Wille, J.D.; Favier, V.; Winton, V.; Thomas, E.; Wang, Z.; et al. The dominant role of extreme precipitation events in Antarctic snowfall variability. Geophys. Res. Lett. 2019, 46, 3502–3511. [Google Scholar] [CrossRef] [Green Version]
  53. Servettaz, A.P.M.; Orsi, A.J.; Curran, M.A.J.; Moy, A.D.; Landais, A.; Agosta, C.; Winton, V.H.L.; Touzeau, A.; McConnell, J.R.; Werner, M.; et al. Snowfall and water stable isotope variability in East Antarctica controlled by warm synoptic events. J. Geophys. Res. Atmos. 2020, 125. [Google Scholar] [CrossRef]
  54. Pasteris, D.R.; McConnell, J.R.; Das, S.B.; Criscitiello, A.S.; Evans, M.J.; Maselli, O.J.; Sigl, M.; Layman, L. Seasonally resolved ice core records from West Antarctica indicate a sea ice source of sea-salt aerosol and a biomass burning source of ammonium. J. Geophys. Res. Atmos. 2014, 119, 9168–9182. [Google Scholar] [CrossRef] [Green Version]
  55. Frey, M.M.; Savarino, J.; Morin, S.; Erbland, J.; Martins, J.M.F. Photolysis imprint in the nitrate stable isotope signal in snow and atmosphere of East Antarctica and implications for reactive nitrogen cycling. Atmos. Chem. Phys. Discuss. 2009, 9, 8681–8696. [Google Scholar] [CrossRef] [Green Version]
  56. Röthlisberger, R.; Hutterli, M.A.; Wolff, E.W.; Mulvaney, R.; Fischer, H.; Bigler, M.; Goto-Azuma, K.; Hansson, M.E.; Ruth, U.; Siggaard-Andersen, M.-L.; et al. Nitrate in Greenland and Antarctic ice cores: A detailed description of post-depositional processes. Ann. Glaciol. 2002, 35, 209–216. [Google Scholar] [CrossRef] [Green Version]
  57. Zatko, M.; Geng, L.; Alexander, B.; Sofen, E.; Klein, K. The impact of snow nitrate photolysis on boundary layer chemistry and the recycling and redistribution of reactive nitrogen across Antarctica and Greenland in a global chemical transport model. Atmos. Chem. Phys. Discuss. 2016, 16, 2819–2842. [Google Scholar] [CrossRef] [Green Version]
  58. Thomas, E.R.; Abram, N.J. Ice core reconstruction of sea ice change in the Amundsen-Ross Seas since 1702 A.D. Geophys. Res. Lett. 2016, 43, 5309–5317. [Google Scholar] [CrossRef] [Green Version]
  59. Stammerjohn, S.E.; Scambos, T.A. Warming reaches the South Pole. Nat. Clim. Chang. 2020, 10, 710–711. [Google Scholar] [CrossRef]
  60. Abram, N.J.; Mulvaney, R.; Wolff, E.W.; Triest, J.; Kipfstuhl, S.; Trusel, L.D.; Vimeux, F.; Fleet, L.; Arrowsmith, C. Acceleration of snow melt in an Antarctic Peninsula ice core during the twentieth century. Nat. Geosci. 2013, 6, 404–411. [Google Scholar] [CrossRef] [Green Version]
  61. Koffman, B.G.; Kreutz, K.J.; Kurbatov, A.; Dunbar, N. Impact of known local and tropical volcanic eruptions of the past millennium on the WAIS Divide microparticle record. Geophys. Res. Lett. 2013, 40, 4712–4716. [Google Scholar] [CrossRef]
  62. Büttner, R.; Dellino, P.; Zimanowski, B. Identifying magma—Water interaction from the surface features of ash particles. Nature 1999, 401, 688–690. [Google Scholar] [CrossRef]
  63. National Centers for Environmental Prediction, National Weather Service/NOAA/U.S., Department of Commerce. NCEP/NCAR Global Reanalysis Products, 1948-continuing, Research Data Archive at the National Center for Atmospheric Research, Computational and Information Systems Laboratory. 1994. Available online: https://rda.ucar.edu/datasets/ds090.0/ (accessed on 17 August 2021).
  64. Winski, D.; Osterberg, E.; Kreutz, K.; Wake, C.; Ferris, D.; Campbell, S.; Baum, M.; Bailey, A.; Birkel, S.; Introne, D.; et al. A 400-year ice core melt layer record of summertime warming in the Alaska range. J. Geophys. Res. Atmos. 2018, 123, 3594–3611. [Google Scholar] [CrossRef]
  65. Tetzner, D.; Thomas, E.; Allen, C. A validation of ERA5 reanalysis data in the Southern Antarctic Peninsula—Ellsworth land region, and its implications for ice core studies. Geoscience 2019, 9, 289. [Google Scholar] [CrossRef] [Green Version]
Figure 1. Map of (a) the Antarctic including the Balleny Island study area, the September (light blue) and February (dark blue shading) sea ice extent for the long-term median period 1981–2010 (NSIDC); Subantarctic Front (SAF, outermost anthracite dashed line), Antarctic Polar Front (APF, middle light-grey dashed line), and Southern Antarctic Circumpolar Current Front (SACCF, innermost grey-dashed line) given; (b) detailed map of Young Island with red and blue marker indicating ice core drilling and automatic weather station (AWS) sites, respectively.
Geosciences 11 00368 g001
Figure 2. Cutting scheme of a circular Young Island ice core cross section, including square strips for continuous flow analysis (CFA) at the Niels Bohr Institute (former Centre for Ice and Climate, CIC) and the British Antarctic Survey (BAS), segments for discrete ion chromatography (IC) and stable water isotope measurements, microparticle analysis (PA), and an archive (A); figure adapted from [35].
Geosciences 11 00368 g002
Figure 3. Seasonal variability of monthly mean 2-m air temperature (red) and precipitation (blue, in millimeter water equivalent per month) at Young Island derived from an automatic weather station (AWS) in 1991–1994 and 1996–1997 and ERA5 reanalysis 1979–2020; figure adapted from [35].
Geosciences 11 00368 g003
Figure 4. (a) Density profiles derived from ice core fragments on water equivalent depth scale (w.eq.) including the overall trend based on polynomial fit, plotted against the record of melt layers (grey vertical lines); (b) Alternation of non-melt (darker) and melt-affected sections (lighter) within the Young Island ice core at 1.47–1.63 m w.eq. depth (equals 2.85–3.15 m snow depth) acquired from digital black-and-white photography; figure redrawn from [35].
Geosciences 11 00368 g004
Figure 5. Full glacio-chemical records acquired from the Young Island ice core; (a) stable water isotope ratio δ18O; concentrations of (b) sodium, (c) sulfate, (d) methanesulfonate, (e) bromide, (f) nitrate, (g) hydrogen peroxide, and (i) dust, defined as insoluble particulate matter.
Geosciences 11 00368 g005
Figure 6. Particle size distribution of dust, defined as insoluble particulate matter, in the Young Island ice core; dV/dlnD = derivative of the total dust volume (V) with respect to the natural logarithm of the particle diameter (D) for each bin.
Geosciences 11 00368 g006
Figure 7. Dating approach A based on the discrete 5 cm δ18O record (light blue line) of the Young Island ice core and its 3 point running average (thin dark blue line) using local troughs as winter markers (vertical purple lines); questionable years are marked as dashed lined.
Geosciences 11 00368 g007
Figure 8. NO3 profile with manually picked markers (vertical purple lines) and the fully extrapolated age scale B (upper x-axis) in the context of melt layers (vertical grey bars) and SO42−:NO3 ratio in the lower panel; a grey vertical arrow indicates the period of Pinatubo eruption.
Geosciences 11 00368 g008
Figure 9. Dating approach C based on MSA, Br, NO3, and SO42− concentration peaks at 5-cm resolution (thick lines) with a 3-point running average (thin lines); purple vertical lines mark assigned years, dashed lines uncertain; light-grey bars in the lowest panel represent melt layers, features >10 cm thickness highlighted in dark grey; 2011 and 1997 (arrows) included to highlight the location of the two warmest summers during this period derived from ERA5.
Geosciences 11 00368 g009
Figure 10. Dating approach D based on the discrete 5-cm nssSO42−:ssNa+ ratio (dark blue) and MSA (light blue). Purple vertical lines indicate ice core horizons that were identified as winters, grey vertical lines show the respective summertime peaks in between. The dashed vertical line at ~9 m w.eq. depth indicates an uncertain year, which was not considered in the end.
Geosciences 11 00368 g010
Figure 11. Comparison of the four age scales based on δ18O (A), NO3 record (B), marine ion concentrations (C), and nssSO42−:ssNa+ ratio (D); integer years refer to the respective January, winter-based dating approaches point to July and are denoted with a ‘.5’ suffix; 2010 and 2000 highlighted in turquoise as reference years; blue stars point out uncertain years; grey bars indicate horizons of (a) elevated SO42−:NO3 ratio, and (b) cryptotephra discussed in the next Section 3.5.
Geosciences 11 00368 g011
Figure 12. Identification of an age tie point; (a) full dust (>1 µm) concentration profile derived from the Young Island ice core using CFA (light grey) and the derived 100-point average (black); (be) micrographs of cryptotephra shards identified in the ice sampled between 7.7 and 7.95 m w.eq. depth, scale bar in bottom right of each frame represents 50 µm; (f) detailed view of total dust particle concentration using the colour code of panel (a) and coarse dust particle size fraction (blue) at 6.8–8.2 m w.eq. depth.
Geosciences 11 00368 g012
Figure 13. Interannual comparison of precipitation derived from ERA5 and NCEP reanalyses to ice core net accumulation derived from annual layer thickness (based on marine species dating approach C).
Geosciences 11 00368 g013
Table 1. Overview of the dating approaches applied in the Young Island ice core, details given in the text (Section 3.3 and Section 3.4).
Dating ApproachBased onProposed Bottom AgeUncertainty
Thomas et al. (2021)Herron-Langway densification model driven by the annual average precipitation from ERA5 2002±4
Ad18O troughs (winter)1989±6
BNO3 peaks (summer)1988±6
CMarine species MSA, SO42−, NO3, and Br peaks plus melt layers >10 cm (summer)1995/94±2
DnssSO42−:ssNa+ ratio and MSA troughs (winter)1993±1
Publisher’s Note: MDPI stays neutral with regard to jurisdictional claims in published maps and institutional affiliations.

