
A Comprehensive and Systematic Diagnostic Campaign for a New Acquisition of Contemporary Art—The Case of Natura Morta by Andreina Rosa (1924–2019) at the International Gallery of Modern Art Ca’ Pesaro, Venice

 ,
,  , , and
Abstract
:1. Introduction
2. Materials and Methods
2.1. Macro- and Micro-Observation
2.1.1. Technical Photography
2.1.2. Optical Microscopy
2.2. Spectroscopic Analyses
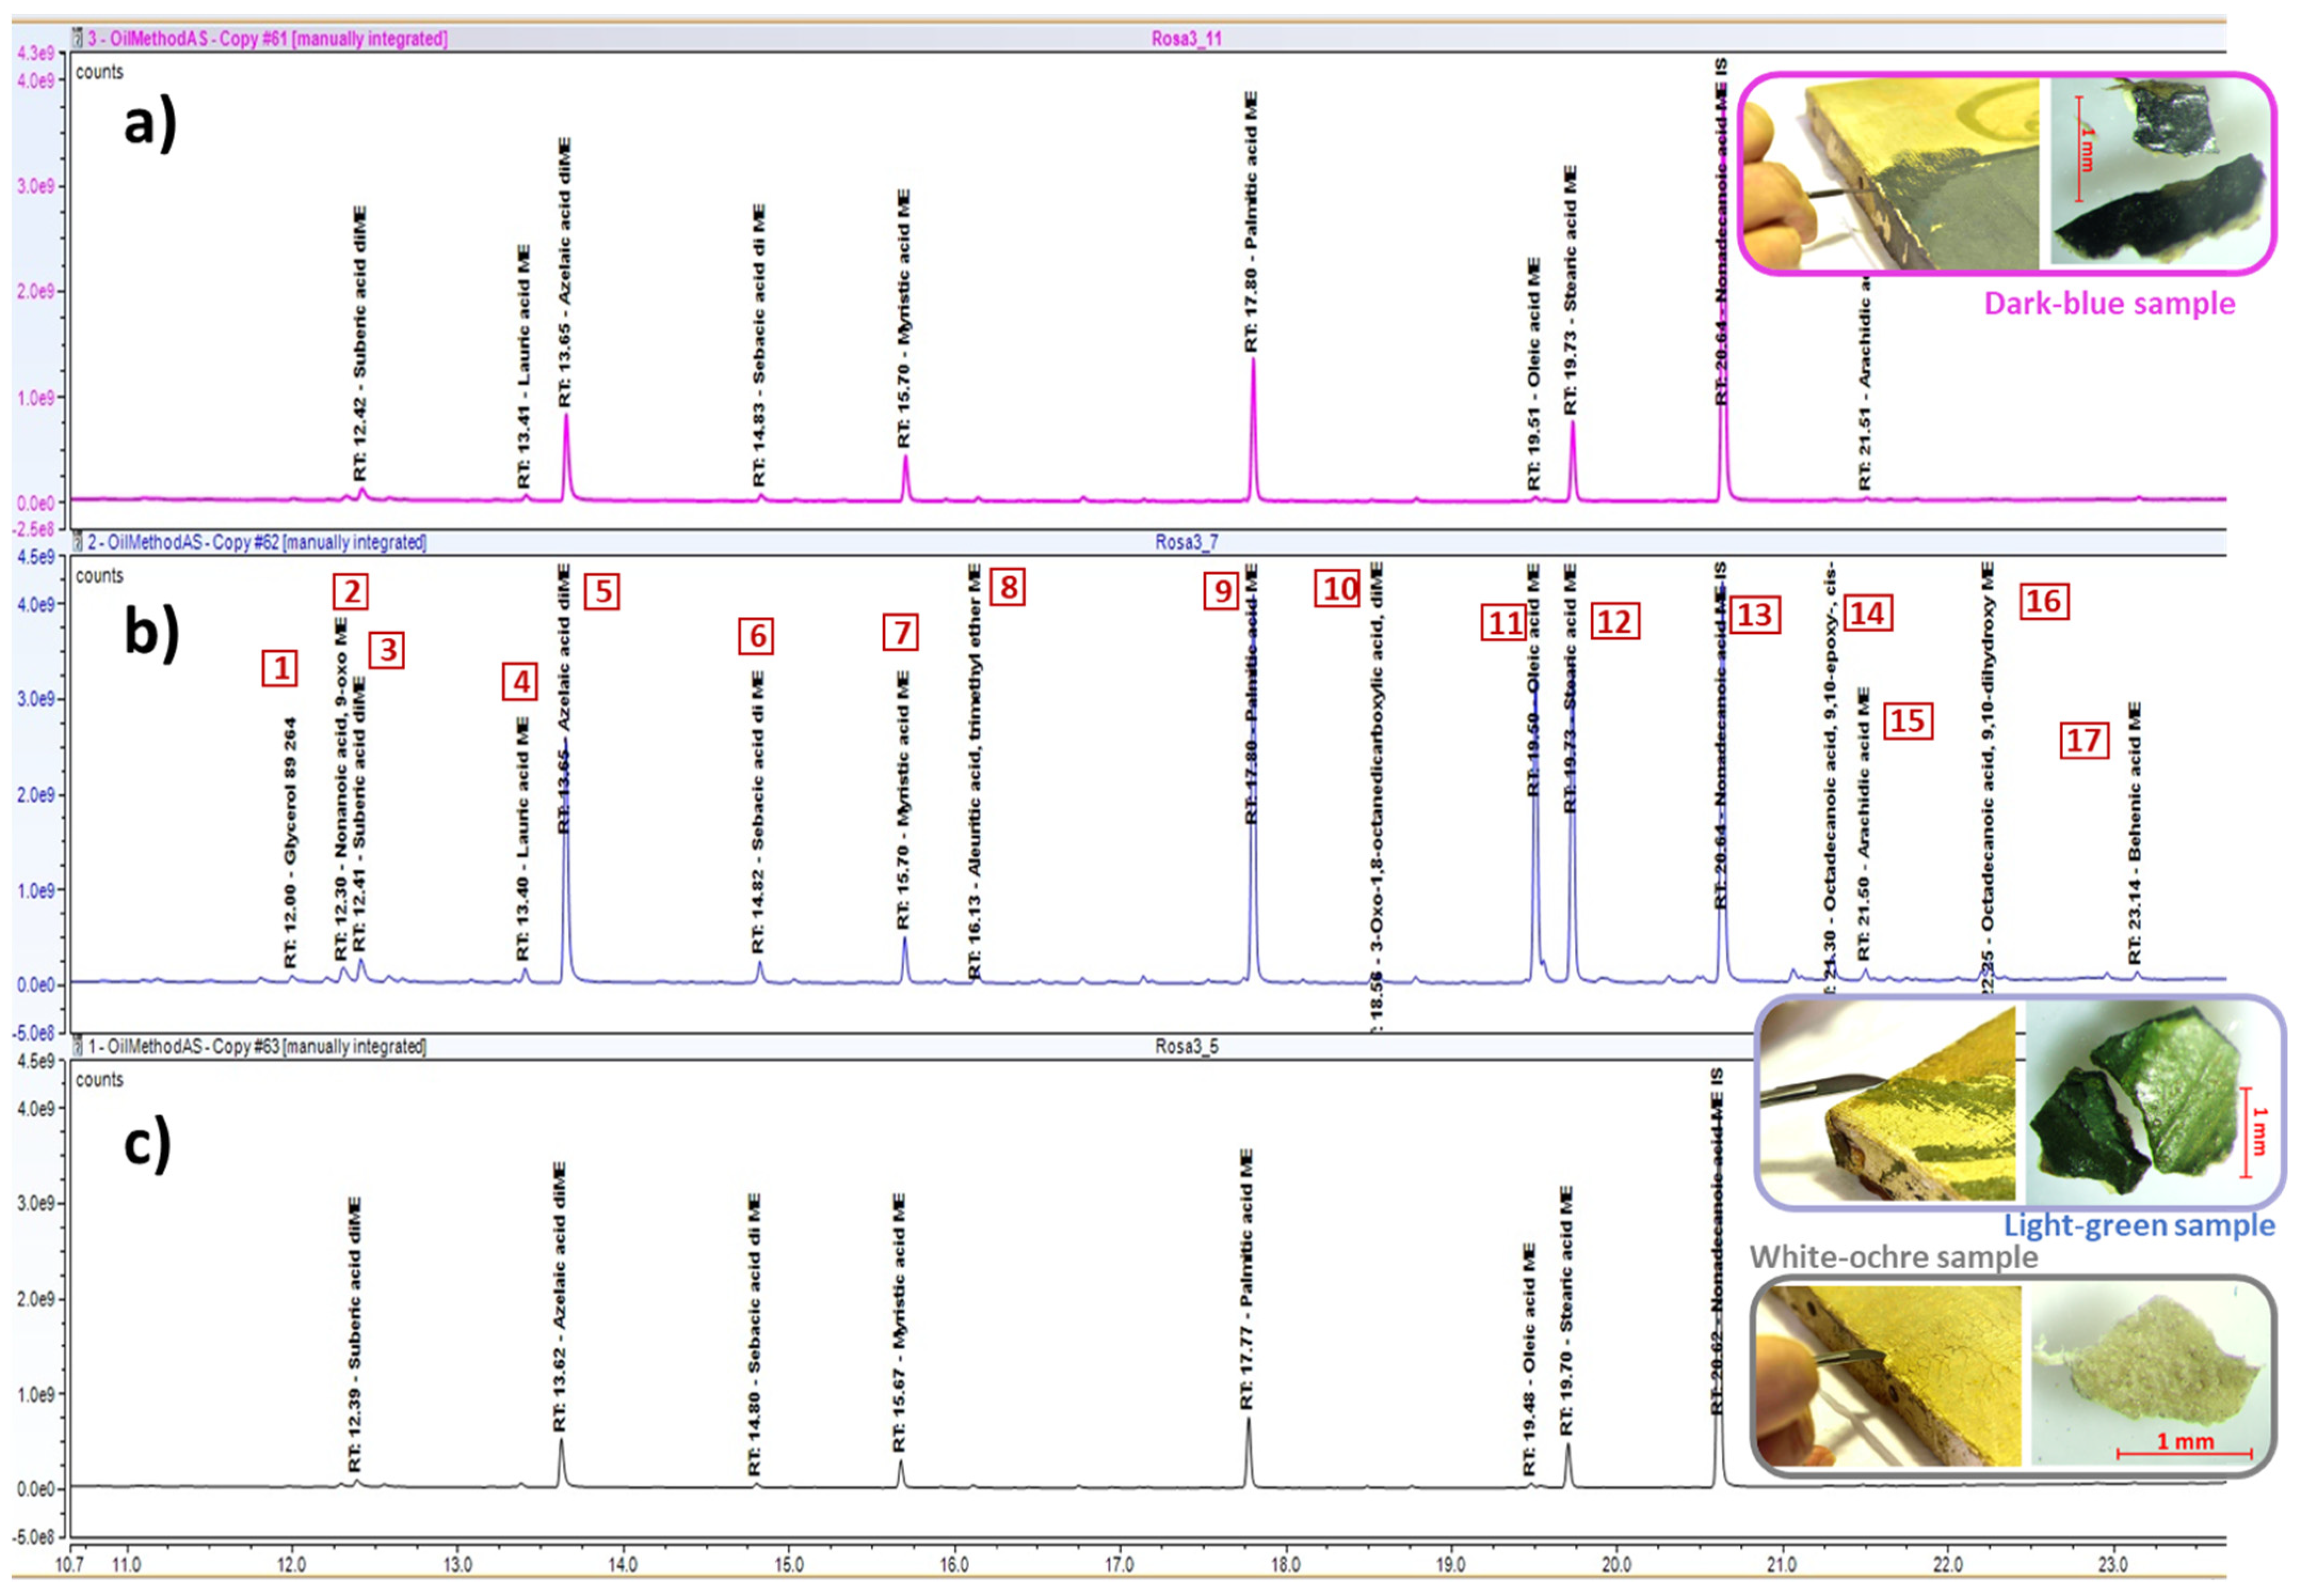
2.3. Gas Chromatography/Mass Spectrometry (GC/MS)
3. Results
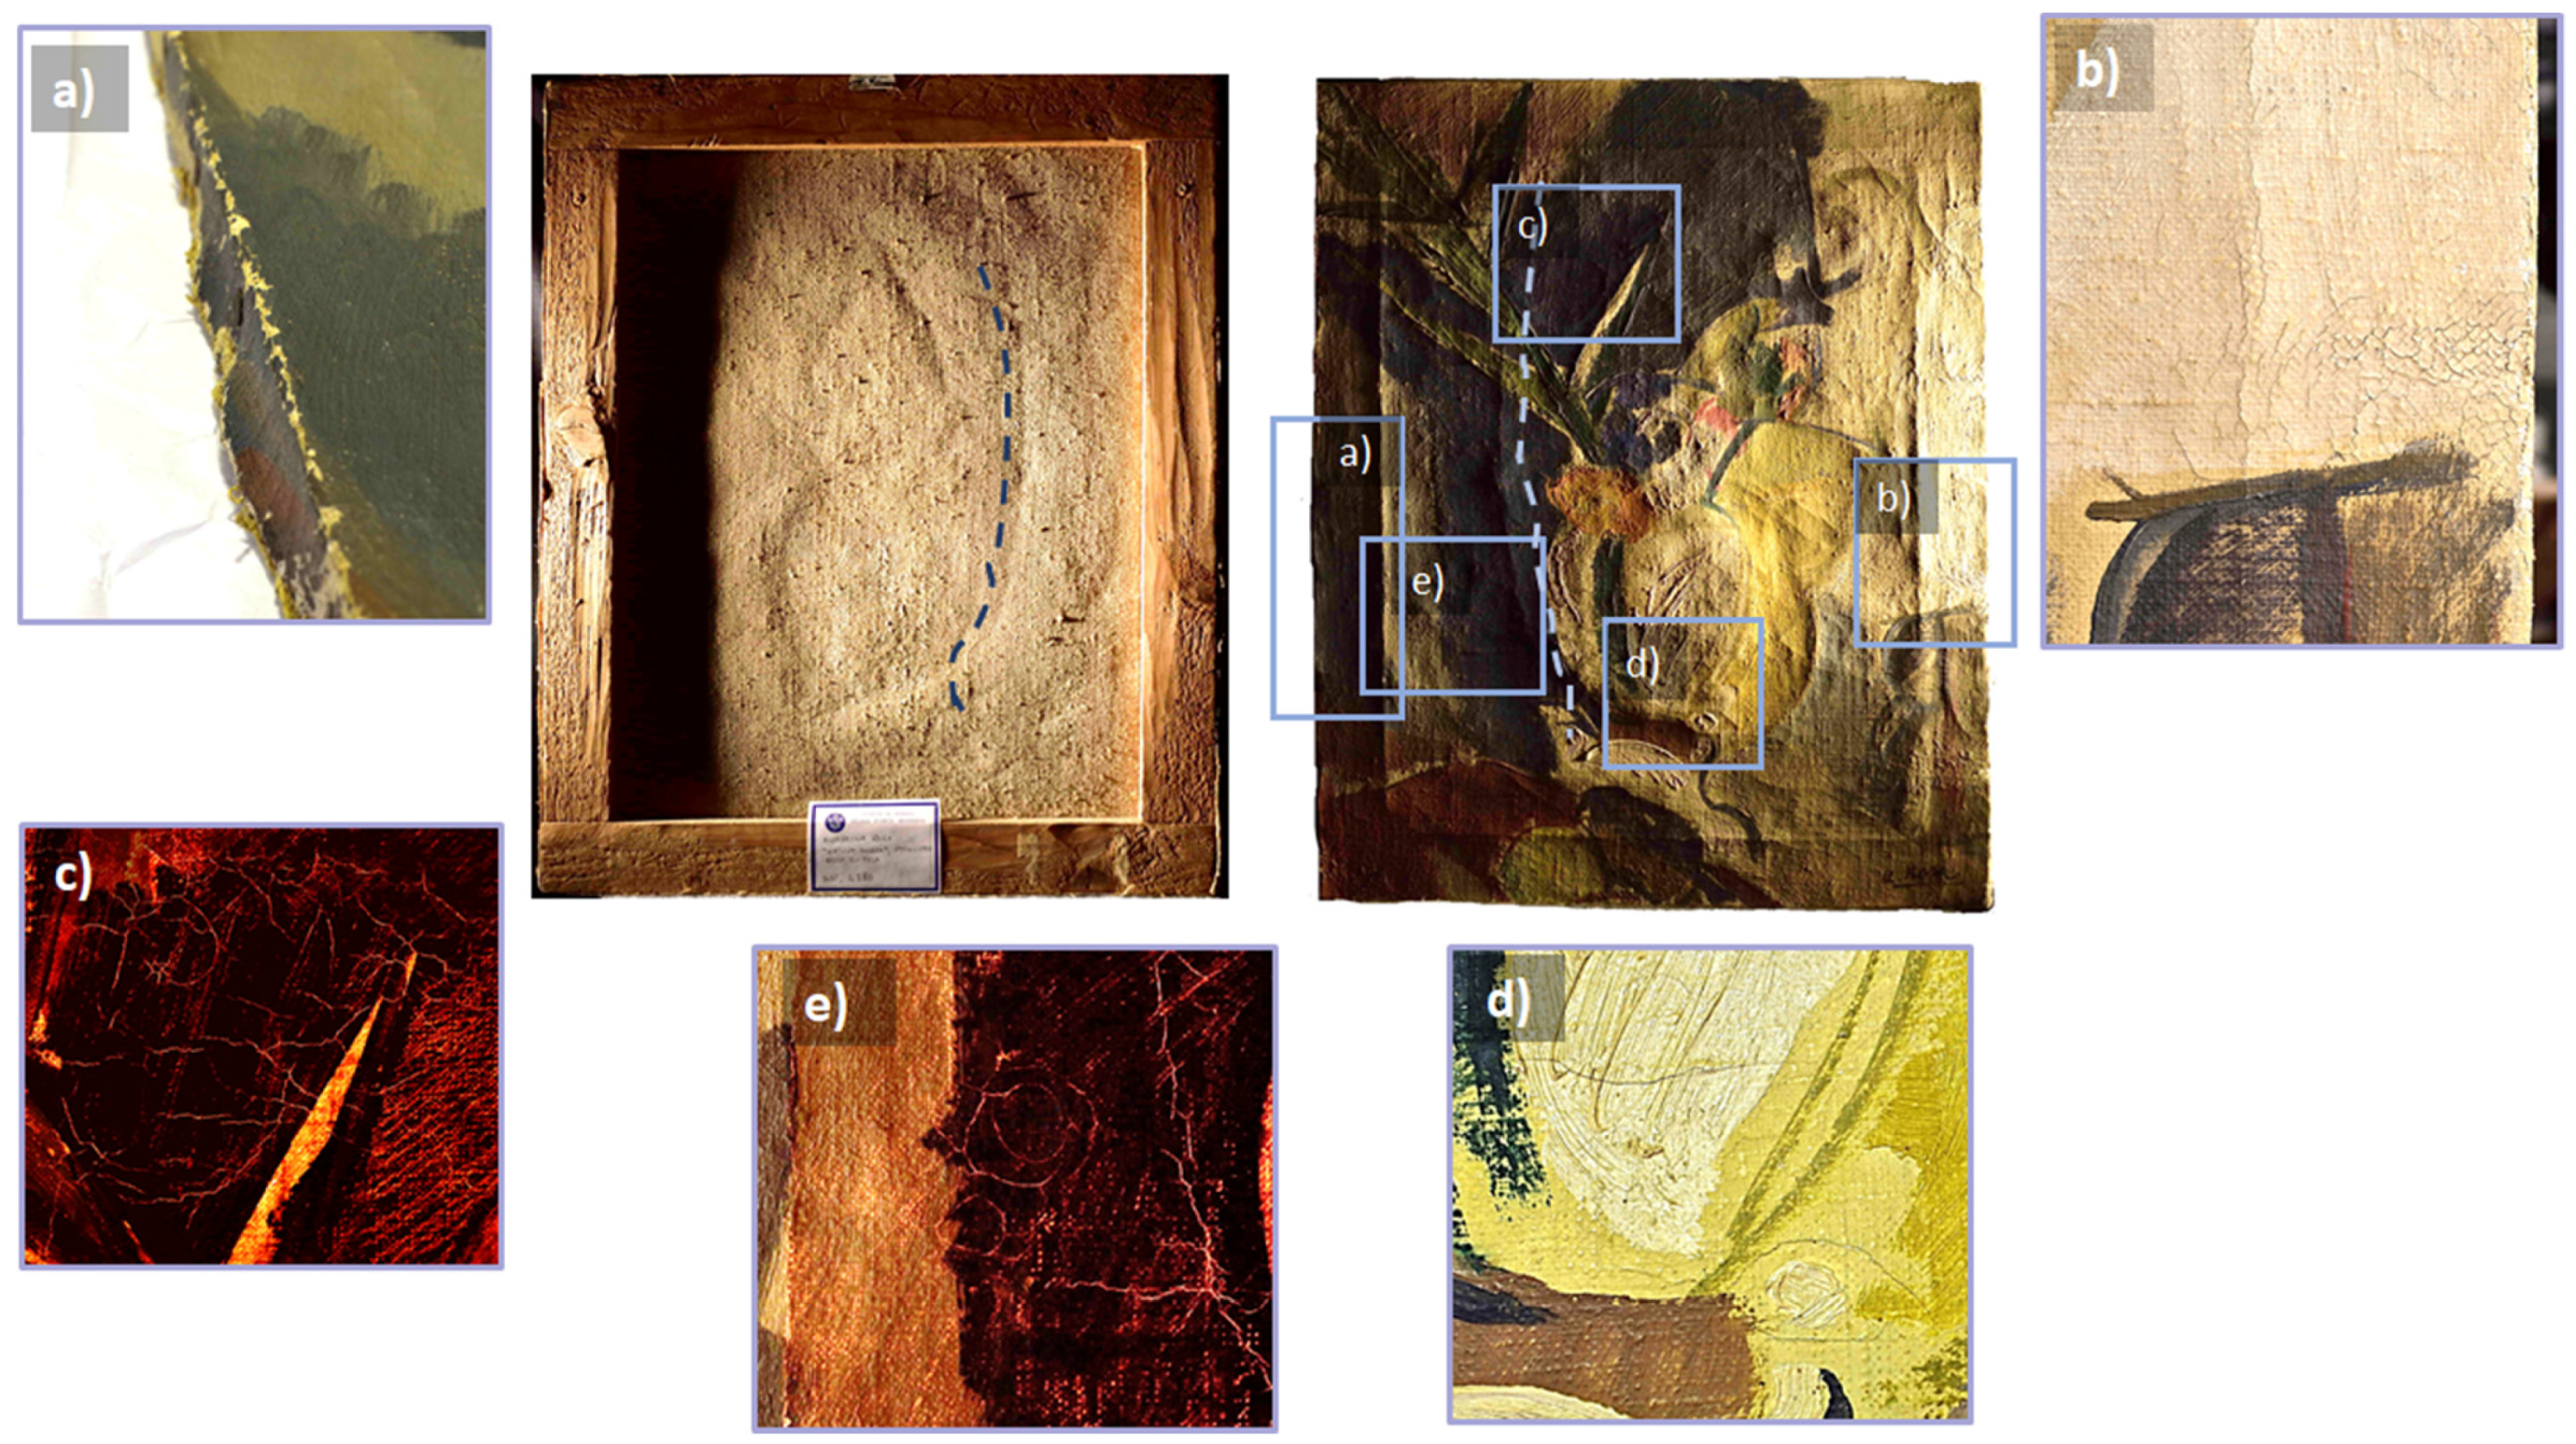
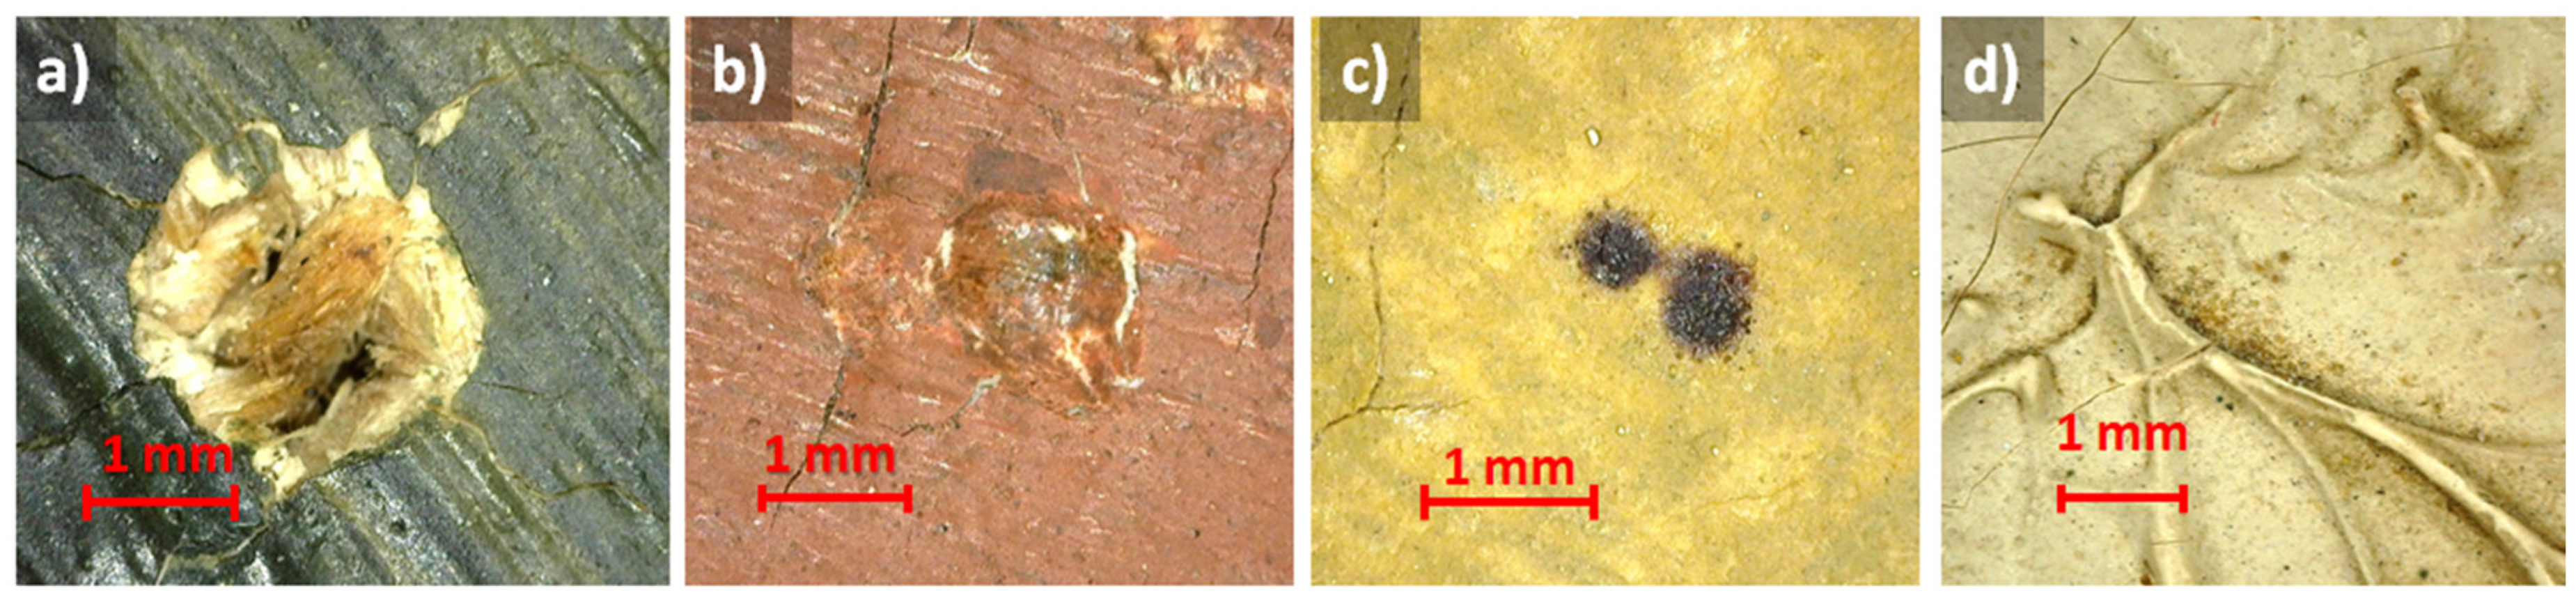
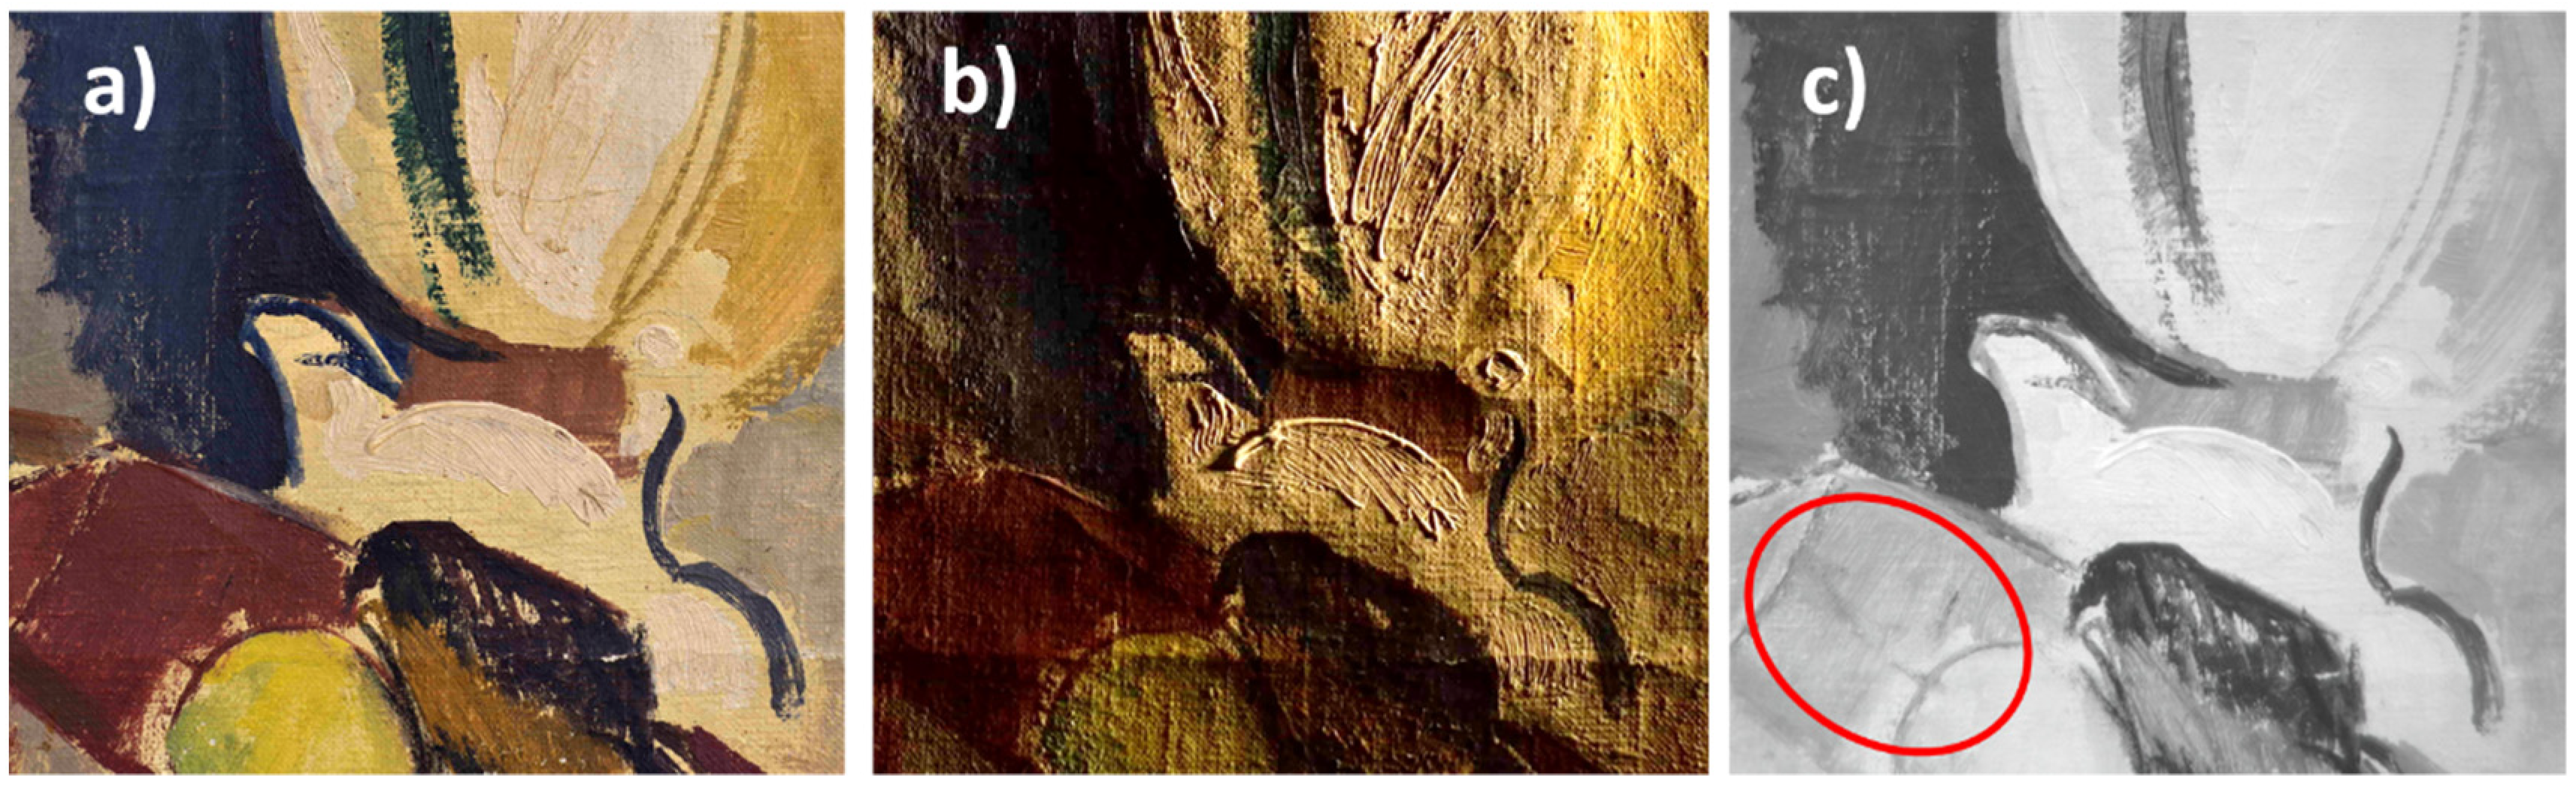
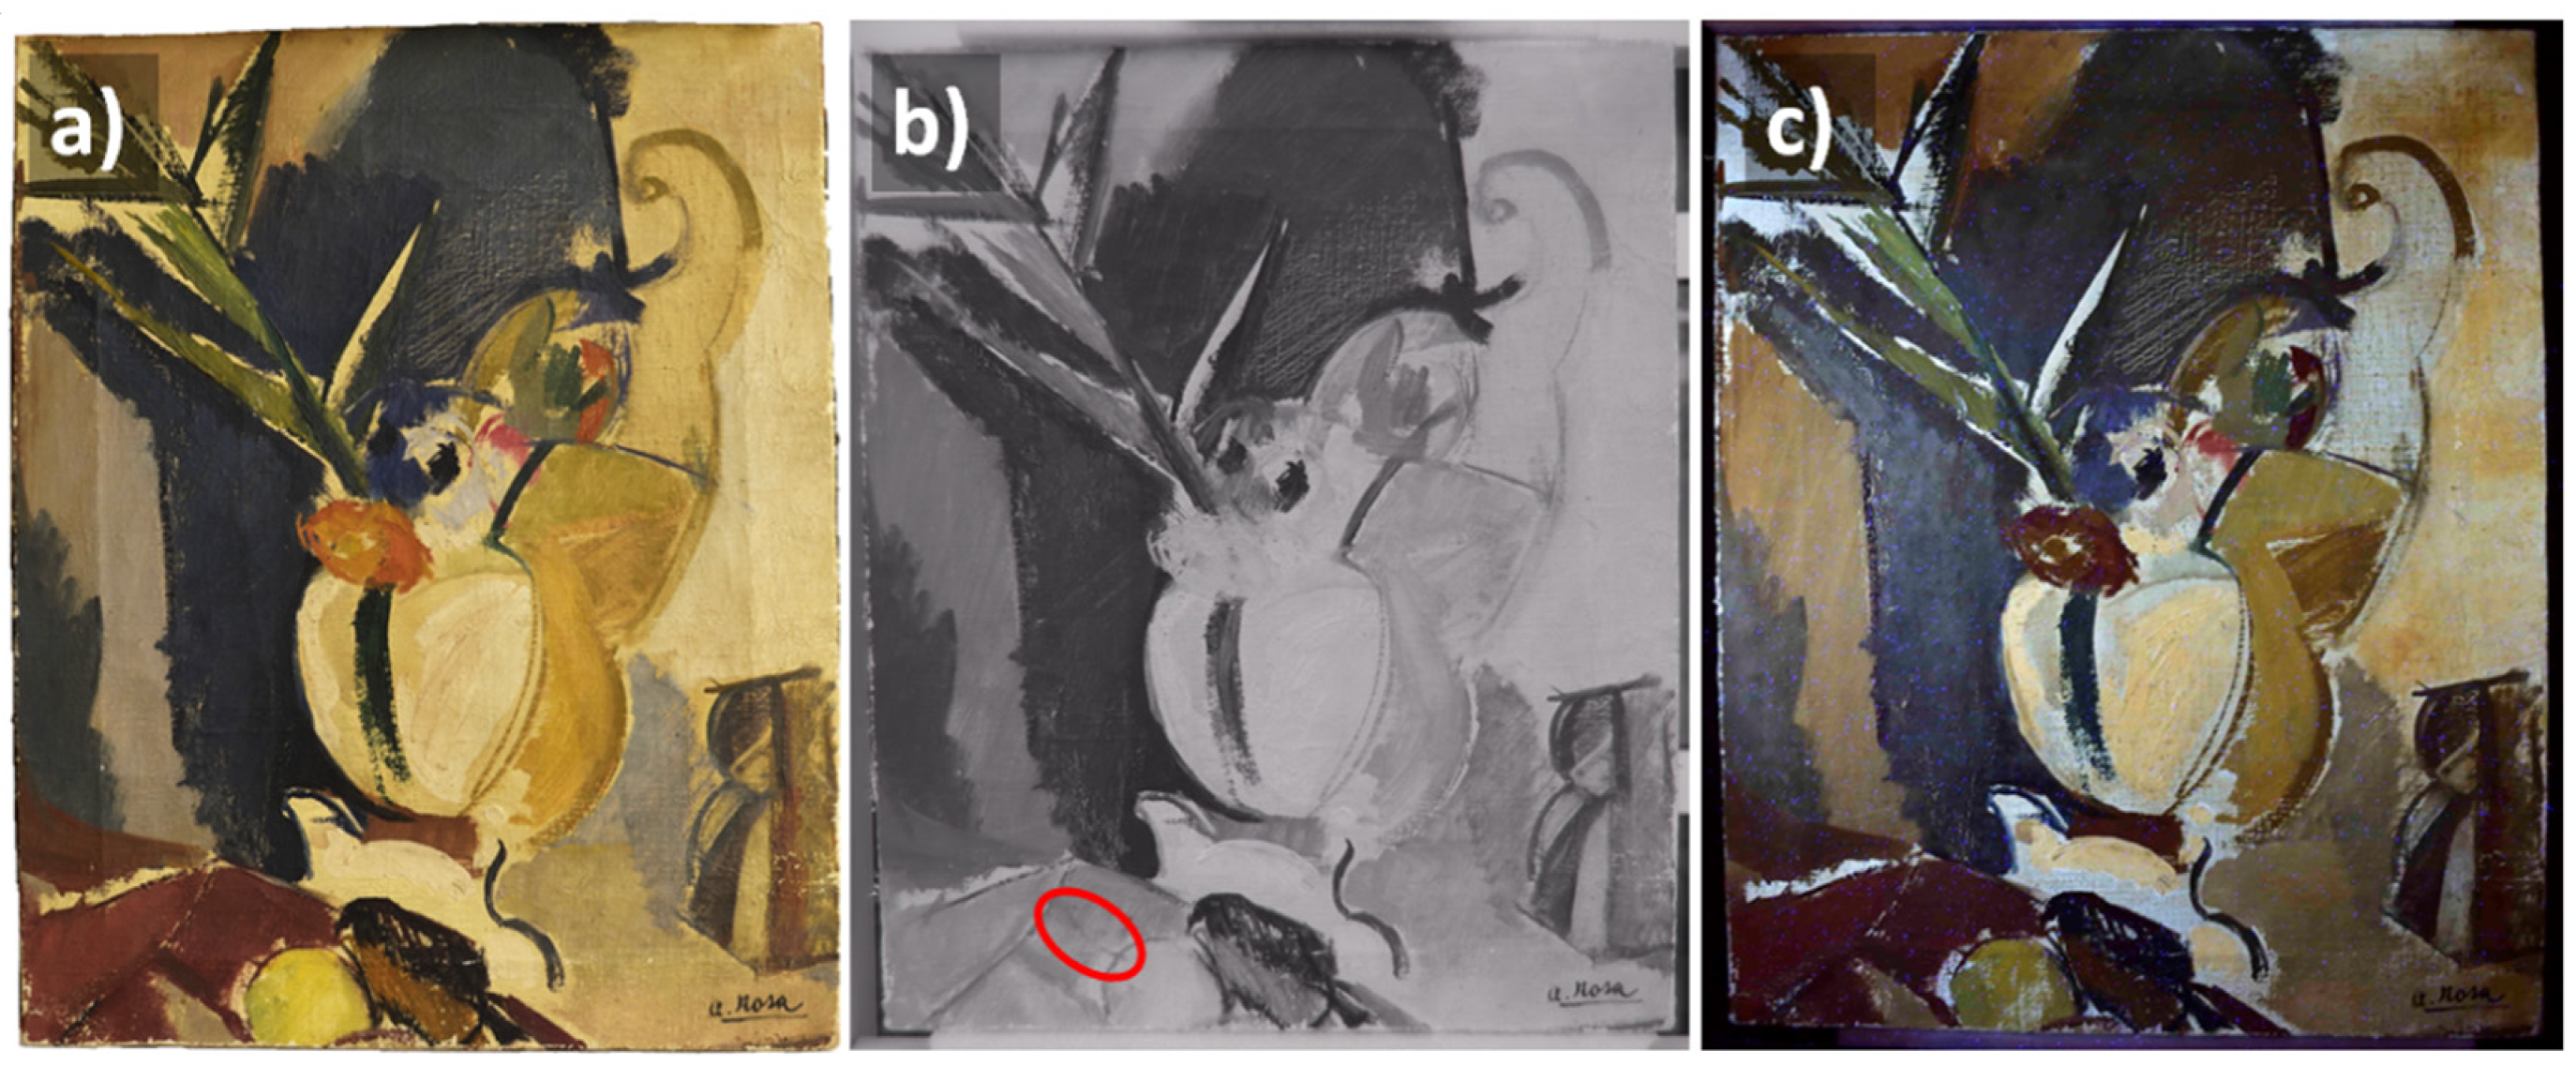
3.1. State of Conservation and Degradation Phenomena
3.2. Painting Technique
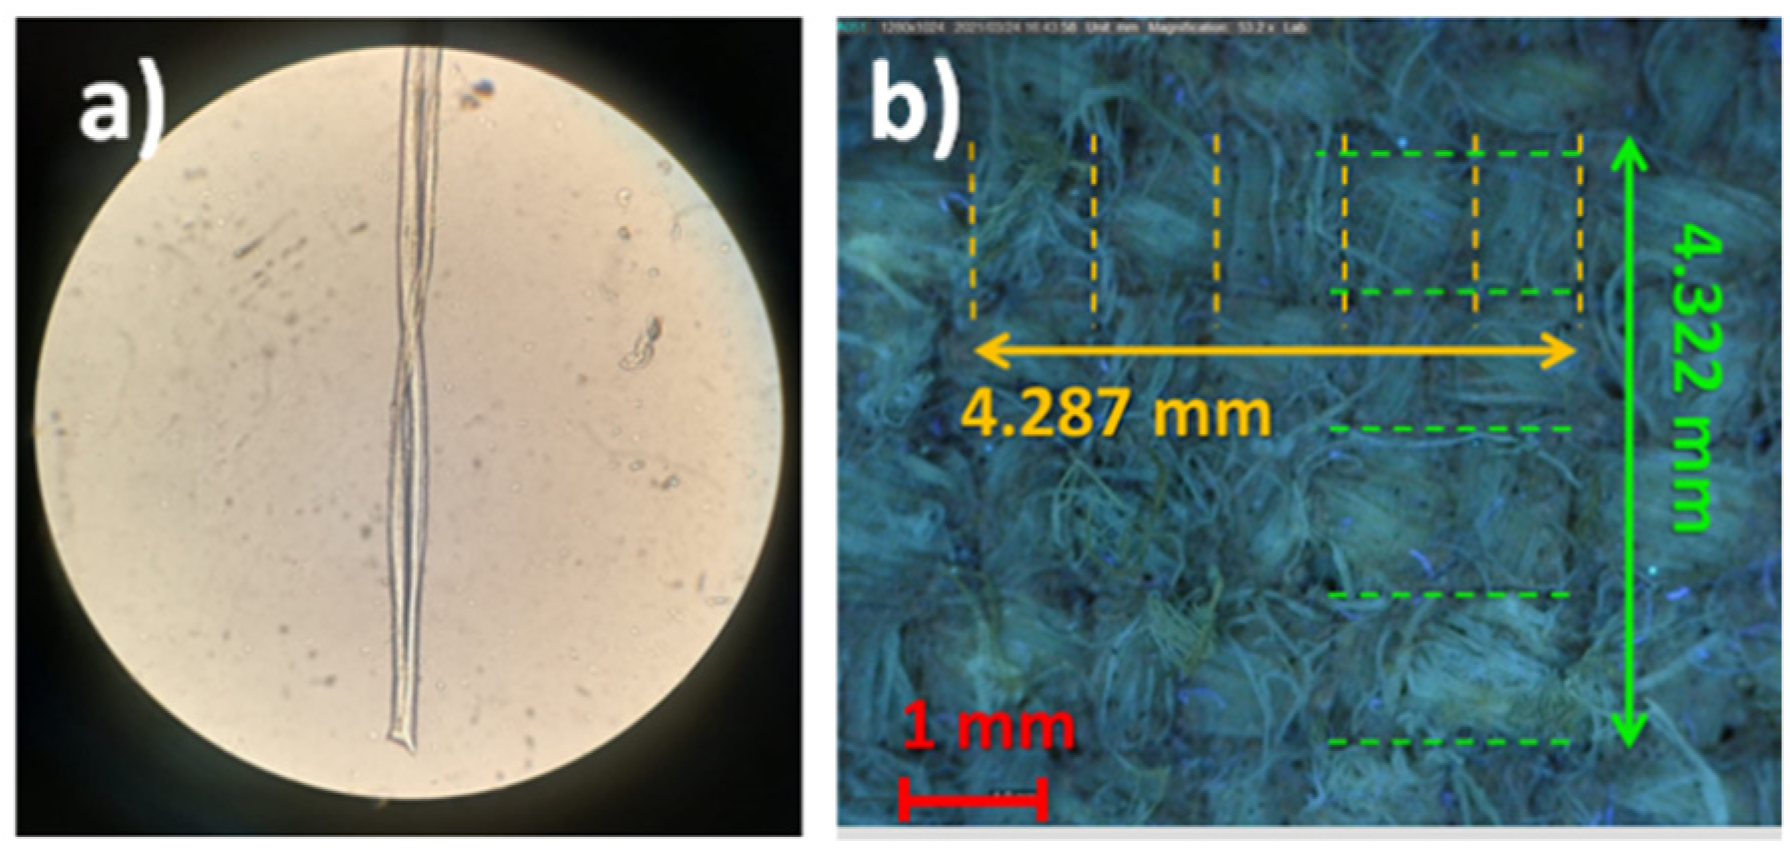
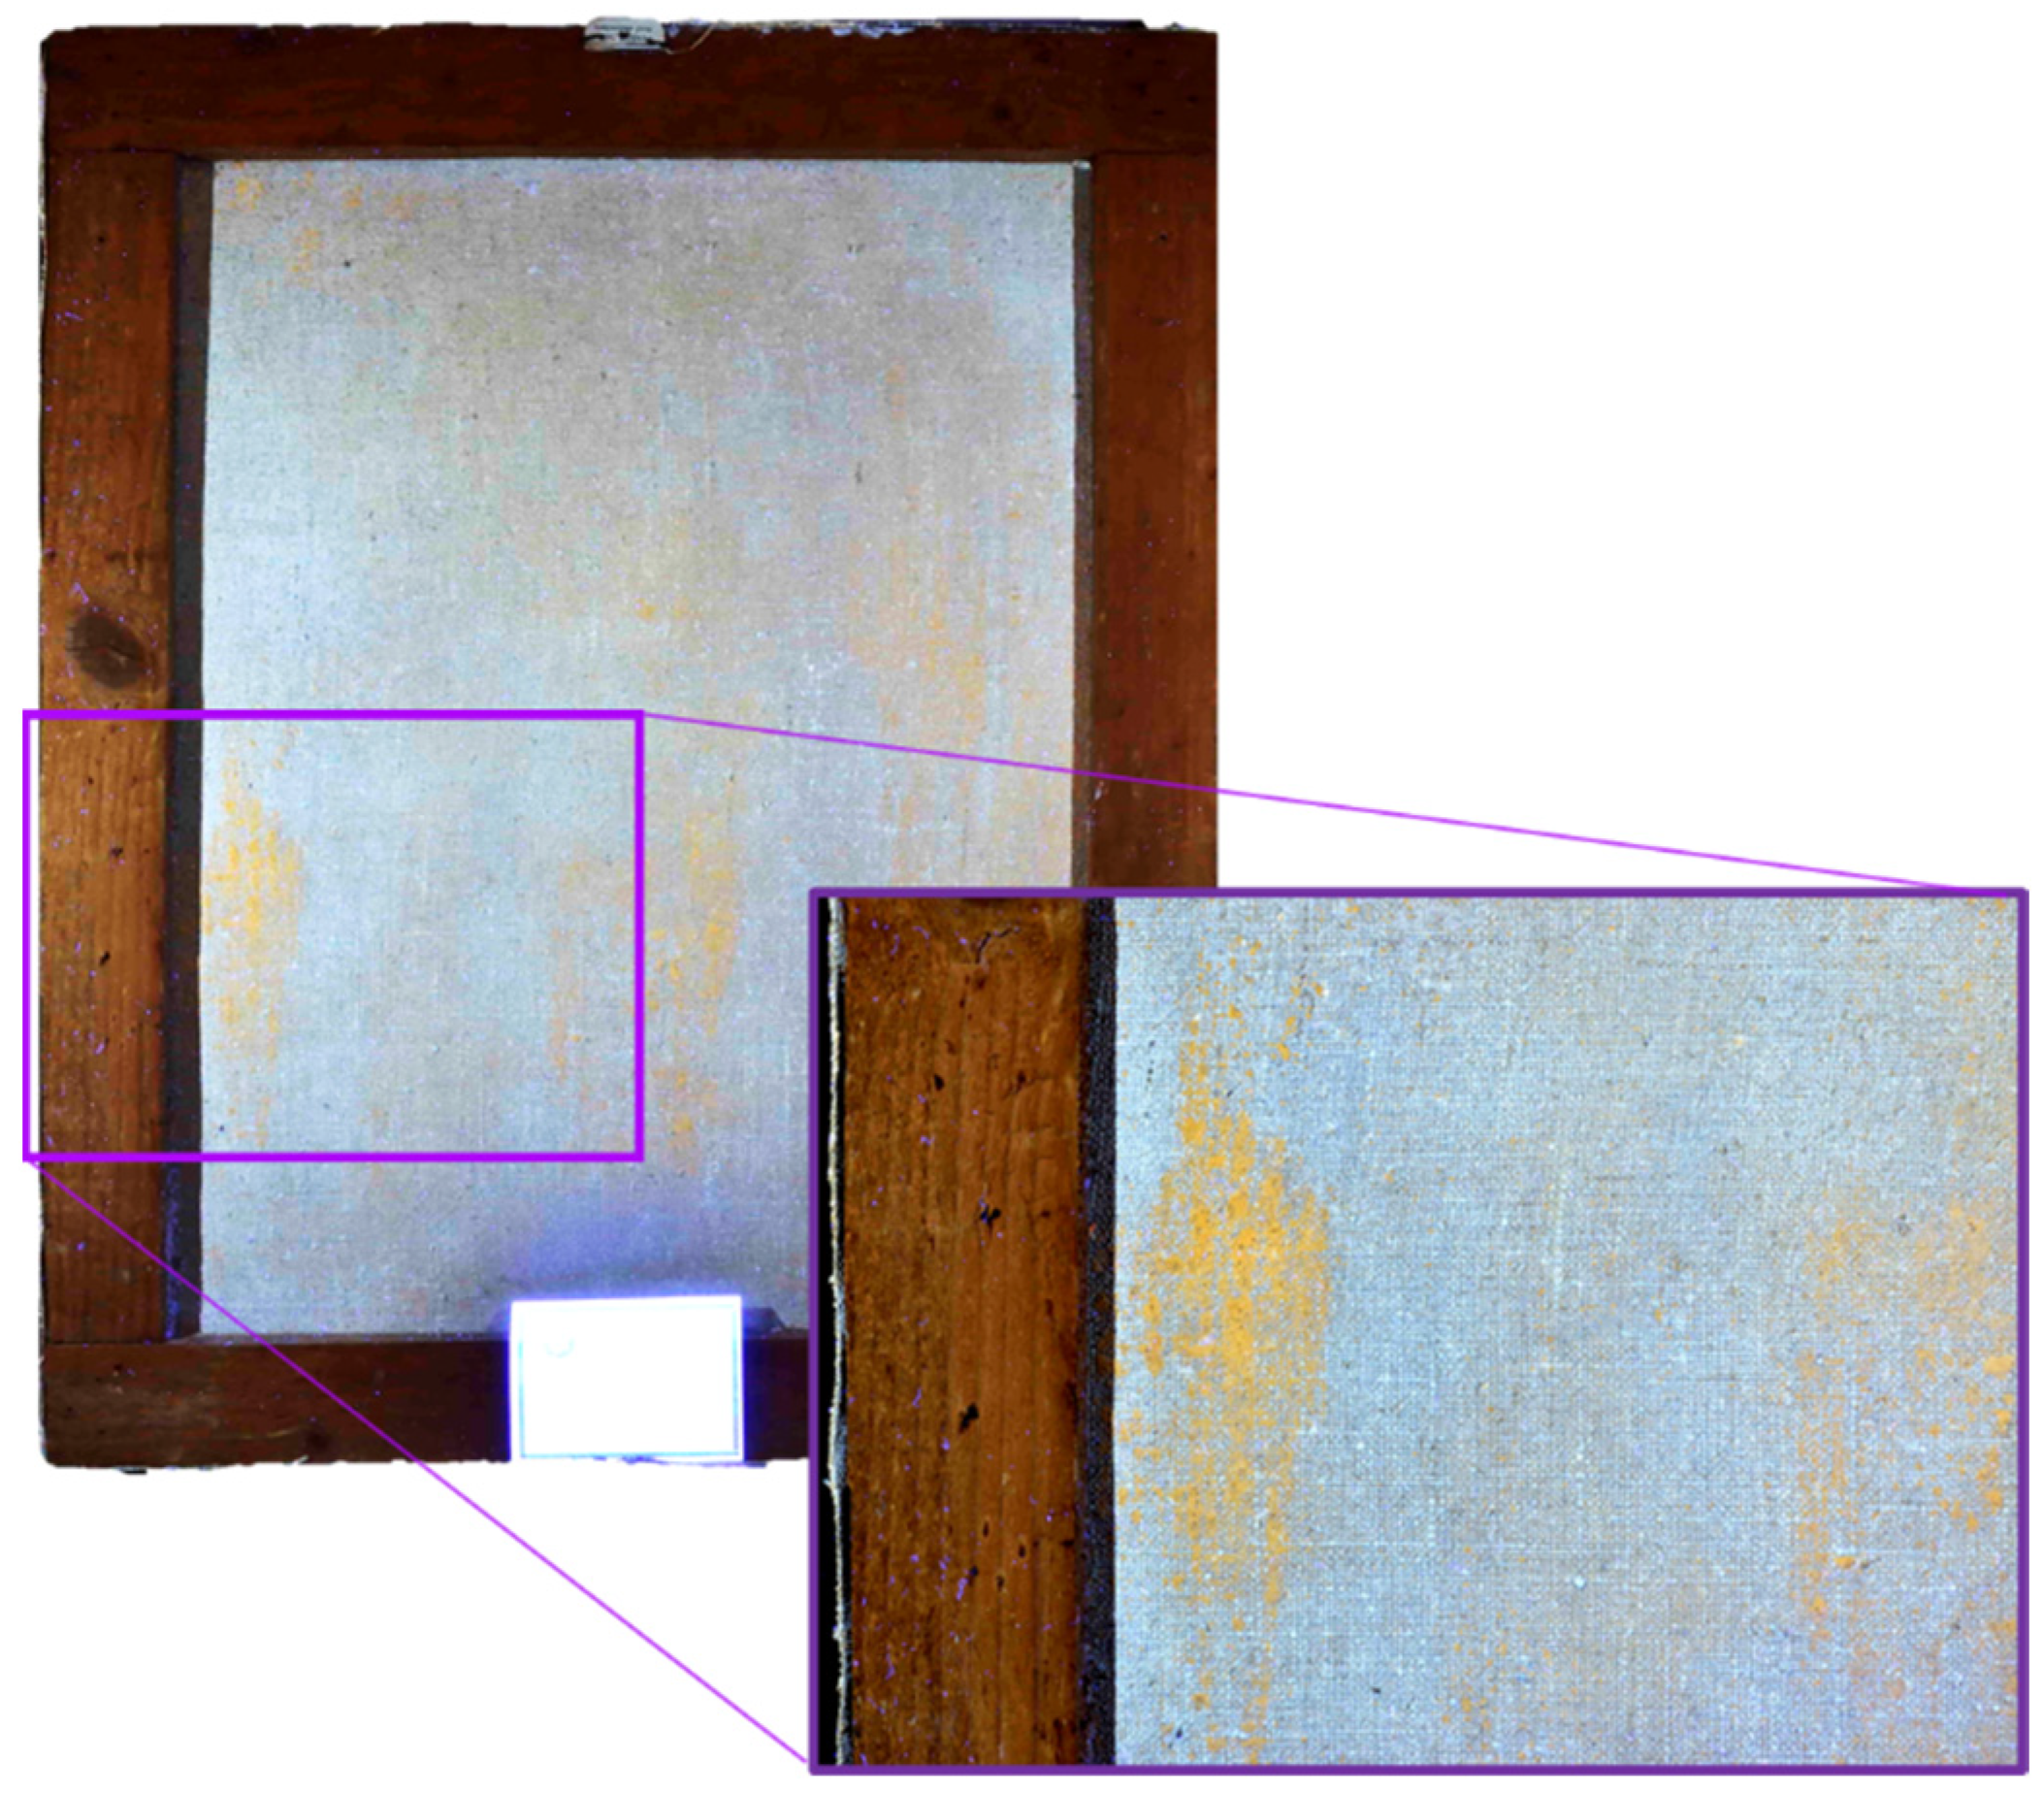
3.2.1. Preparation Layer
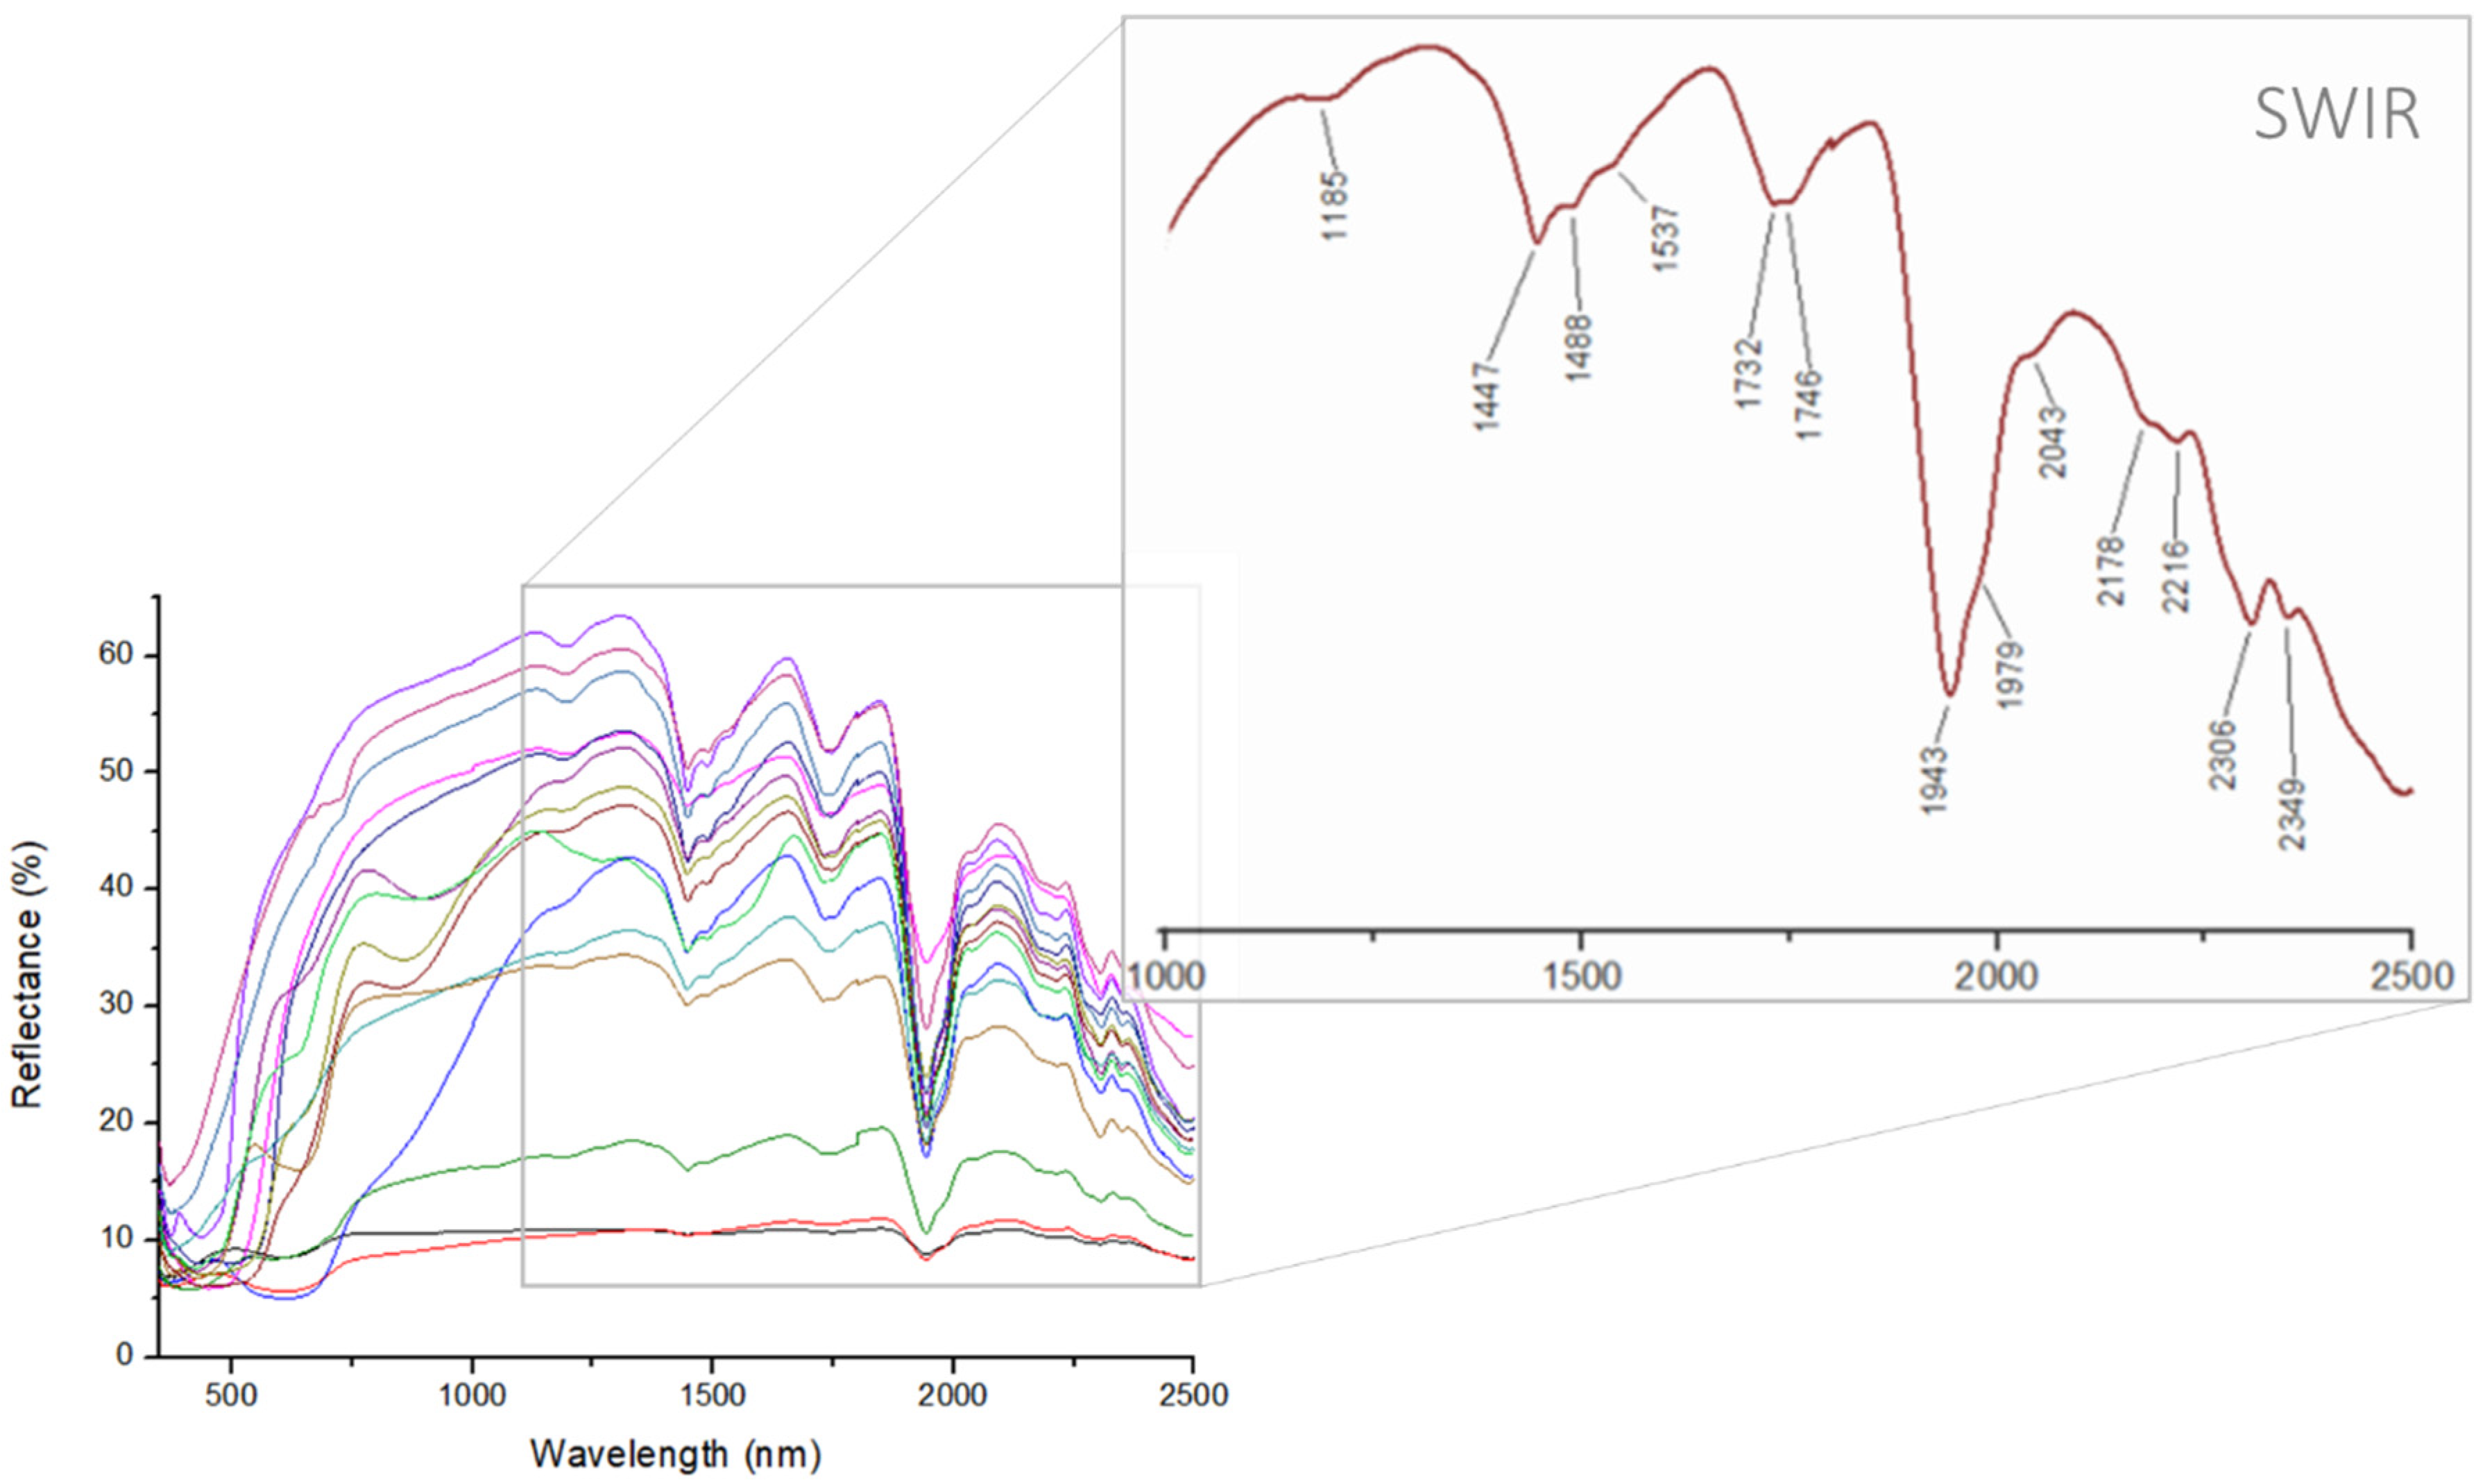
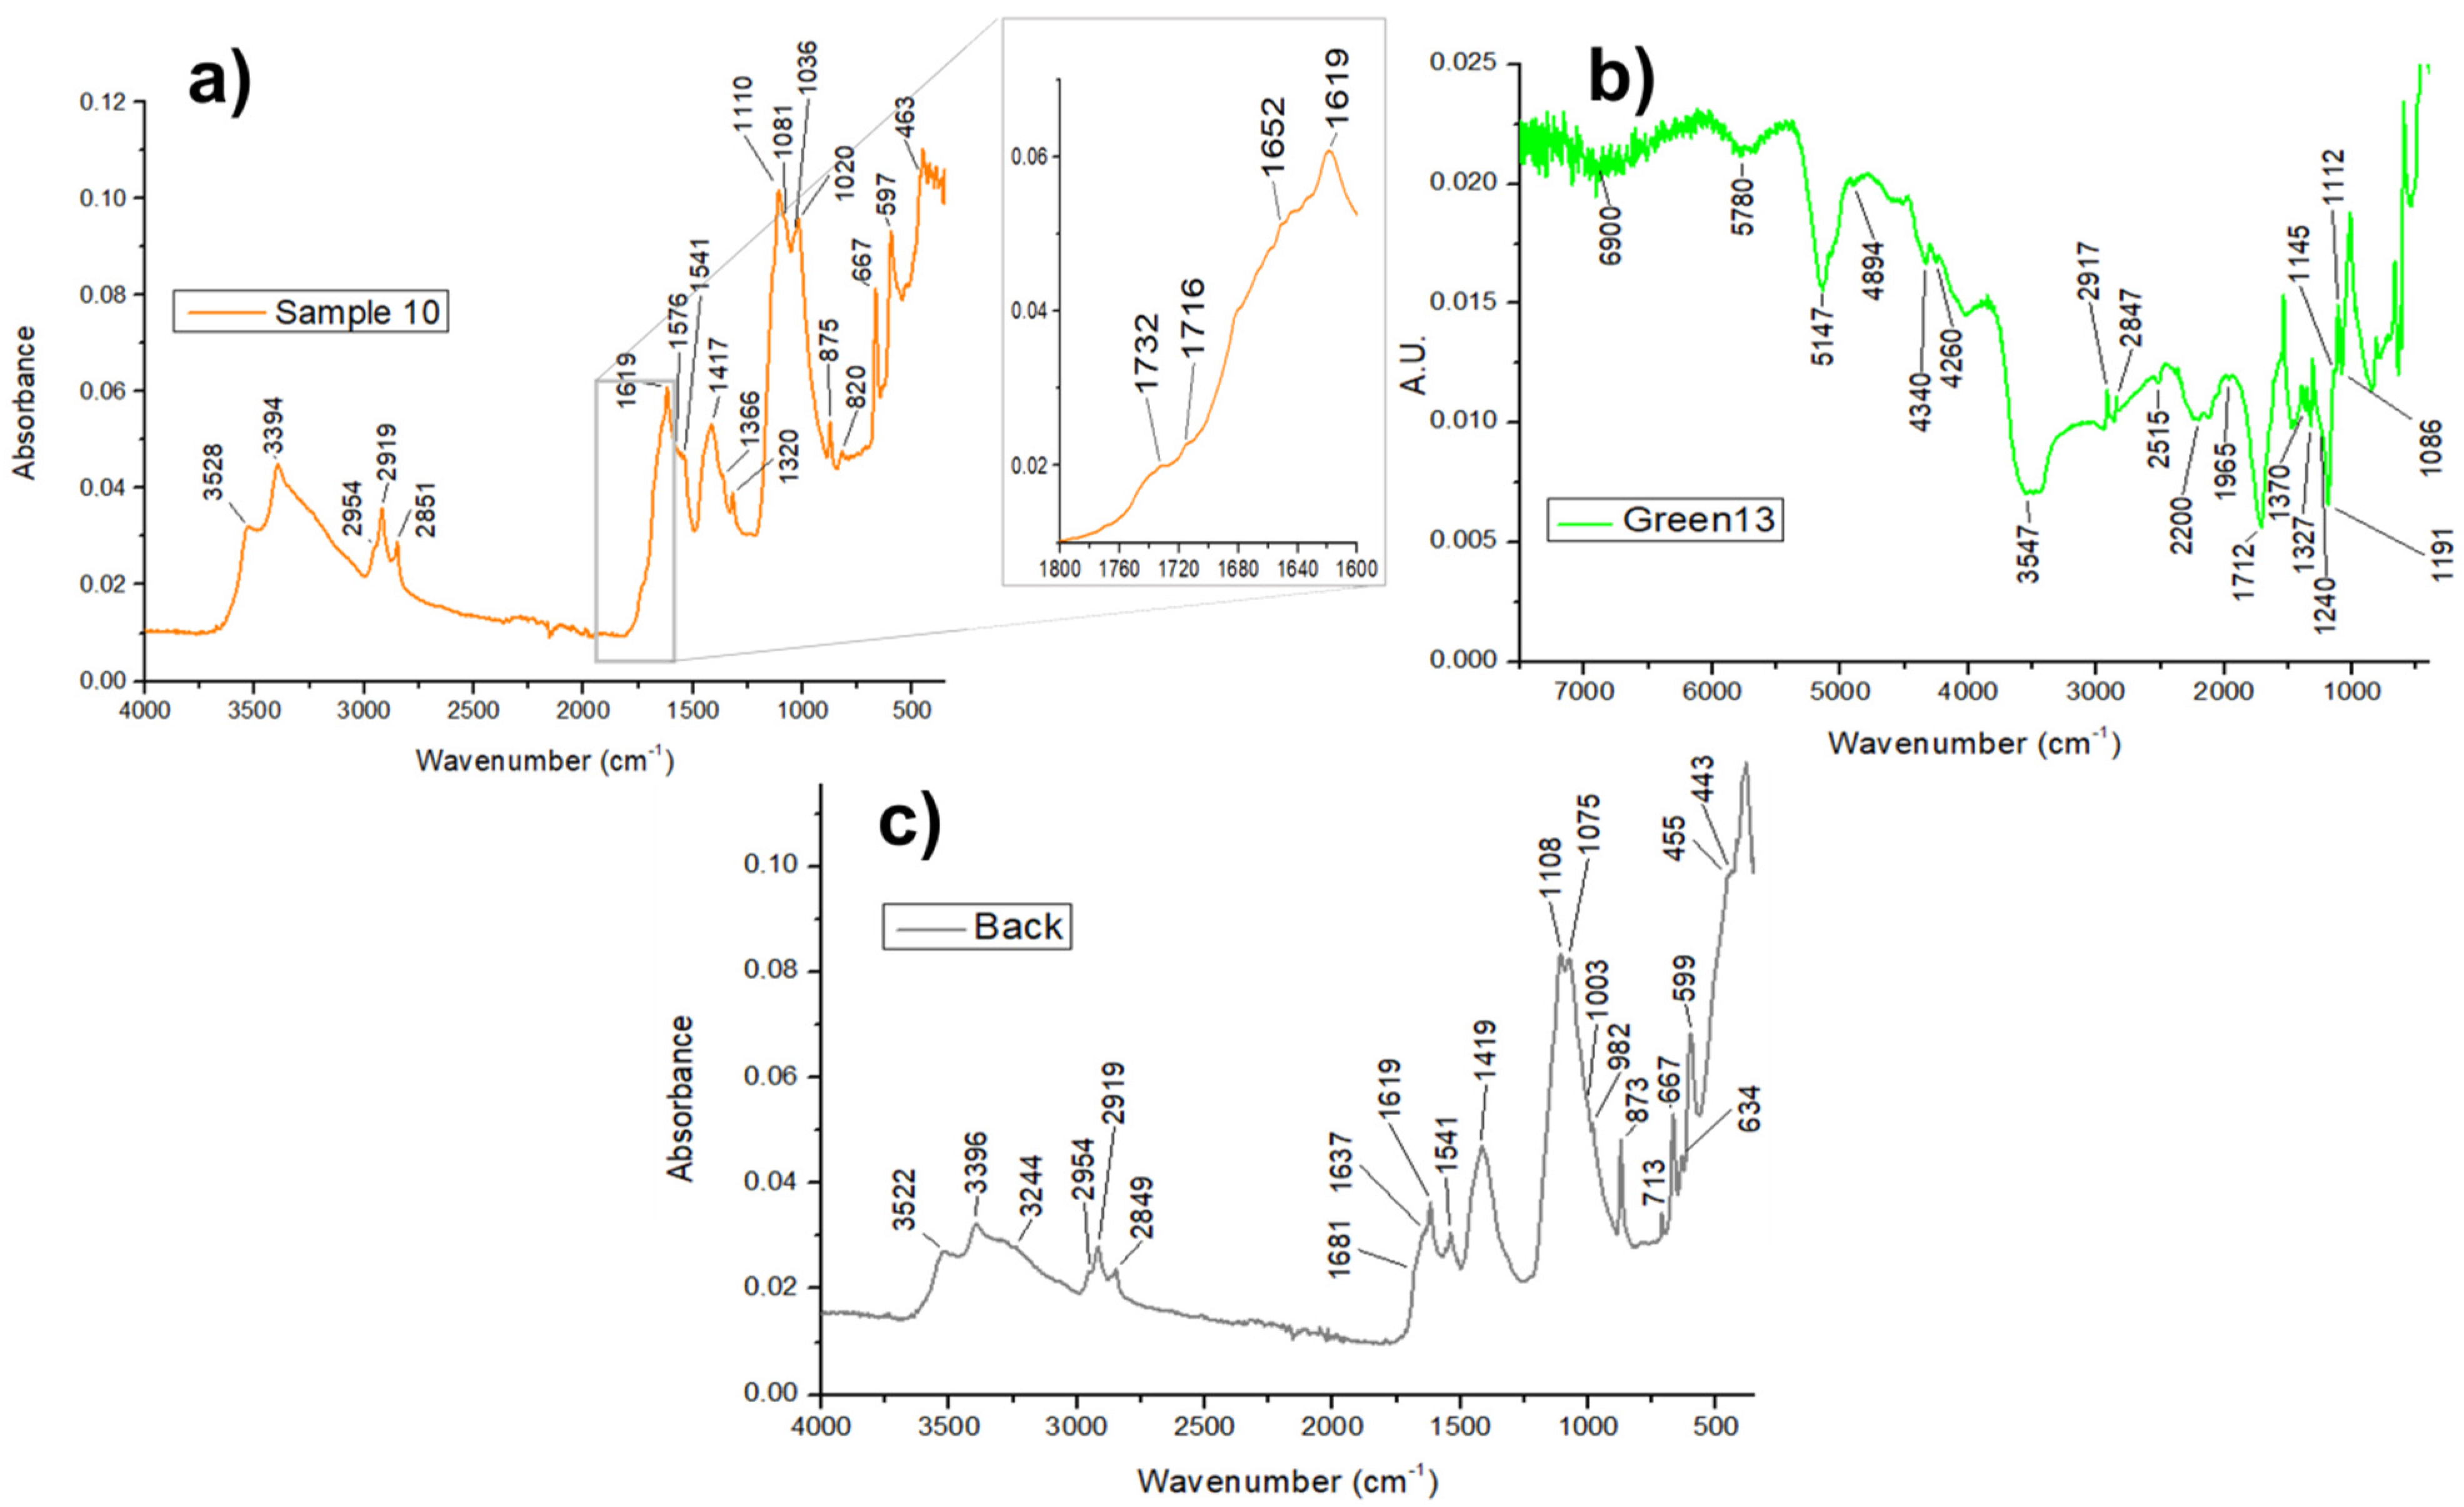
3.2.2. Paint Medium and Degradation Products
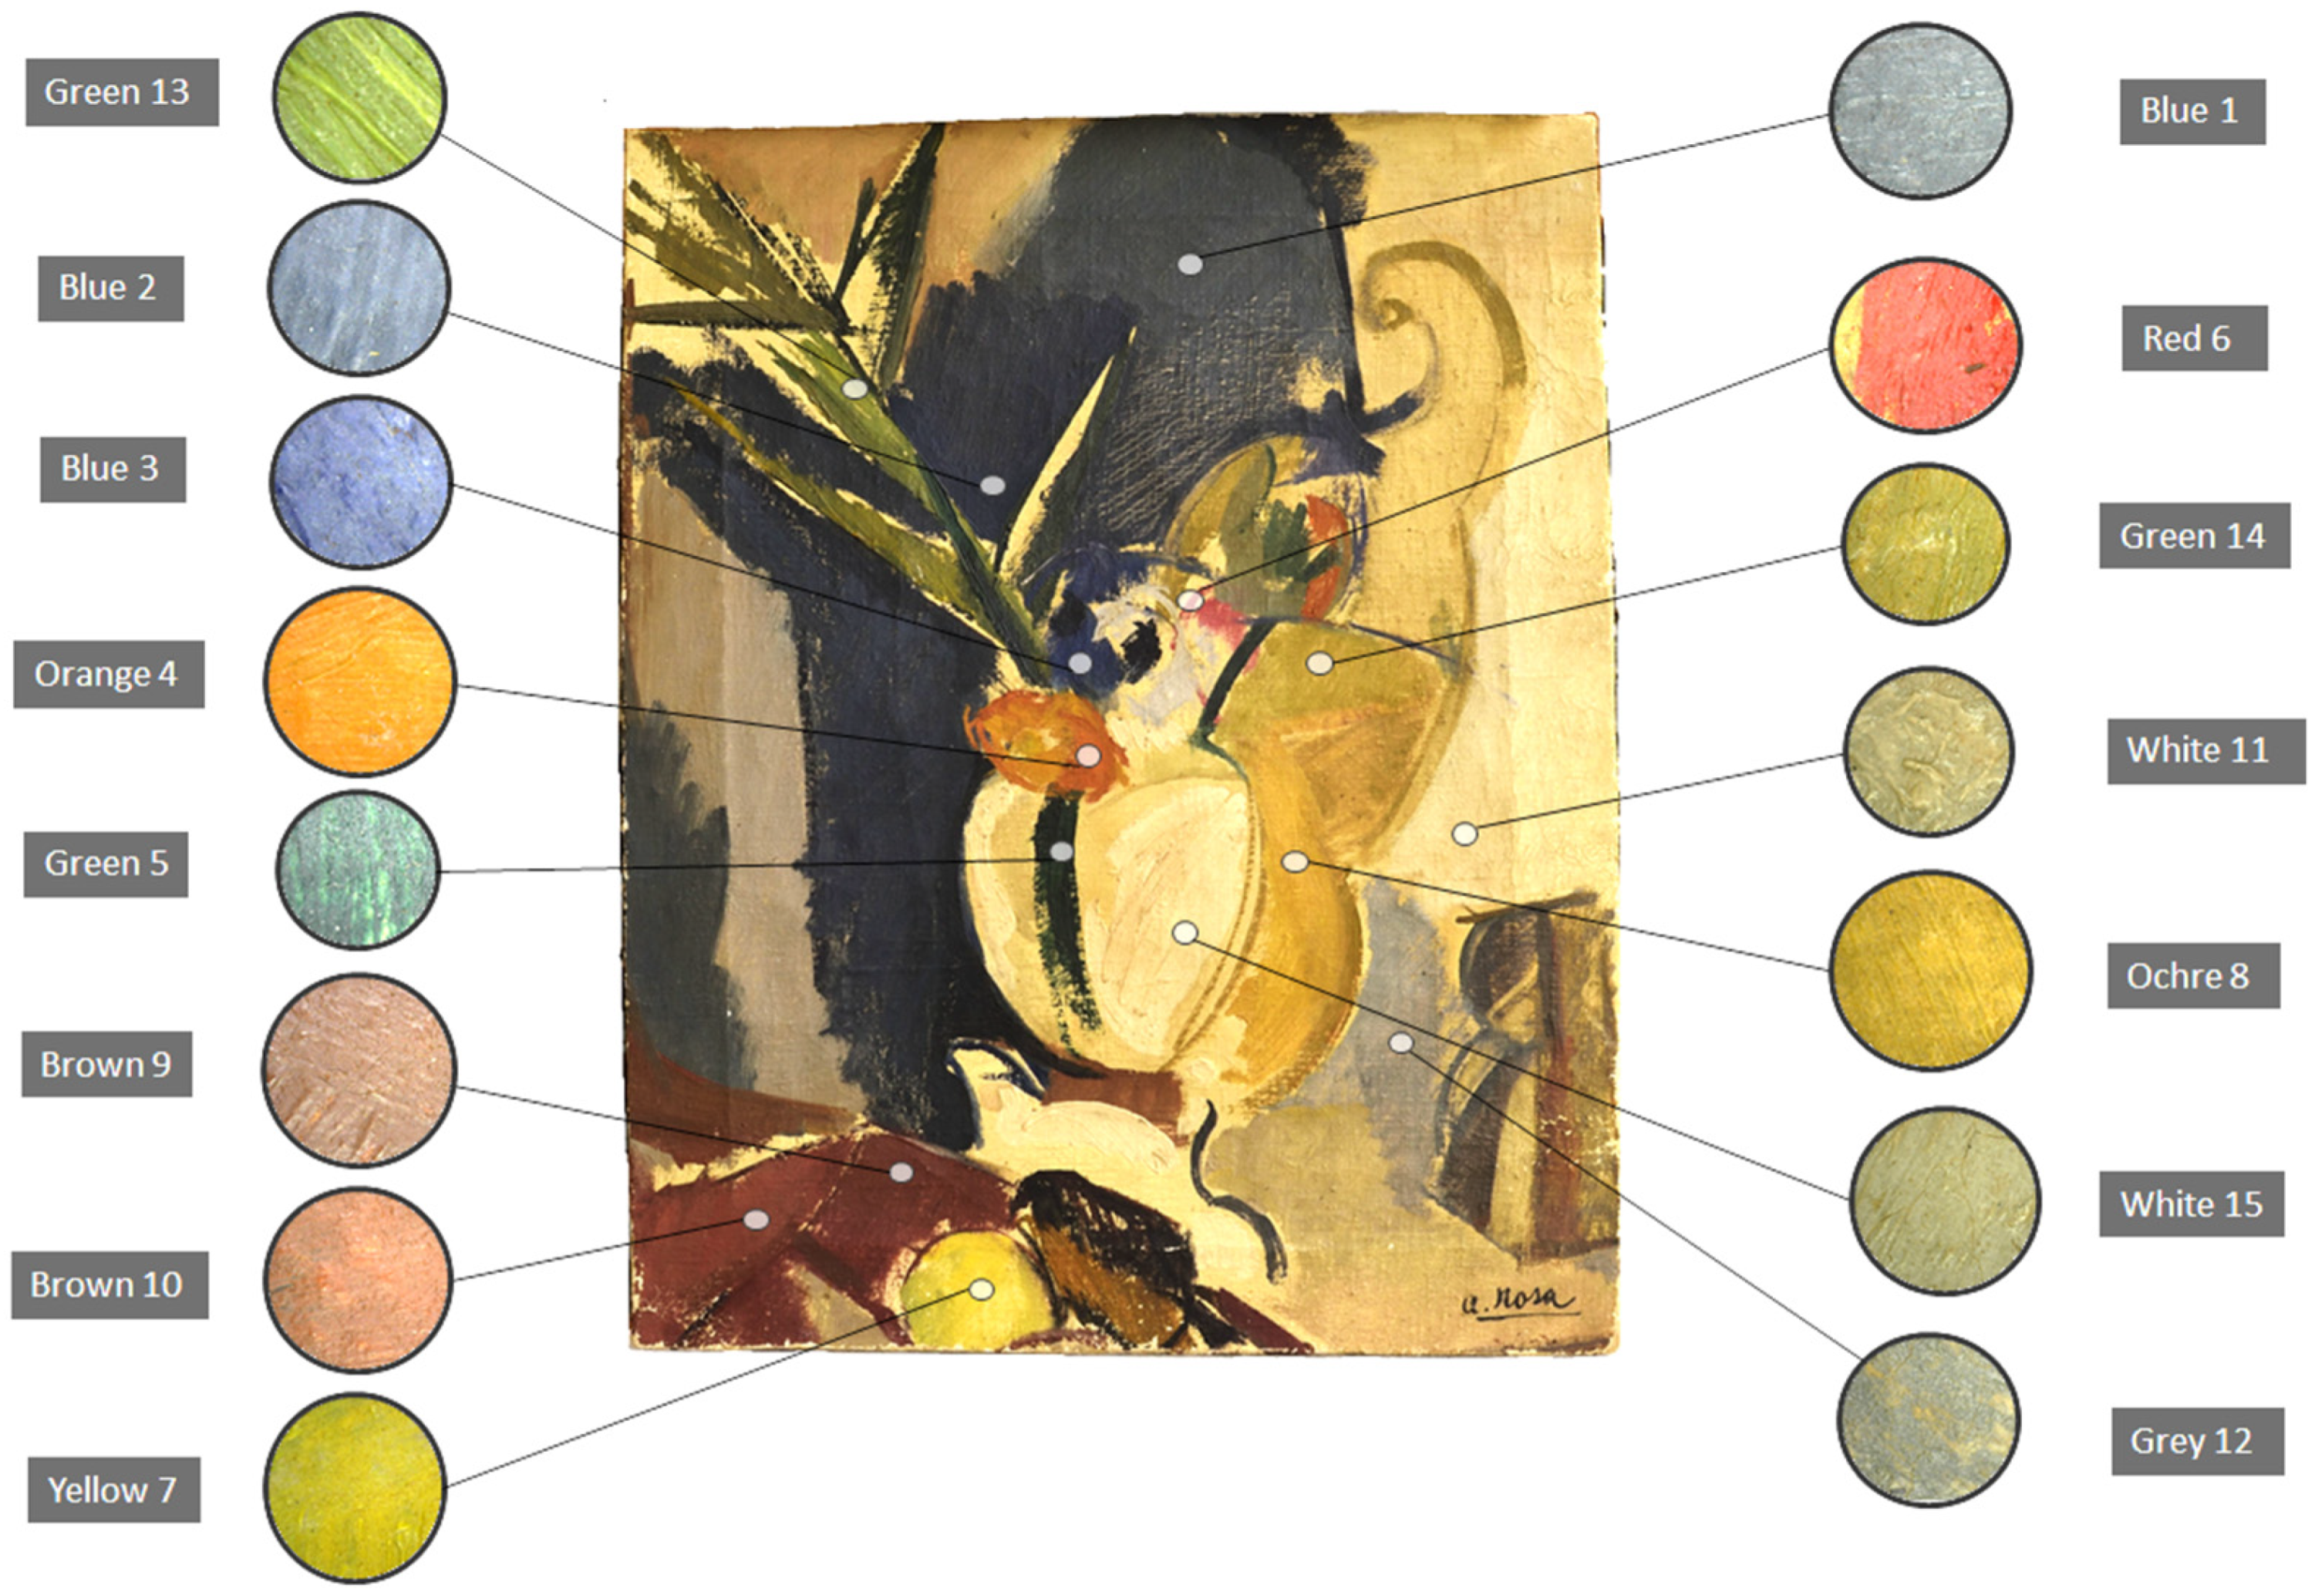
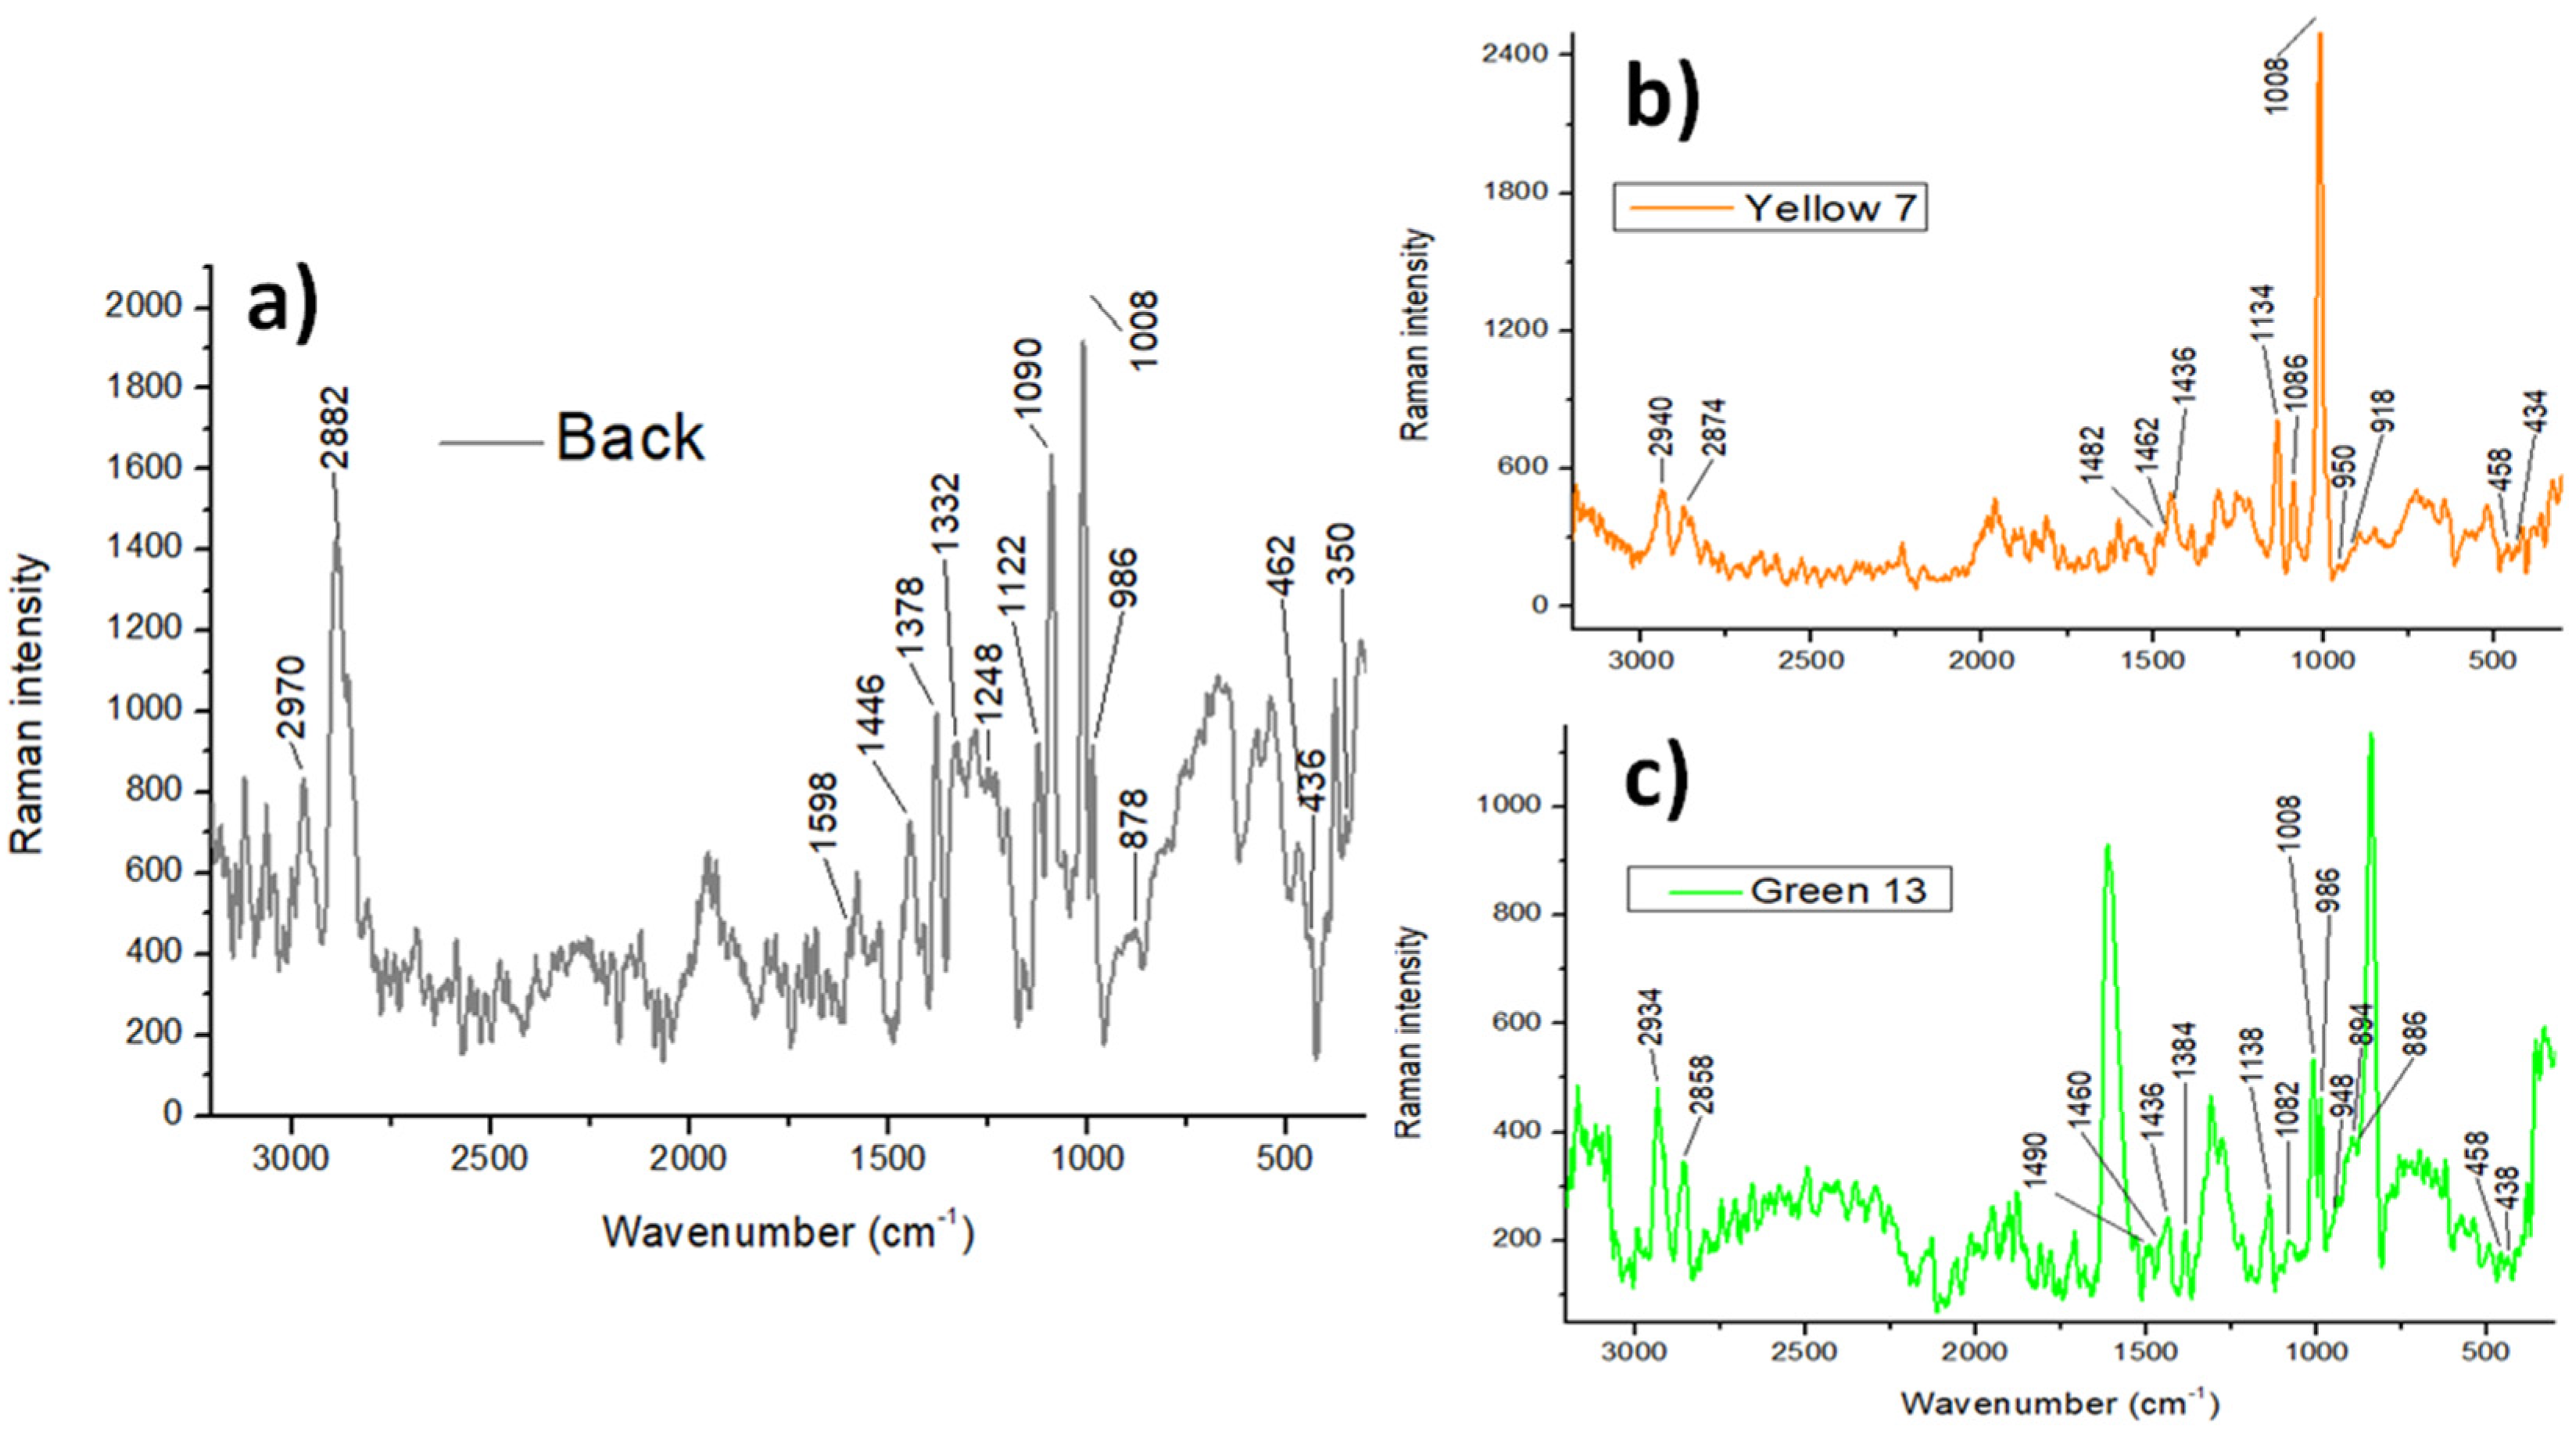
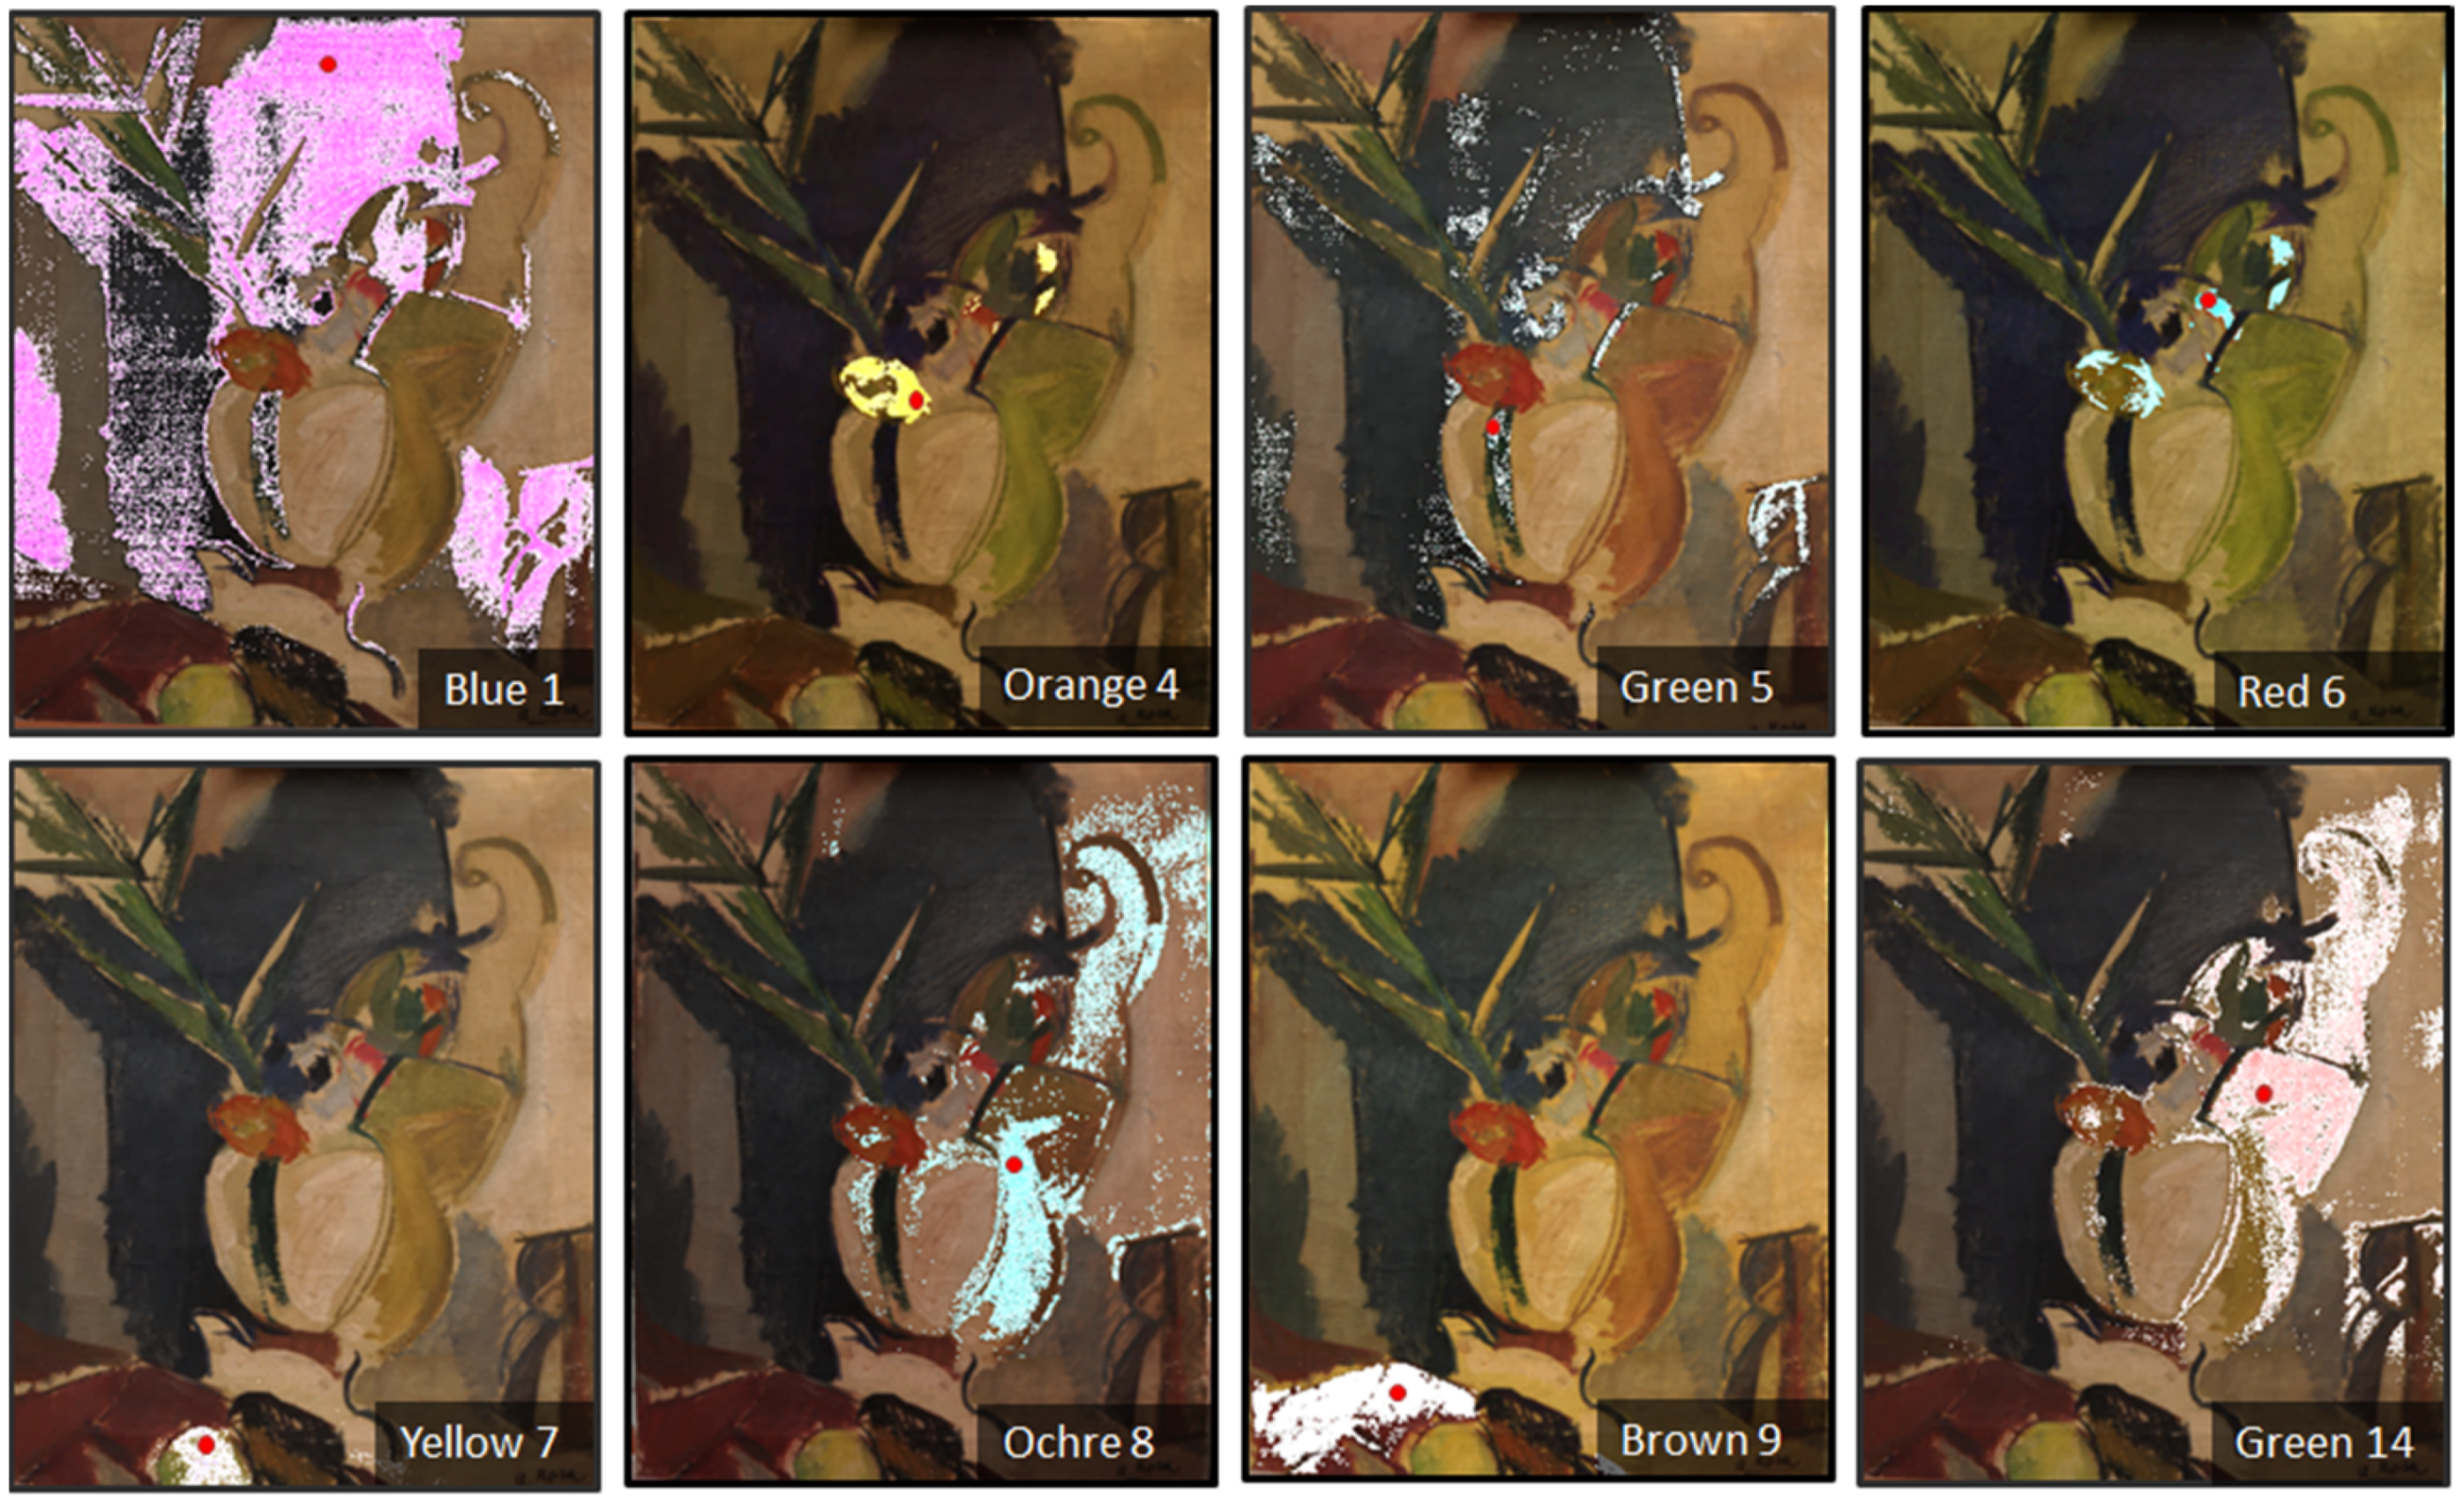
3.2.3. The Color Palette
4. Conclusions
Author Contributions
Funding
Institutional Review Board Statement
Informed Consent Statement
Data Availability Statement
Acknowledgments
Conflicts of Interest
Appendix A

Appendix B

Appendix C

| Colour | Image | Spectrum |
|---|---|---|
| Blue 1 |  |  Pi = 0.09939 |
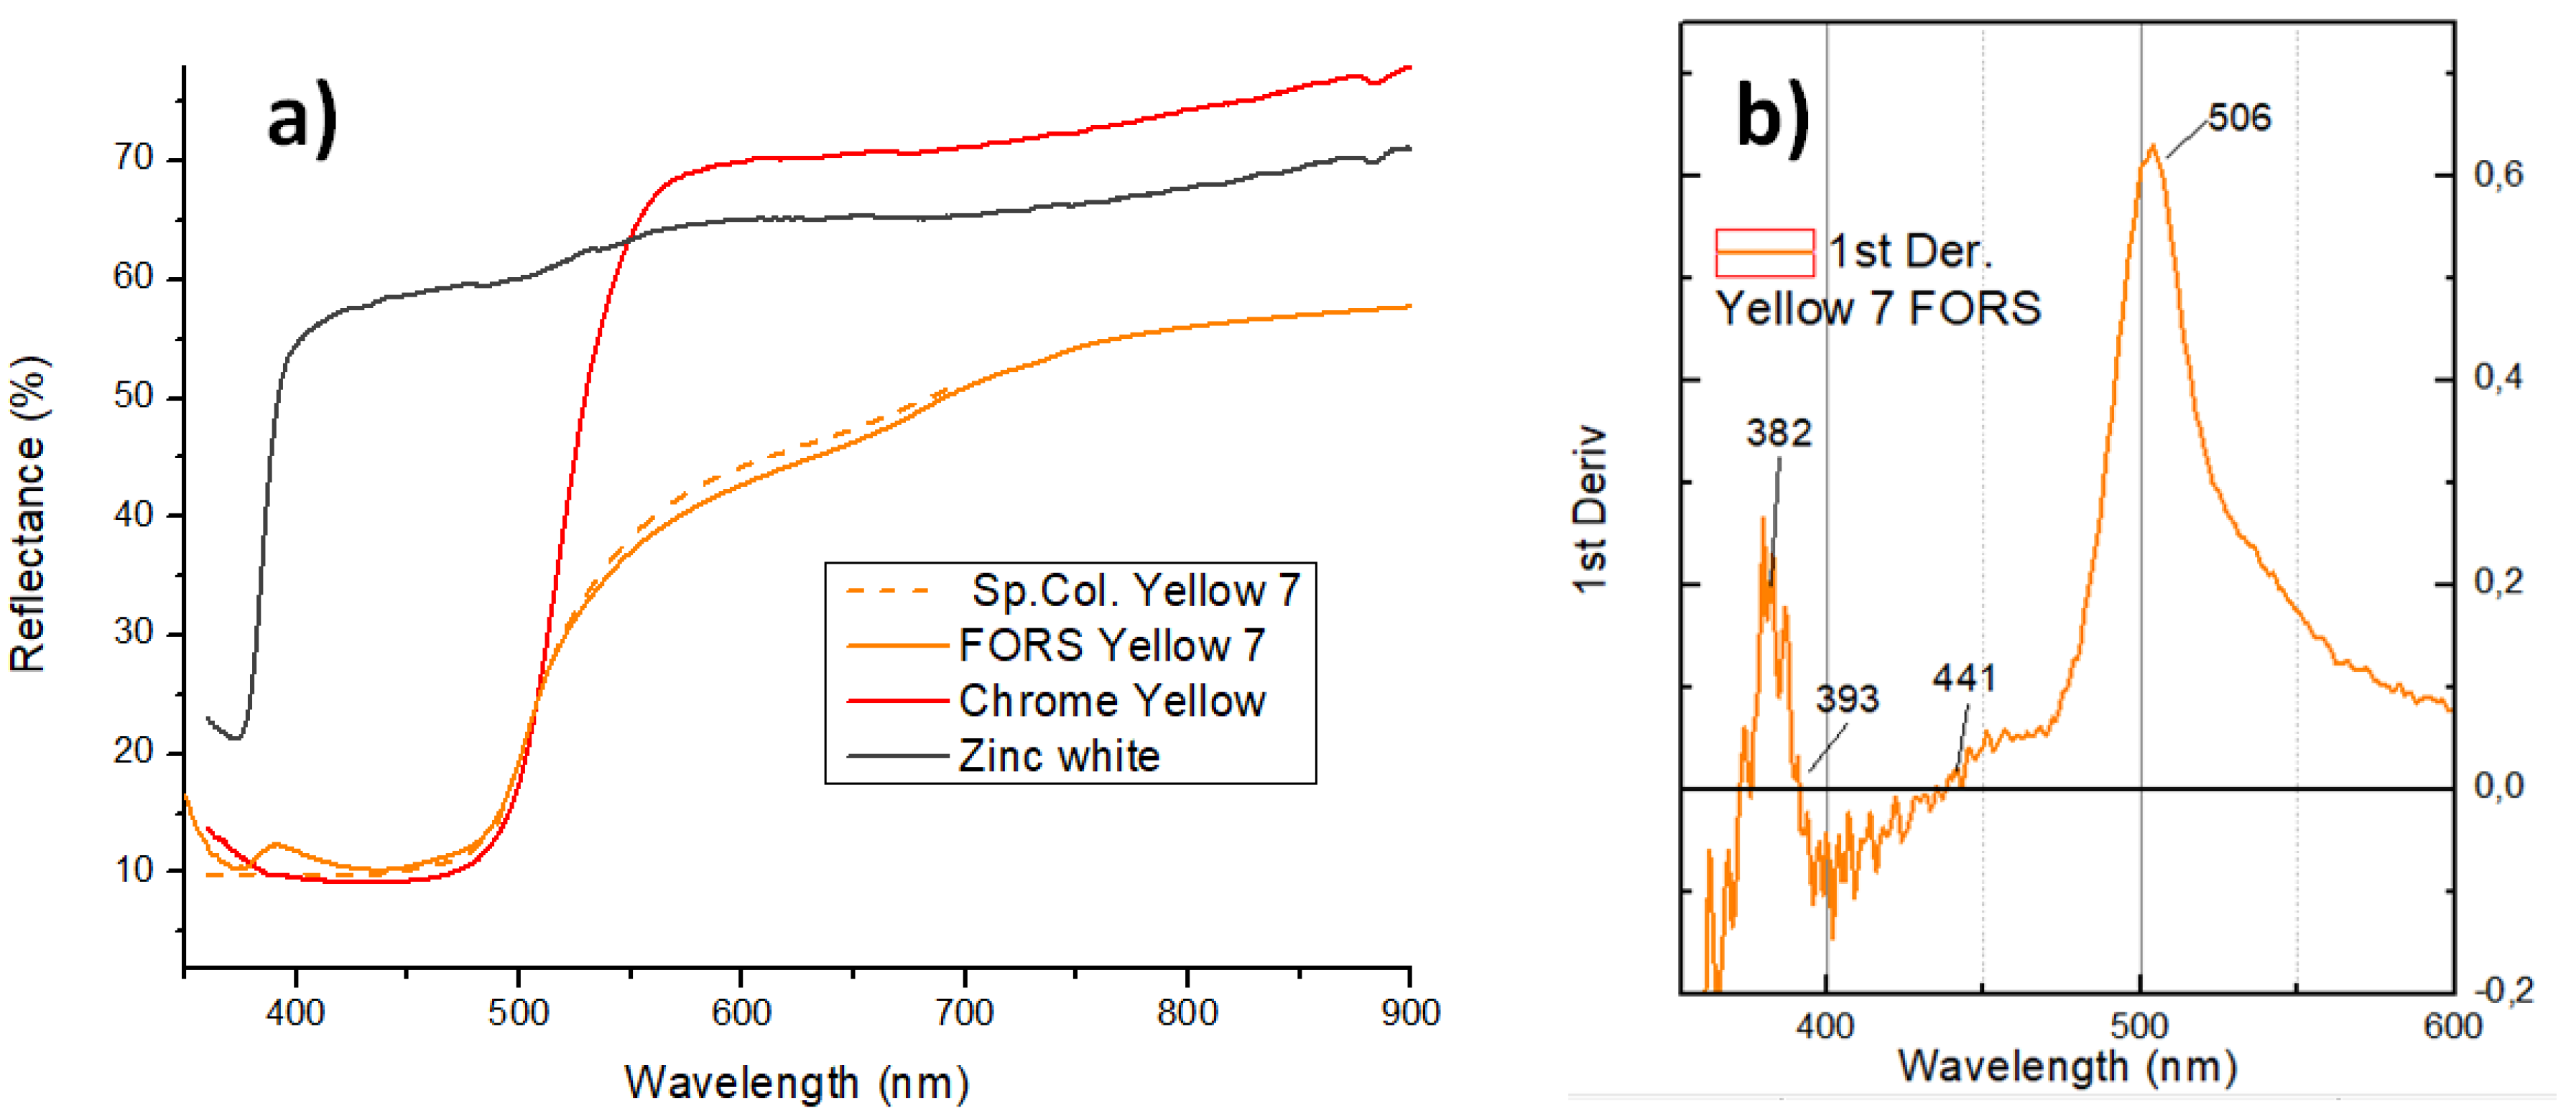
| Yellow 7 |  |  Pi = 0.9952 |
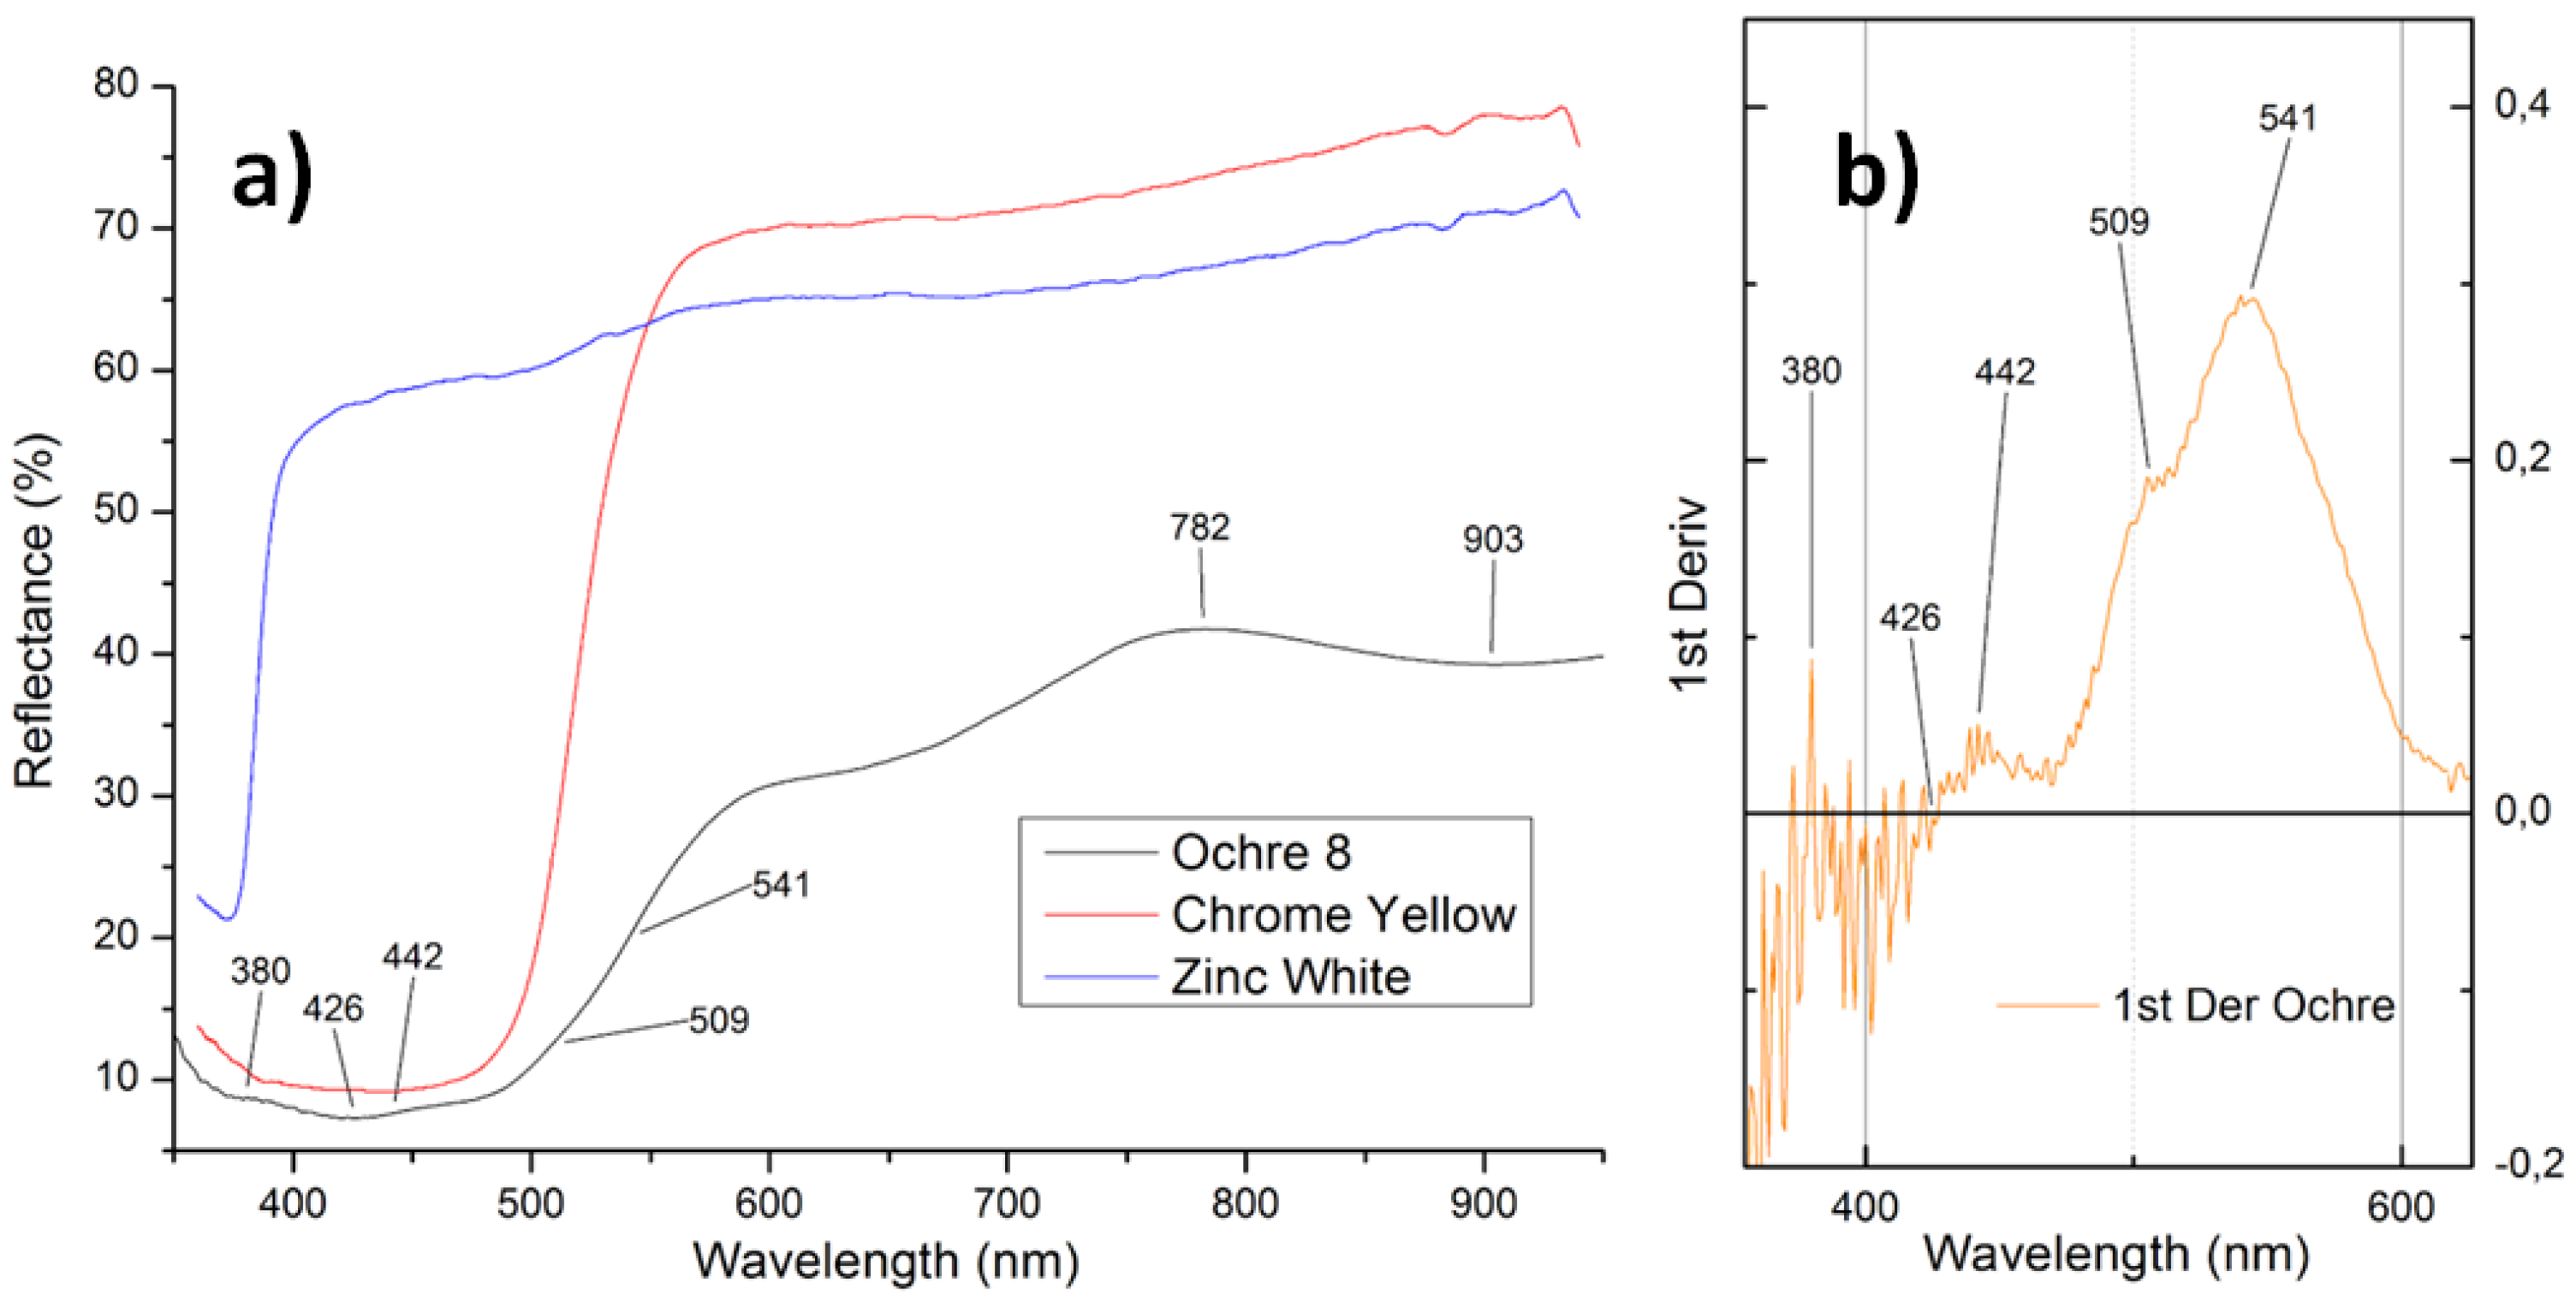
| Ochre 8 |  |  Pi = 0.9964 |
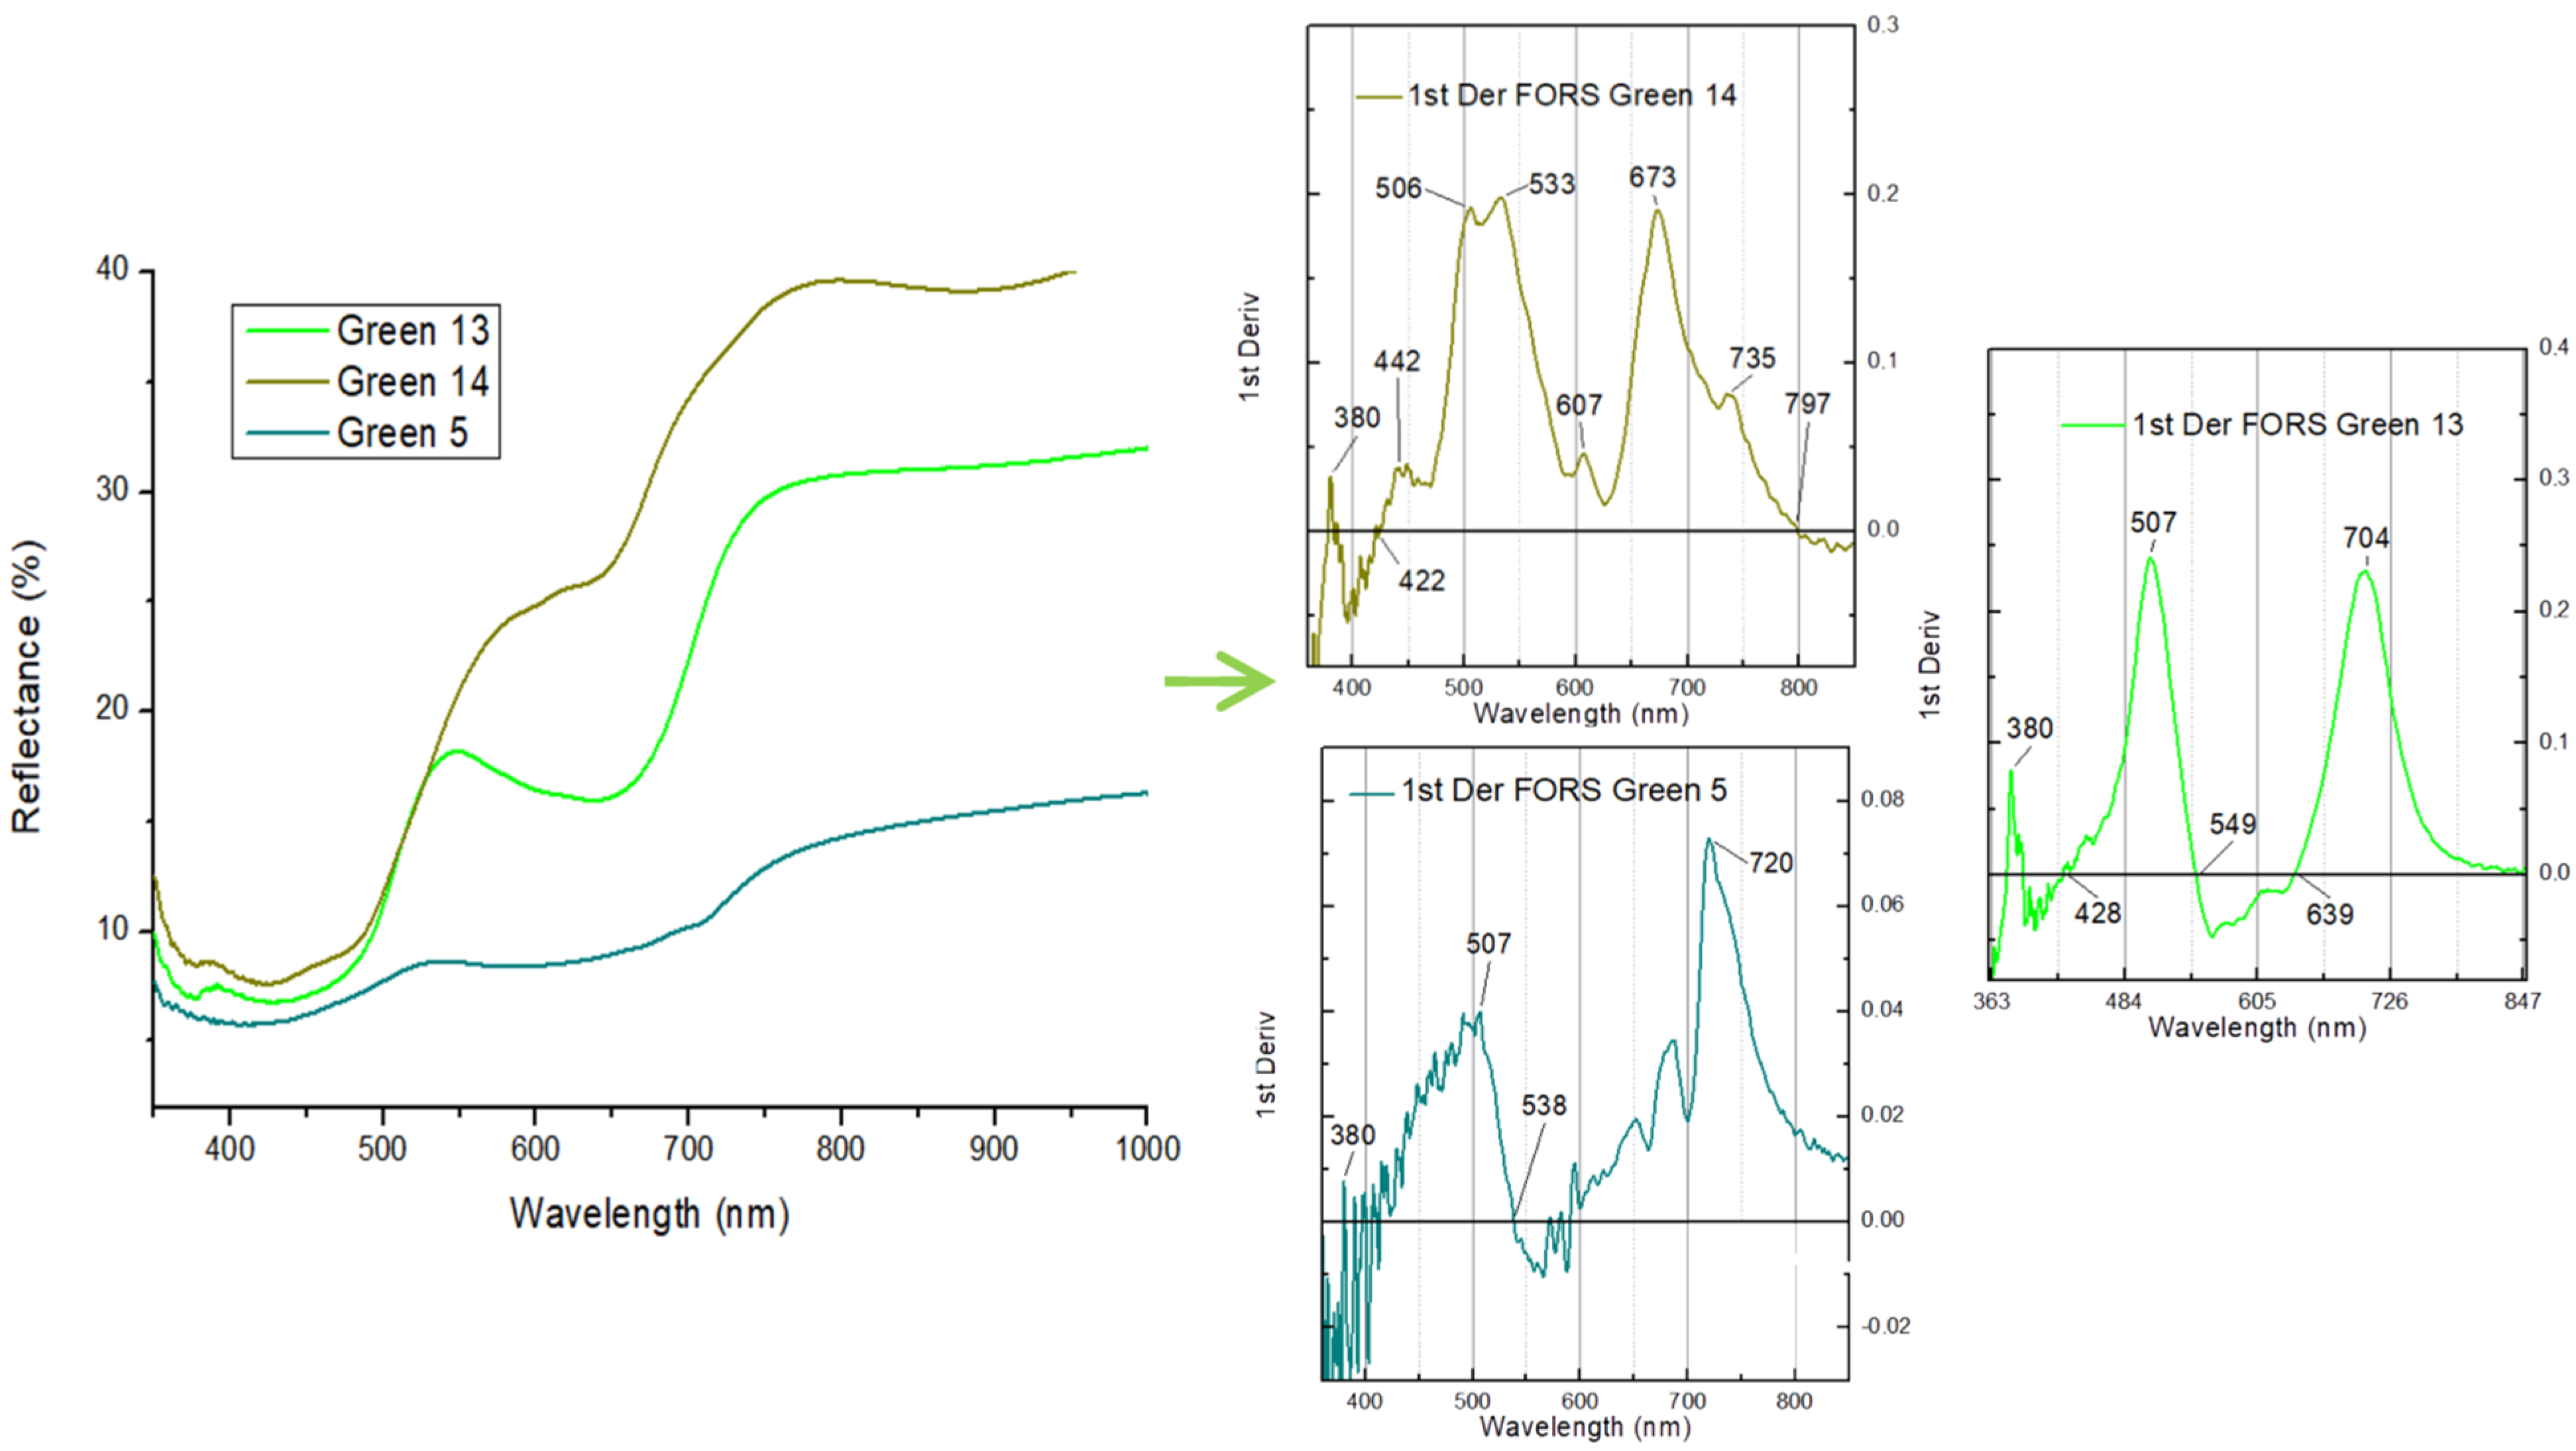
| Green 5 |  |  Pi= 0.9859 |
| Green 14 |  |  Pi = 0.9947 |
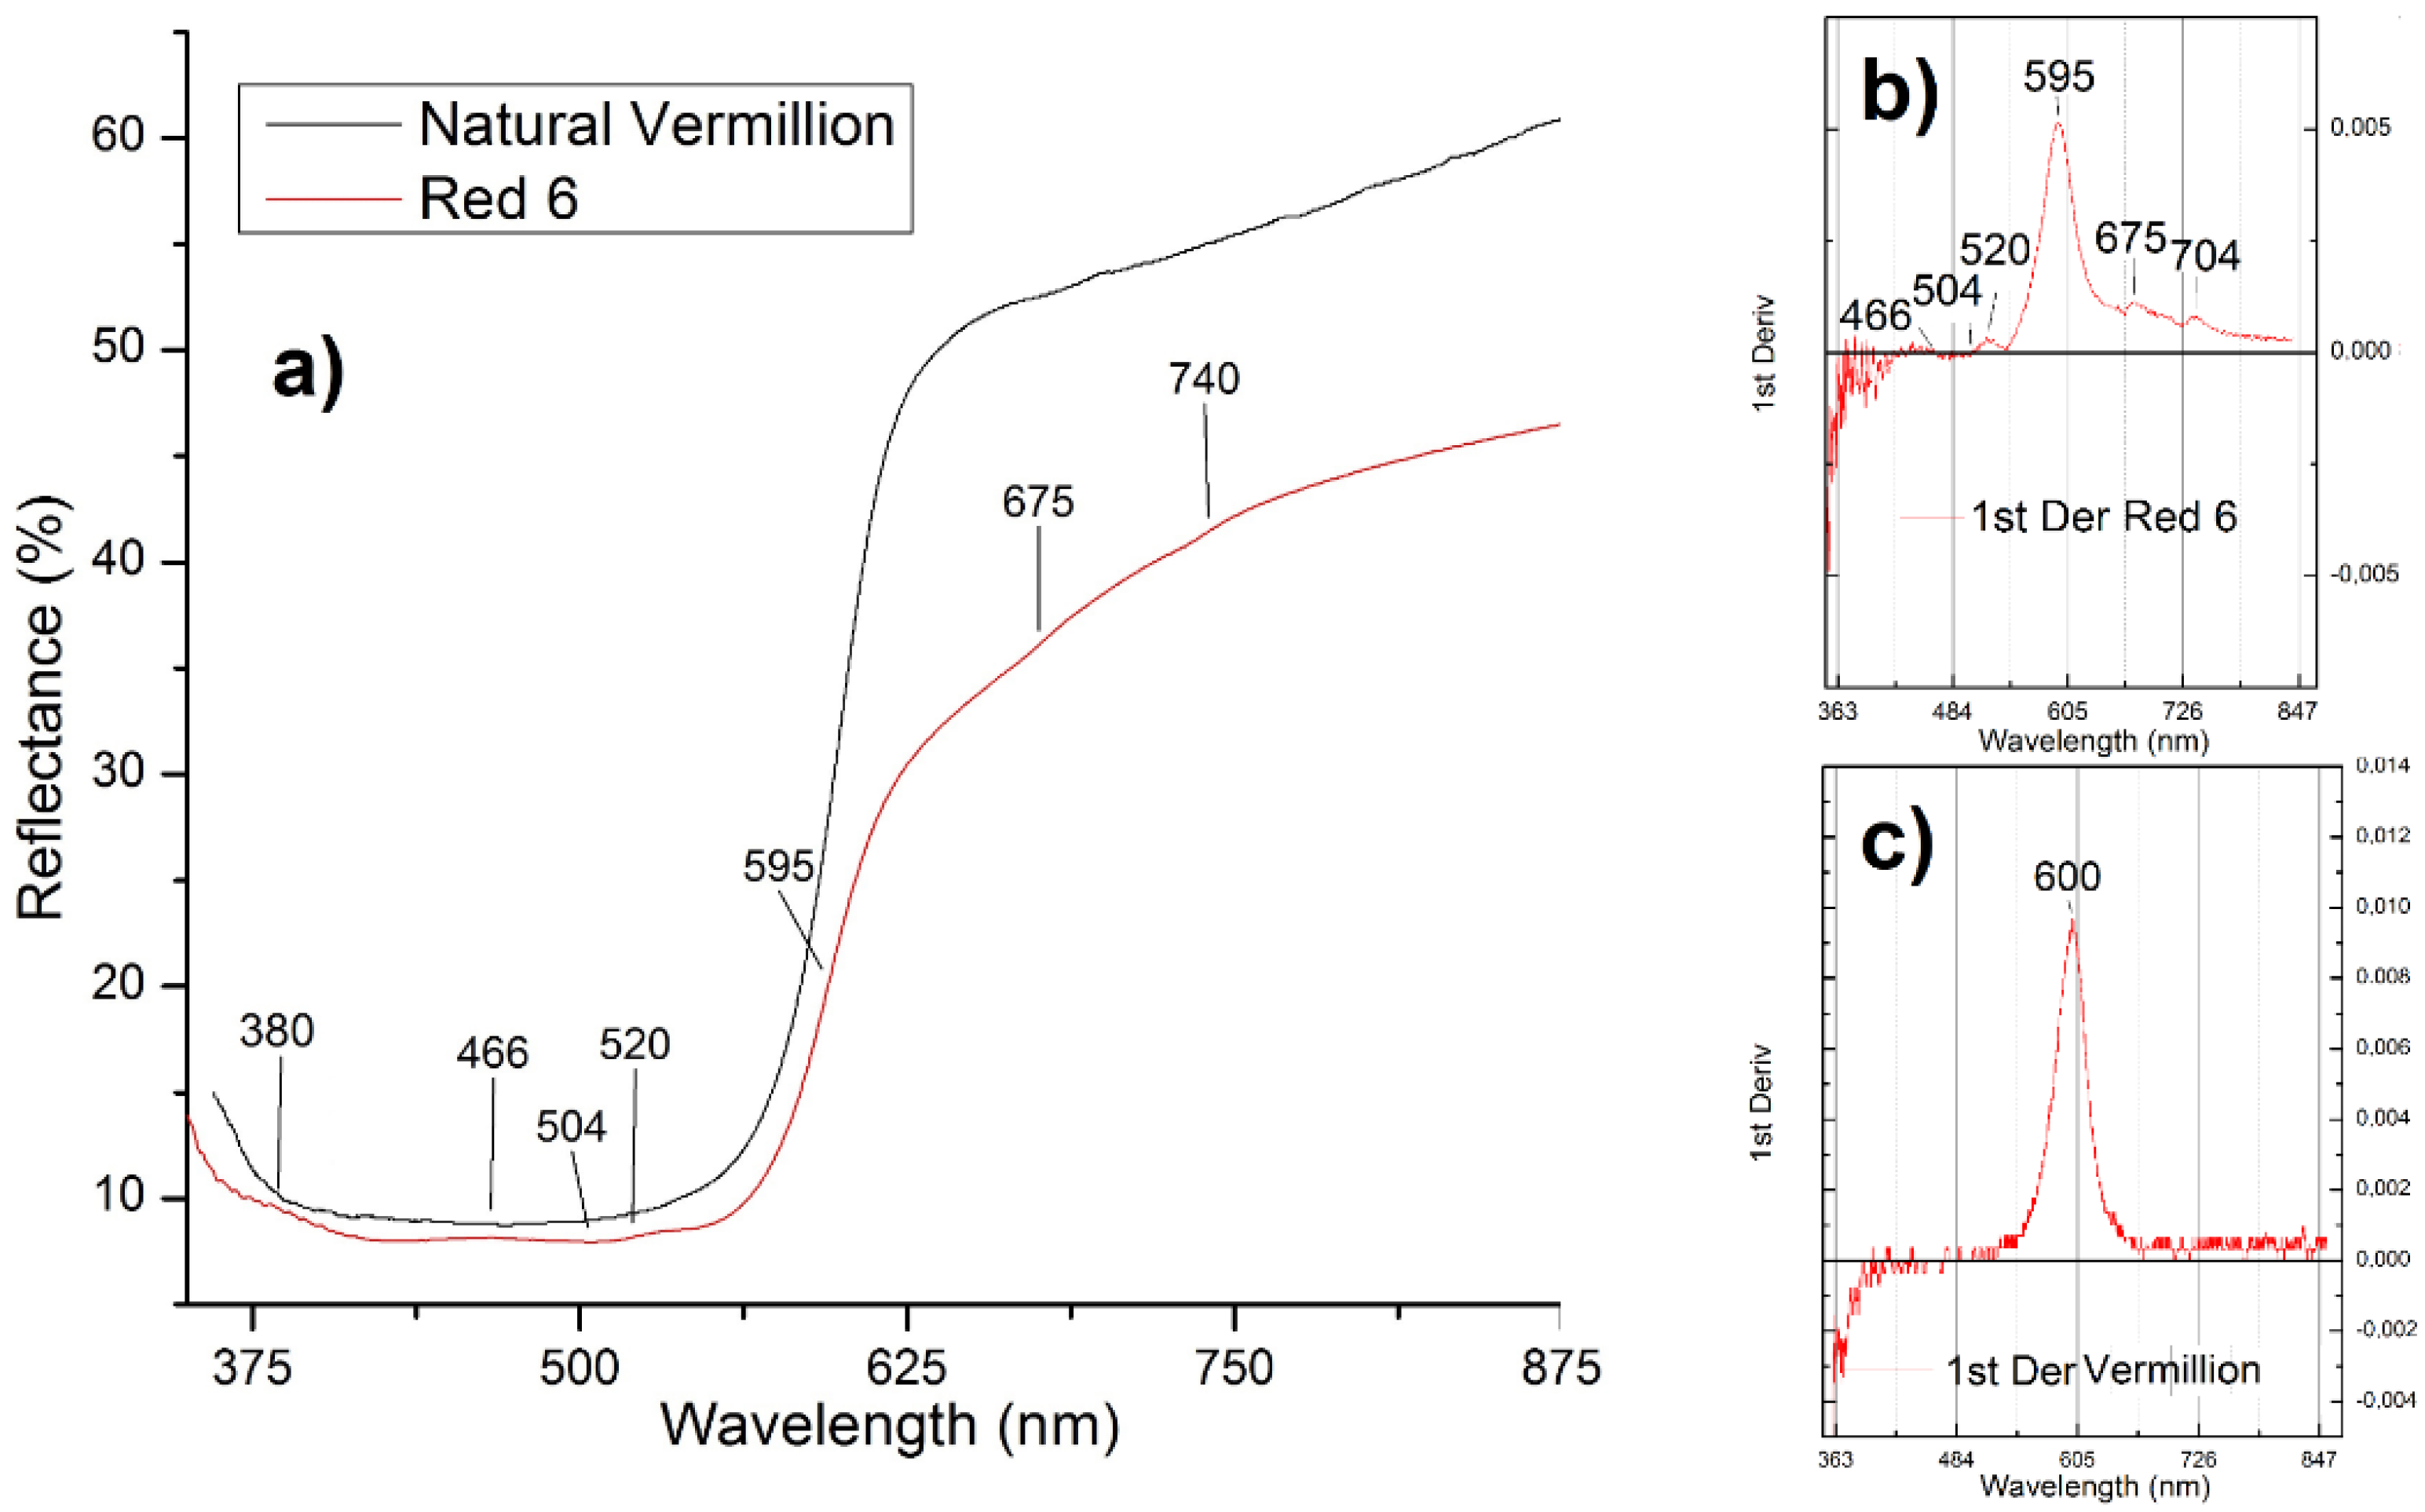
| Red 6 |  |  Pi = 0.9163 |
| Orange 4 |  |  Pi = 0.9961 |
| Brown 9 |  |  Pi = 0.9952 |
Appendix D


References
- Lutto nel Mondo Dell’arte Addio a Andreina Rosa. Available online: https://nuovavenezia.gelocal.it/venezia/cronaca/2019/07/09/news/lutto-nel-mondo-dell-arte-addio-a-andreina-rosa-1.36902949 (accessed on 6 March 2021).
- Pavanello, G.; Stringa, N.; Baradel, V. (Eds.) La Pittura Nel Veneto. Il Novecento; Electa: Milano, Italy, 2006. [Google Scholar]
- Izzo, F.C.; Ferriani, B.; den Berg, K.J.V.; Van Keulen, H.; Zendri, E. 20th Century Artists’ Oil Paints: The Case of the Olii by Lucio Fontana. J. Cult. Herit. 2014, 15, 557–563. [Google Scholar] [CrossRef]
- Giorgi, L.; Nevin, A.; Nodari, L.; Comelli, D.; Alberti, R.; Gironda, M.; Mosca, S.; Zendri, E.; Piccolo, M.; Izzo, F.C. In-Situ Technical Study of Modern Paintings Part 1: The Evolution of Artistic Materials and Painting Techniques in Ten Paintings from 1889 to 1940 by Alessandro Milesi (1856–1945). Spectrochim. Acta Part A Mol. Biomol. Spectrosc. 2019, 219, 530–538. [Google Scholar] [CrossRef]
- Fuster-López, L.; Izzo, F.C.; Piovesan, M.; Yusá-Marco, D.J.; Sperni, L.; Zendri, E. Study of the Chemical Composition and the Mechanical Behaviour of 20th Century Commercial Artists’ Oil Paints Containing Manganese-Based Pigments. Microchem. J. 2016, 124, 962–973. [Google Scholar] [CrossRef] [Green Version]
- Carlesi, S.; Bartolozzi, G.; Cucci, C.; Marchiafava, V.; Picollo, M. The Artists’ Materials of Fernando Melani: A Precursor of the Poor Art Artistic Movement in Italy. Spectrochim. Acta Part A Mol. Biomol. Spectrosc. 2013, 104, 527–537. [Google Scholar] [CrossRef] [PubMed]
- Muir, K.; Gautier, G.; Casadio, F.; Vila, A. Interdisciplinary Investigation of Early House Paints: Picasso, Picabia and Their “Ripolin” Paintings. In ICOM Committee for Conservation Preprints; Bridgeland, J., Ed.; Critério-Artes Gráficas, Lda: Lisbon, Portugal, 2011; p. 23. [Google Scholar]
- Muir, K.; Langley, A.; Bezur, A.; Casadio, F.; Delaney, J.; Gautier, G. Scientifically Investigating Picasso’s Suspected Use of Ripolin House Paints in Still Life, 1922 and The Red Armchair, 1931. J. Am. Inst. Conserv. 2013, 52, 156–172. [Google Scholar] [CrossRef]
- Izzo, F.C.; van den Berg, K.J.; van Keulen, H.; Ferriani, B.; Zendri, E. Modern Oil Paints—Formulations, Organic Additives and Degradation: Some Case Studies. In Issues in Contemporary Oil Paint; van den Berg, K.J., Burnstock, A., de Keijzer, M., Krueger, J., Learner, T., de Tagle, A., Heydenreich, G., Eds.; Springer International Publishing: Cham, Switzerland, 2014; pp. 75–104. [Google Scholar] [CrossRef]
- Erhardt, D.; Tumosa, C.S.; Mecklenburg, M.F. Long-Term Chemical and Physical Processes in Oil Paint Films. Stud. Conserv. 2005, 50, 143–150. [Google Scholar] [CrossRef]
- Bayliss, S.; van den Berg, K.J.; Burnstock, A.; de Groot, S.; van Keulen, H.; Sawicka, A. An Investigation into the Separation and Migration of Oil in Paintings by Erik Oldenhof. Microchem. J. 2016, 124, 974–982. [Google Scholar] [CrossRef]
- Burnstock, A.; van den Berg, K.J.; de Groot, S.; Wijnberg, L. An Investigation of Water-Sensitive Oil Paints in 20th Century Paintings. In Modern Paints Uncovered: Proceedings from the Modern Paints Uncovered Symposium, Getty Conservation Institute, London; Learner, T., Smithen, J.W., Schilling, M.R., Eds.; Getty Conservation Institute: Los Angeles, CA, USA, 2006; pp. 177–188. [Google Scholar]
- Cooper, A.; Burnstock, A.; van den Berg, K.J.; Ormsby, B. Water Sensitive Oil Paints in the Twentieth Century: A Study of the Distribution of Water-Soluble Degradation Products in Modern Oil Paint Films. In Issues in Contemporary Oil Paint; van den Berg, K.J., Burnstock, A., de Keijzer, M., Krueger, J., Learner, T., de Tagle, A., Heydenreich, G., Eds.; Springer International Publishing: Cham, Switzerland, 2014; pp. 295–310. [Google Scholar] [CrossRef]
- Silvester, G.; Burnstock, A.; Megens, L.; Learner, T.; Chiari, G.; van den Berg, K.J. A Cause of Water-Sensitivity in Modern Oil Paint Films: The Formation of Magnesium Sulphate. Stud. Conserv. 2014, 59, 38–51. [Google Scholar] [CrossRef]
- IFAC. Fiber Optics Reflectance Spectra (FORS) of Pictorial Materials in the 270–1700 nm Range. Available online: https://spectradb.ifac.cnr.it/fors/ (accessed on 20 April 2021).
- U.S. Geological Survey. USGS Science for a Changing World. Available online: https://www.usgs.gov/labs/spec-lab (accessed on 21 April 2021).
- Bacci, M.; Baronti, S.; Casini, A.; Lotti, F.; Picollo, M.; Casazza, O. Non-Destructive Spectroscopic Investigations on Paintings Using Optical Fibers. MRS Proc. 1992, 267, 265. [Google Scholar] [CrossRef]
- Bacci, M.; Bellucci, R.; Cucci, C.; Frosinini, C.; Picollo, M.; Porcinai, S.; Radicati, B. Fiber Optics Reflectance Spectroscopy in the Entire VIS-IR Range: A Powerful Tool for the Non-Invasive Characterization of Paintings. MRS Proc. 2004, 852, OO2.4. [Google Scholar] [CrossRef]
- Bacci, M.; Picollo, M.; Trumpy, G.; Tsukada, M.; Kunzelman, D. Non-Invasive Identification of White Pigments on 20Th-Century Oil Paintings by Using Fiber Optic Reflectance Spectroscopy. J. Am. Inst. Conserv. 2007, 46, 27–37. [Google Scholar] [CrossRef]
- Fuster-López, L.; Izzo, F.C.; Damato, V.; Yusà-Marco, D.J.; Zendri, E. An Insight into the Mechanical Properties of Selected Commercial Oil and Alkyd Paint Films Containing Cobalt Blue. J. Cult. Herit. 2019, 35, 225–234. [Google Scholar] [CrossRef]
- Caravá, S.; Roldán García, C.; Vázquez de Agredos-Pascual, M.L.; Murcia Mascarós, S.; Izzo, F.C. Investigation of Modern Oil Paints through a Physico-Chemical Integrated Approach. Emblematic Cases from Valencia, Spain. Spectrochim. Acta Part A Mol. Biomol. Spectrosc. 2020, 240, 118633. [Google Scholar] [CrossRef] [PubMed]
- Källbom, A.; Nevin, A.; Izzo, F.C. Multianalytical Assessment of Armour Paints—The Ageing Characteristics of Historic Drying Oil Varnish Paints for Protection of Steel and Iron Surfaces in Sweden. Heritage 2021, 4, 1141–1164. [Google Scholar] [CrossRef]
- Izzo, F.C.; Källbom, A.; Nevin, A. Multi-Analytical Assessment of Bodied Drying Oil Varnishes and Their Use as Binders in Armour Paints. Heritage 2021, 4, 3402–3420. [Google Scholar] [CrossRef]
- Berg, J. Analytical Chemical Studies on Traditional Linseed Oil Paints; Molart Series; Netherlands Organization for Scientific Research: The Hague, The Netherlands, 2002. [Google Scholar]
- Mills, J.S.; White, R. The Organic Chemistry of Museum Objects, 2nd ed.; First Issued in Hardback; Butterworth-Heinemann Series in Conservation and Museology; Routledge: London, UK; New York, NY, USA, 2015. [Google Scholar]
- Colombini, M.P.; Modugno, F. (Eds.) Organic Mass Spectrometry in Art and Archaeology; Wiley: Chichester, UK, 2009. [Google Scholar]
- Schilling, M.; Khanjian, H.; Carson, D.M. Fatty Acid and Glycerol Content of Lipids; Effects of Ageing and Solvent Extraction on the Composition of Oil Paints; Laboratoire de Recherche des Musées de France: Paris, France, 1997. [Google Scholar]
- Asquier, M.; Colomban, P. Raman and Infrared Analysis of Glues Used for Pottery Conservation Treatments. J. Raman Spectrosc. 2009, 40, 1641–1644. [Google Scholar] [CrossRef]
- Gorassini, A.; Adami, G.; Calvini, P.; Giacomello, A. ATR-FTIR Characterization of Old Pressure Sensitive Adhesive Tapes in Historic Papers. J. Cult. Herit. 2016, 21, 775–785. [Google Scholar] [CrossRef]
- Vila, A.; Murray, A.; Andersen, C.K.; Izzo, F.C.; Fuster-López, L.; Aguado-Guardiola, E.; Jiménez-Garnica, R.; Scharff, A. Picasso 1917: An Insight into the Effects of Ground and Canvas in the Failure Mechanisms in Four Artworks. In Conservation of Modern Oil Paintings; van den Berg, K.J., Bonaduce, I., Burnstock, A., Ormsby, B., Scharff, M., Carlyle, L., Heydenreich, G., Keune, K., Eds.; Springer International Publishing: Cham, Switzerland, 2019; pp. 245–253. [Google Scholar] [CrossRef]
- Fuster-López, L.; Izzo, F.C.; Andersen, C.K.; Murray, A.; Vila, A.; Picollo, M.; Stefani, L.; Jiménez, R.; Aguado-Guardiola, E. Picasso’s 1917 Paint Materials and Their Influence on the Condition of Four Paintings. SN Appl. Sci. 2020, 2, 2159. [Google Scholar] [CrossRef]
- Beninatto, R.; De Lucchi, O. Chimica Organica per Artisti e Restauratori: Sostanze Naturali; Createspace: Scotts Valley, CA, USA, 2016. [Google Scholar]
- Dochia, M.; Sirghie, C.; Kozłowski, R.M.; Roskwitalski, Z. Cotton Fibres. In Handbook of Natural Fibres; Elsevier: Amsterdam, The Netherlands, 2012; pp. 11–23. [Google Scholar] [CrossRef]
- Bratasz, Ł.; Vaziri Sereshk, M.R. Crack Saturation as a Mechanism of Acclimatization of Panel Paintings to Unstable Environments. Stud. Conserv. 2018, 63, 22–27. [Google Scholar] [CrossRef]
- Giorgiutti-Dauphiné, F.; Pauchard, L. Painting Cracks: A Way to Investigate the Pictorial Matter. J. Appl. Phys. 2016, 120, 065107. [Google Scholar] [CrossRef]
- Mathur, K.; Seyam, A.-F. Color and Weave Relationship in Woven Fabrics. In Advances in Modern Woven Fabrics Technology; Vassiliadis, S., Ed.; InTechOpen: London, UK, 2011. [Google Scholar] [CrossRef] [Green Version]
- Burnstock, A.; van den Berg, K.J. Twentieth Century Oil Paint. The Interface between Science and Conservation and the Challenges for Modern Oil Paint Research. In Issues in Contemporary Oil Paint; van den Berg, K.J., Burnstock, A., de Keijzer, M., Krueger, J., Learner, T., de Tagle, A., Heydenreich, G., Eds.; Springer International Publishing: Cham, Switzerland, 2014; pp. 1–19. [Google Scholar] [CrossRef]
- Dalla Conservazione Alla Storia Dell’arte: Riflettografia e Analisi non Invasive per lo Studio Dei Dipinti; Poldi, G.; Villa, G.C.F. (Eds.) Strumenti; Edizioni della Normale: Pisa, Italy, 2006. [Google Scholar]
- Carden, M.L. Use of Ultraviolet Light as an Aid to Pigment Identification. APT Bull. 1991, 23, 26. [Google Scholar] [CrossRef]
- Measday, D.; Victoria, M. A Summary of Ultra-Violet Fluorescent Materials Relevant to Conservation. Available online: https://aiccm.org.au/network-news/summary-ultra-violet-fluorescent-materials-relevant-conservation/ (accessed on 27 April 2021).
- Knittle, E.; Phillips, W.; Williams, Q. An Infrared and Raman Spectroscopic Study of Gypsum at High Pressures. Phys. Chem. Miner. 2001, 28, 630–640. [Google Scholar] [CrossRef]
- Bell, I.M.; Clark, R.J.H.; Gibbs, P.J. Raman Spectroscopic Library of Natural and Synthetic Pigments (Pre- ≈1850 AD). Spectrochim. Acta Part A Mol. Biomol. Spectrosc. 1997, 53, 2159–2179. [Google Scholar] [CrossRef]
- Nevin, A.; Osticioli, I.; Anglos, D.; Burnstock, A.; Cather, S.; Castellucci, E. Raman Spectra of Proteinaceous Materials Used in Paintings: A Multivariate Analytical Approach for Classification and Identification. Anal. Chem. 2007, 79, 6143–6151. [Google Scholar] [CrossRef] [PubMed]
- Nevin, A.; Osticioli, I.; Anglos, D.; Burnstock, A.; Cather, S.; Castellucci, E. The Analysis of Naturally and Artificially Aged Protein-Based Paint Media Using Raman Spectroscopy Combined with Principal Component Analysis. J. Raman Spectrosc. 2008, 39, 993–1000. [Google Scholar] [CrossRef]
- Carlesi, S.; Becucci, M.; Ricci, M. Vibrational Spectroscopies and Chemometry for Nondestructive Identification and Differentiation of Painting Binders. J. Chem. 2017, 2017, 3475659. [Google Scholar] [CrossRef] [Green Version]
- Stanzani, E.; Bersani, D.; Lottici, P.P.; Colomban, P. Analysis of Artist’s Palette on a 16th Century Wood Panel Painting by Portable and Laboratory Raman Instruments. Vib. Spectrosc. 2016, 85, 62–70. [Google Scholar] [CrossRef] [Green Version]
- Institute of Chemistry University of Tartu, Estonia. Database of ATR-FT-IR Spectra of Various Materials. Available online: https://spectra.chem.ut.ee/ (accessed on 13 April 2021).
- Miliani, C.; Rosi, F.; Daveri, A.; Brunetti, B.G. Reflection Infrared Spectroscopy for the Non-Invasive in Situ Study of Artists’ Pigments. Appl. Phys. A 2012, 106, 295–307. [Google Scholar] [CrossRef]
- Rosi, F.; Daveri, A.; Moretti, P.; Brunetti, B.G.; Miliani, C. Interpretation of Mid and Near-Infrared Reflection Properties of Synthetic Polymer Paints for the Non-Invasive Assessment of Binding Media in Twentieth-Century Pictorial Artworks. Microchem. J. 2016, 124, 898–908. [Google Scholar] [CrossRef]
- Rampazzi, L.; Brunello, V.; Corti, C.; Lissoni, E. Non-Invasive Techniques for Revealing the Palette of the Romantic Painter Francesco Hayez. Spectrochim. Acta Part A Mol. Biomol. Spectrosc. 2017, 176, 142–154. [Google Scholar] [CrossRef] [PubMed]
- Bouchard, M.; Rivenc, R.; Menke, C.; Learner, T. Micro-FTIR and Micro-Raman Study of Paints Used by Sam Francis. e-Preserv. Sci. 2009, 6, 27–37. [Google Scholar]
- Vahur, S.; Teearu, A.; Peets, P.; Joosu, L.; Leito, I. ATR-FT-IR Spectral Collection of Conservation Materials in the Extended Region of 4000-80 cm–1. Anal. Bioanal. Chem. 2016, 408, 3373–3379. [Google Scholar] [CrossRef] [PubMed]
- Burgio, L.; Clark, R.J.H. Library of FT-Raman Spectra of Pigments, Minerals, Pigment Media and Varnishes, and Supplement to Existing Library of Raman Spectra of Pigments with Visible Excitation. Spectrochim. Acta Part A Mol. Biomol. Spectrosc. 2001, 57, 1491–1521. [Google Scholar] [CrossRef]
- Izzo, F.C.; Capogrosso, V.; Gironda, M.; Alberti, R.; Mazzei, C.; Nodari, L.; Gambirasi, A.; Zendri, E.; Nevin, A. Multi-Analytical Non-Invasive Study of Modern Yellow Paints from Postwar Italian Paintings from the International Gallery of Modern Art Cà Pesaro, Venice: Multi-Analytical Non-Invasive Study of Yellow Paints in Postwar Italian Paintings. X-ray Spectrom. 2015, 44, 296–304. [Google Scholar] [CrossRef]
- Khatua, P.K.; Dubey, R.K.; Shahoo, S.C.; Kalawate, A. Environment Friendly, Exterior Grade Resin Adhesive from Phenol-Animal Glue Formaldehyde (PGF). Int. J. Polym. Sci. 2015, 1, 7. [Google Scholar]
- Pellegrini, D.; Duce, C.; Bonaduce, I.; Biagi, S.; Ghezzi, L.; Colombini, M.P.; Tinè, M.R.; Bramanti, E. Fourier Transform Infrared Spectroscopic Study of Rabbit Glue/Inorganic Pigments Mixtures in Fresh and Aged Reference Paint Reconstructions. Microchem. J. 2016, 124, 31–35. [Google Scholar] [CrossRef]
- Geweely, N.S.; Afifi, H.A.M.; Abdelrahim, S.A.; Alakilli, S.Y.M. Novel Comparative Efficiency of Ozone and Gamma Sterilization on Fungal Deterioration of Archeological Painted Coffin, Saqqara Excavation, Egypt. Geomicrobiol. J. 2014, 31, 529–539. [Google Scholar] [CrossRef]
- Cloutis, E.; Norman, L.; Cuddy, M.; Mann, P. Spectral Reflectance (350–2500 Nm) Properties of Historic Artists’ Pigments. II. Red–Orange–Yellow Chromates, Jarosites, Organics, Lead(–Tin) Oxides, Sulphides, Nitrites and Antimonates. J. Near Infrared Spectrosc. 2016, 24, 119–140. [Google Scholar] [CrossRef]
- Invernizzi, C.; Rovetta, T.; Licchelli, M.; Malagodi, M. Mid and Near-Infrared Reflection Spectral Database of Natural Organic Materials in the Cultural Heritage Field. Int. J. Anal. Chem. 2018, 2018, 7823248. [Google Scholar] [CrossRef] [PubMed]
- Mazzeo, R.; Prati, S.; Quaranta, M.; Joseph, E.; Kendix, E.; Galeotti, M. Attenuated Total Reflection Micro FTIR Characterisation of Pigment–Binder Interaction in Reconstructed Paint Films. Anal. Bioanal. Chem. 2008, 392, 65–76. [Google Scholar] [CrossRef] [PubMed]
- van der Weerd, J.; van Loon, A.; Boon, J.J. FTIR Studies of the Effects of Pigments on the Aging of Oil. Stud. Conserv. 2005, 50, 3–22. [Google Scholar] [CrossRef]
- Zoppi, A.; Lofrumento, C.; Mendes, N.F.C.; Castellucci, E.M. Metal Oxalates in Paints: A Raman Investigation on the Relative Reactivities of Different Pigments to Oxalic Acid Solutions. Anal. Bioanal. Chem. 2010, 397, 841–849. [Google Scholar] [CrossRef] [PubMed]
- Rosado, T.; Gil, M.; Mirão, J.; Candeias, A.; Caldeira, A.T. Oxalate Biofilm Formation in Mural Paintings Due to Microorganisms—A Comprehensive Study. Int. Biodeterior. Biodegrad. 2013, 85, 1–7. [Google Scholar] [CrossRef] [Green Version]
- Bordignon, F.; Postorino, P.; Dore, P.; Tabasso, M.L. The Formation of Metal Oxalates in the Painted Layers of a Medieval Polychrome on Stone, as Revealed by Micro-Raman Spectroscopy. Stud. Conserv. 2008, 53, 158–169. [Google Scholar] [CrossRef]
- Otero, V.; Vilarigues, M.; Carlyle, L.; Cotte, M.; De Nolf, W.; Melo, M.J. A Little Key to Oxalate Formation in Oil Paints: Protective Patina or Chemical Reactor? Photochem. Photobiol. Sci. 2018, 17, 266–270. [Google Scholar] [CrossRef] [PubMed]
- Simonsen, K.P.; Poulsen, J.N.; Vanmeert, F.; Ryhl-Svendsen, M.; Bendix, J.; Sanyova, J.; Janssens, K.; Mederos-Henry, F. Formation of Zinc Oxalate from Zinc White in Various Oil Binding Media: The Influence of Atmospheric Carbon Dioxide by Reaction with 13CO2. Herit. Sci. 2020, 8, 126. [Google Scholar] [CrossRef]
- Monico, L.; Rosi, F.; Miliani, C.; Daveri, A.; Brunetti, B.G. Non-Invasive Identification of Metal-Oxalate Complexes on Polychrome Artwork Surfaces by Reflection Mid-Infrared Spectroscopy. Spectrochim. Acta Part A Mol. Biomol. Spectrosc. 2013, 116, 270–280. [Google Scholar] [CrossRef] [PubMed]
- Cariati, F.; Rampazzi, L.; Toniolo, L. Calcium Oxalate Films on Stone Surfaces: Experimental Assessment of the Chemical Formation. Stud. Conserv. 2000, 45, 180–188. [Google Scholar]
- Hermans, J.J.; Keune, K.; van Loon, A.; Iedema, P.D. An Infrared Spectroscopic Study of the Nature of Zinc Carboxylates in Oil Paintings. J. Anal. At. Spectrom. 2015, 30, 1600–1608. [Google Scholar] [CrossRef] [Green Version]
- Izzo, F.C. 20th Century Artists’ Oil Paints: A Chemical-Physical Survey. Ph.D. Thesis, Ca’ Foscari University of Venice, Venezia, Italy, 2010. [Google Scholar]
- Robinet, L.; Corbeil-a2, M.-C. The Characterization of Metal Soaps. Stud. Conserv. 2003, 48, 23–40. [Google Scholar] [CrossRef]
- Izzo, F.C.; Kratter, M.; Nevin, A.; Zendri, E. A Critical Review on the Analysis of Metal Soaps in Oil Paintings. ChemistryOpen 2021, 10, 904–921. [Google Scholar] [CrossRef] [PubMed]
- Otero, V.; Sanches, D.; Montagner, C.; Vilarigues, M.; Carlyle, L.; Lopes, J.A.; Melo, M.J. Characterisation of Metal Carboxylates by Raman and Infrared Spectroscopy in Works of Art: Characterisation of Metal Carboxylates by Raman and Infrared Spectroscopy in Works of Art. J. Raman Spectrosc. 2014, 45, 1197–1206. [Google Scholar] [CrossRef]
- Osmond, G. Zinc White: A Review of Zinc Oxide Pigment Properties and Implications for Stability in Oil-Based Paintings. AICCM Bull. 2012, 33, 20–29. [Google Scholar] [CrossRef]
- González-Cabrera, M.; Arjonilla, P.; Domínguez-Vidal, A.; Ayora-Cañada, M.J. Natural or Synthetic? Simultaneous Raman/Luminescence Hyperspectral Microimaging for the Fast Distinction of Ultramarine Pigments. Dye. Pigment. 2020, 178, 108349. [Google Scholar] [CrossRef]
- Aceto, M.; Agostino, A.; Fenoglio, G.; Picollo, M. Non-Invasive Differentiation between Natural and Synthetic Ultramarine Blue Pigments by Means of 250–900 Nm FORS Analysis. Anal. Methods 2013, 5, 4184. [Google Scholar] [CrossRef]
- Brooke, C.; Edwards, H.; Vandenabeele, P.; Lycke, S.; Pepper, M. Raman Spectroscopic Analysis of an Early 20th Century English Painted Organ Case by Temple Moore. Heritage 2020, 3, 1148–1161. [Google Scholar] [CrossRef]
- Tomasini, E.P.; Halac, E.B.; Reinoso, M.; Di Liscia, E.J.; Maier, M.S. Micro-Raman Spectroscopy of Carbon-based Black Pigments. J. Raman Spectrosc. 2012, 43, 1671–1675. [Google Scholar] [CrossRef]
- Stuart, B.H. Analytical Techniques in Materials Conservation; John Wiley & Sons: Hoboken, NJ, USA, 2007. [Google Scholar]
- Coccato, A.; Jehlicka, J.; Moens, L.; Vandenabeele, P. Raman Spectroscopy for the Investigation of Carbon-Based Black Pigments: Investigation of Carbon-Based Black Pigments. J. Raman Spectrosc. 2015, 46, 1003–1015. [Google Scholar] [CrossRef] [Green Version]
- Conti, C.; Botteon, A.; Bertasa, M.; Colombo, C.; Realini, M.; Sali, D. Portable Sequentially Shifted Excitation Raman Spectroscopy as an Innovative Tool for in Situ Chemical Interrogation of Painted Surfaces. Analyst 2016, 141, 4599–4607. [Google Scholar] [CrossRef] [PubMed] [Green Version]
- Daveri, A.; Malagodi, M.; Vagnini, M. The Bone Black Pigment Identification by Noninvasive, In Situ Infrared Reflection Spectroscopy. J. Anal. Methods Chem. 2018, 2018, 6595643. [Google Scholar] [CrossRef] [PubMed] [Green Version]
- Castro, K.; Pérez-Alonso, M.; Rodríguez-Laso, M.D.; Fernández, L.A.; Madariaga, J.M. On-Line FT-Raman and Dispersive Raman Spectra Database of Artists’ Materials (e-VISART Database). Anal. Bioanal. Chem. 2005, 382, 248–258. [Google Scholar] [CrossRef] [PubMed]
- Learner, T. Analysis of Modern Paints; Research in Conservation; Getty Conservation Institute: Los Angeles, CA, USA, 2004. [Google Scholar]
- Monico, L.; Janssens, K.; Hendriks, E.; Brunetti, B.G.; Miliani, C. Raman Study of Different Crystalline Forms of PbCrO4 and PbCr1−xSxO4 Solid Solutions for the Noninvasive Identification of Chrome Yellows in Paintings: A Focus on Works by Vincent van Gogh: Raman Study of Different Crystalline Forms of PbCrO4 and PbCr1−xSxO4 Solid Solutions. J. Raman Spectrosc. 2014, 45, 1034–1045. [Google Scholar] [CrossRef]
- Bikiaris, D.; Daniilia, S.; Sotiropoulou, S.; Katsimbiri, O.; Pavlidou, E.; Moutsatsou, A.P.; Chryssoulakis, Y. Ochre-Differentiation through Micro-Raman and Micro-FTIR Spectroscopies: Application on Wall Paintings at Meteora and Mount Athos, Greece. Spectrochim. Acta Part A Mol. Biomol. Spectrosc. 2000, 56, 3–18. [Google Scholar] [CrossRef]


| Peak Number | Retention Time (min) | Attribution |
|---|---|---|
| 1 | 11.998 | Glycerol derivative |
| 2 | 12.304 | Nonanoic acid, 9-oxo methyl ester |
| 3 | 12.413 | Suberic acid dimethyl ester |
| 4 | 13.403 | Lauric acid methyl ester |
| 5 | 13.651 | Azelaic acid dimethyl ester |
| 6 | 14.821 | Sebacic acid dimethyl ester |
| 7 | 15.698 | Myristic acid methyl ester |
| 8 | 16.130 | Aleuritic acid, trimethyl ether methyl ester |
| 9 | 17.804 | Palmitic acid methyl ester |
| 10 | 18.559 | 3-Oxo-1,8-octanedicarboxylic acid, dimethyl ester |
| 11 | 19.552 | Oleic acid methyl ester |
| 12 | 19.729 | Stearic acid methyl ester |
| 13 | 20.637 | Nonadecanoic acid methyl ester (Int.St.) |
| 14 | 21.297 | Octadecanoic acid, 9,10-epoxy-, cis- |
| 15 | 21.501 | Arachidic acid methyl ester |
| 16 | 22.249 | Octadecanoic acid, 9,10-dihydroxy methyl ester |
| 17 | 23.137 | Behenic acid methyl ester |
| Area/Colour | Binding Media | Pigments | Inorganic Additives | Degradation Products | Comments |
|---|---|---|---|---|---|
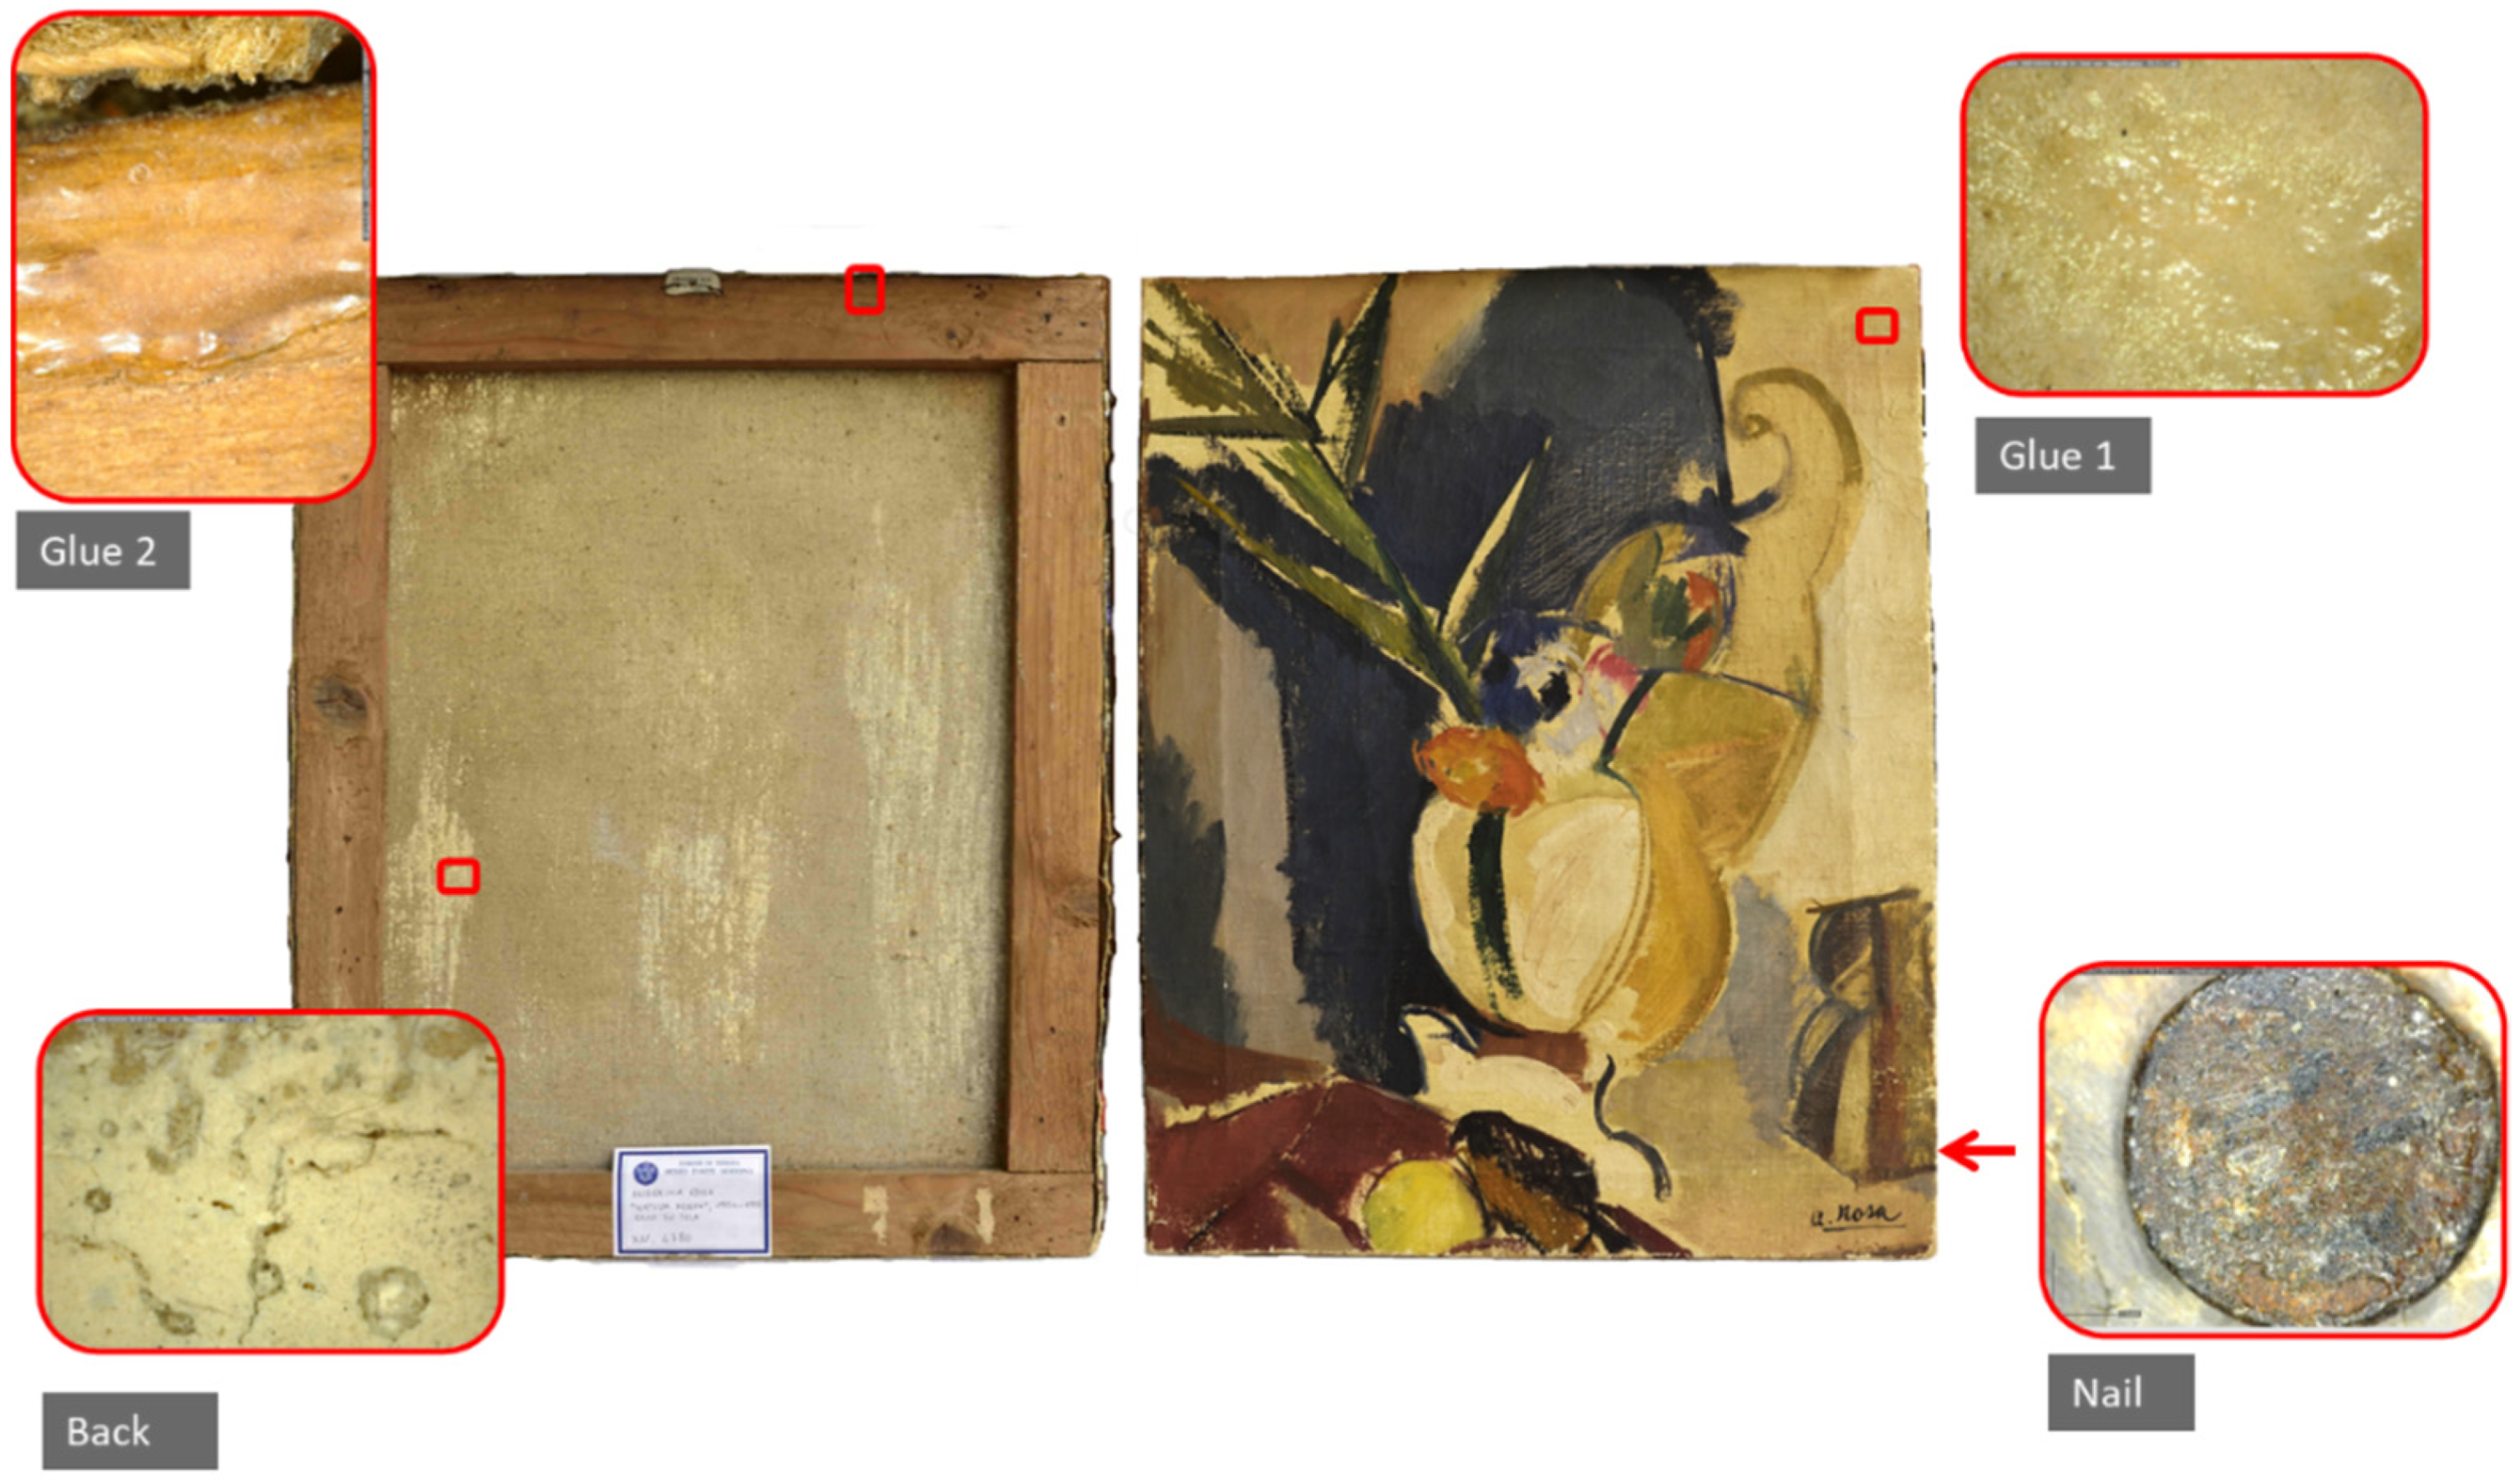
| Grounding | Proteinaceous glue | - | Gypsum, chalk, lithopone, zinc oxide | - | Orange fluorescence under UV illumination |
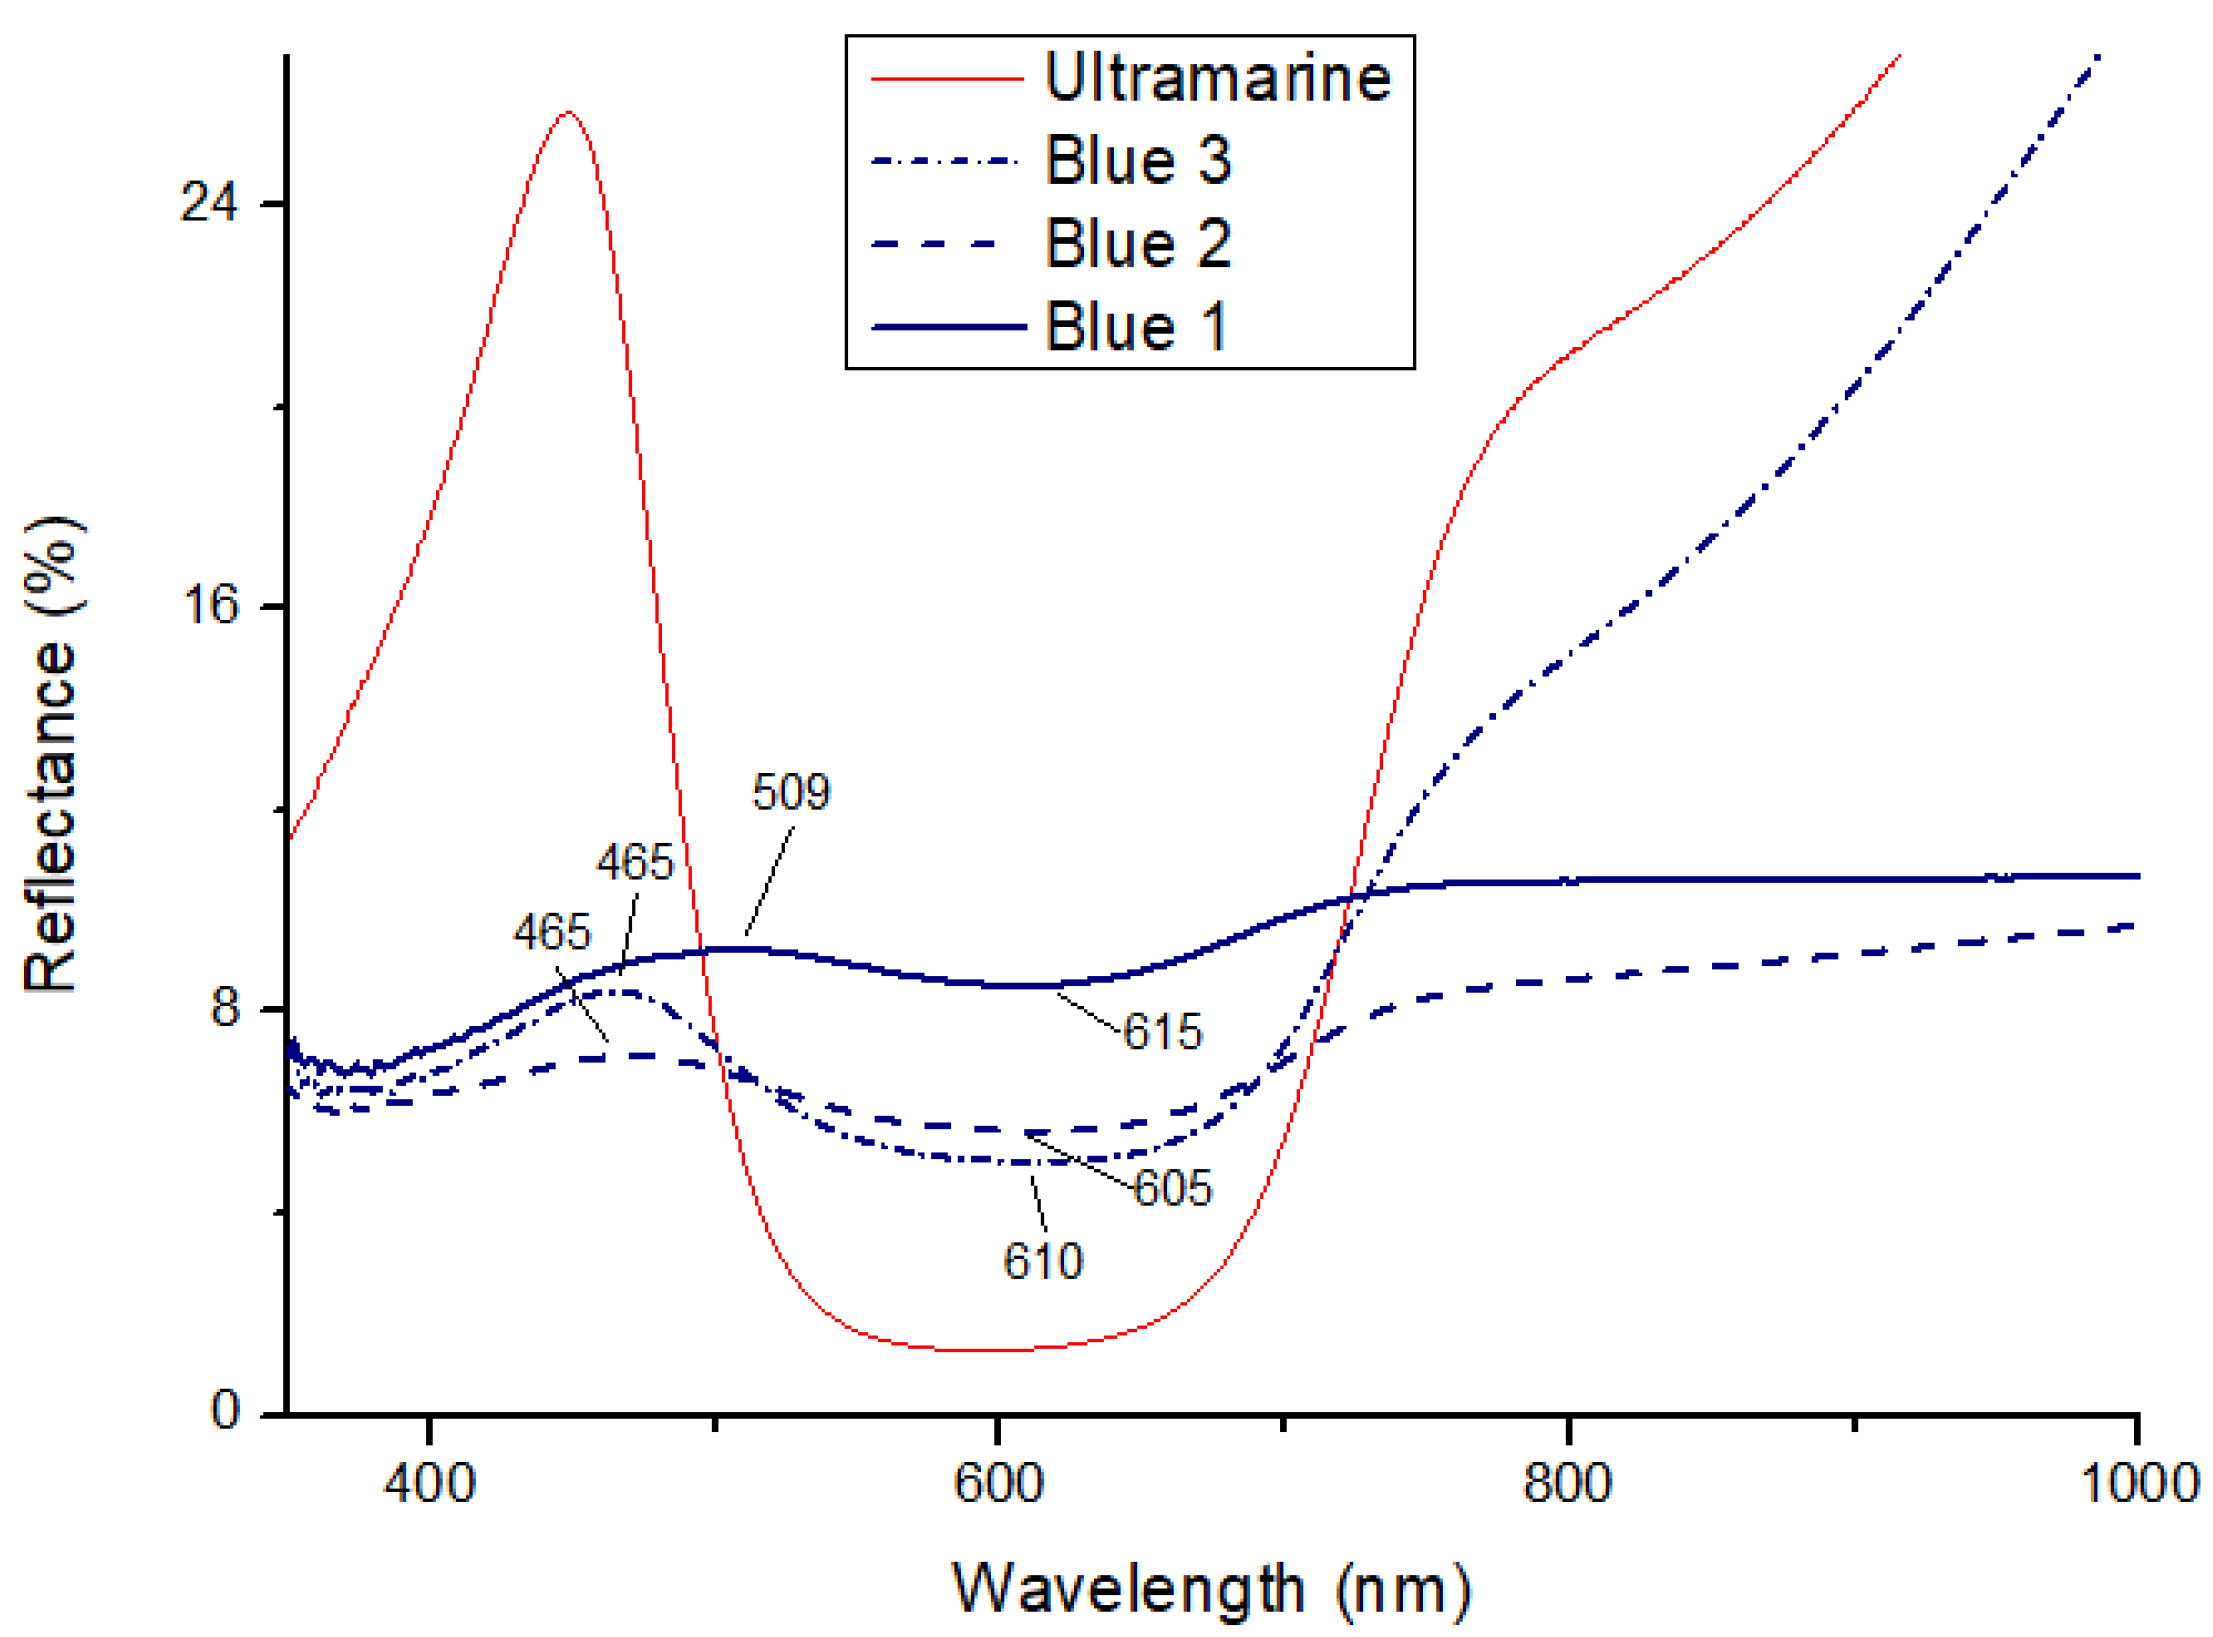
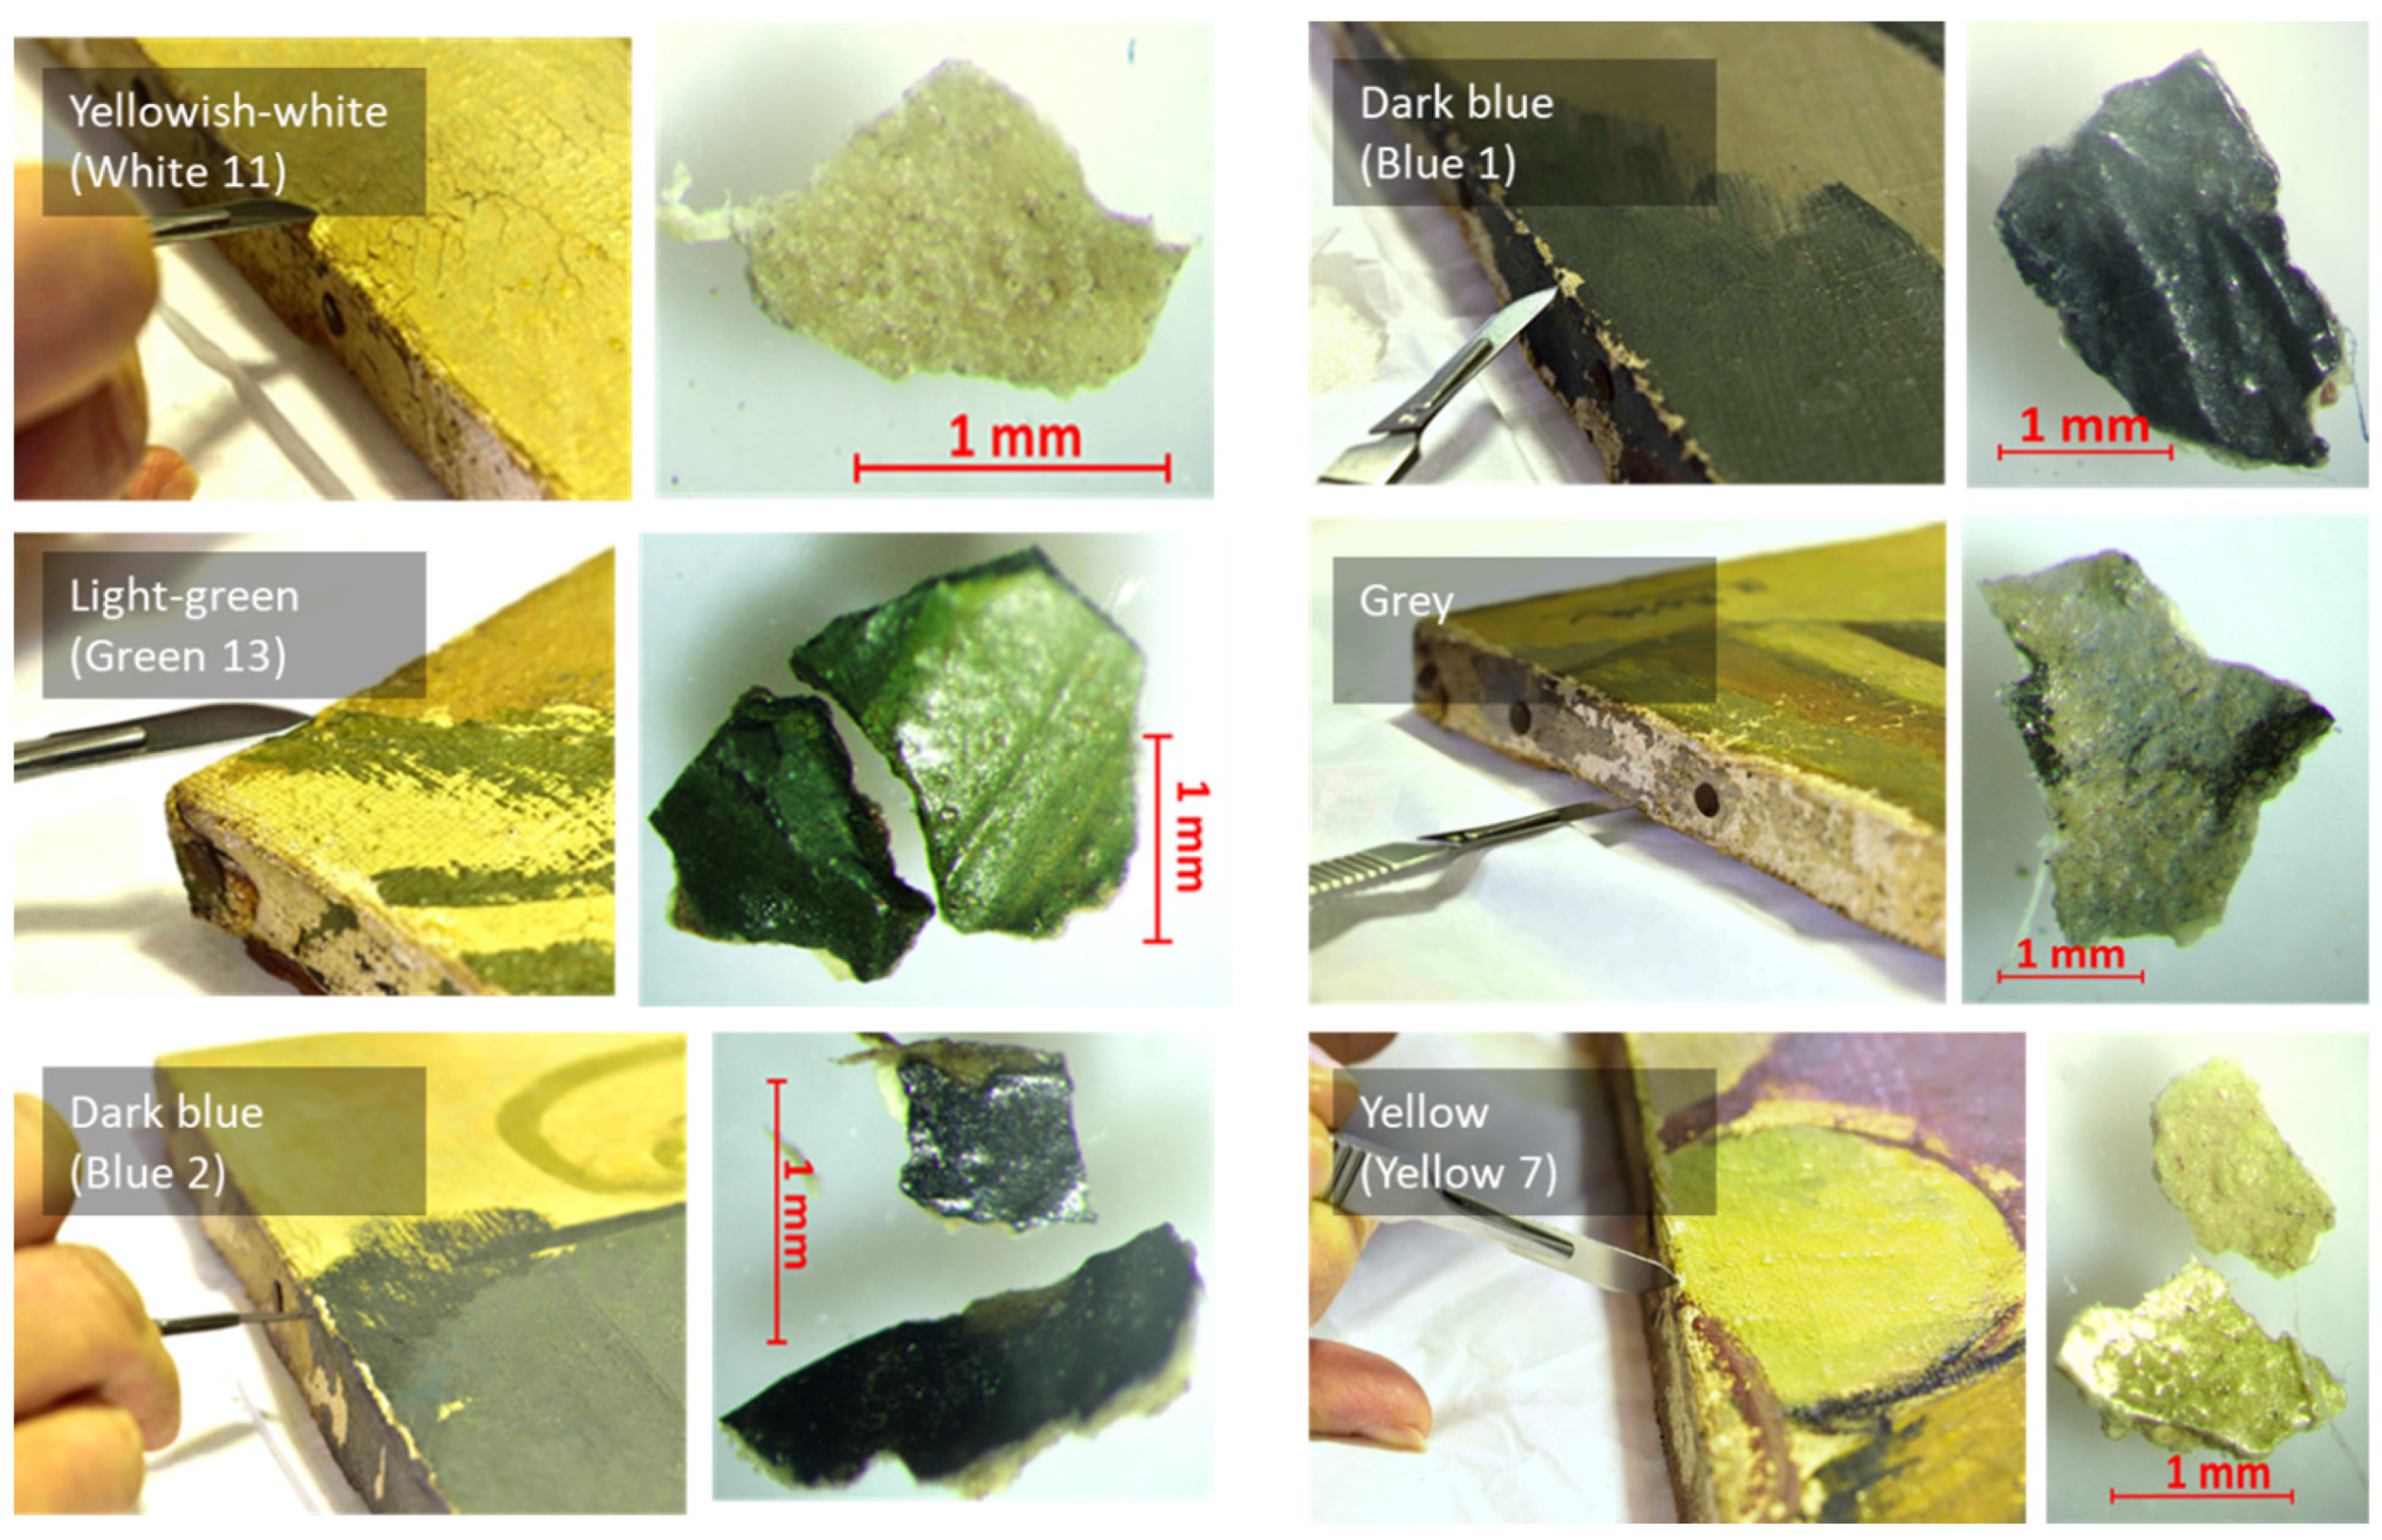
| Blue 1 | Lipidic material, more likely Linseed oil | Ultramarine blue, ivory black, zinc white | Gypsum, barium sulphate, calcite | Metal oxalates, weddelite, whewellite, metal soaps | |
| Blue 2 | Metal oxalates | Hard to analyze with non-invasive technique due to its darkness | |||
| Blue 3 | Metal oxalates, weddelite, whewellite | ||||
| Orange 4 | Vermillion, hematite, chrome yellow | Metal oxalates | Low signals in Raman besides chrome yellow. In ER-FTIR derivative signals instead of peaks for metal oxalates | ||
| Green 5 | Chrome yellow, ultramarine blue, zinc white, ivory black | Metal oxalates, whewellite, weddelite | |||
| Red 6 | hematite | Metal oxalates | Low signals in Raman besides chrome yellow. In ER-FTIR derivative signals instead of peaks for metal oxalates | ||
| Yellow 7 | Chrome yellow, zinc white | Metal oxalates, whewellite, weddelite, metal soaps | |||
| Ochre 8 | Chrome yellow, zinc white, goethite | ||||
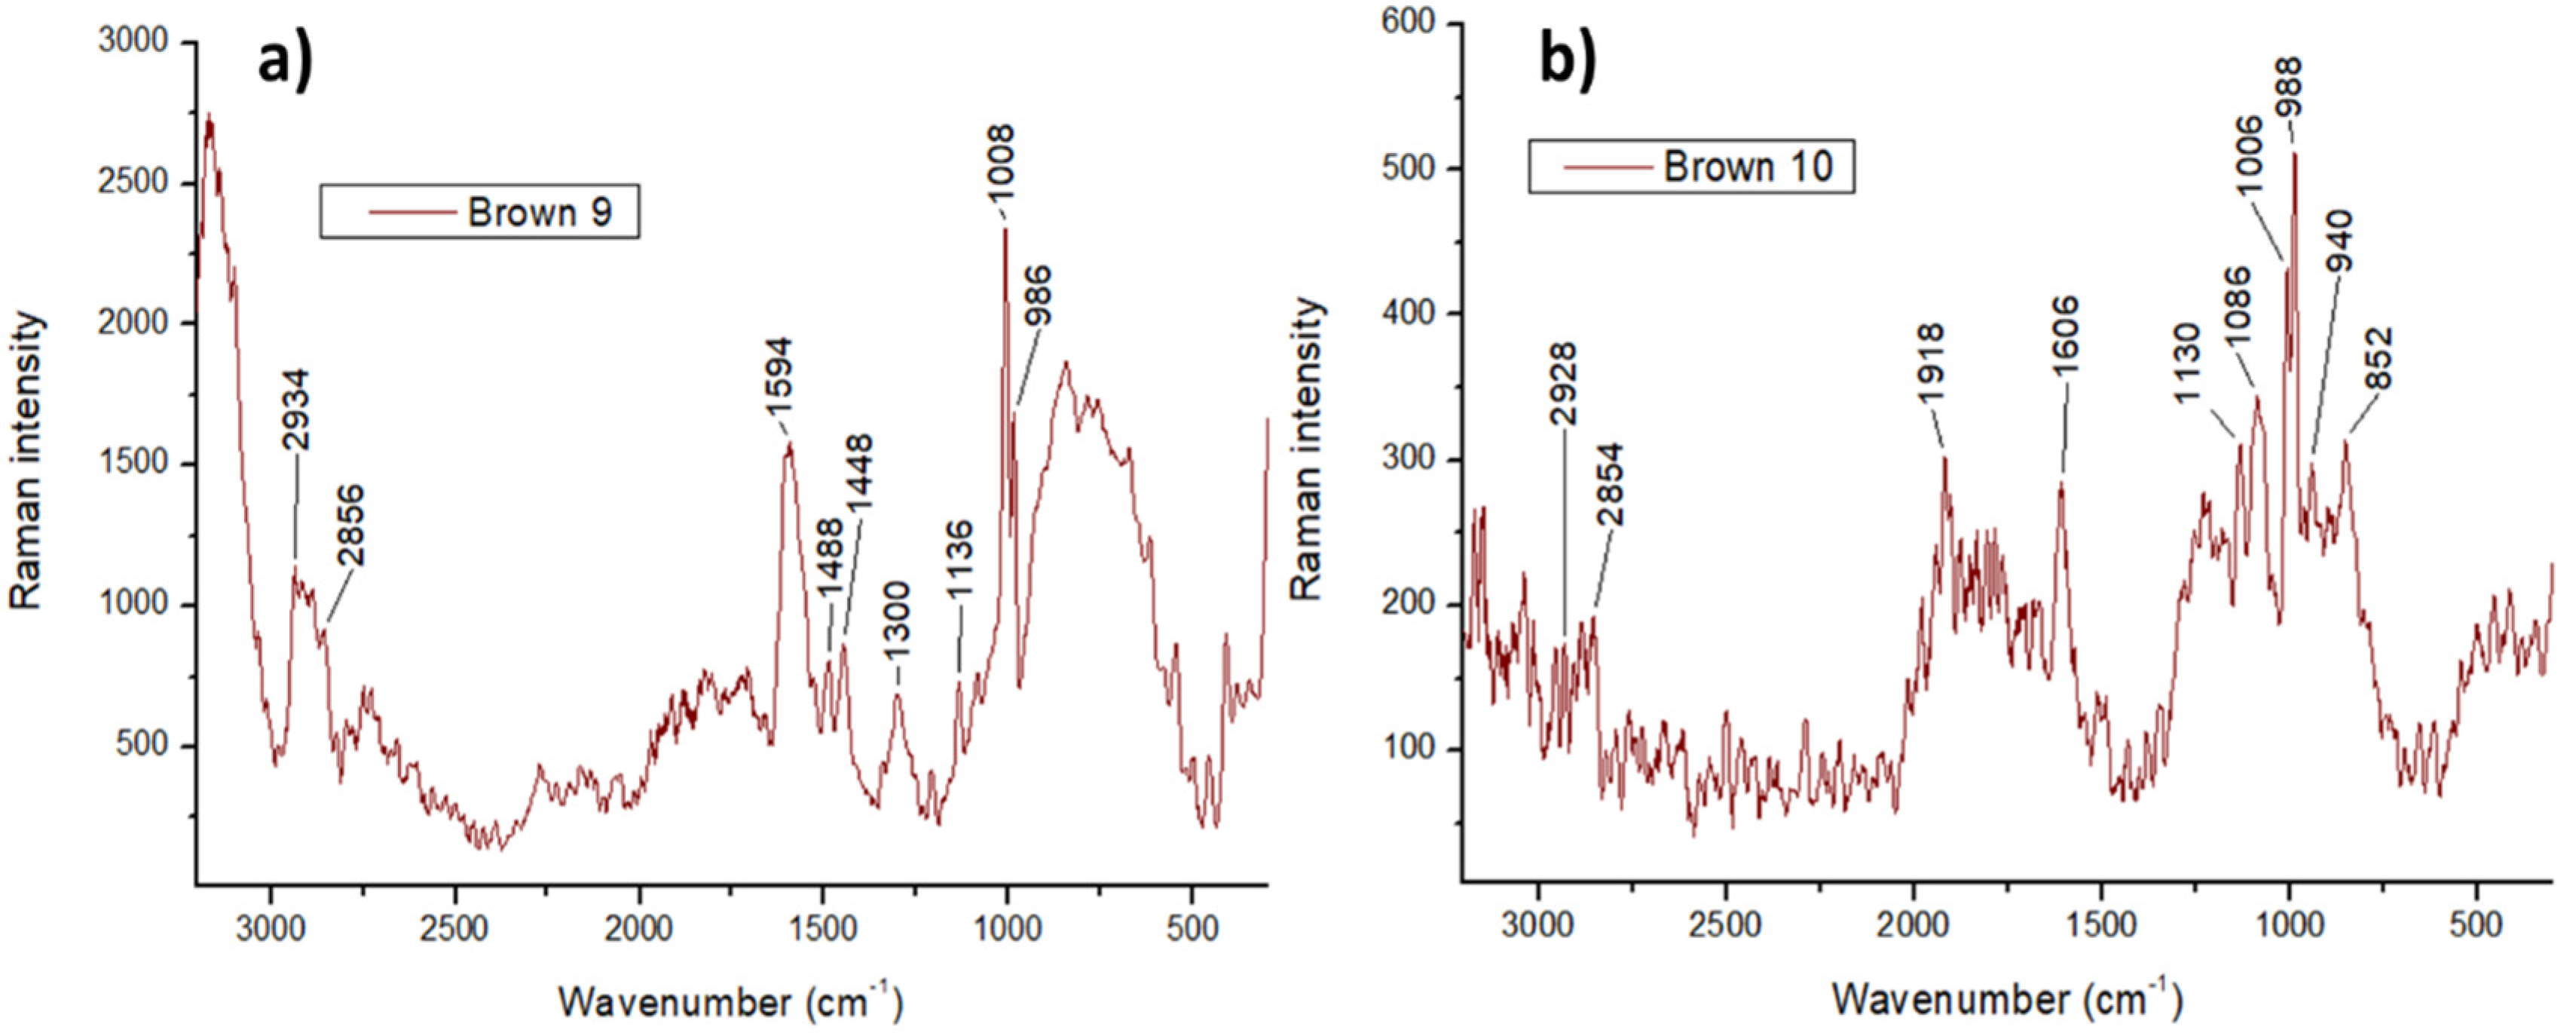
| Brown 9 | Hematite | ||||
| Brown 10 | Hematite, vermillion | ||||
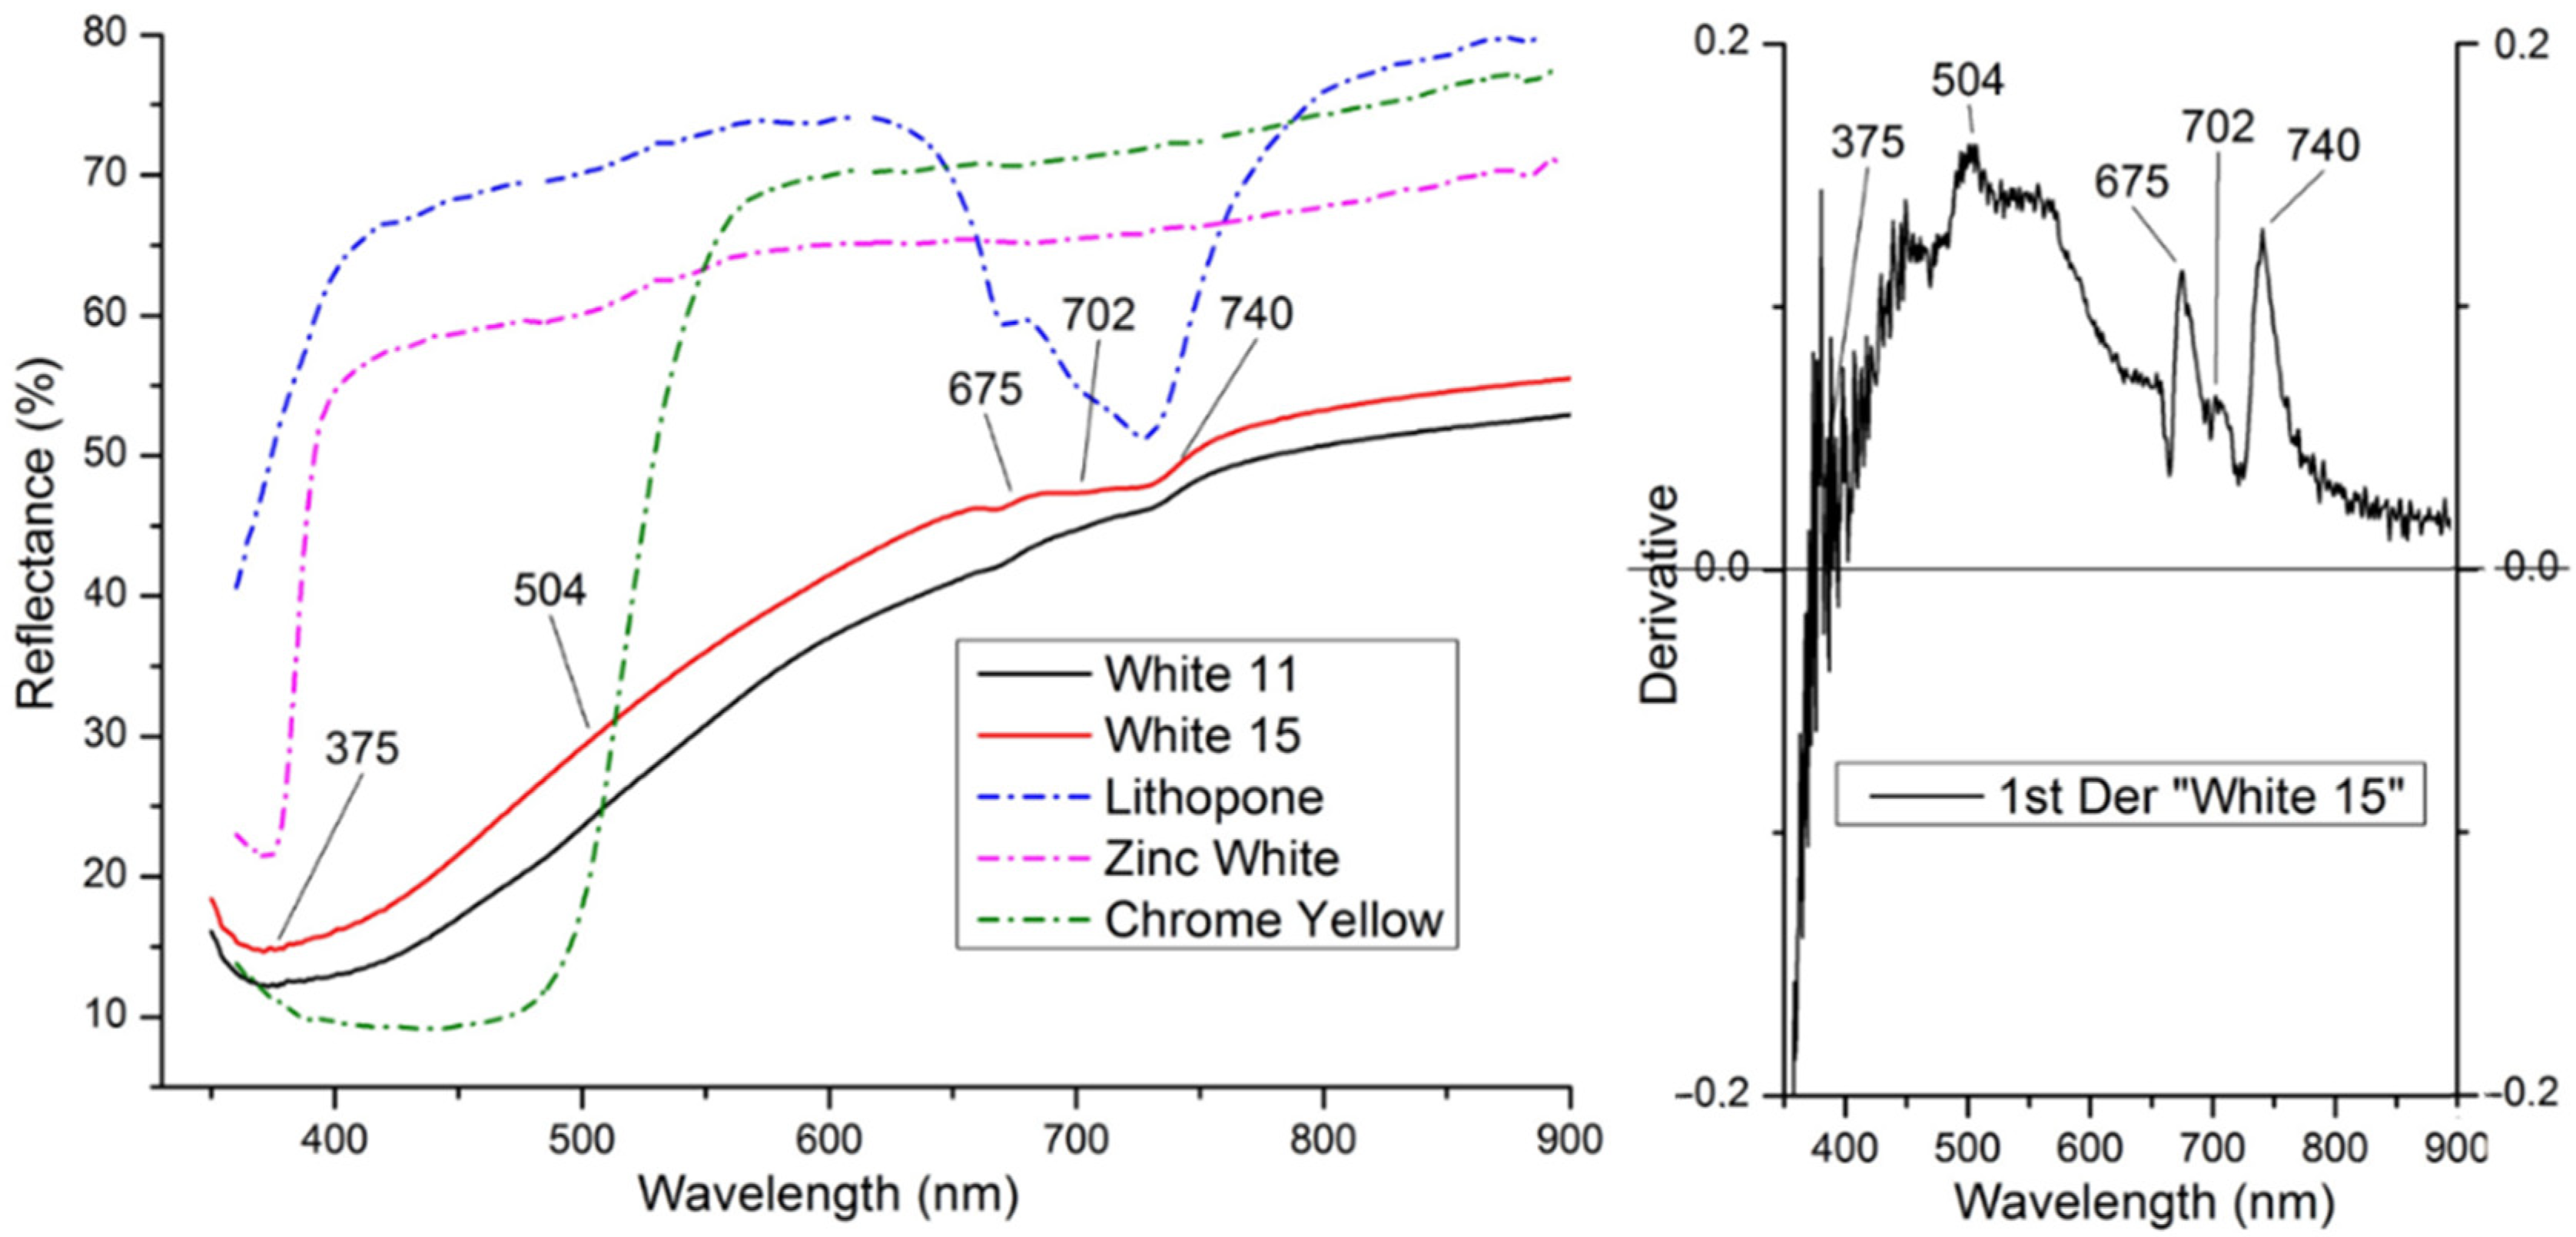
| White 11 | Lithopone, zinc white, chrome yellow | Metal oxalates, whewellite, weddelite, metal soaps. | |||
| Grey 12 | Ultramarine blue, ivory black, zinc white | Metal oxalates, whewellite, weddelite | |||
| Green 13 | Chrome yellow, ultramarine blue, zinc white, ivory black | Metal oxalates, whewellite, weddelite. | High variety and amount of oxidation products of the lipidic binder detected by GC-MS, probably slower ageing | ||
| Green 14 | Metal oxalates, whewellite, weddelite | ||||
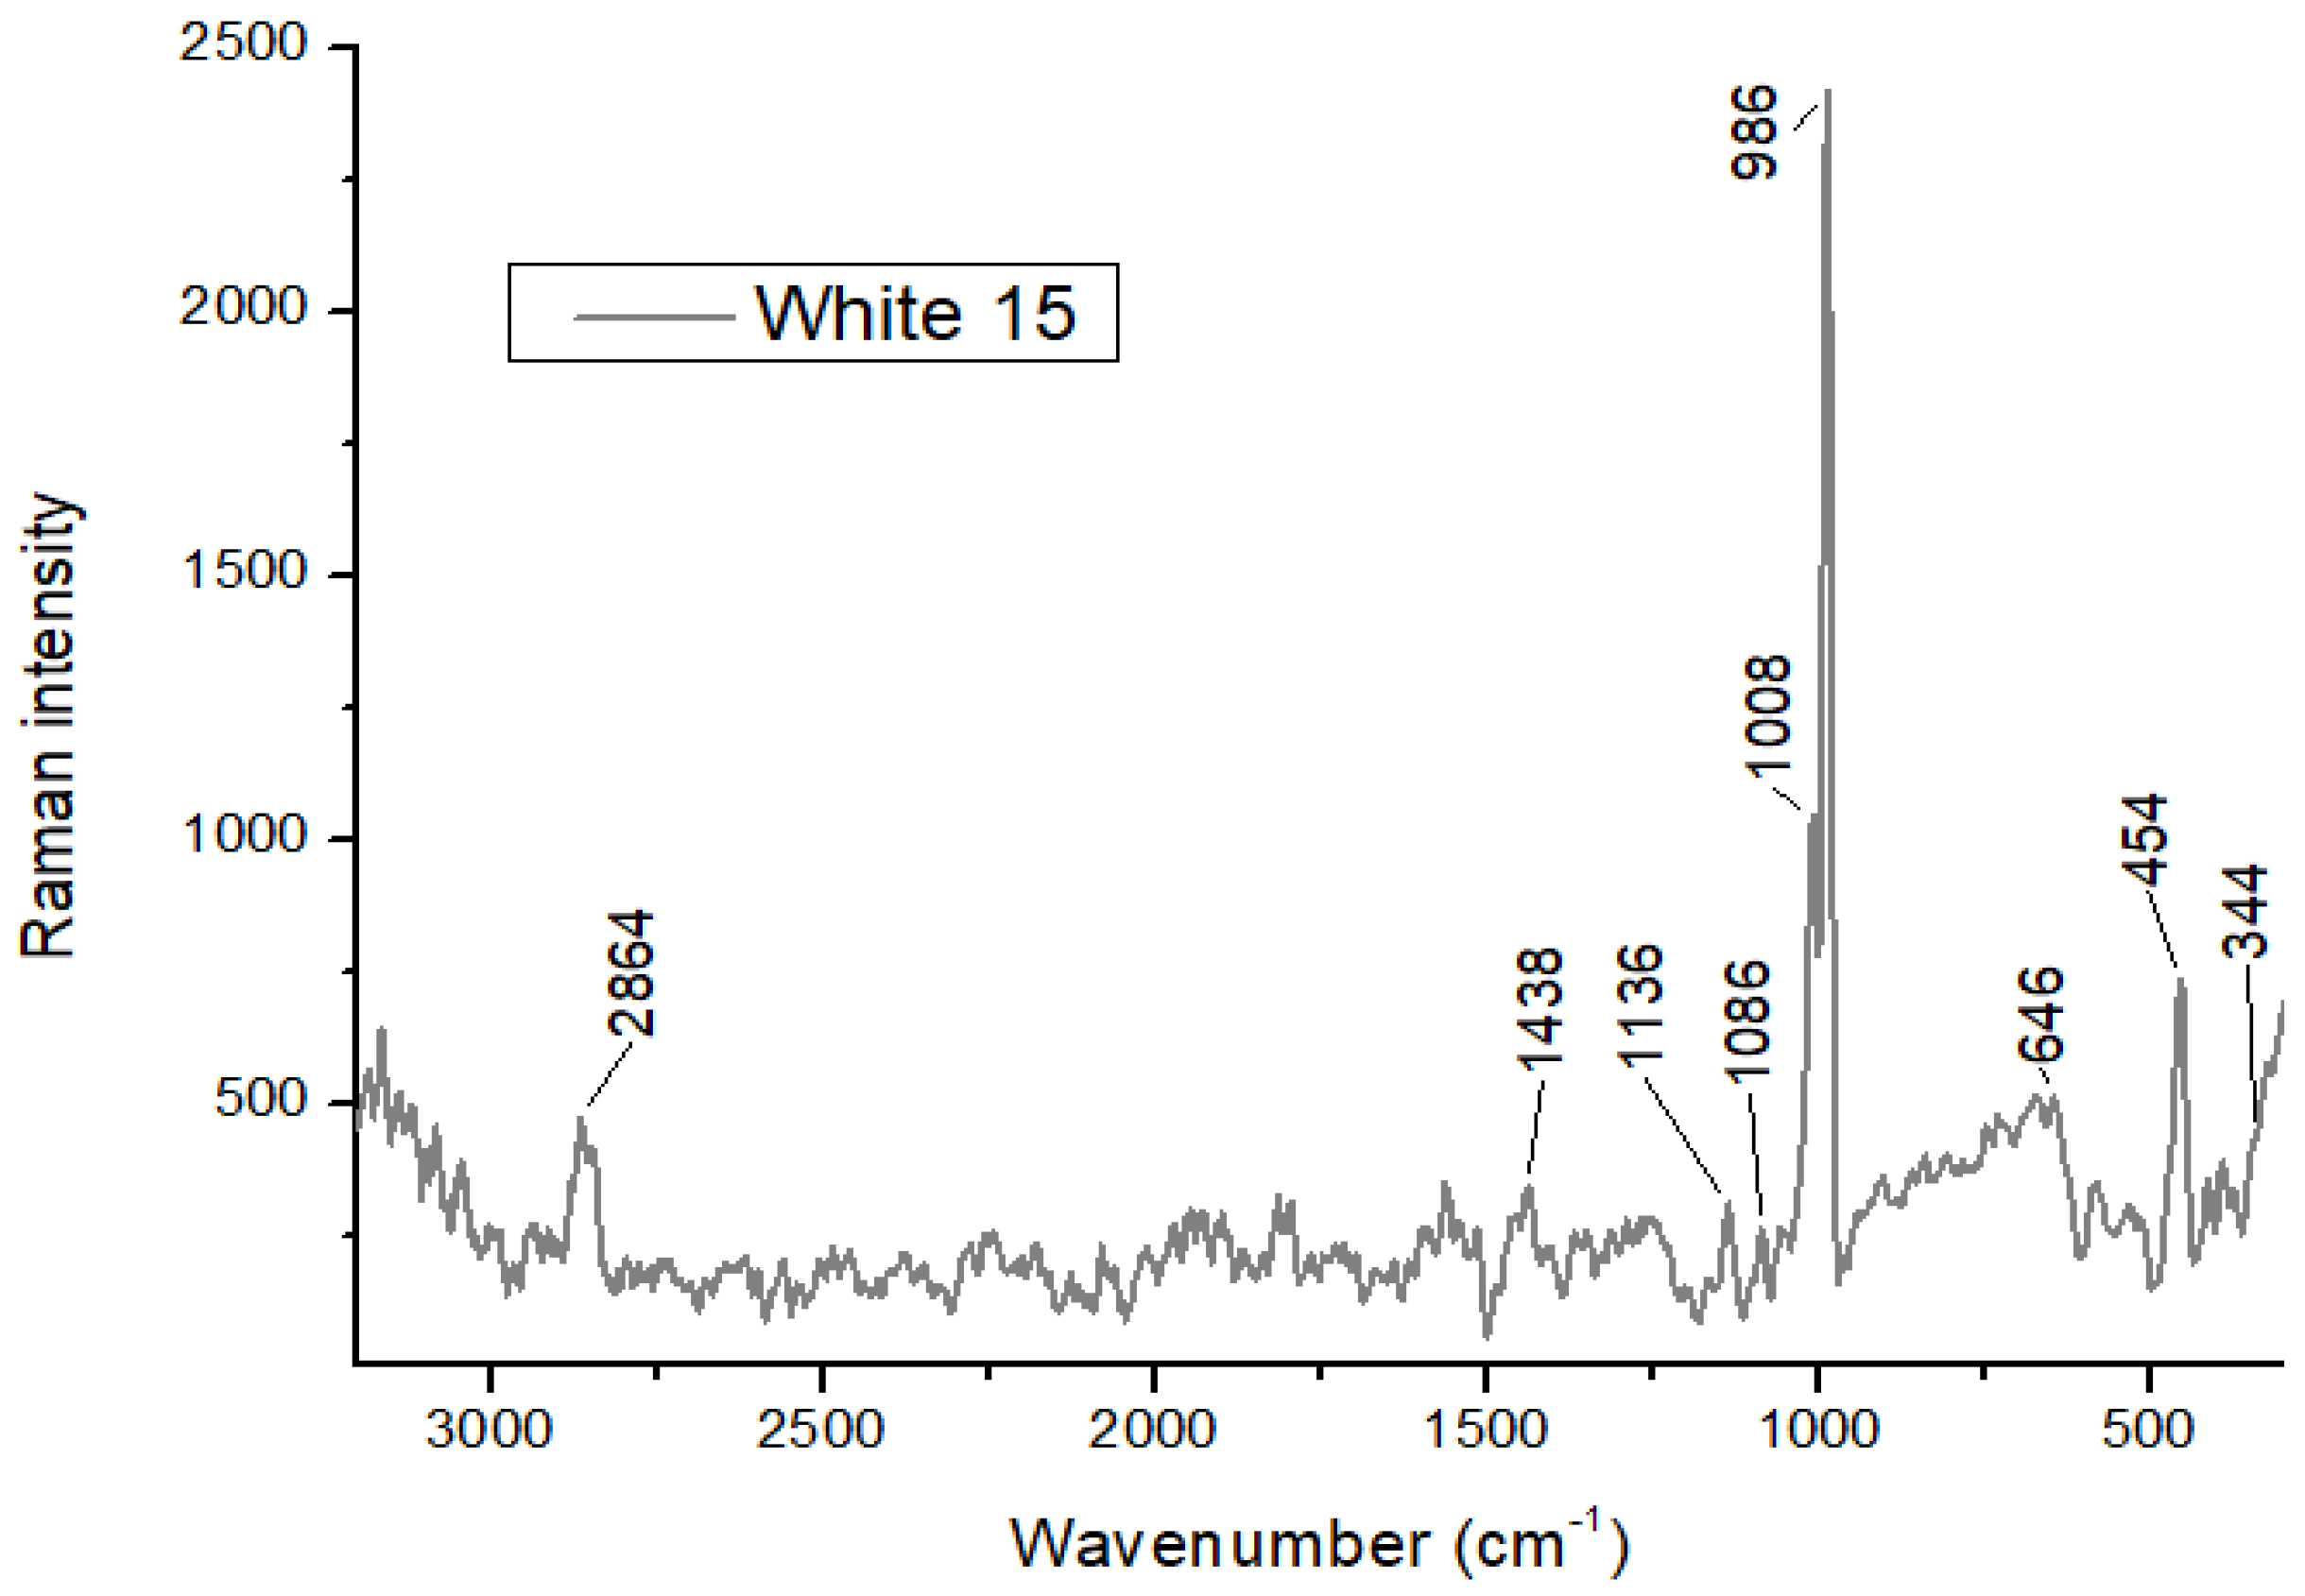
| White 15 | Zinc white, chrome yellow | Metal oxalates |
Publisher’s Note: MDPI stays neutral with regard to jurisdictional claims in published maps and institutional affiliations. |
© 2021 by the authors. Licensee MDPI, Basel, Switzerland. This article is an open access article distributed under the terms and conditions of the Creative Commons Attribution (CC BY) license (https://creativecommons.org/licenses/by/4.0/).
Share and Cite
Piccolo, A.; Bonato, E.; Falchi, L.; Lucero-Gómez, P.; Barisoni, E.; Piccolo, M.; Balliana, E.; Cimino, D.; Izzo, F.C. A Comprehensive and Systematic Diagnostic Campaign for a New Acquisition of Contemporary Art—The Case of Natura Morta by Andreina Rosa (1924–2019) at the International Gallery of Modern Art Ca’ Pesaro, Venice. Heritage 2021, 4, 4372-4398. https://doi.org/10.3390/heritage4040242
Piccolo A, Bonato E, Falchi L, Lucero-Gómez P, Barisoni E, Piccolo M, Balliana E, Cimino D, Izzo FC. A Comprehensive and Systematic Diagnostic Campaign for a New Acquisition of Contemporary Art—The Case of Natura Morta by Andreina Rosa (1924–2019) at the International Gallery of Modern Art Ca’ Pesaro, Venice. Heritage. 2021; 4(4):4372-4398. https://doi.org/10.3390/heritage4040242
Chicago/Turabian StylePiccolo, Anna, Emanuele Bonato, Laura Falchi, Paola Lucero-Gómez, Elisabetta Barisoni, Matteo Piccolo, Eleonora Balliana, Dafne Cimino, and Francesca Caterina Izzo. 2021. "A Comprehensive and Systematic Diagnostic Campaign for a New Acquisition of Contemporary Art—The Case of Natura Morta by Andreina Rosa (1924–2019) at the International Gallery of Modern Art Ca’ Pesaro, Venice" Heritage 4, no. 4: 4372-4398. https://doi.org/10.3390/heritage4040242