
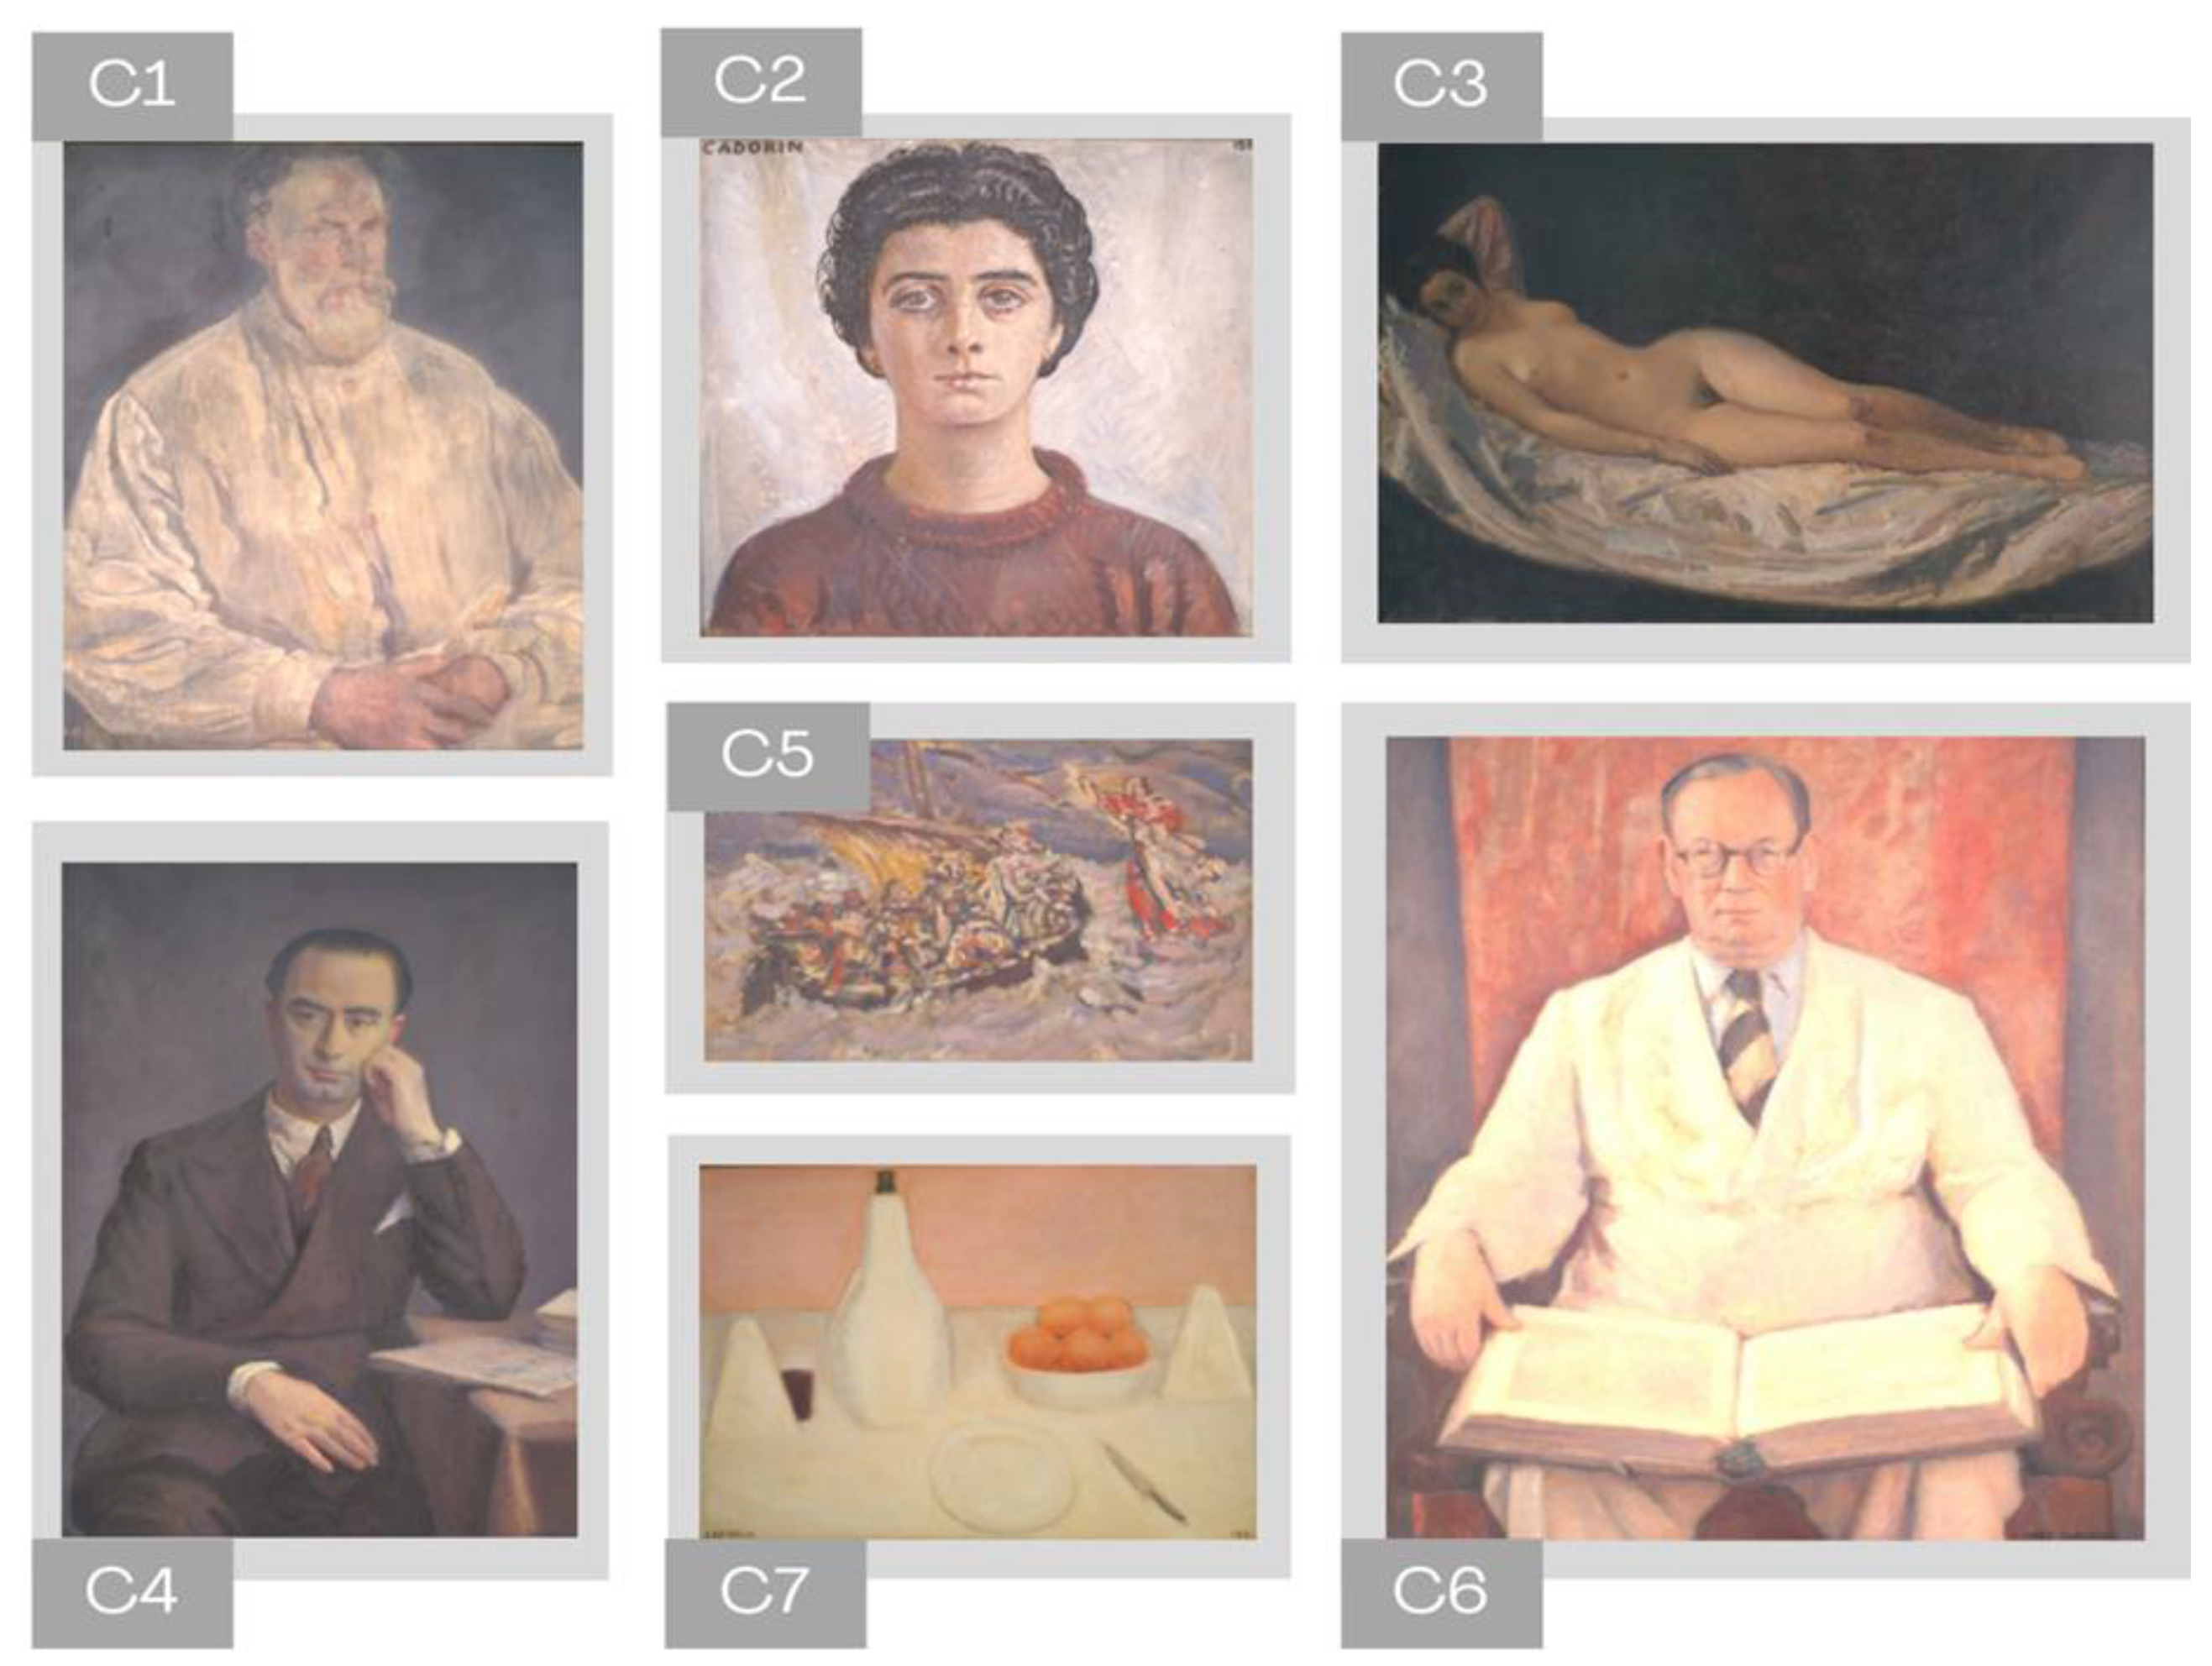
Critical Analysis of the Materials Used by the Venetian Artist Guido Cadorin (1892–1976) during the Mid-20th Century, Using a Multi-Analytical Approach


 ,
, 
Abstract
:1. Introduction
2. Materials and Methods
2.1. Non-Invasive Analytical Techniques
2.1.1. Macro-Observation
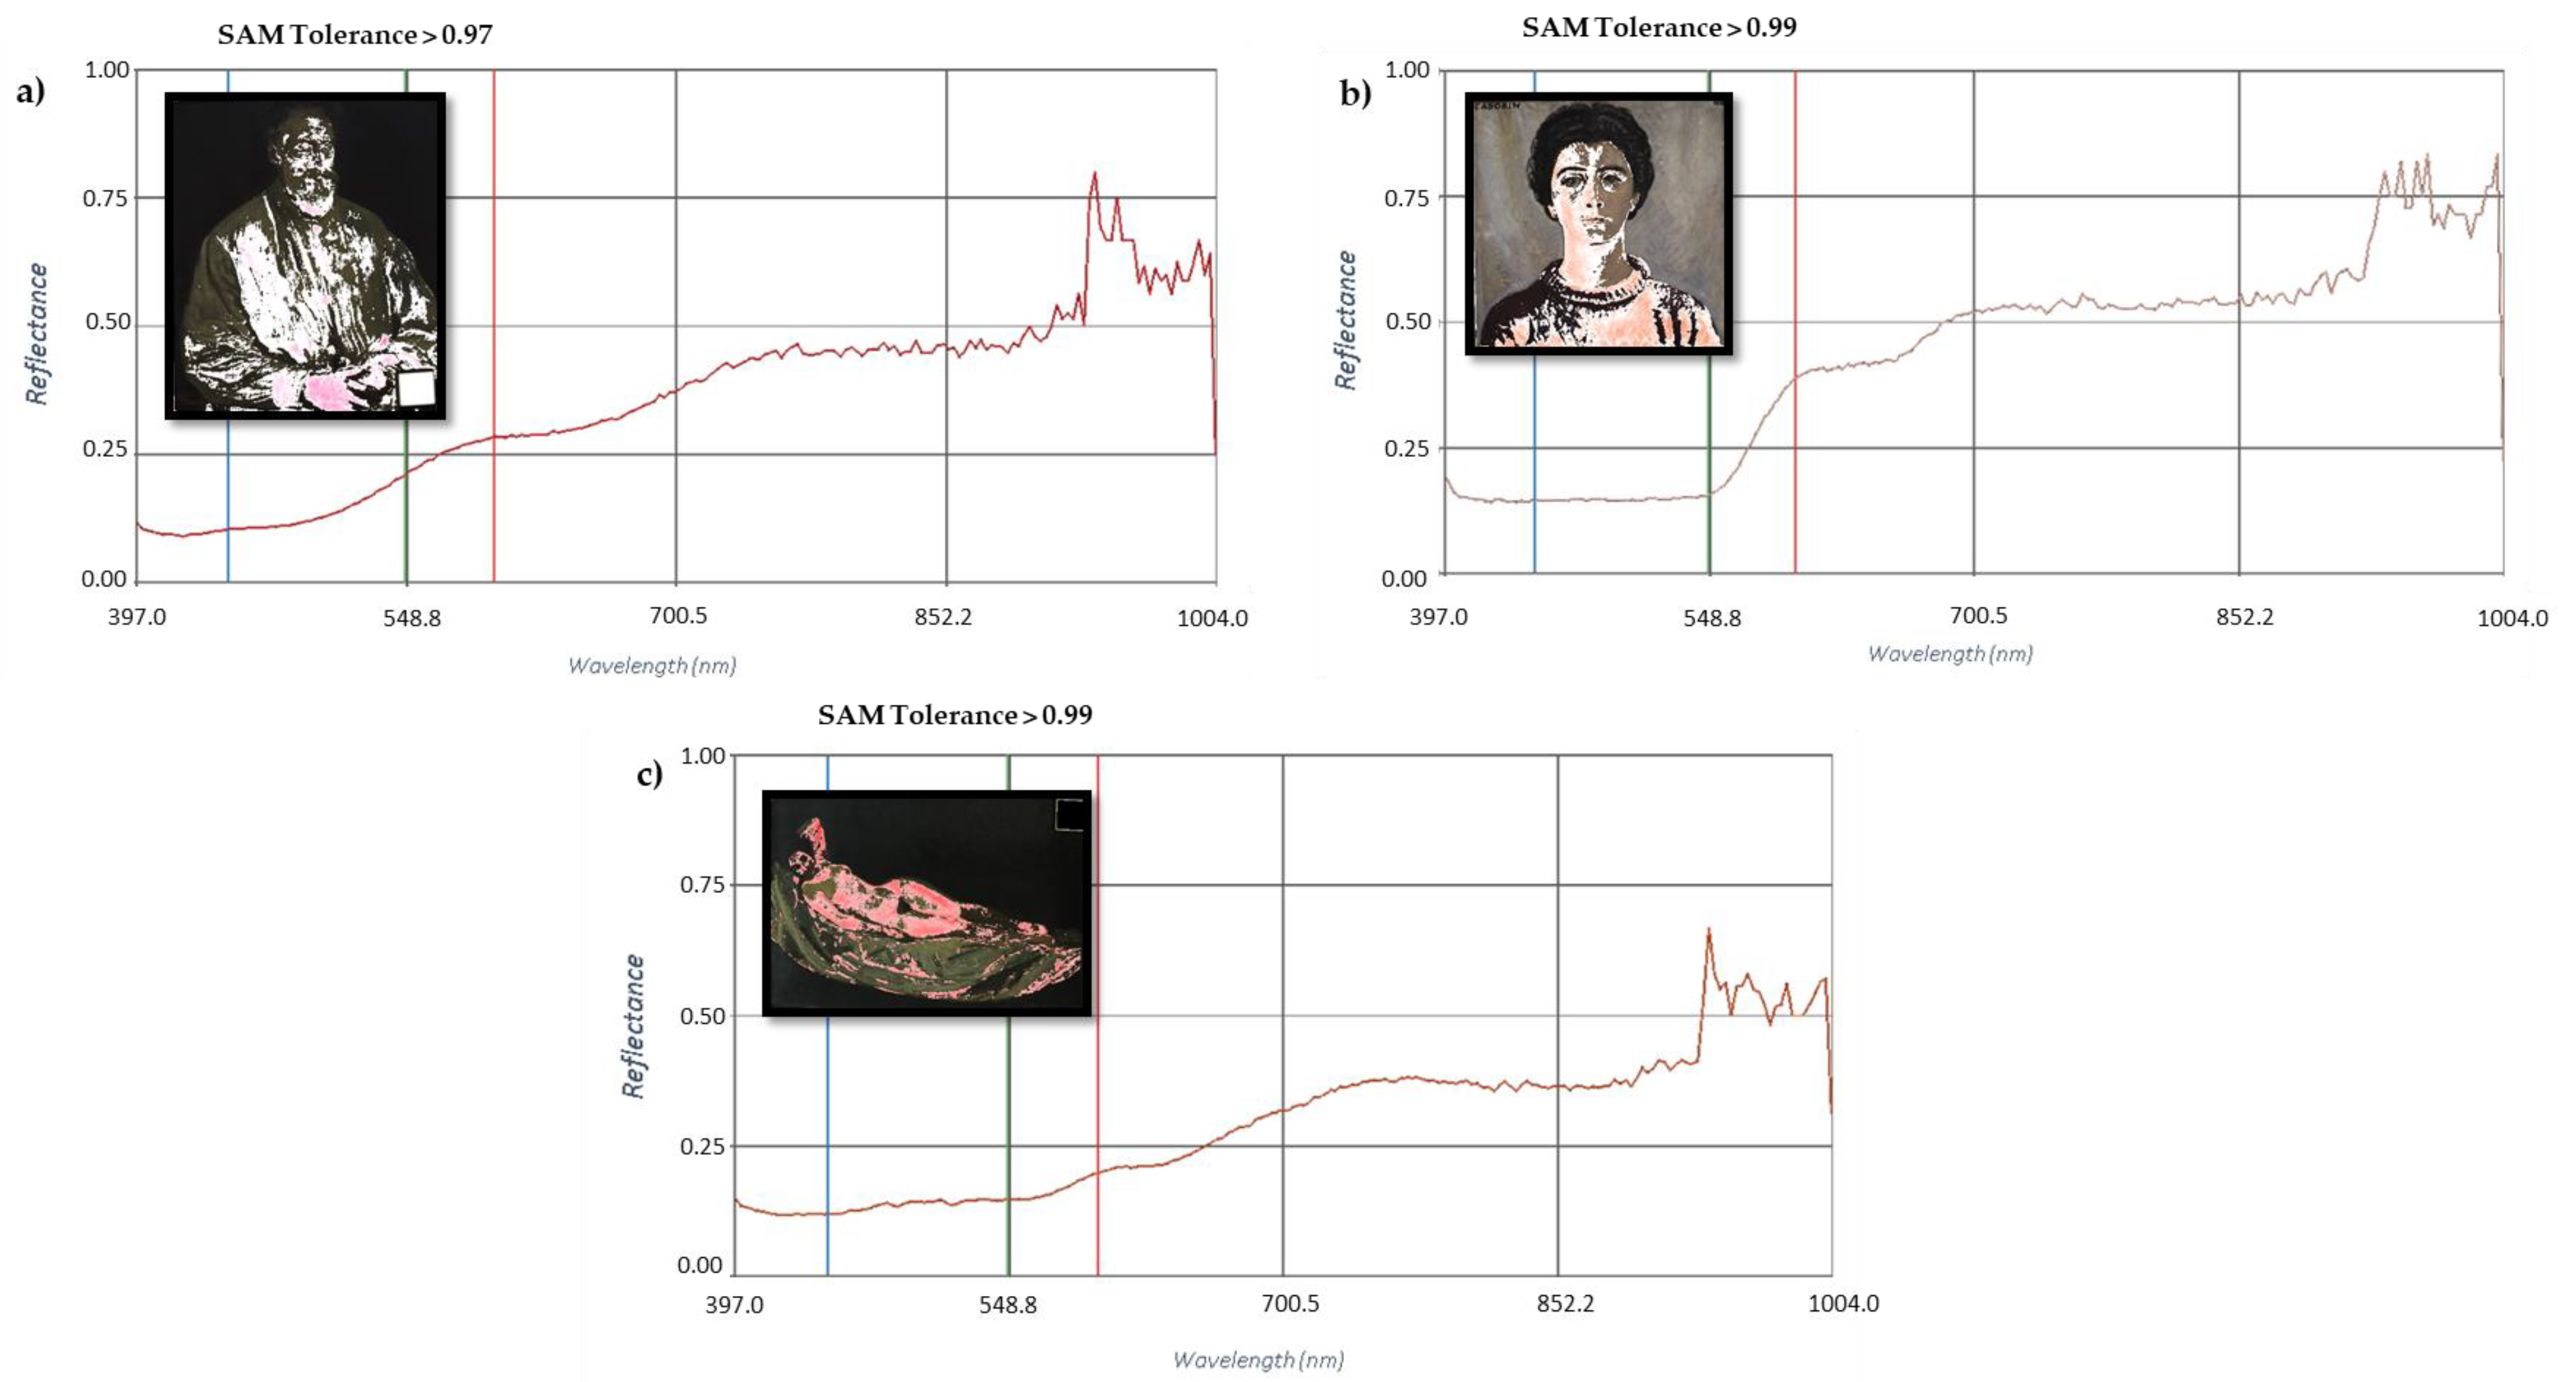
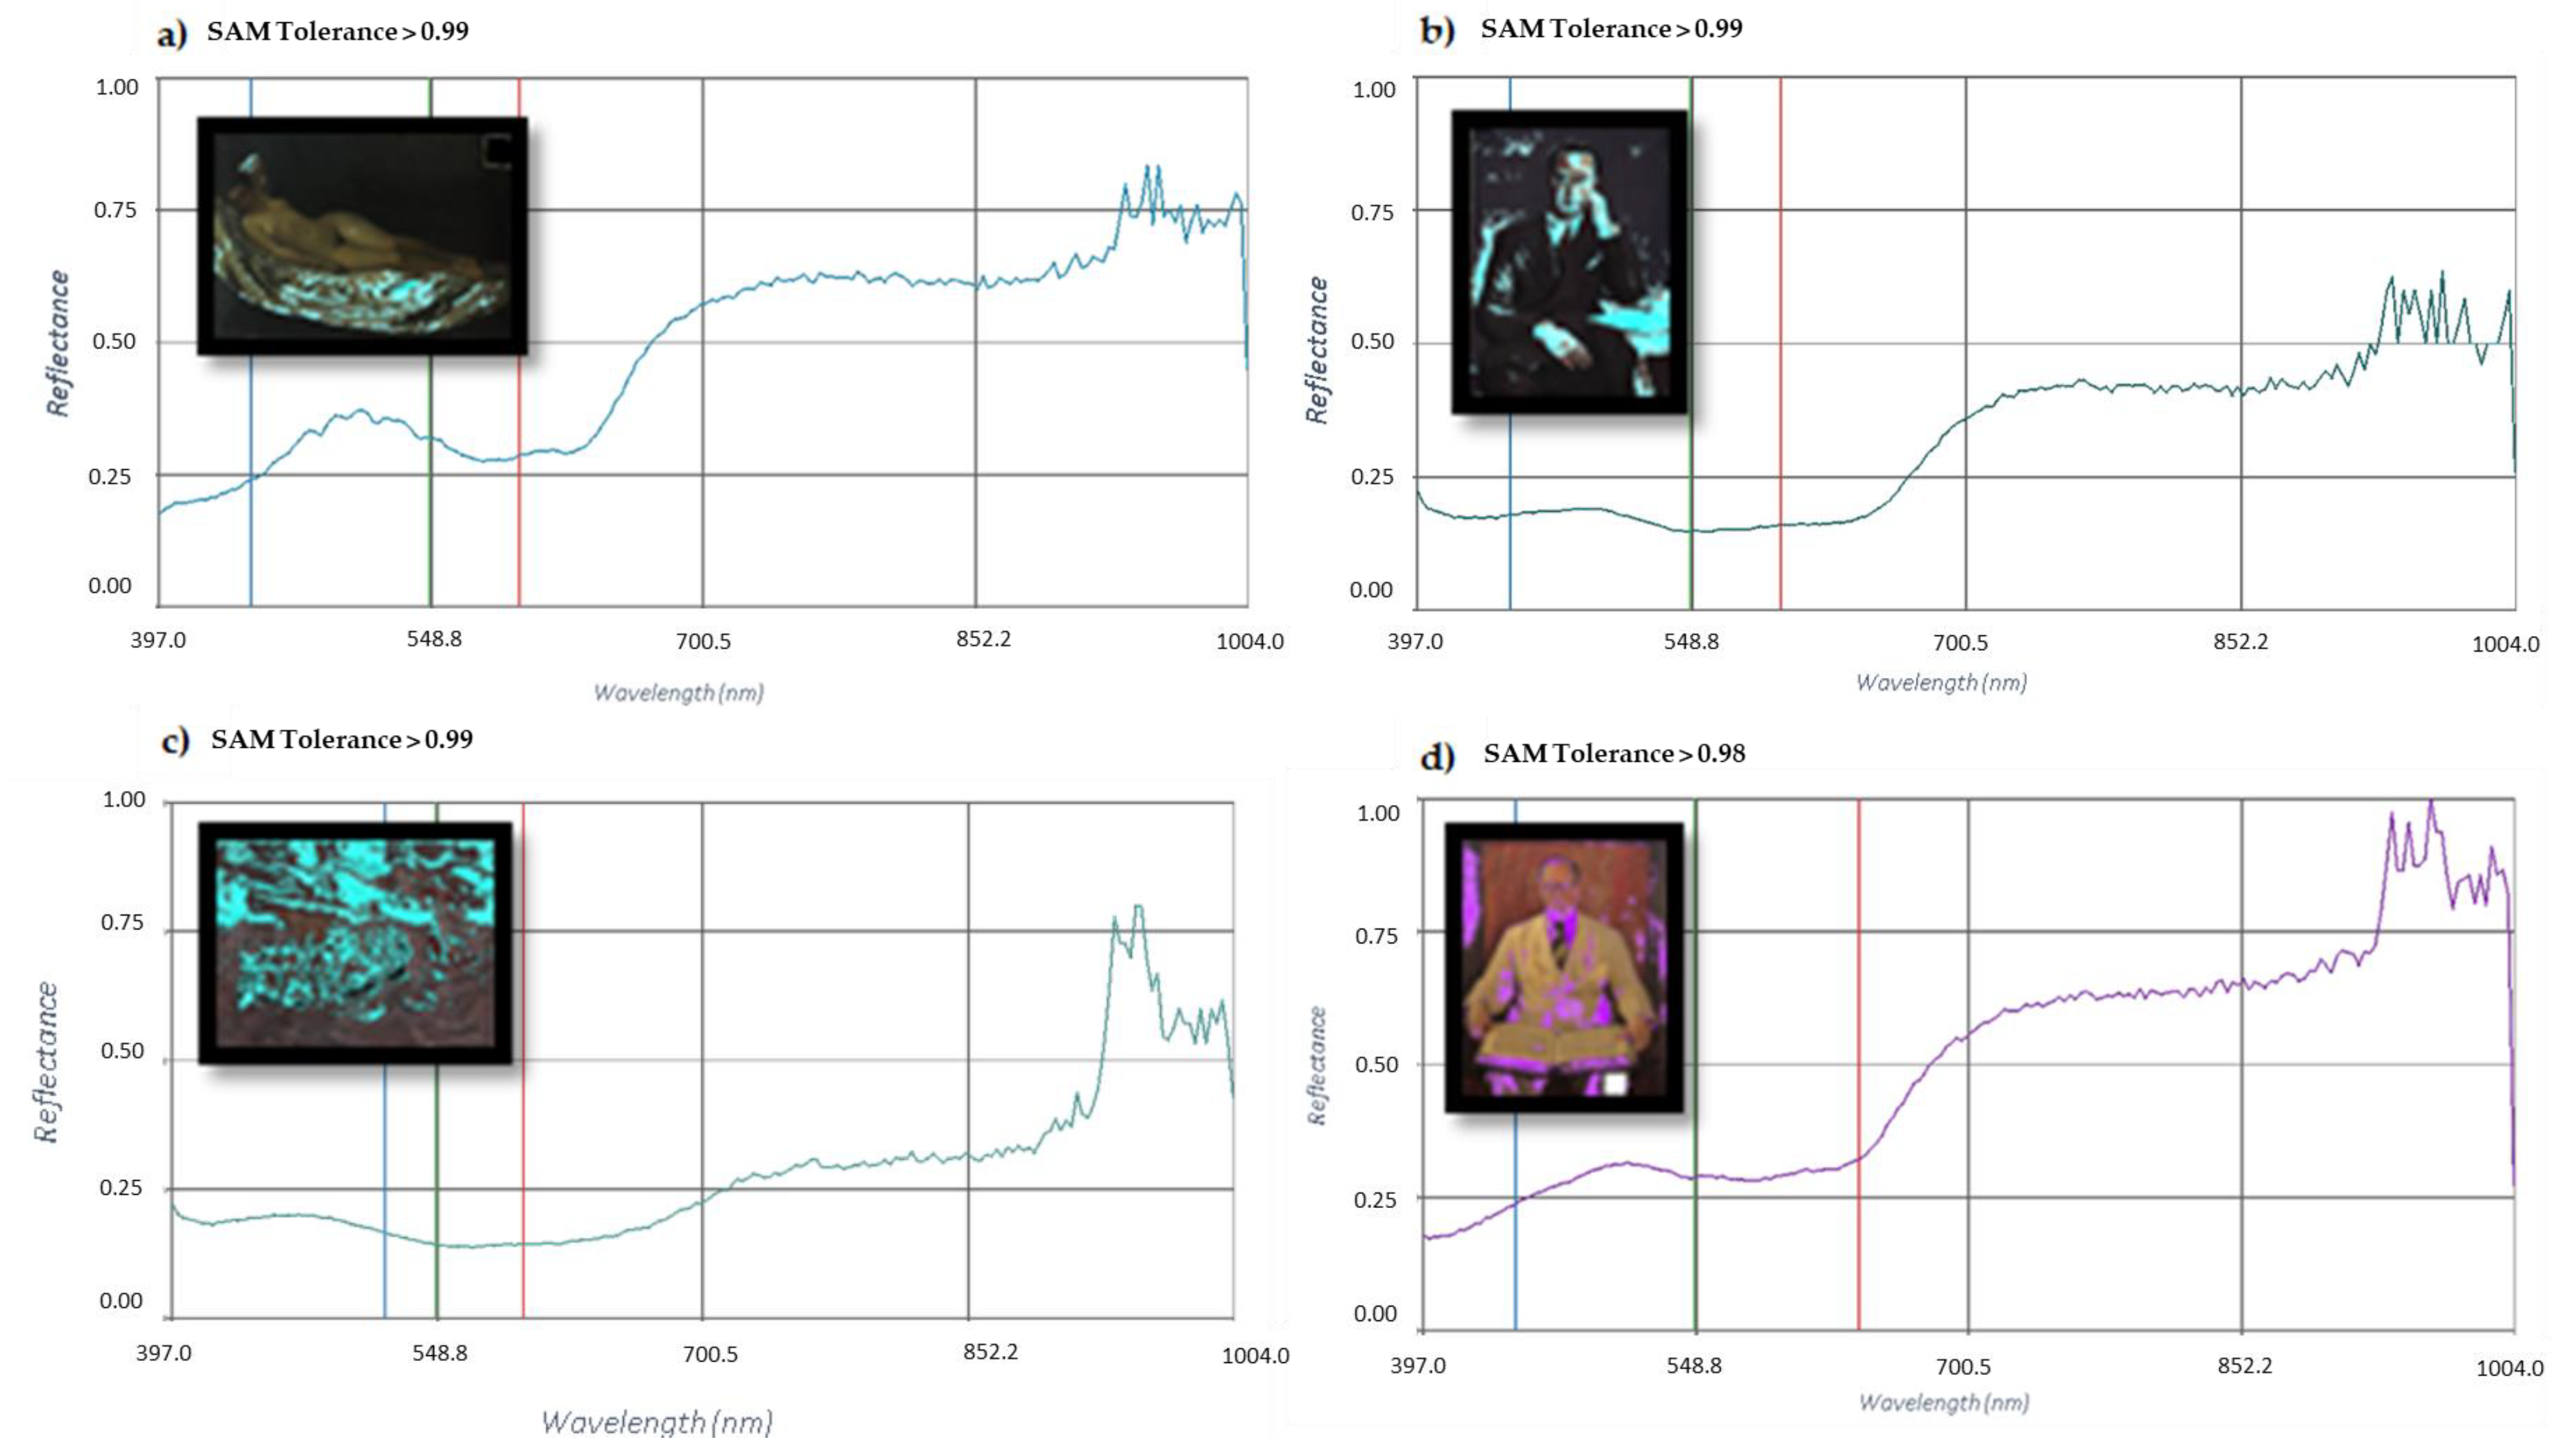
2.1.2. Hyperspectral Imaging Spectroscopy (HSI)
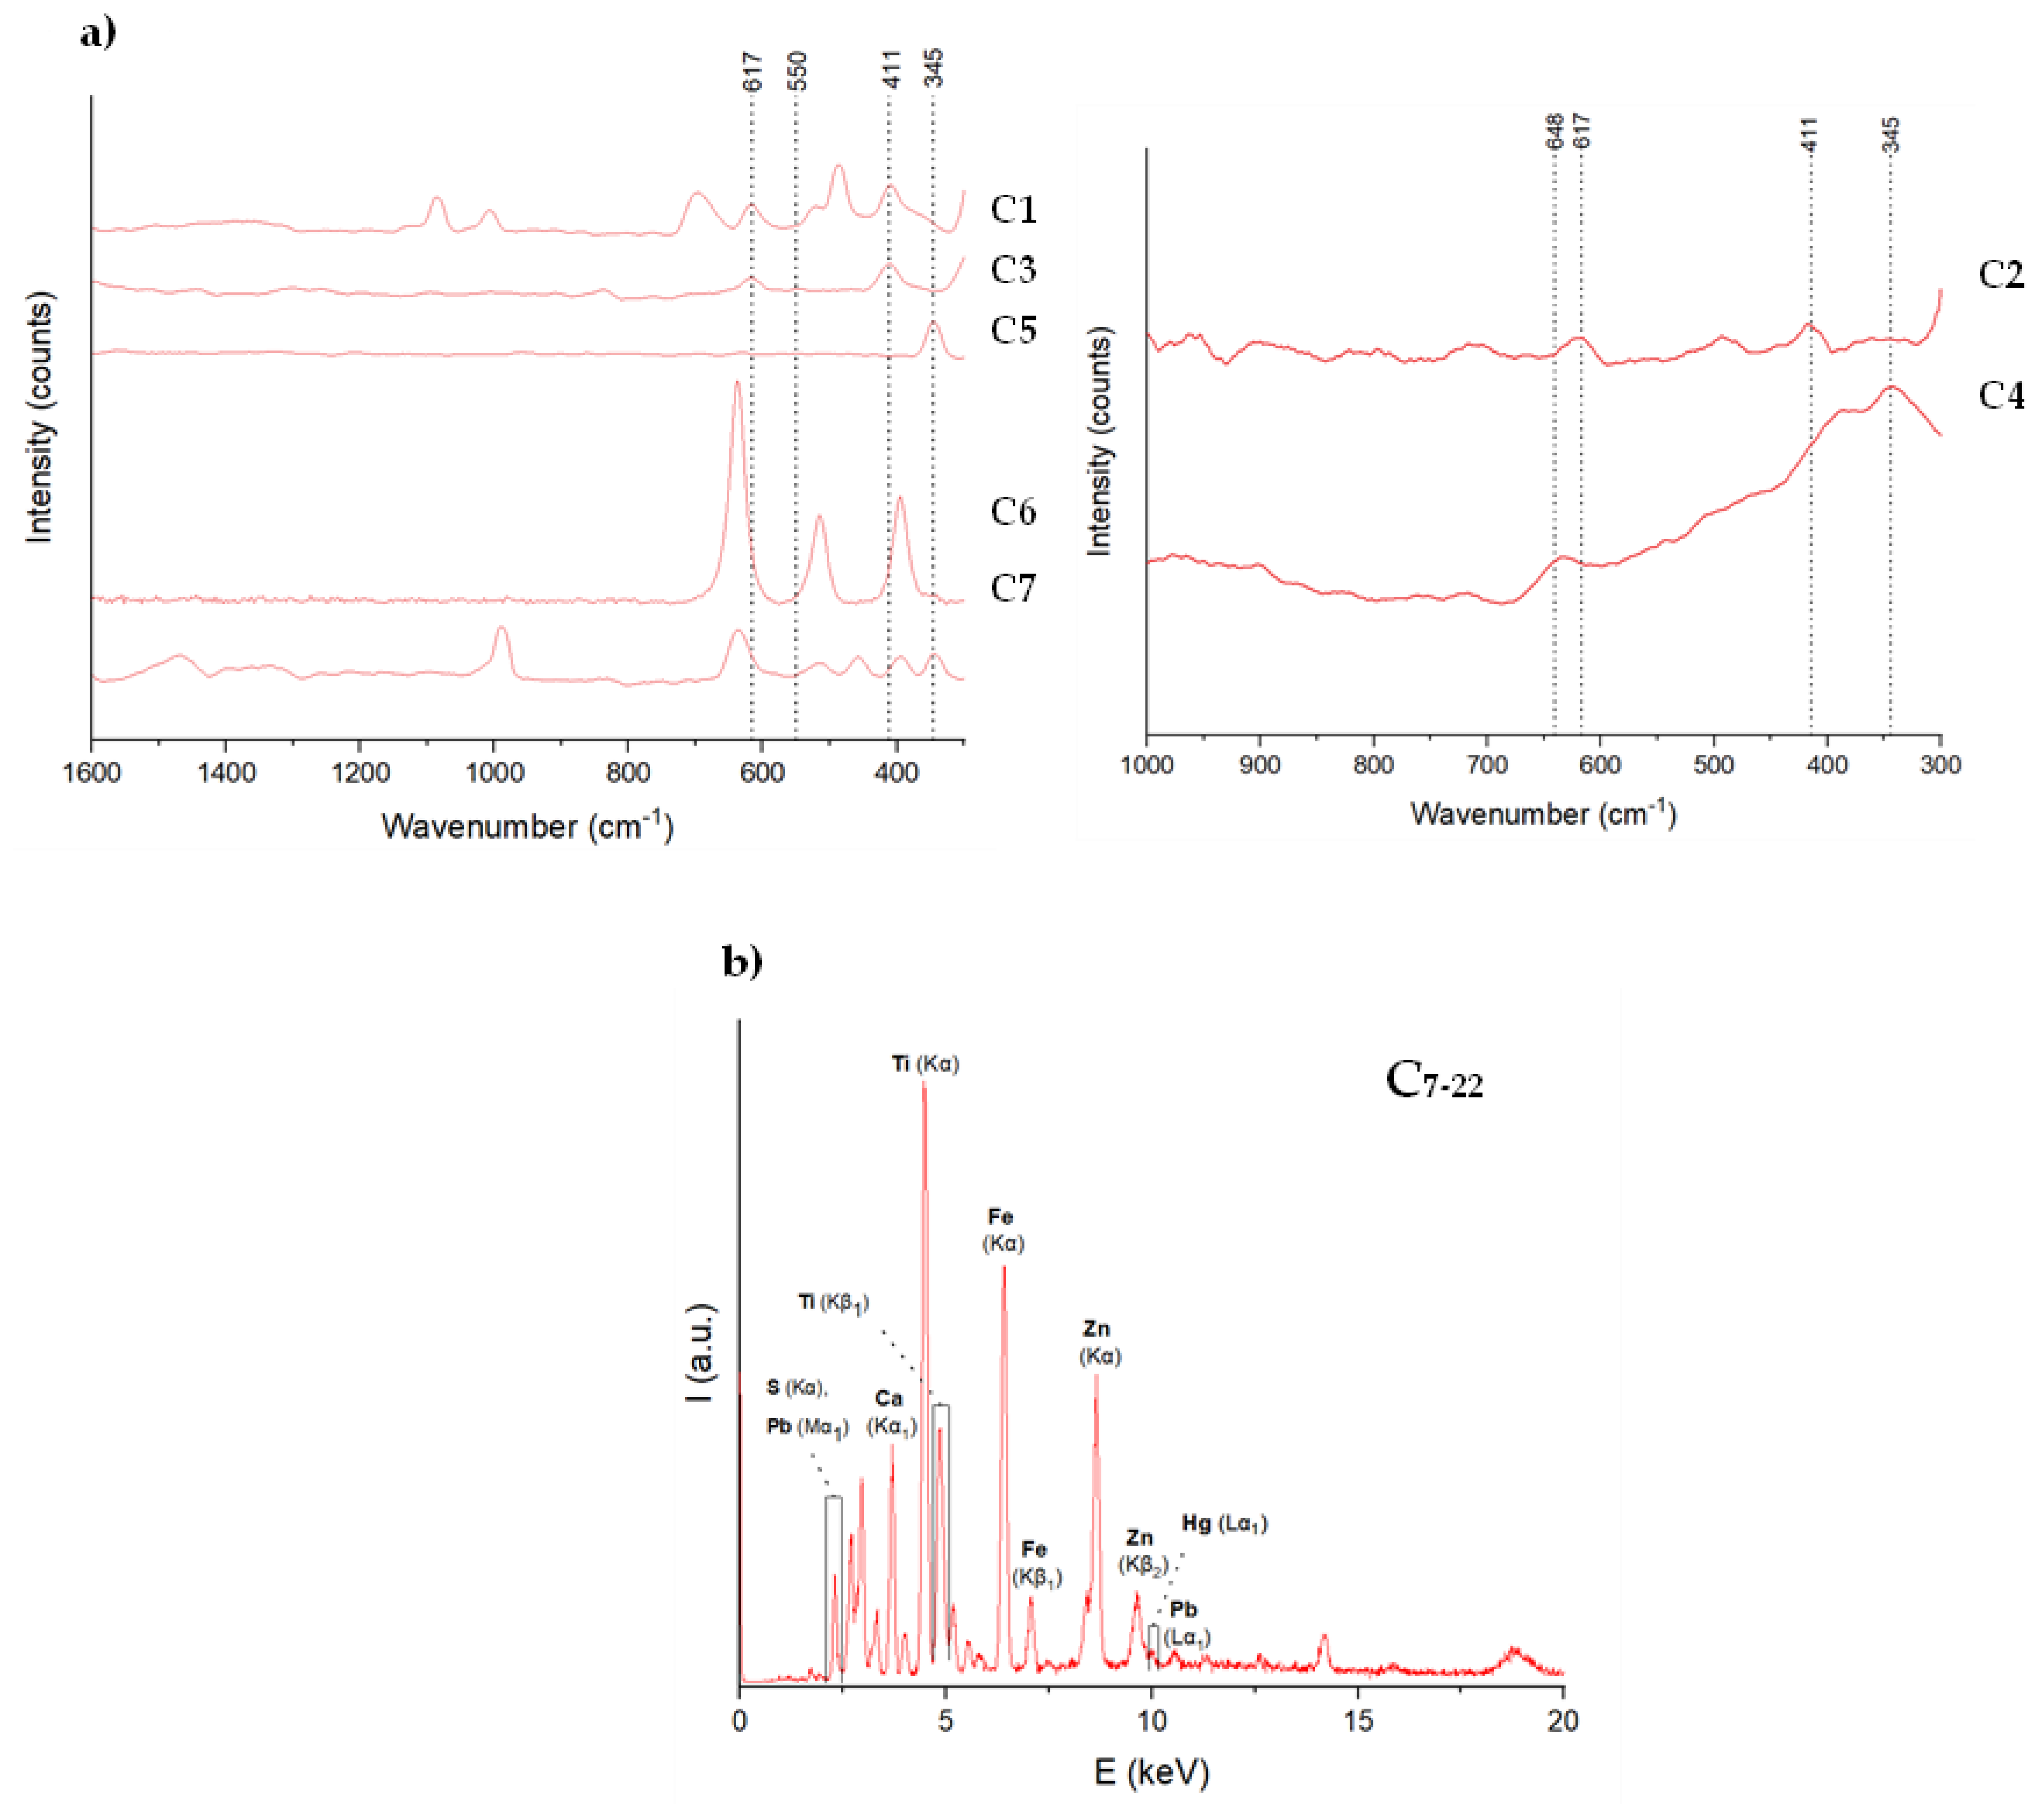
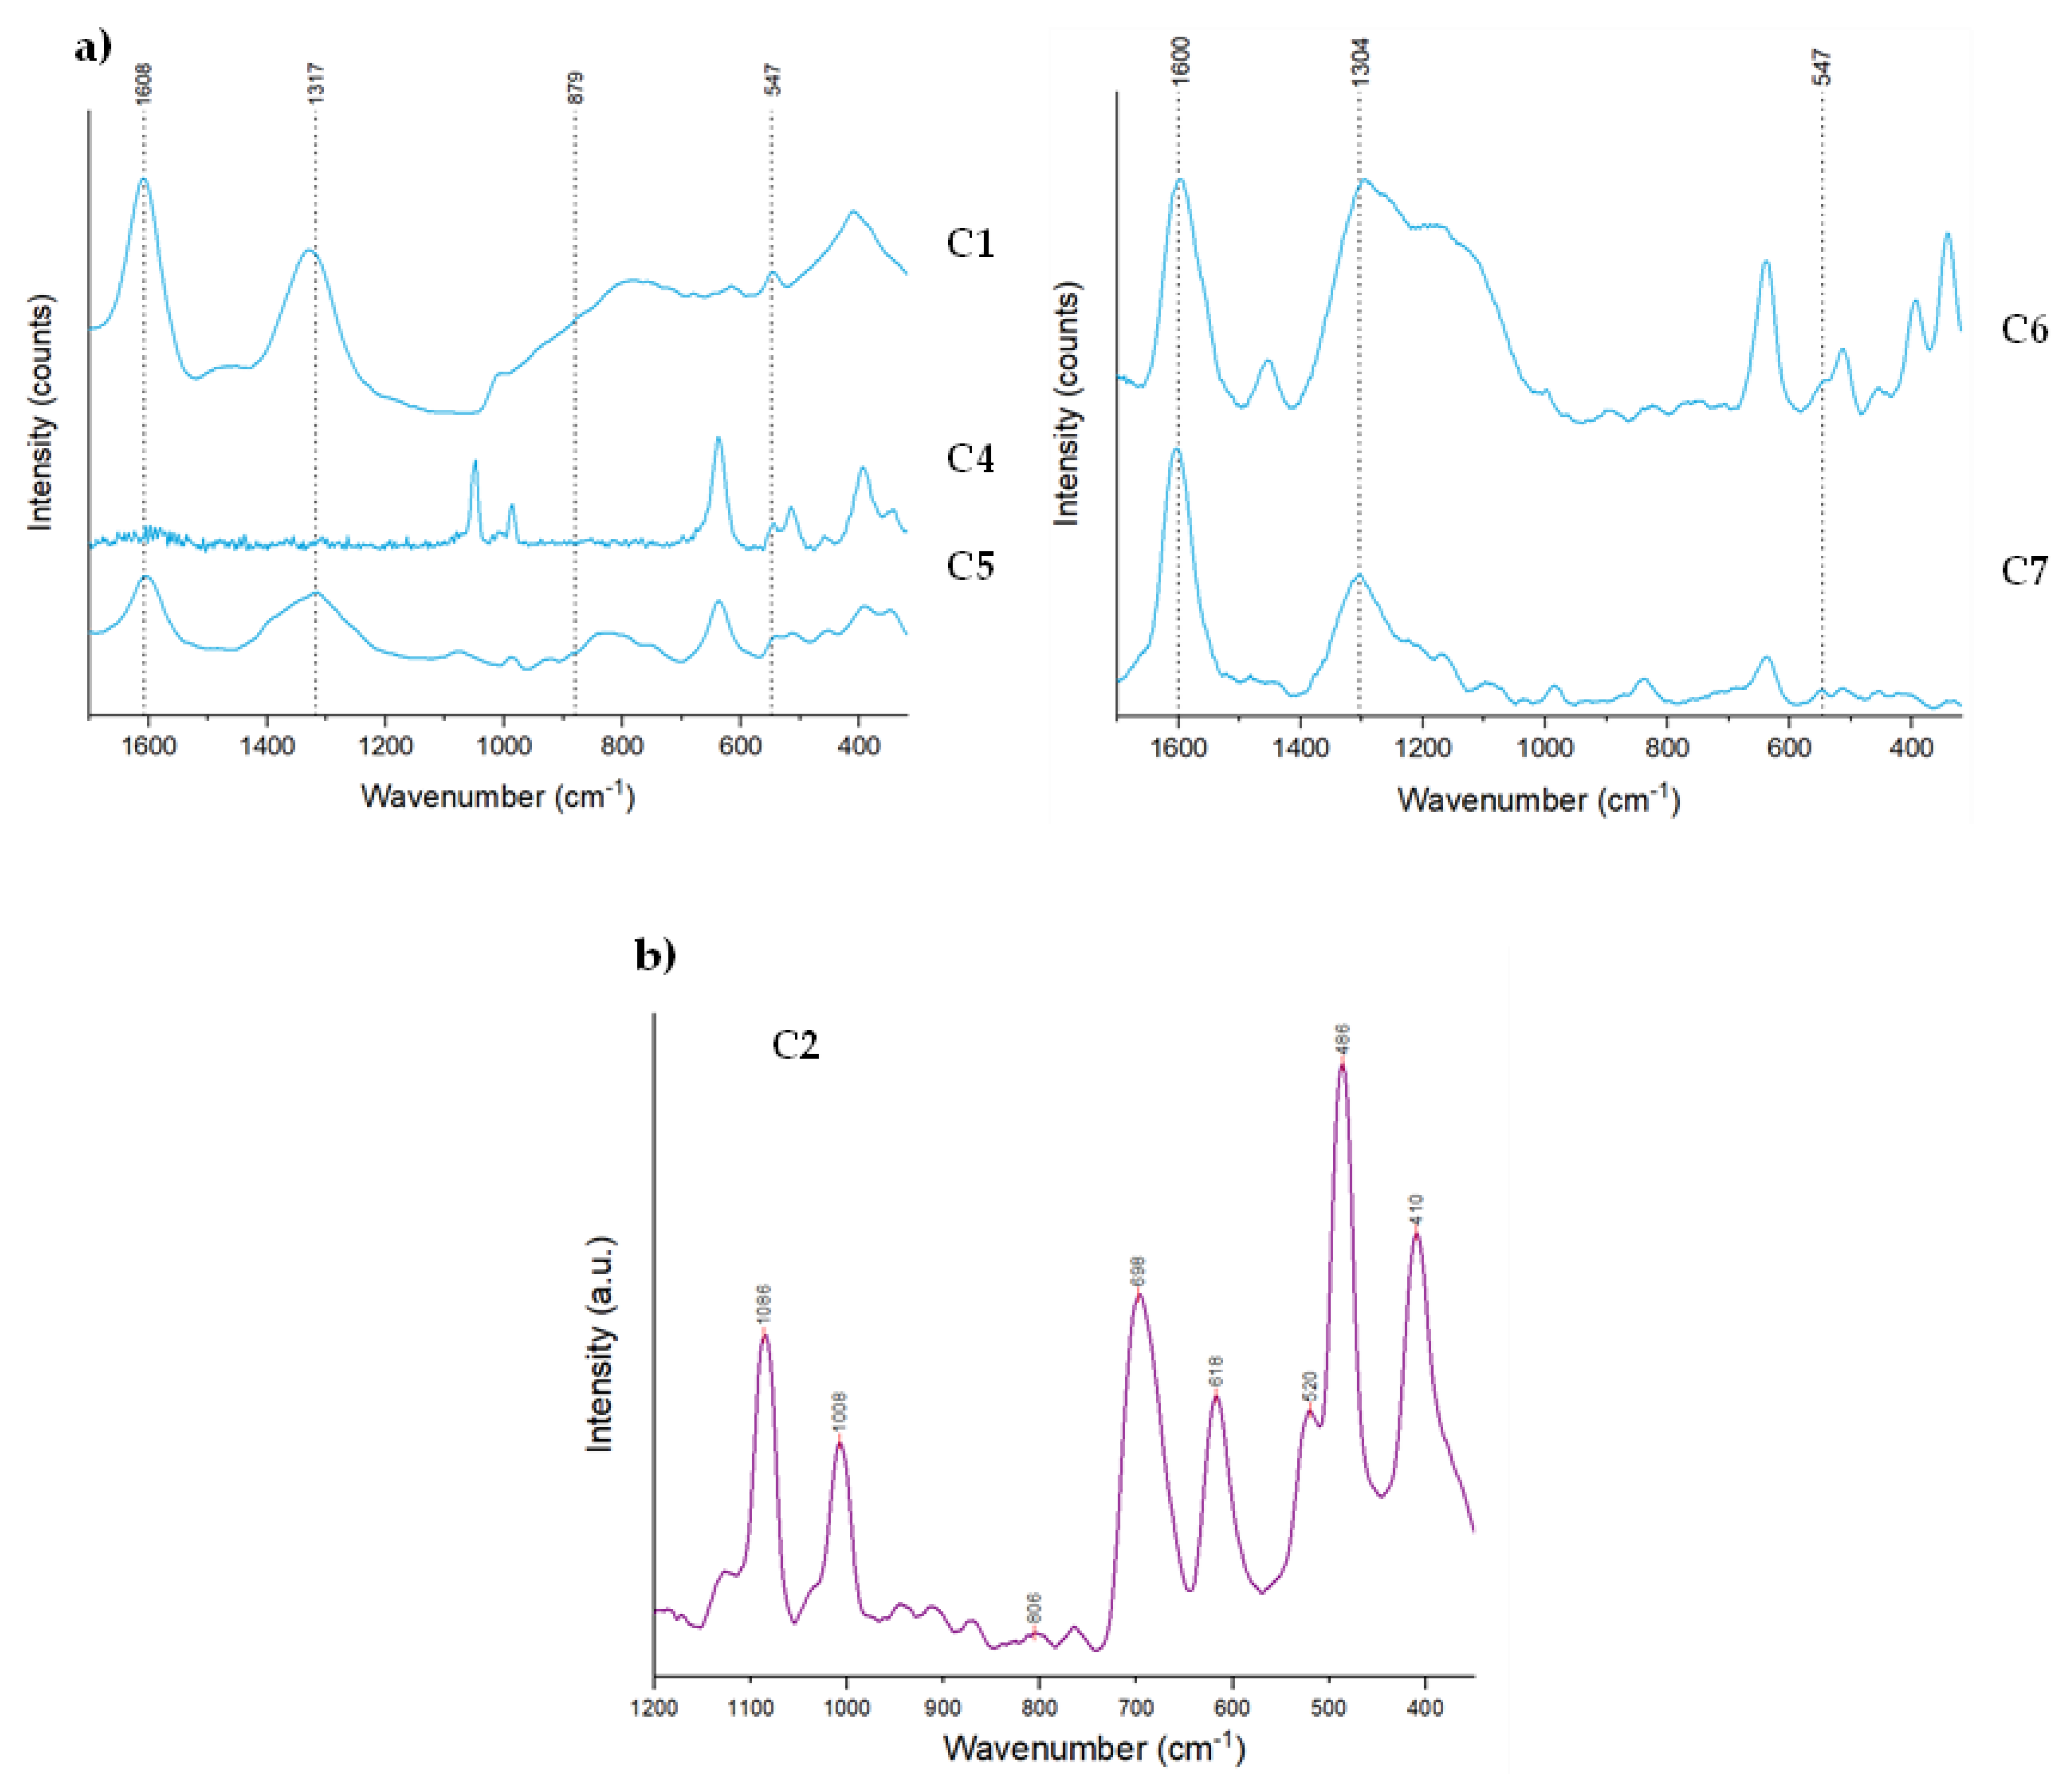
2.1.3. Raman Spectroscopy
2.2. Invasive and/or Micro-Destructive Analytical Techniques
2.2.1. Micro-Sampling and Optical Microscopy (OM)
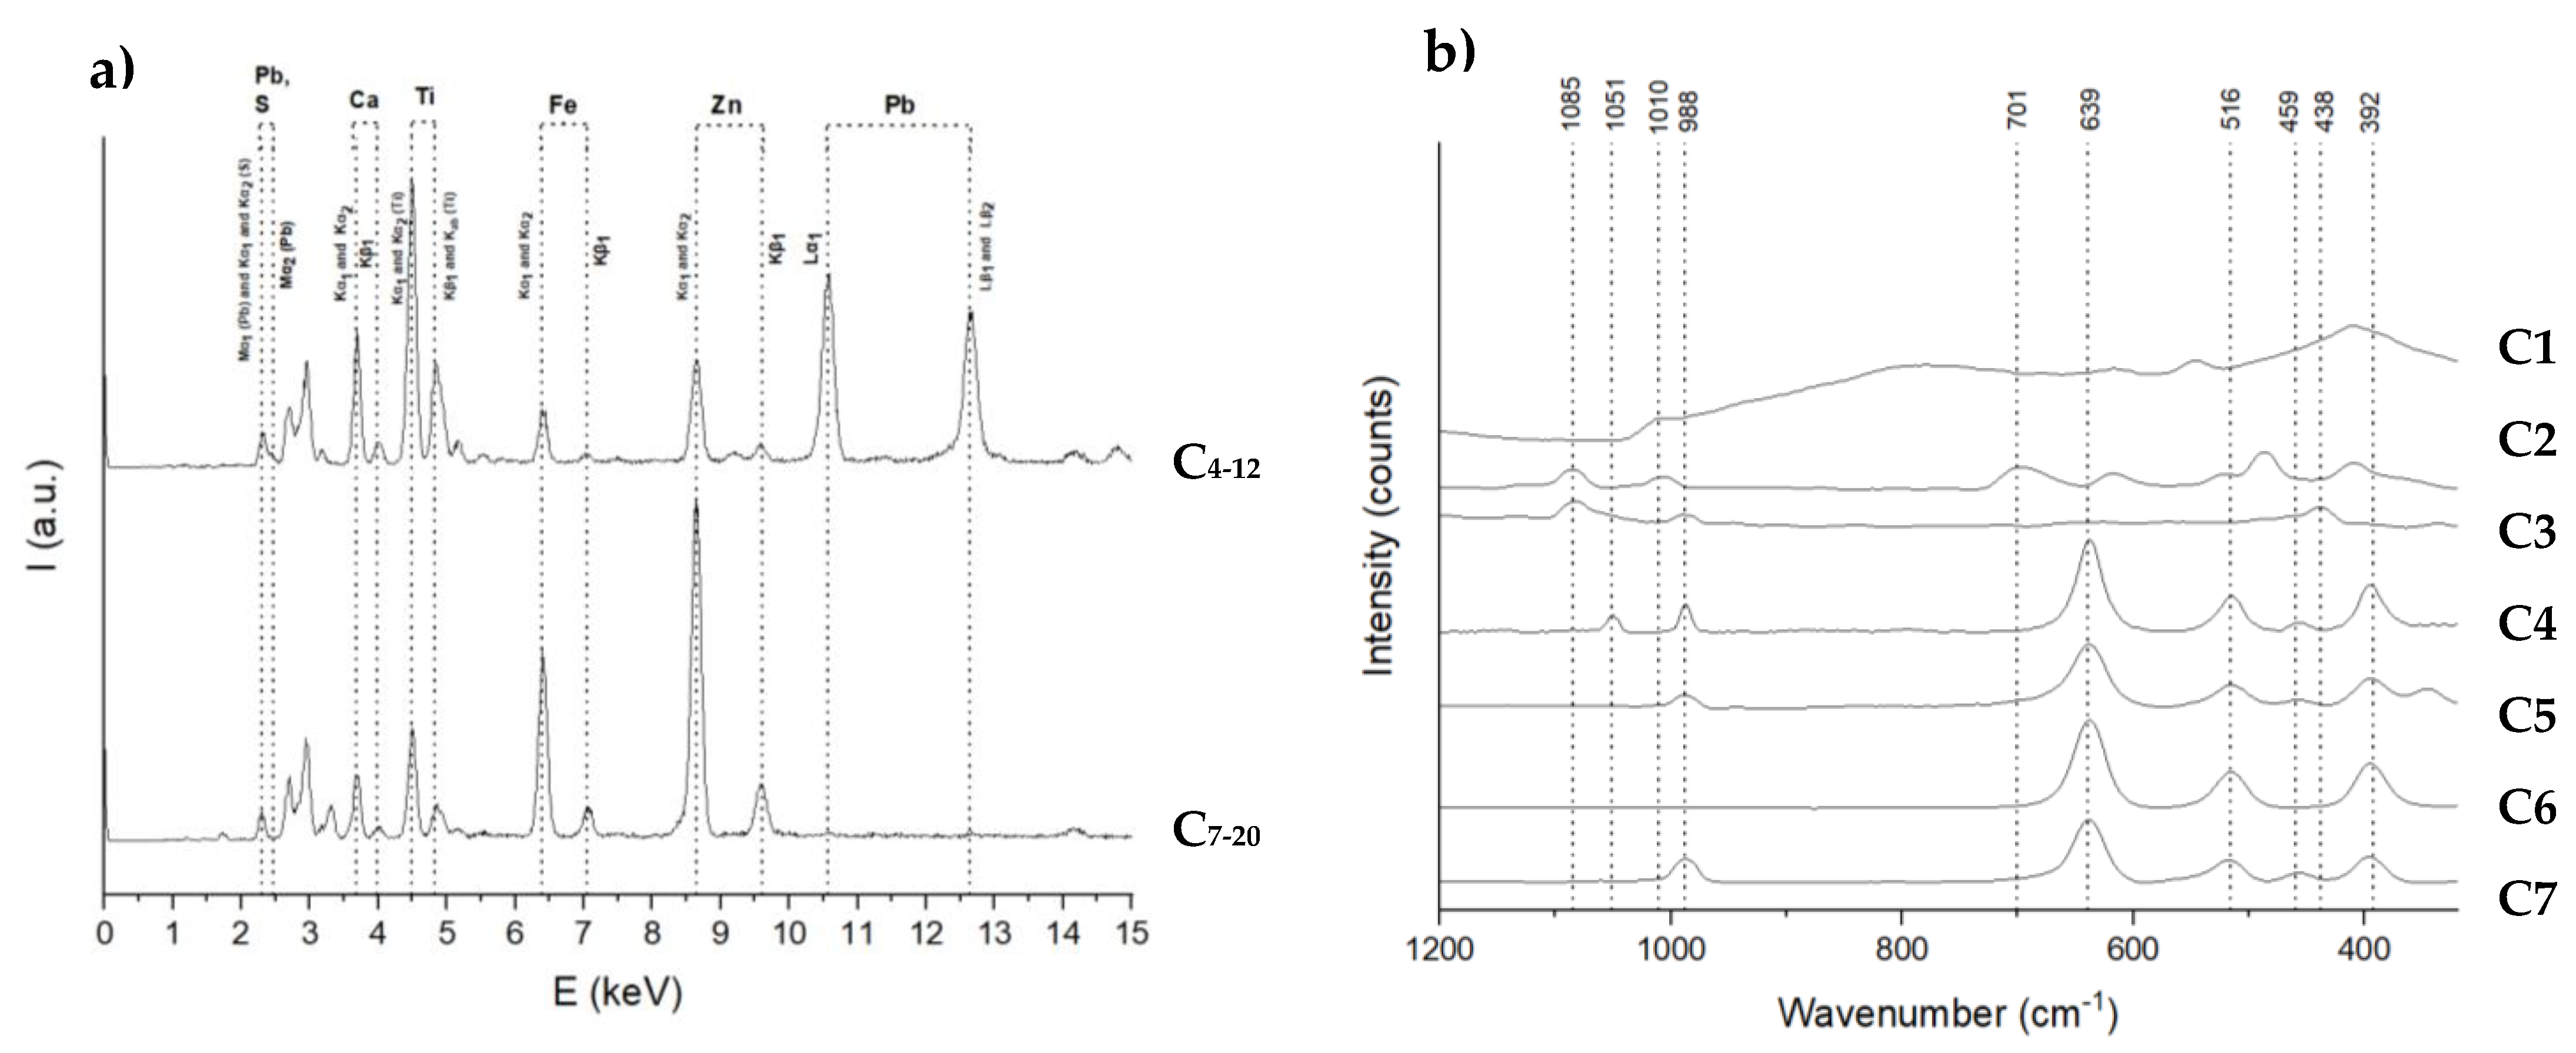
2.2.2. Energy Dispersive X-ray Fluorescence Spectrometry (EDXRF)
2.2.3. Attenuated Total Reflection Fourier Transform Infrared Spectroscopy (ATR-FTIR)
2.2.4. Gas Chromatography-Mass Spectrometry (GC-MS)
3. Results and Discussion
3.1. Preparatory Layer
3.2. Paint Layers
3.2.1. White Paints
3.2.2. Black and Brown Paints
3.2.3. Red Paints
3.2.4. Blue and Purple Paints
3.2.5. Yellow Paints
3.2.6. Green Paints
3.3. Binding Media and Their Degradation Products
3.4. Varnish Layers, Other Additives and Their Degradation Products
3.5. The Technique of Guido Cadorin
4. Conclusions
Author Contributions
Funding
Data Availability Statement
Acknowledgments
Conflicts of Interest
Appendix A

| Painting Index | Sampling Points | Micro-Samples Observed Using OM |
|---|---|---|
| C1 |  |  |
| C2 |  |  |
| C3 |  |  |
| C4 |  | |
| C5 |  |  |
| C6 |  |  |
| C7 |  |  |
Appendix B


References
- Beltinger, K. The Tempera Revival 1800–1950: Historical Background, Methods of Investigation and the Question of Relevance. In Tempera Painting 1800–1950: Experiment and Innovation from the Nazarene Movement to Abstract Art; Archetype Publications Ltd.: London, UK, 2019; pp. 13–20. [Google Scholar]
- Perusini, G.; Perusini, T. The use of tempera by painters and restores in Italy and Latin Europe, c. 1800–1870. In Painting in Tempera, c. 1900; Swiss Institute for Art Research: London, UK, 2016; pp. 25–38. [Google Scholar]
- Perusini, T.; Perusini, G.; Izzo, F.C.; Soccol, G. Tempera Painting in Veneto at the Beginning of the 20th Century. In Tempera Painting 1800–1950. Experiment and Innovation from the Nazarene Movement to Abstract Art; Archetype Publications Ltd.: London, UK, 2019; pp. 97–106. [Google Scholar]
- Dal Canton, G. Guido Cadorin 1892-1976; Marsilio: Venice, Italy, 2007. [Google Scholar]
- Rinaldi, S. Le Tempere Veneziane Di Mariano Fortuny. In L’Imaggine tra Materiale e Virtuali. Contributi in Onore di Silvia Bordini; Academia: San Francisco, CA, USA, 2013. [Google Scholar]
- Izzo, F.C.; Zanin, C.; Keulen, H.; Roit, C. From Pigments to Paints: Studying Original Materials from the Atelier of the Artist Mariano Fortuny y Madrazo. Int. J. Conserv. Sci. 2017, 8, 547–564. [Google Scholar]
- Izzo, F.C.; Perusini, G. Le Tempere Di De Maria, Laurenti, Cadorin, Favai e Casorati: Riscontri Tra Documenti d’archivio, Prove Di Ricostruzione e Analisi Scientifiche. In Tecnica Della Pittura in Italia Fra Ottocento e Novecento, Atti Del Convegno, Venezia 23/03/19; Sargon: Padova, Italy, 2021; pp. 125–149. [Google Scholar]
- Behmann, J.; Acebron, K.; Emin, D.; Bennertz, S.; Matsubara, S.; Thomas, S.; Bohnenkamp, D.; Kuska, M.T.; Jussila, J.; Salo, H.; et al. Specim IQ: Evaluation of a New, Miniaturized Handheld Hyperspectral Camera and Its Application for Plant Phenotyping and Disease Detection. Sensors 2018, 18, 441. [Google Scholar] [CrossRef] [PubMed] [Green Version]
- Cucci, C.; Casini, A.; Stefani, L.; Picollo, M.; Jussila, J. Bridging Research with Innovative Products: A Compact Hyperspectral Camera for Investigating Artworks: A Feasibility Study. In Proceedings of the Optics for Arts, Architecture, and Archaeology VI, Munich, Germany, 25–29 June 2017; Volume 10331, pp. 17–29. [Google Scholar]
- Hayem-Ghez, A.; Ravaud, E.; Boust, C.; Bastian, G.; Menu, M.; Brodie-Linder, N. Characterizing Pigments with Hyperspectral Imaging Variable False-Color Composites. Appl. Phys. A 2015, 121, 939–947. [Google Scholar] [CrossRef]
- Rashmi, S.; Addamani, S.; Ravikiran, A. Spectral Angle Mapper Algorithm for Remote Sensing Image Classification. Int. J. Innov. Sci. Eng. Technol. 2014, 50, 201–205. [Google Scholar]
- Marcello Picollo, A.C. A New Compact VNIR Hyperspectral Imaging System for Non-Invasive Analysis in the FineArt and Architecture Fields. Available online: https://books.fupress.com/catalogue/a-new-compact-vnir-hyperspectral-imaging-system-for-non-invasive-analysis-in-the-fineart-and-archite/4227 (accessed on 15 December 2022).
- Piccolo, M.; Cucci, C.; Casini, A.; Stefani, L. Hyper-Spectral Imaging Technique in the Cultural Heritage Field: New Possible Scenarios. Sensors 2020, 20, 2843. [Google Scholar] [CrossRef]
- Košek, F.; Culka, A.; Rousaki, A.; Vandenabeele, P.; Jehlička, J. Evaluation of Handheld and Portable Raman Spectrometers with Different Laser Excitation Wavelengths for the Detection and Characterization of Organic Minerals. Spectrochim. Acta Part A Mol. Biomol. Spectrosc. 2020, 243, 118818. [Google Scholar] [CrossRef]
- Odelli, E.; Rousaki, A.; Raneri, S.; Vandenabeele, P. Advantages and Pitfalls of the Use of Mobile Raman and XRF Systems Applied on Cultural Heritage Objects in Tuscany (Italy). Eur. Phys. J. Plus 2021, 136, 449. [Google Scholar] [CrossRef]
- Culka, A.; Hyršl, J.; Jehlička, J. Gem and Mineral Identification Using GL Gem Raman and Comparison with Other Portable Instruments. Appl. Phys. A 2016, 122, 959. [Google Scholar] [CrossRef]
- NIST. X-ray Transition Energies Database. 2009. Available online: https://www.nist.gov/pml/x-ray-transition-energies-database (accessed on 14 December 2022).
- Deslattes, R.D.; Kessler, E.G.; Indelicato, P.; de Billy, L.; Lindroth, E.; Anton, J. X-ray Transition Energies: New Approach to a Comprehensive Evaluation. Rev. Mod. Phys. 2003, 75, 35–99. [Google Scholar] [CrossRef]
- Carava, S.; Roldan Garcia, C.; Vazquez de Agredos-Pascual, M.L.; Murcia Mascaros, S.; Izzo, F.C. Investigation of modern oil paints through a physico-chemical integrated approach. Emblematic cases from Valencia, Spain. Spectrochim. Acta Part A Mol. Biomol. Spectrosc. 2020, 240, 118633. [Google Scholar] [CrossRef]
- Fuster-López, L.; Izzo, F.C.; Damato, V.; Yusà-Marco, D.J.; Zendri, E. An insight into the mechanical properties of selected commercial oil and alkyd paint films containing cobalt blue. J. Cult. Herit. 2019, 35, 225–234. [Google Scholar] [CrossRef]
- Izzo, F.C.; van den Berg, K.J.; van Keulen, H.; Ferriani, B.; Zendri, E. Modern Oil Paints—Formulations, Organic Additives and Degradation: Some Case Studies. In Issues in Contemporary Oil Paint; van den Berg, K.J., Burnstock, A., de Keijzer, M., Krueger, J., Learner, T., de Tagle, A., Heydenreich, G., Eds.; Springer International Publishing: Cham, Switzerland, 2014; pp. 75–104. [Google Scholar]
- Bonaduce, I.; Andreotti, A. Py-GC/MS of Organic Paint Binders. In Organic Mass Spectrometry in Art and Archaeology; Wiley: New York, NY, USA, 2009; pp. 303–326. [Google Scholar]
- Fuster-López, L.; Izzo, F.C.; Andersen, C.K.; Murray, A.; Vila, A.; Picollo, M.; Stefani, L.; Jiménez, R. Picasso’s 1917 paint materials and their influence on the condition of four paintings. SN Appl. Sci. 2020, 2, 2159. [Google Scholar] [CrossRef]
- Schilling, M.; Khanjian, H.; Carson, D.M. Fatty Acid and Glycerol Content of Lipids; Effects of Ageing and Solvent Extraction on the Composition of Oil Paints = Acides Gras et Glycerol Des Lipides; Effets Du Vieillissement Sur La Composition Des Peintures a l’huile et Extraction Par Solvant. Techne La Sci. Au Serv. De L’histoire De L’art Et Des Civilis. 1997, 5, 71–78. [Google Scholar]
- Izzo, F.C.; Källbom, A.; Nevin, A. Multi-Analytical Assessment of Bodied Drying Oil Varnishes and Their Use as Binders in Armour Paints. Heritage 2021, 4, 3402–3420. [Google Scholar] [CrossRef]
- Marucci, G.; Beeby, A.; Parker, A.W.; Nicholson, C.E. Raman Spectroscopic Library of Medieval Pigments Collected with Five Different Wavelengths for Investigation of Illuminated Manuscripts. Anal. Methods 2018, 10, 1219–1236. [Google Scholar] [CrossRef] [Green Version]
- Murphy, J. CHAPTER 7—Modifying Specific Properties: Appearance—Black and White Pigmentation. In Additives for Plastics Handbook, 2nd ed.; Murphy, J., Ed.; Elsevier Science: Amsterdam, The Netherlands, 2001; pp. 73–92. ISBN 978-1-85617-370-4. [Google Scholar]
- Rogge, C.; Arslanoglu, J. Luminescence of Coprecipitated Titanium White Pigments: Implications for Dating Modern Art. Sci. Adv. 2019, 5, eaav0679. [Google Scholar] [CrossRef] [Green Version]
- Gunasekaran, S.; Anbalagan, G.; Pandi, S. Raman and Infrared Spectra of Carbonates of Calcite Structure. J. Raman Spectrosc. 2006, 37, 892–899. [Google Scholar] [CrossRef]
- Burgio, L.; Clark, R.J.H. Library of FT-Raman Spectra of Pigments, Minerals, Pigment Media and Varnishes, and Supplement to Existing Library of Raman Spectra of Pigments with Visible Excitation. Spectrochim. Acta Part A Mol. Biomol. Spectrosc. 2001, 57, 1491–1521. [Google Scholar] [CrossRef]
- Hibberts, S.; Edwards, H.G.M.; Abdel-Ghani, M.; Vandenabeele, P. Raman Spectroscopic Analysis of a ‘Noli Me Tangere’ Painting. Philos. Trans. R. Soc. Lond. Ser. A Math. Phys. Eng. Sci. 2016, 374, 20160044. [Google Scholar] [CrossRef] [Green Version]
- Lončar, E.S.; Lomić, G.A.; Malbaša, R.V.; Kolarov, L.A. Preparation and Characterization of Aluminum Stearate. Acta Period. Technol. 2003, 34, 55–60. [Google Scholar] [CrossRef]
- Baij, L.; Hermans, J.J.; Keune, K.; Iedema, P. Time-Dependent ATR-FTIR Spectroscopic Studies on Fatty Acid Diffusion and the Formation of Metal Soaps in Oil Paint Model Systems. Angew. Chem. Int. Ed. 2018, 57, 7351–7354. [Google Scholar] [CrossRef] [Green Version]
- van Driel, B.; Phenix, A.; Soldano, A.; Van den Berg, K.J. The Might of White: Formulations of Titanium-Dioxide Based Oil Paints as Evidenced in Archives of Two Artists’ Colourmen Mid-Twentieth Century. In Proceedings of the ICOM-CC Triennial Conference Proceedings, Copenhagen, Denmark, 4–8 September 2017. [Google Scholar]
- van Driel, B.A.; van den Berg, K.J.; Smout, M.; Dekker, N.; Kooyman, P.J.; Dik, J. Investigating the Effect of Artists’ Paint Formulation on Degradation Rates of TiO2-Based Oil Paints. Herit. Sci. 2018, 6, 21. [Google Scholar] [CrossRef] [Green Version]
- Youssry, M.; Kamand, F.; Magzoub, M.; Nasser, M. Aqueous Dispersions of Carbon Black and Its Hybrid with Carbon Nanofibers. RSC Adv. 2018, 8, 32119–32131. [Google Scholar] [CrossRef] [PubMed]
- Ivory Black—Database of ATR-FT-IR Spectra of Various Materials. Available online: https://spectra.chem.ut.ee/paint/pigments/ivory-black/ (accessed on 18 November 2022).
- De Chirico, G. Piccolo Trattato di Tecnica Pittorica; Libri Scheiwiller: Milan, Italy, 2001. [Google Scholar]
- Aceto, M.; Agostino, A.; Fenoglio, G.; Idone, A.; Gulmini, M.; Picollo, M.; Ricciardi, P.; Delaney, J.K. Characterisation of Colourants on Illuminated Manuscripts by Portable Fibre Optic UV-Visible-NIR Reflectance Spectrophotometry. Anal. Methods 2014, 6, 1488. [Google Scholar] [CrossRef]
- Jubb, A.M.; Allen, H.C. Vibrational Spectroscopic Characterization of Hematite, Maghemite, and Magnetite Thin Films Produced by Vapor Deposition. ACS Appl. Mater. Interfaces 2010, 2, 2804–2812. [Google Scholar] [CrossRef]
- de Faria, D.L.A.; Lopes, F.N. Heated Goethite and Natural Hematite: Can Raman Spectroscopy Be Used to Differentiate Them? Vib. Spectrosc. 2007, 45, 117–121. [Google Scholar] [CrossRef]
- Miguel, C.; Barrocas-Dias, C.; Ferreira, T.; Candeias, A. The Comparative Study of Four Portuguese Sixteenth-Century Illuminated Manueline Charters Based on Spectroscopy and Chemometrics Analysis. Appl. Phys. A 2016, 123, 72. [Google Scholar] [CrossRef]
- Rodríguez-Simón, L.R.; Sol López, V.D.; Ángel LeónColoma, M. Microscopic Identification of Vine Black Pigment in A Tempera Painting By Francisco De Goya. SM Anal. Bioanal. Tech. 2017, 2, 1–8. [Google Scholar] [CrossRef]
- Zumbühl, S.; Zindel, C. Historical Siccatives for Oil Paint and Varnishes—The Use of Lead Oxide, Alum, White Vitriol, Pumice, Bone Ash and Venetian Glass as Driers: Historical Written Sources—Production and Raw Material Quality—Technological Significance; HDW Publications: Bern, Switzerland, 2022. [Google Scholar]
- Impiego Della Biacca Nella Pittura, Legge 19 Luglio 1961, n. 706. Normativa Nazionale Settor: Rome, Italy, 1961; Volume 4.10.
- Tumosa, C.S.; Mecklenburg, M.F. The Influence of Lead Ions on the Drying of Oils. Stud. Conserv. 2005, 50, 39–47. [Google Scholar] [CrossRef] [Green Version]
- Aceto, M.; Agostino, A.; Fenoglio, G.; Marcello, P. Non-Invasive Differentiation between Natural and Synthetic Ultramarine Blue Pigments by Means of 250–900 Nm FORS Analysis. Anal. Methods 2013, 5, 4184. [Google Scholar] [CrossRef]
- Yivlialin, R.; Galli, A.; Raimondo, L.; Martini, M.; Sassella, A. Detecting the NIR Fingerprint of Colors: The Characteristic Response of Modern Blue Pigments. Heritage 2019, 2, 2255–2261. [Google Scholar] [CrossRef] [Green Version]
- Ultramarine Blue—Database of ATR-FT-IR Spectra of Various Materials. Available online: https://spectra.chem.ut.ee/paint/pigments/ultramarine-blue/ (accessed on 18 November 2022).
- Miliani, C.; Rosi, F.; Daveri, A.; Brunetti, B.G. Reflection Infrared Spectroscopy for the Non-Invasive in Situ Study of Artists’ Pigments. Appl. Phys. A 2011, 106, 295. [Google Scholar] [CrossRef]
- Montagner, C.; Sanches, D.; Pedroso, J.; Melo, M.J.; Vilarigues, M. Ochres and Earths: Matrix and Chromophores Characterization of 19th and 20th Century Artist Materials. Acta Part A Mol. Biomol. Spectrosc. 2013, 103, 409–416. [Google Scholar] [CrossRef]
- Vahur, S.; Teearu, A.; Leito, I. ATR-FT-IR Spectroscopy in the Region of 550–230 cm−1 for Identification of Inorganic Pigments. Spectrochim. Acta Part A Mol. Biomol. Spectrosc. 2010, 75, 1061–1072. [Google Scholar] [CrossRef]
- Weckhuysen, B.M.; Wachs, I.E. Raman Spectroscopy of Supported Chromium Oxide Catalysts. Determination of Chromium—Oxygen Bond Distances and Bond Orders. J. Chem. Soc. Faraday Trans. 1996, 92, 1969–1973. [Google Scholar] [CrossRef] [Green Version]
- Kendix, E.L. Trasmission and Reflection (ATR)Far-Infrared Spectroscopy Applied in the Analysis of Cultural Heritage Materials. Ph.D. Thesis, Alma Mater Studiorum—Università di Bologna, Bologna, Italy, 2009. [Google Scholar]
- Pagnin, L. Characterization and Quantification of Modern Painting Materials by IR and Raman Spectroscopies. Master’s Thesis, Ca’ Foscari University, Venice, Italy, 2017. [Google Scholar]
- Hayes, P.A.; Vahur, S.; Leito, I. ATR-FTIR Spectroscopy and Quantitative Multivariate Analysis of Paints and Coating Materials. Spectrochim. Acta Part A Mol. Biomol. Spectrosc. 2014, 133, 207–213. [Google Scholar] [CrossRef]
- Nickless, E.; Holroyd, S. Raman Imaging of Protein in a Model Cheese System. J. Spectr. Imaging 2020, 9, a9. [Google Scholar] [CrossRef]
- Calcite—Database of ATR-FT-IR Spectra of Various Materials. Available online: https://spectra.chem.ut.ee/paint/fillers/calcite/ (accessed on 19 November 2022).
- Degioanni, S.; Jurdyc, A.M.; Cheap, A.; Champagnon, B.; Bessueille, F.; Coulm, J.; Bois, L.; Vouagner, D. Surface-Enhanced Raman Scattering of Amorphous Silica Gel Adsorbed on Gold Substrates for Optical Fiber Sensors. J. Appl. Phys. 2015, 118, 153103. [Google Scholar] [CrossRef]
- Rampazzi, L.; Corti, C.; Geminiani, L.; Recchia, S. Unexpected Findings in 16th Century Wall Paintings: Identification of Aragonite and Unusual Pigments. Heritage 2021, 4, 2431–2448. [Google Scholar] [CrossRef]
- Carlyle, L. The Artist’s Assistant: Oil Painting Instruction Manuals and Handbooks in Britain 1800–1900, with Reference to Selected Eighteenth-Century Sources; Oil Painting Instruction Manuals and Handbooks in Britain 1800–1900; Archetype Publications: London, UK, 2001. [Google Scholar]
- Hermans, J.J.; Keune, K.; van Loon, A.; Iedema, P.D. An Infrared Spectroscopic Study of the Nature of Zinc Carboxylates in Oil Paintings. J. Anal. Atomic Spectrom. 2015, 30, 1600–1608. [Google Scholar] [CrossRef] [Green Version]
- Ebert, B.; Osmond, G. Zinc Oxide-Centred Deterioration in 20 Th Century Vietnamese Paintings by Nguyễ Trọng Kiệm (1933–1991). AICCM Bull. 2014, 34, 4–14. [Google Scholar] [CrossRef]
- Švarcová, S.; Kočí, E.; Plocek, J.; Zhankina, A.; Hradilová, J.; Bezdička, P. Saponification in Egg Yolk-Based Tempera Paintings with Lead-Tin Yellow Type I. J. Cult. Herit. 2019, 38, 8–19. [Google Scholar] [CrossRef]
- Izzo, F.C.; Kratter, M.; Nevin, A.; Zendri, E. A Critical Review on the Analysis of Metal Soaps in Oil Paintings. ChemistryOpen 2021, 10, 904–921. [Google Scholar] [CrossRef] [PubMed]
- Tammekivi, E.; Vahur, S.; Vilbaste, M.; Leito, I. Quantitative GC–MS Analysis of Artificially Aged Paints with Variable Pigment and Linseed Oil Ratios. Molecules 2021, 26, 2218. [Google Scholar] [CrossRef] [PubMed]
- Plater, M.J.; De Silva, B.; Gelbrich, T.; Hursthouse, M.B.; Higgitt, C.L.; Saunders, D.R. The Characterisation of Lead Fatty Acid Soaps in ‘Protrusions’ in Aged Traditional Oil Paint. Polyhedron 2003, 22, 3171–3179. [Google Scholar] [CrossRef]
- Bonaduce, I.; Ribechini, E.; Modugno, F.; Colombini, M.P. Analytical Approaches Based on Gas Chromatography Mass Spectrometry (GC/MS) to Study Organic Materials in Artworks and Archaeological Objects. Top. Curr. Chem. 2016, 374, 6. [Google Scholar] [CrossRef]
- Shilling, M.R.; Carson, D.M.; Khanjian, H.P. Evaporation of Fatty Acids and the Formation of Ghost Images by Framed Oil Paintings. Available online: https://cool.culturalheritage.org/waac/wn/wn21/wn21-1/wn21-106.html (accessed on 28 November 2022).
- Colombini, M.; Modugno, F.; Menicagli, E.; Fuoco, R.; Giacomelli, A. GC-MS Characterization of Proteinaceous and Lipid Binders in UV Aged Polychrome Artifacts. Microchem. J. 2000, 67, 291–300. [Google Scholar] [CrossRef]
- Daher, C.; Paris, C.; Le Hô, A.-S.; Bellot-Gurlet, L.; Échard, J.-P. A Joint Use of Raman and Infrared Spectroscopies for the Identification of Natural Organic Media Used in Ancient Varnishes. J. Raman Spectrosc. 2010, 41, 1494–1499. [Google Scholar] [CrossRef] [Green Version]
- Scalarone, D.; Lazzari, M.; Chiantore, O. Ageing Behaviour and Analytical Pyrolysis Characterisation of Diterpenic Resins Used as Art Materials: Manila Copal and Sandarac. J. Anal. Appl. Pyrolysis 2003, 68–69, 115–136. [Google Scholar] [CrossRef]
- Van den Berg, K.J. Analysis of Diterpenoid Resins and Polymers in Paint Media and Varnishes. With an Atlas of Mass Spectra; FOM Institute AMOLF: Amsterdam, The Netherlands, 2012. [Google Scholar]
- Ciofini, D.; Striova, J.; Camaiti, M.; Siano, S. Photo-Oxidative Kinetics of Solvent and Oil-Based Terpenoid Varnishes. Polym. Degrad. Stabil. 2016, 123, 47–61. [Google Scholar] [CrossRef] [Green Version]
- Pintus, V.; Baragona, A.J.; Wieland, K.; Schilling, M.; Miklin-Kniefacz, S.; Haisch, C.; Schreiner, M. Comprehensive Multi-Analytical Investigations on the Vietnamese Lacquered Wall-Panel “The Return of the Hunters” by Jean Dunand. Sci. Rep. 2019, 9, 18837. [Google Scholar] [CrossRef] [Green Version]
- Ortiz Miranda, A.S.; Kronkright, D.; Walton, M. The Influence of Commercial Primed Canvases in the Manifestation of Metal Soaps Protrusions in Georgia O’Keeffe’s Oil Paintings. Herit. Sci. 2020, 8, 107. [Google Scholar] [CrossRef]
- Socrates, G.; Socrates, G. Infrared and Raman Characteristic Group Frequencies: Tables and Charts, 3rd ed.; Wiley: Chichester, UK; New York, NY, USA, 2001; ISBN 978-0-471-85298-8. [Google Scholar]
- Macchia, A.; Biribicchi, C.; Rivaroli, L.; Aureli, H.; Cerafogli, E.; Colasanti, I.A.; Carnazza, P.; Demasi, G.; La Russa, M.F. Combined Use of Non-Invasive and Micro-Invasive Analytical Investigations to Understand the State of Conservation and the Causes of Degradation of I Tesori Del Mare (1901) by Plinio Nomellini. Methods Protoc. 2022, 5, 52. [Google Scholar] [CrossRef]
- Lluveras-Tenorio, A.; Orsini, S.; Pizzimenti, S.; Del Seppia, S.; Colombini, M.P.; Duce, C.; Bonaduce, I. Development of a GC–MS Strategy for the Determination of Cross-Linked Proteins in 20th Century Paint Tubes. Microchem. J. 2021, 170, 106633. [Google Scholar] [CrossRef]
- Palmieri, M.; Vagnini, M.; Pitzurra, L.; Brunetti, B.G.; Cartechini, L. Identification of Animal Glue and Hen-Egg Yolk in Paintings by Use of Enzyme-Linked Immunosorbent Assay (ELISA). Anal. Bioanal. Chem. 2013, 405, 6365–6371. [Google Scholar] [CrossRef]


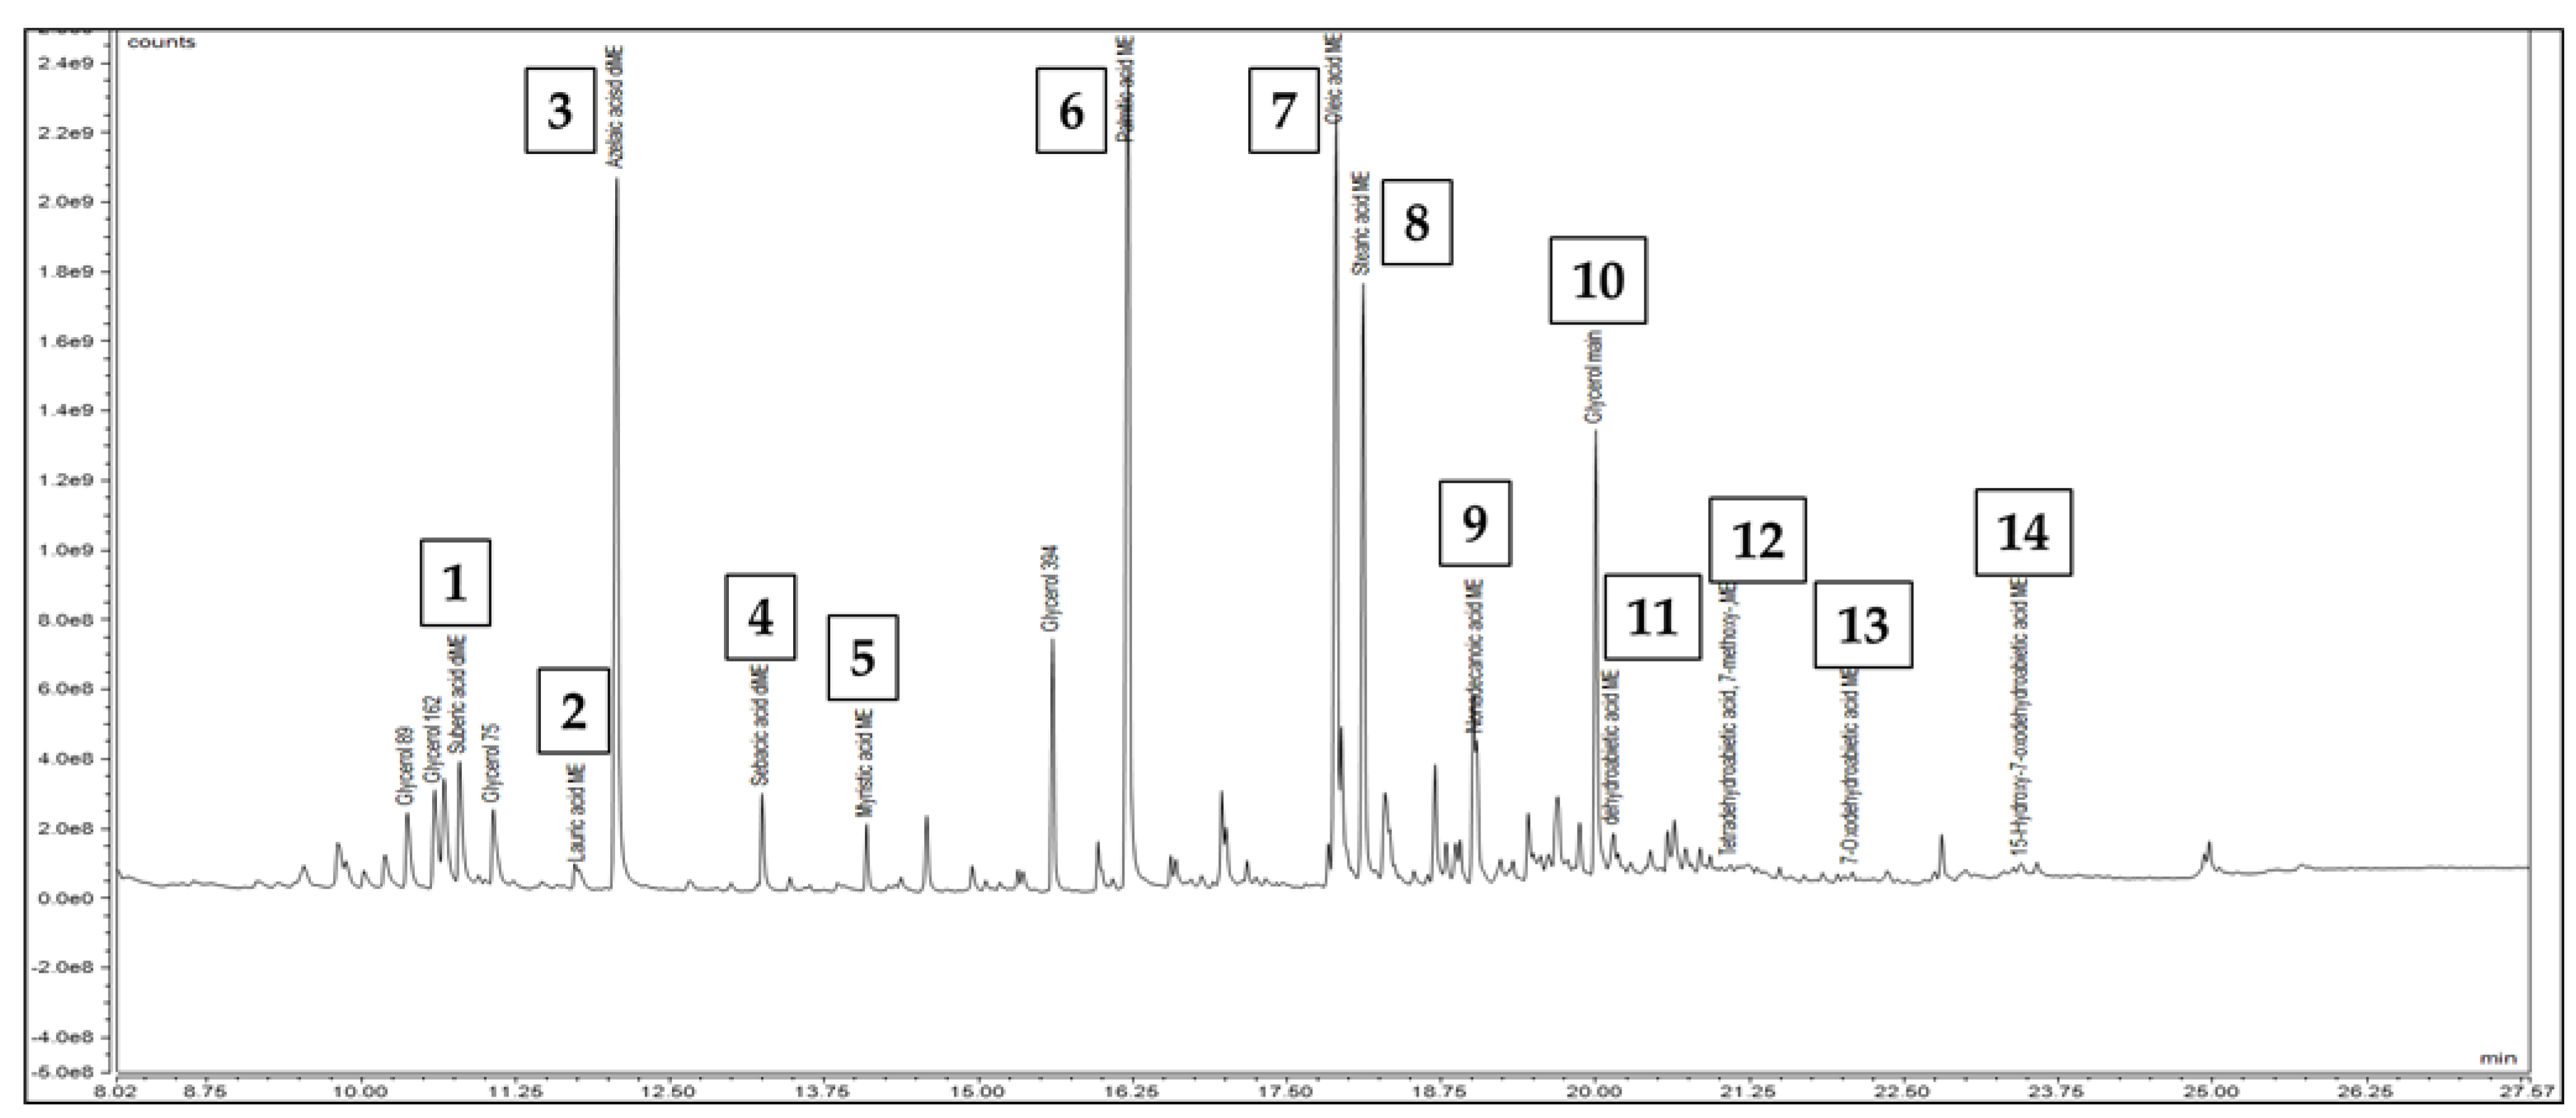
| N° | Retention Time (min) | M+ (g/mol) | Attribution |
|---|---|---|---|
| 1 | 10.79 | 203.25 | Suberic acid dimethyl ester |
| 2 | 11.76 | 215.35 | Lauric acid methyl ester |
| 3 | 12.07 | 217.27 | Azelaic acid dimethyl ester |
| 4 | 13.24 | 231.30 | Sebacic acid dimethyl ester |
| 5 | 14.09 | 243.40 | Myristic acid methyl ester |
| 6 | 16.20 | 271.45 | Palmitic acid methyl ester |
| 7 | 17.89 | 297.50 | Oleic acid methyl ester |
| 8 | 18.11 | 299.50 | Stearic acid methyl ester |
| 9 | 19.03 | 313.53 | Nonadecanoic acid methyl ester (Int. Std.) |
| 10 | 20.00 | 107.07 | Glycerol * |
| 11 | 20.14 | 315.46 | Dehydroabietic acid methyl ester |
| 12 | 21.09 | 343.50 | Tetradehydroabietic acid, 7-methoxy-methyl ester |
| 13 | 22.08 | 329.40 | 7-Oxodehydroabietic acid methyl ester |
| 14 | 23.45 | 417.60 | 15-Hydroxy-7-oxodehydroabietic acid methyl ester |
| Paint Samples | |||||||||||||||||
|---|---|---|---|---|---|---|---|---|---|---|---|---|---|---|---|---|---|
| C1-1 | C1-2 | C2-3 | C2-4 | C2-5 | C3-7 | C3-9 | C3-10 | C4-13 | C4-14 | C5-15 | C5-16 | C5-18 | C6-19 | C7-21 | C7-22 | ||
| Observed Color using OM | White + Black + Red + Blue | Black | Red + Blue | Blue | Black | Black | White | Black + BG | Black | White + Black + Red + Blue | Red | Blue + Green | Yellow | White + Black + Red + Blue | White + Red | Red | |
| Observed varnish on OM | x | x | - | - | - | x | ? | x | ? | x | x | x | x | x | - | - | |
| Fatty acids and other compounds | Suberic acid dimethyl ester | 1.99 | 2.45 | 1.43 | 1.58 | - | 4.32 | 5.31 | - | - | 3.76 | 2.58 | 6.64 | 7.68 | 5.53 | 3.82 | 8.72 |
| Lauric acid methyl ester | 2.80 | 2.79 | 5.28 | 5.97 | 6.26 | 8.40 | 5.19 | 7.55 | 5.14 | 3.00 | 1.53 | 1.02 | 0.93 | 2.80 | 0.64 | - | |
| Azelaic acid dimethyl ester | 15.21 | 15.58 | 14.34 | 15.93 | 9.85 | 28.87 | 40.19 | 12.75 | 9.56 | 25.42 | 13.50 | 29.03 | 26.55 | 26.44 | 18.25 | 27.39 | |
| Sebacic acid dimethyl ester | 0.72 | 0.82 | 1.27 | 1.48 | - | - | 1.80 | - | - | 1.22 | 0.81 | 2.18 | 2.17 | 2.14 | 1.68 | 5.67 | |
| Myristic acid methyl ester | 9.40 | 12.69 | 23.85 | 22.13 | 21.54 | 24.75 | 16.67 | 32.69 | 18.82 | 8.38 | 6.24 | 4.59 | 4.47 | 5.14 | 1.24 | 3.92 | |
| Palmitic acid methyl ester | 28.29 | 30.20 | 20.11 | 18.61 | 16.34 | 78.74 | 44.50 | 17.93 | 28.37 | 31.20 | 31.50 | 30.79 | 31.65 | 30.74 | 23.95 | 17.49 | |
| Oleic acid methyl ester | 4.55 | 9.41 | 2.50 | 2.29 | 1.42 | 2.40 | 6.59 | 1.83 | 1.34 | 5.62 | 3.75 | 2.45 | 3.10 | 4.37 | 18.78 | 5.13 | |
| Stearic acid methyl ester | 30.04 | 17.71 | 21.22 | 18.16 | 33.03 | 61.59 | 14.64 | 19.57 | 25.27 | 11.93 | 31.38 | 19.43 | 19.61 | 15.33 | 13.48 | 18.31 | |
| Glycerol | 6.10 | 7.57 | 10.00 | 13.86 | 11.56 | 29.14 | 15.55 | 10.31 | 11.48 | 9.48 | 6.95 | 3.21 | 3.35 | 6.43 | 15.40 | 11.45 | |
| Dehydroabietic acid methyl ester | x | x | - | x | - | x | x | - | - | x | x | x | x | x | x | x | |
| Tetradehydroabietic acid, 7-methoxy-methyl ester | x | - | - | x | - | - | - | - | - | x | x | x | x | x | x | x | |
| 7-Oxodehydroabietic acid methyl ester | - | - | - | x | - | - | - | - | - | x | x | x | x | - | x | x | |
| 15-Hydroxy-7-oxodehydroabietic acid methyl ester | - | - | - | - | - | - | - | - | - | - | - | - | - | - | x | x | |
| Molar ratios among fatty acids | P/S | 0.94 | 1.71 | 0.95 | 1.02 | 0.49 | 1.28 | 3.04 | 0.92 | 1.12 | 2.62 | 1.00 | 1.58 | 1.61 | 2.00 | 1.78 | 0.96 |
| A/P | 0.54 | 0.52 | 0.71 | 0.86 | 0.60 | 0.37 | 0.90 | 0.71 | 0.34 | 0.81 | 0.43 | 0.94 | 0.84 | 0.86 | 0.76 | 1.57 | |
| D/P | 0.63 | 0.62 | 0.85 | 1.02 | 0.36 | 0.38 | 1.60 | 0.73 | 2.91 | 2.27 | 0.54 | 1.23 | 1.15 | 1.11 | 1.31 | 2.39 | |
| ΣD | 17.93 | 18.84 | 17.04 | 18.99 | 5.84 | 12.72 | 47.30 | 12.80 | 82.40 | 70.80 | 16.90 | 37.80 | 36.40 | 34.11 | 31.50 | 41.78 | |
| O/S | 0.15 | 0.53 | 0.12 | 0.13 | 0.04 | 0.04 | 0.45 | 0.09 | 0.05 | 0.47 | 0.12 | 0.13 | 0.16 | 0.29 | 1.39 | 0.28 | |
| A/Sub | 7.63 | 6.37 | 10.00 | 10.05 | - | 6.69 | 7.56 | - | - | 6.77 | 5.23 | 4.37 | 3.46 | 4.78 | 4.77 | 3.14 | |
| Index | Color | Pigments | Inorganic Additives/Preparatory Layer, Adulterants | Binding Media | Varnish/Natural Resin Additive | Degradation Products |
|---|---|---|---|---|---|---|
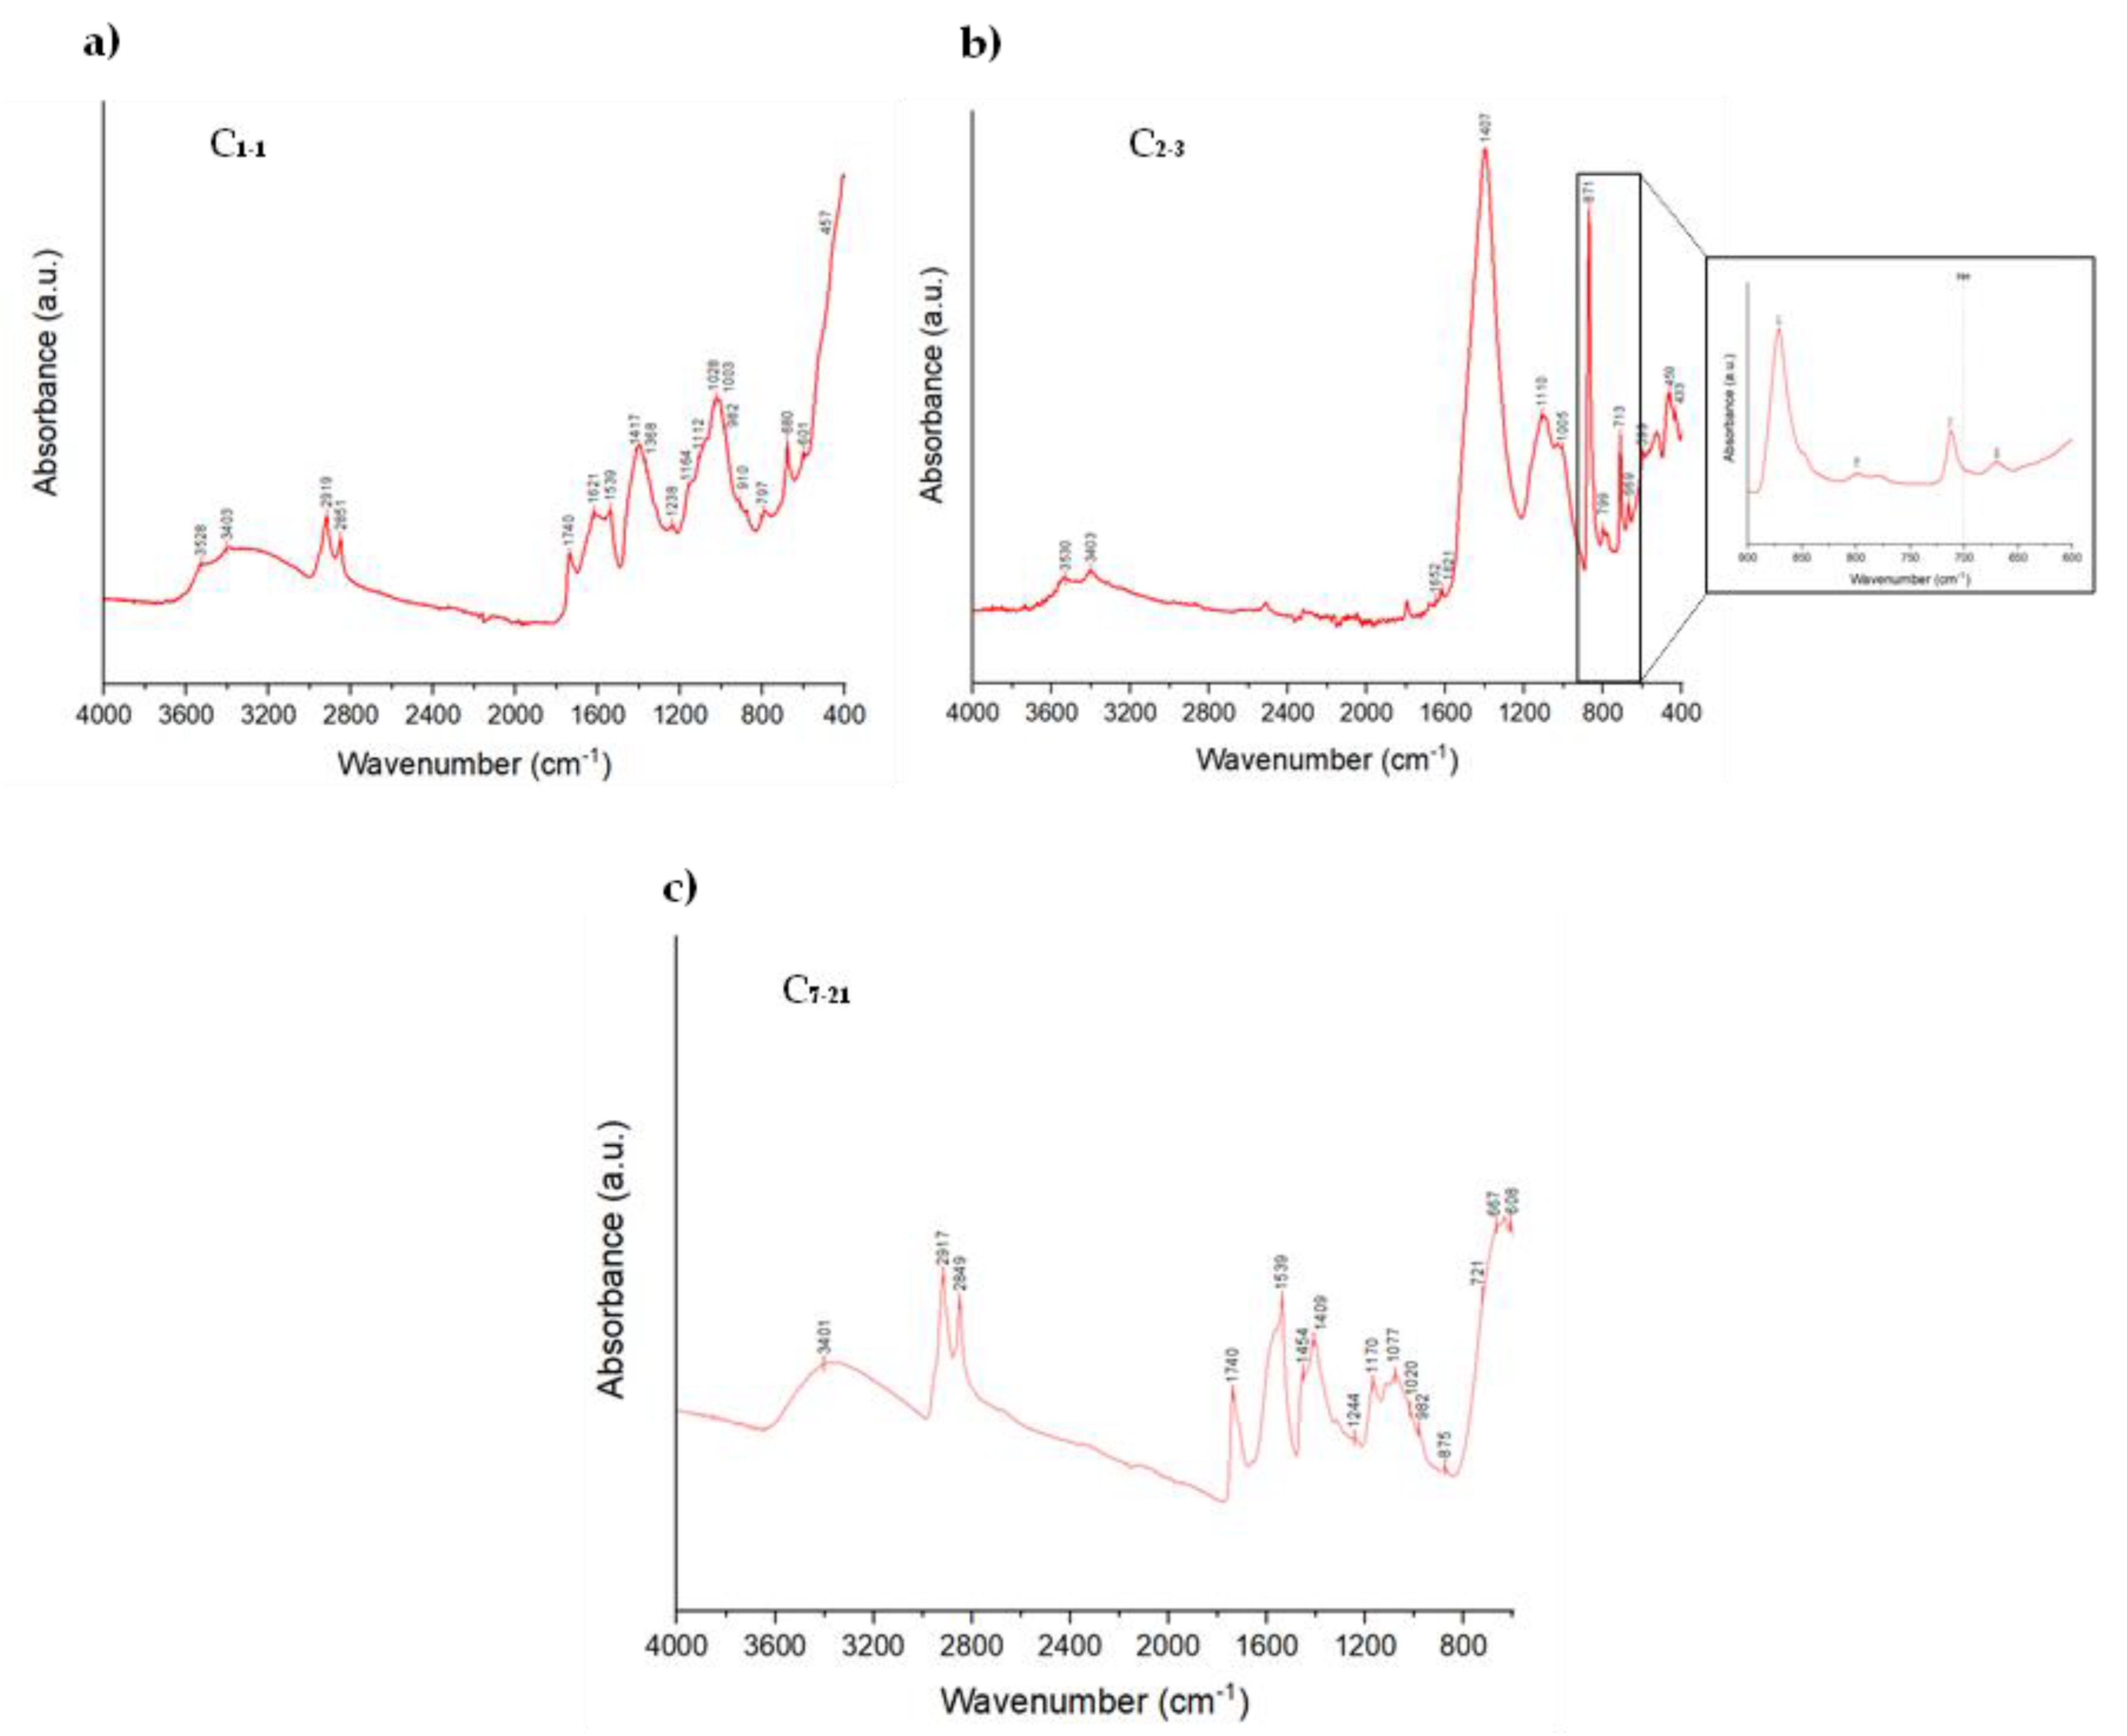
| C1 | White | Zinc white/lithopone (?) | Gypsum (3528, 3403, 1621, 1112, 1010 m, 1003, 601) | Egg yolk and oil (3403, 2919, 2851, 1740, 1454, 1417, 1368, 1164) | Colophony or Venice turpentine | Zinc stearate/palmitate (1539), azelaic acid, suberic acid and sebacic acid, dehydroabietic acid (DHA), 7-methoxy-tetra-DHA |
| Black | Carbon black (1606 s, 1326 s, 1028) | |||||
| Red | Hematite (406 s, 610 w, 457) | |||||
| Blue | Ultramarine blue (1238, 982, 797, 544 m, 680) | |||||
| C2 | White | Chalk/calcite (1407, 1085 s, 871, 713, 710 w) | Gypsum (3530, 3403, 1621, 1110, 1010 s, 1005, 669), chalk/calcite (1407, 1085 s, 871, 713, 710 w), aragonite (701 sh) (?), quartz (799, 486 s, 433) | Casein and/or egg yolk (1652) | Colophony or Venice turpentine (3072 w) | Azelaic acid, suberic acid and sebacic acid, dehydroabietic acid (DHA), 7-methoxy-tetra-DHA, 7-oxo-DHA |
| Black | Carbon black (1020, 599) | |||||
| Red | Hematite (618 m, 538, 410 s, 459) | |||||
| Blue | Ultramarine blue (?) | |||||
| C3 | White | Zinc white (438 s) | Gypsum (1010 m(sh)), barium white/lithopone (988 s, 646 m, 617 m, 456 w), chalk (1085 s) | Arabic gum (2928 s(br)), oil and egg yolk (2940 m, 2850 m, 1448 m, 1302 w) | Colophony or Venice turpentine | Zinc stearate/palmitate (1539), Azelaic acid, suberic acid and sebacic acid, dehydroabietic acid (DHA) |
| Black | Carbon black (1598 s, 1314 s) | |||||
| Red | Hematite (618 w, 418 s) | |||||
| Brown | Burnt umber (648 s(br)) | |||||
| C4 | White | Titanium white (anatase) (639 m, 516 m, 392 m), lead white (1051 w), zinc white (?) | Barium white/lithopone (988 m, 456 w) | Probably a mixture of oil and egg yolk (2973 w, 2868 w, 1446 w), and gum Arabic (2926 s) | Colophony or Venice turpentine | Azelaic acid, suberic acid and sebacic acid, dehydroabietic acid (DHA), 7-methoxy-tetra-DHA, 7-oxo-DHA |
| Black | Carbon black (1598 s, 1306 s) | |||||
| Purple | Cinnabar/vermilion (348 m), ultramarine blue (544 m) | |||||
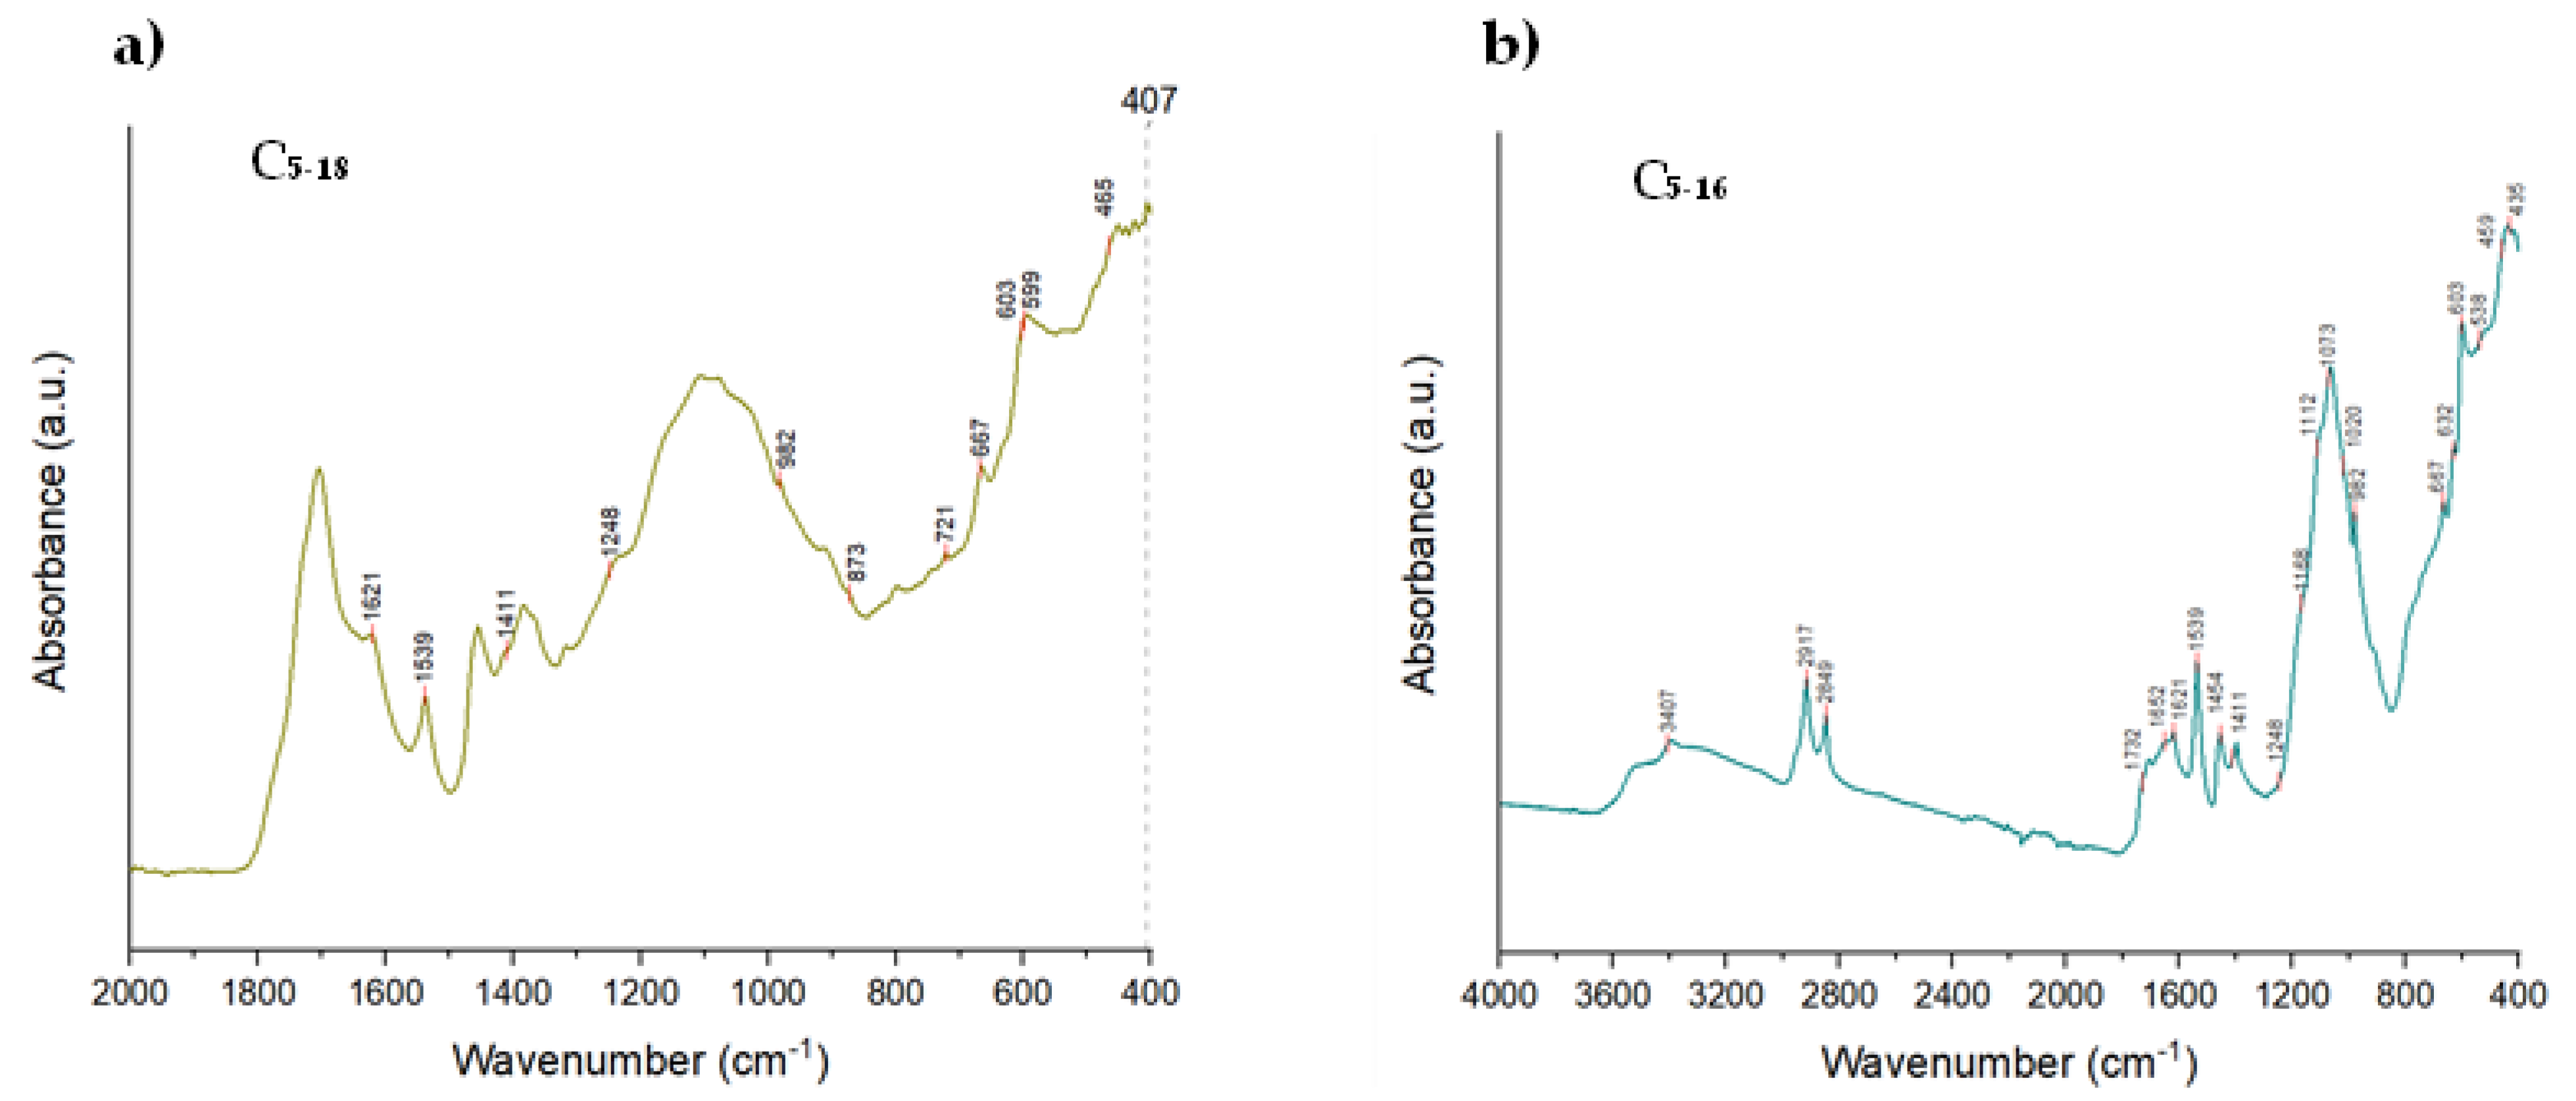
| C5 | White | Titanium white (anatase) (639 m, 516 w, 392 w), zinc white (?) | Gypsum (3407, 1621, 1112, 667, 603), barium white/lithopone (988 m, 982, 603, 456 w), chalk/calcite (1411, 873, 721) | Probably a mixture of oil, egg yolk and/or animal glue (3407, 2941 m, 2917, 2862 m, 2849, 1732, 1652, 1451, 1443 w, 1411, 1370, 1248, 1168, 1074 w, 1071) | Colophony or Venice turpentine (3082 w) | Zinc stearate/palmitate (1539), azelaic acid, suberic acid and sebacic acid, dehydroabietic acid (DHA), 7-methoxy-tetra-DHA |
| Black | Carbon black (1600 s, 1318 s, 1020) | |||||
| Red | Cinnabar/vermilion (344 w) | |||||
| Blue | Ultramarine blue (982, 797, 546 w(sh)) | |||||
| Green | Hydrated chromium green oxide (632, 538, 459, 435) | |||||
| Yellow | Golden ochre (ocra d’oro d’Italia) (599, 465, 407) | |||||
| C6 | White | Titanium white (anatase) (639 m, 516 m, 392 m) | Traces of gypsum (1010 w) | Probably a mixture of oil, egg yolk and/or animal glue (2933 m, 2865 m, 1448 w) | Colophony or Venice turpentine | Azelaic acid, suberic acid and sebacic acid, dehydroabietic acid (DHA), 7-methoxy-tetra-DHA |
| Black | Carbon black (1598 s, 1306 s) | |||||
| Red | Cinnabar/vermilion (342 w) | |||||
| Blue | Ultramarine blue (546 m) | |||||
| C7 | White | Titanium white (anatase on the front of the paintings, rutile on the backside) (the first is confirmed by 639 m, 516 w, 392 w), zinc white/lithopone (?) | Gypsum (1120, 667, 608), barium white/lithopone (988 m, 982, 608, 456 w), chalk/calcite (1409, 875, 721), red lead (?) | Probably a mixture of oil, egg yolk and/or animal glue (3401, 2934 s, 2917, 2856 m, 2849, 2724 w, 1744 w, 1740, 1670 w, 1454, 1448 m, 1244, 1170, 1077), gum Arabic (2926 s) | Colophony or Venice turpentine | Zinc stearate/palmitate (1539), azelaic acid, suberic acid and sebacic acid, dehydroabietic acid (DHA), 7-methoxy-tetra-DHA, 15-hydroxy-7-oxo-DHA |
| Black | Carbon black (1020) | |||||
| Purple | Cinnabar/vermilion (346 m), ultramarine blue (549 w) |
Disclaimer/Publisher’s Note: The statements, opinions and data contained in all publications are solely those of the individual author(s) and contributor(s) and not of MDPI and/or the editor(s). MDPI and/or the editor(s) disclaim responsibility for any injury to people or property resulting from any ideas, methods, instructions or products referred to in the content. |
© 2023 by the authors. Licensee MDPI, Basel, Switzerland. This article is an open access article distributed under the terms and conditions of the Creative Commons Attribution (CC BY) license (https://creativecommons.org/licenses/by/4.0/).
Share and Cite
Morales Toledo, E.G.; Raicu, T.; Falchi, L.; Barisoni, E.; Piccolo, M.; Izzo, F.C. Critical Analysis of the Materials Used by the Venetian Artist Guido Cadorin (1892–1976) during the Mid-20th Century, Using a Multi-Analytical Approach. Heritage 2023, 6, 600-627. https://doi.org/10.3390/heritage6010032
Morales Toledo EG, Raicu T, Falchi L, Barisoni E, Piccolo M, Izzo FC. Critical Analysis of the Materials Used by the Venetian Artist Guido Cadorin (1892–1976) during the Mid-20th Century, Using a Multi-Analytical Approach. Heritage. 2023; 6(1):600-627. https://doi.org/10.3390/heritage6010032
Chicago/Turabian StyleMorales Toledo, Erik Guillermo, Teodora Raicu, Laura Falchi, Elisabetta Barisoni, Matteo Piccolo, and Francesca Caterina Izzo. 2023. "Critical Analysis of the Materials Used by the Venetian Artist Guido Cadorin (1892–1976) during the Mid-20th Century, Using a Multi-Analytical Approach" Heritage 6, no. 1: 600-627. https://doi.org/10.3390/heritage6010032
APA StyleMorales Toledo, E. G., Raicu, T., Falchi, L., Barisoni, E., Piccolo, M., & Izzo, F. C. (2023). Critical Analysis of the Materials Used by the Venetian Artist Guido Cadorin (1892–1976) during the Mid-20th Century, Using a Multi-Analytical Approach. Heritage, 6(1), 600-627. https://doi.org/10.3390/heritage6010032