
Estimating Overall and Cause-Specific Excess Mortality during the COVID-19 Pandemic: Methodological Approaches Compared
 , , , and
Abstract
:1. Introduction
2. Materials and Methods
2.1. Number of Deaths
2.2. Age-Standardized Mortality Rate
2.3. SARIMA
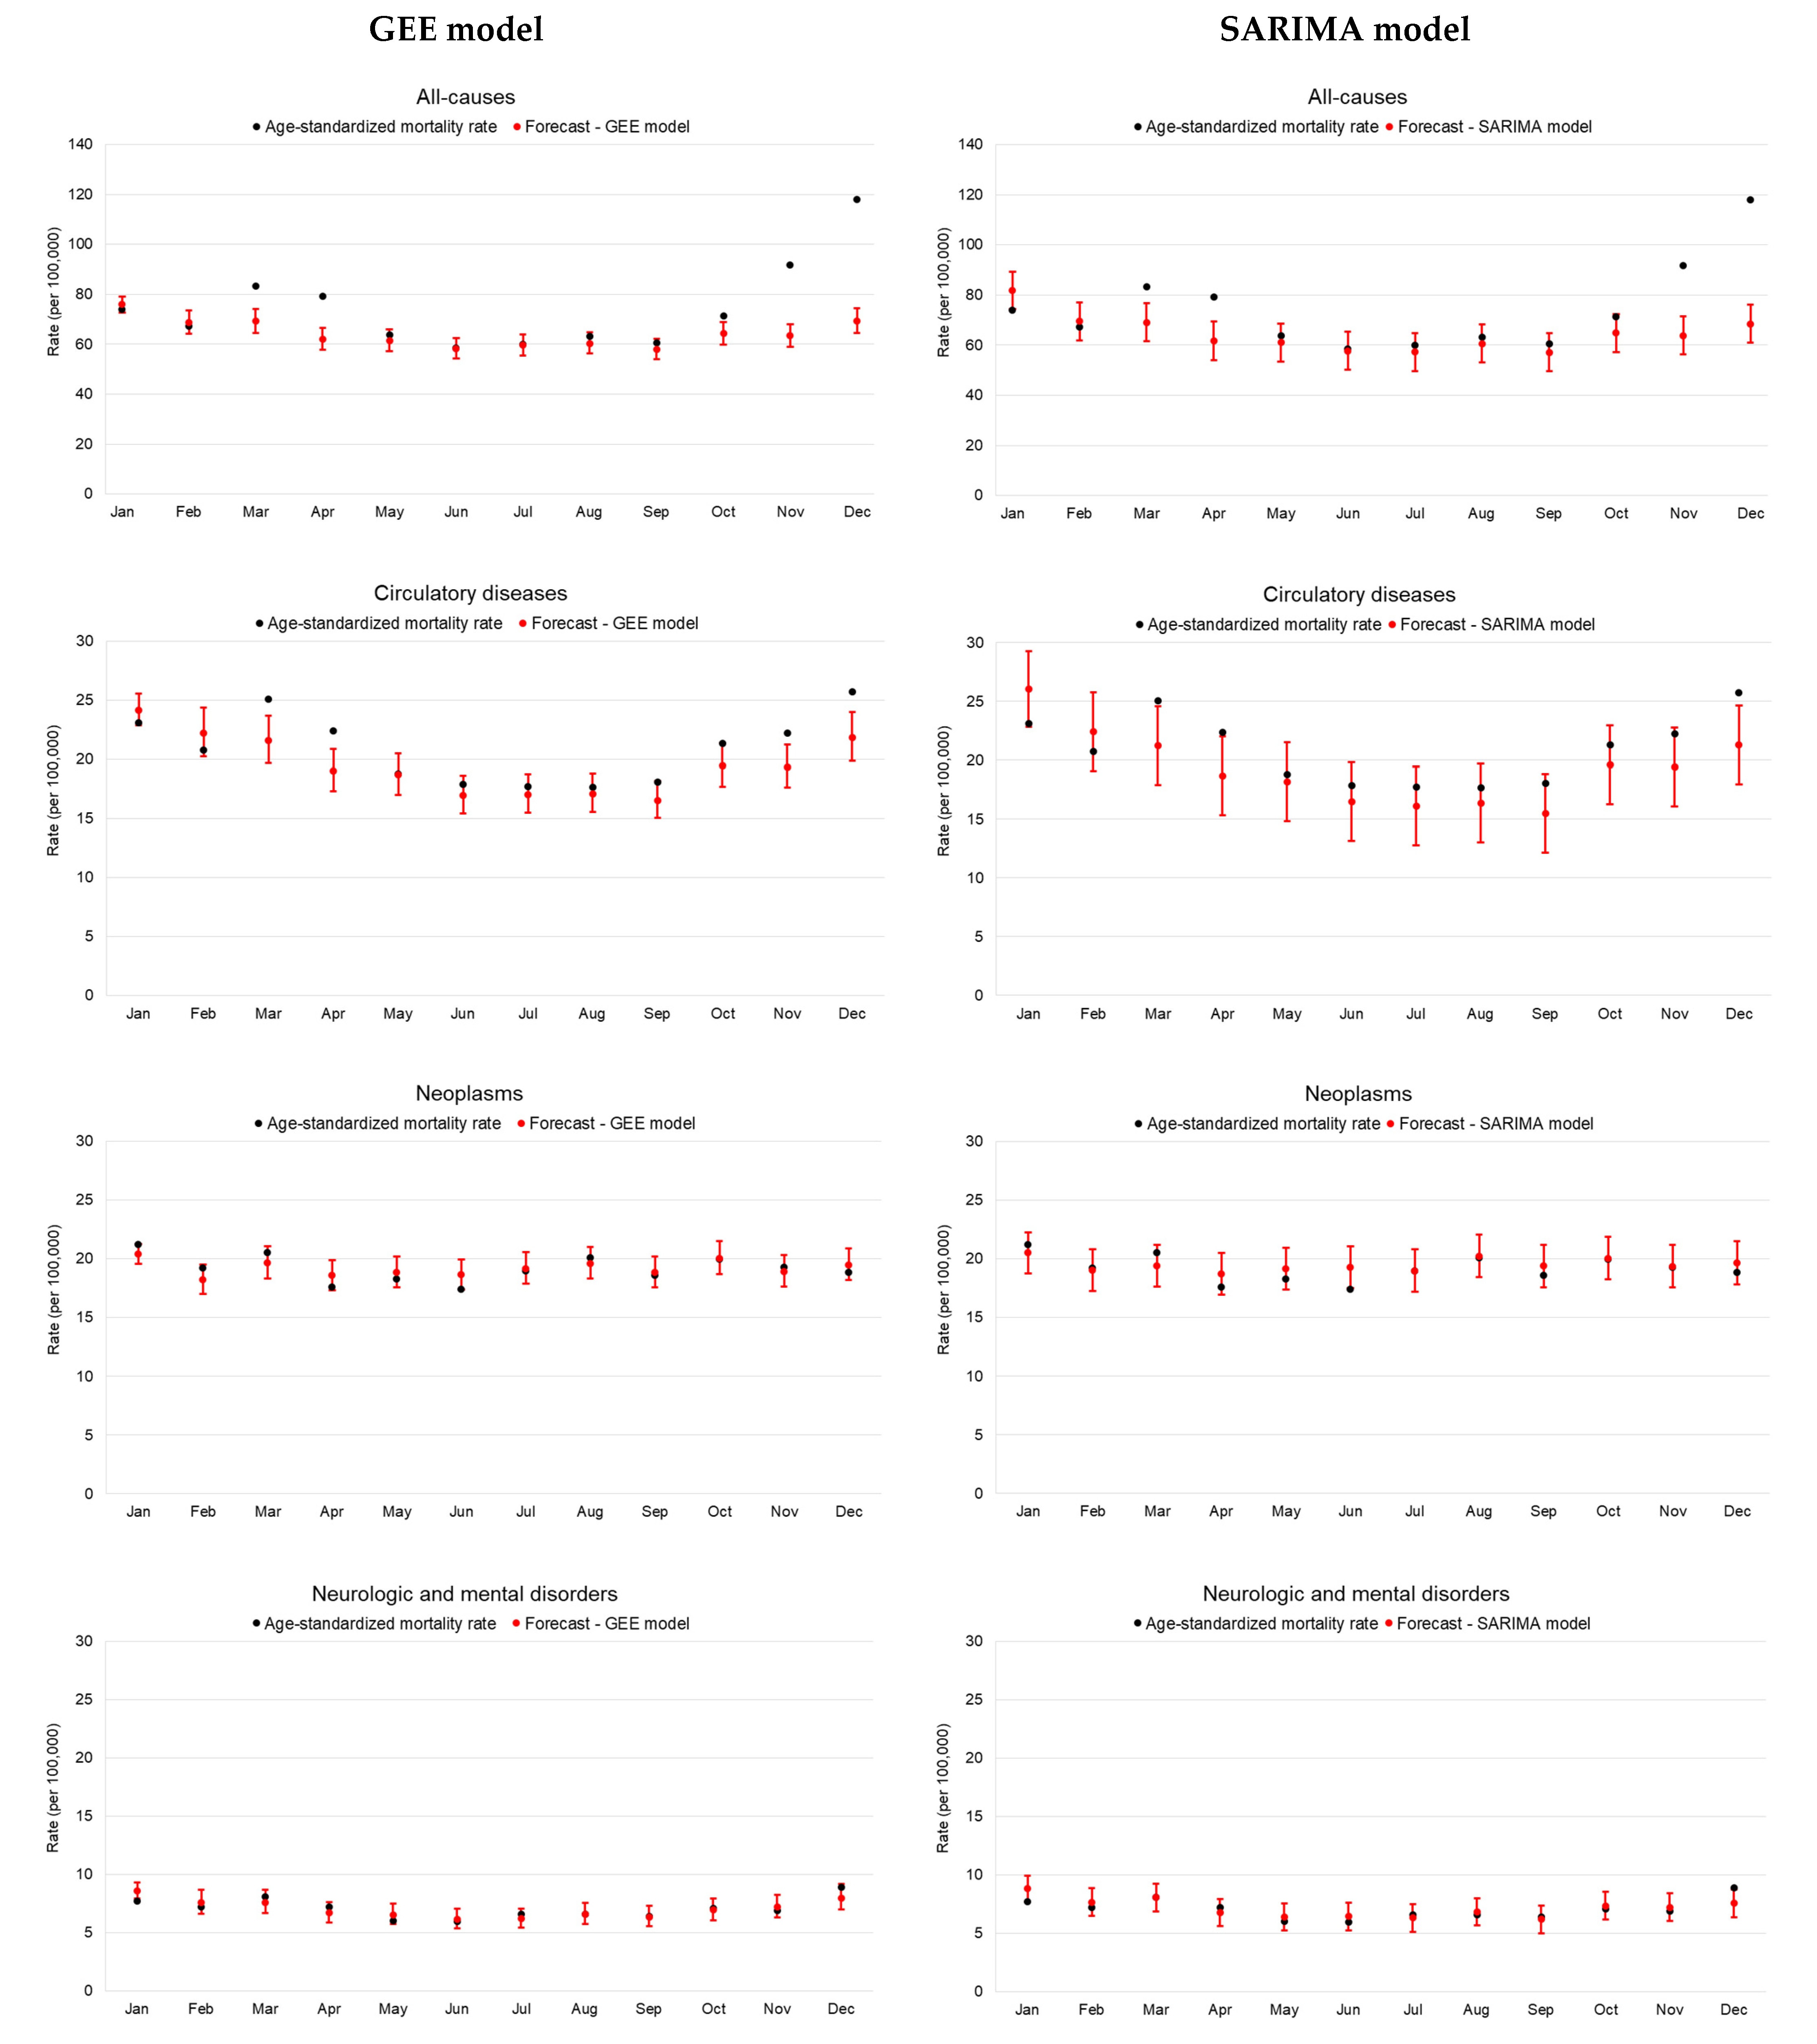
2.4. GEE
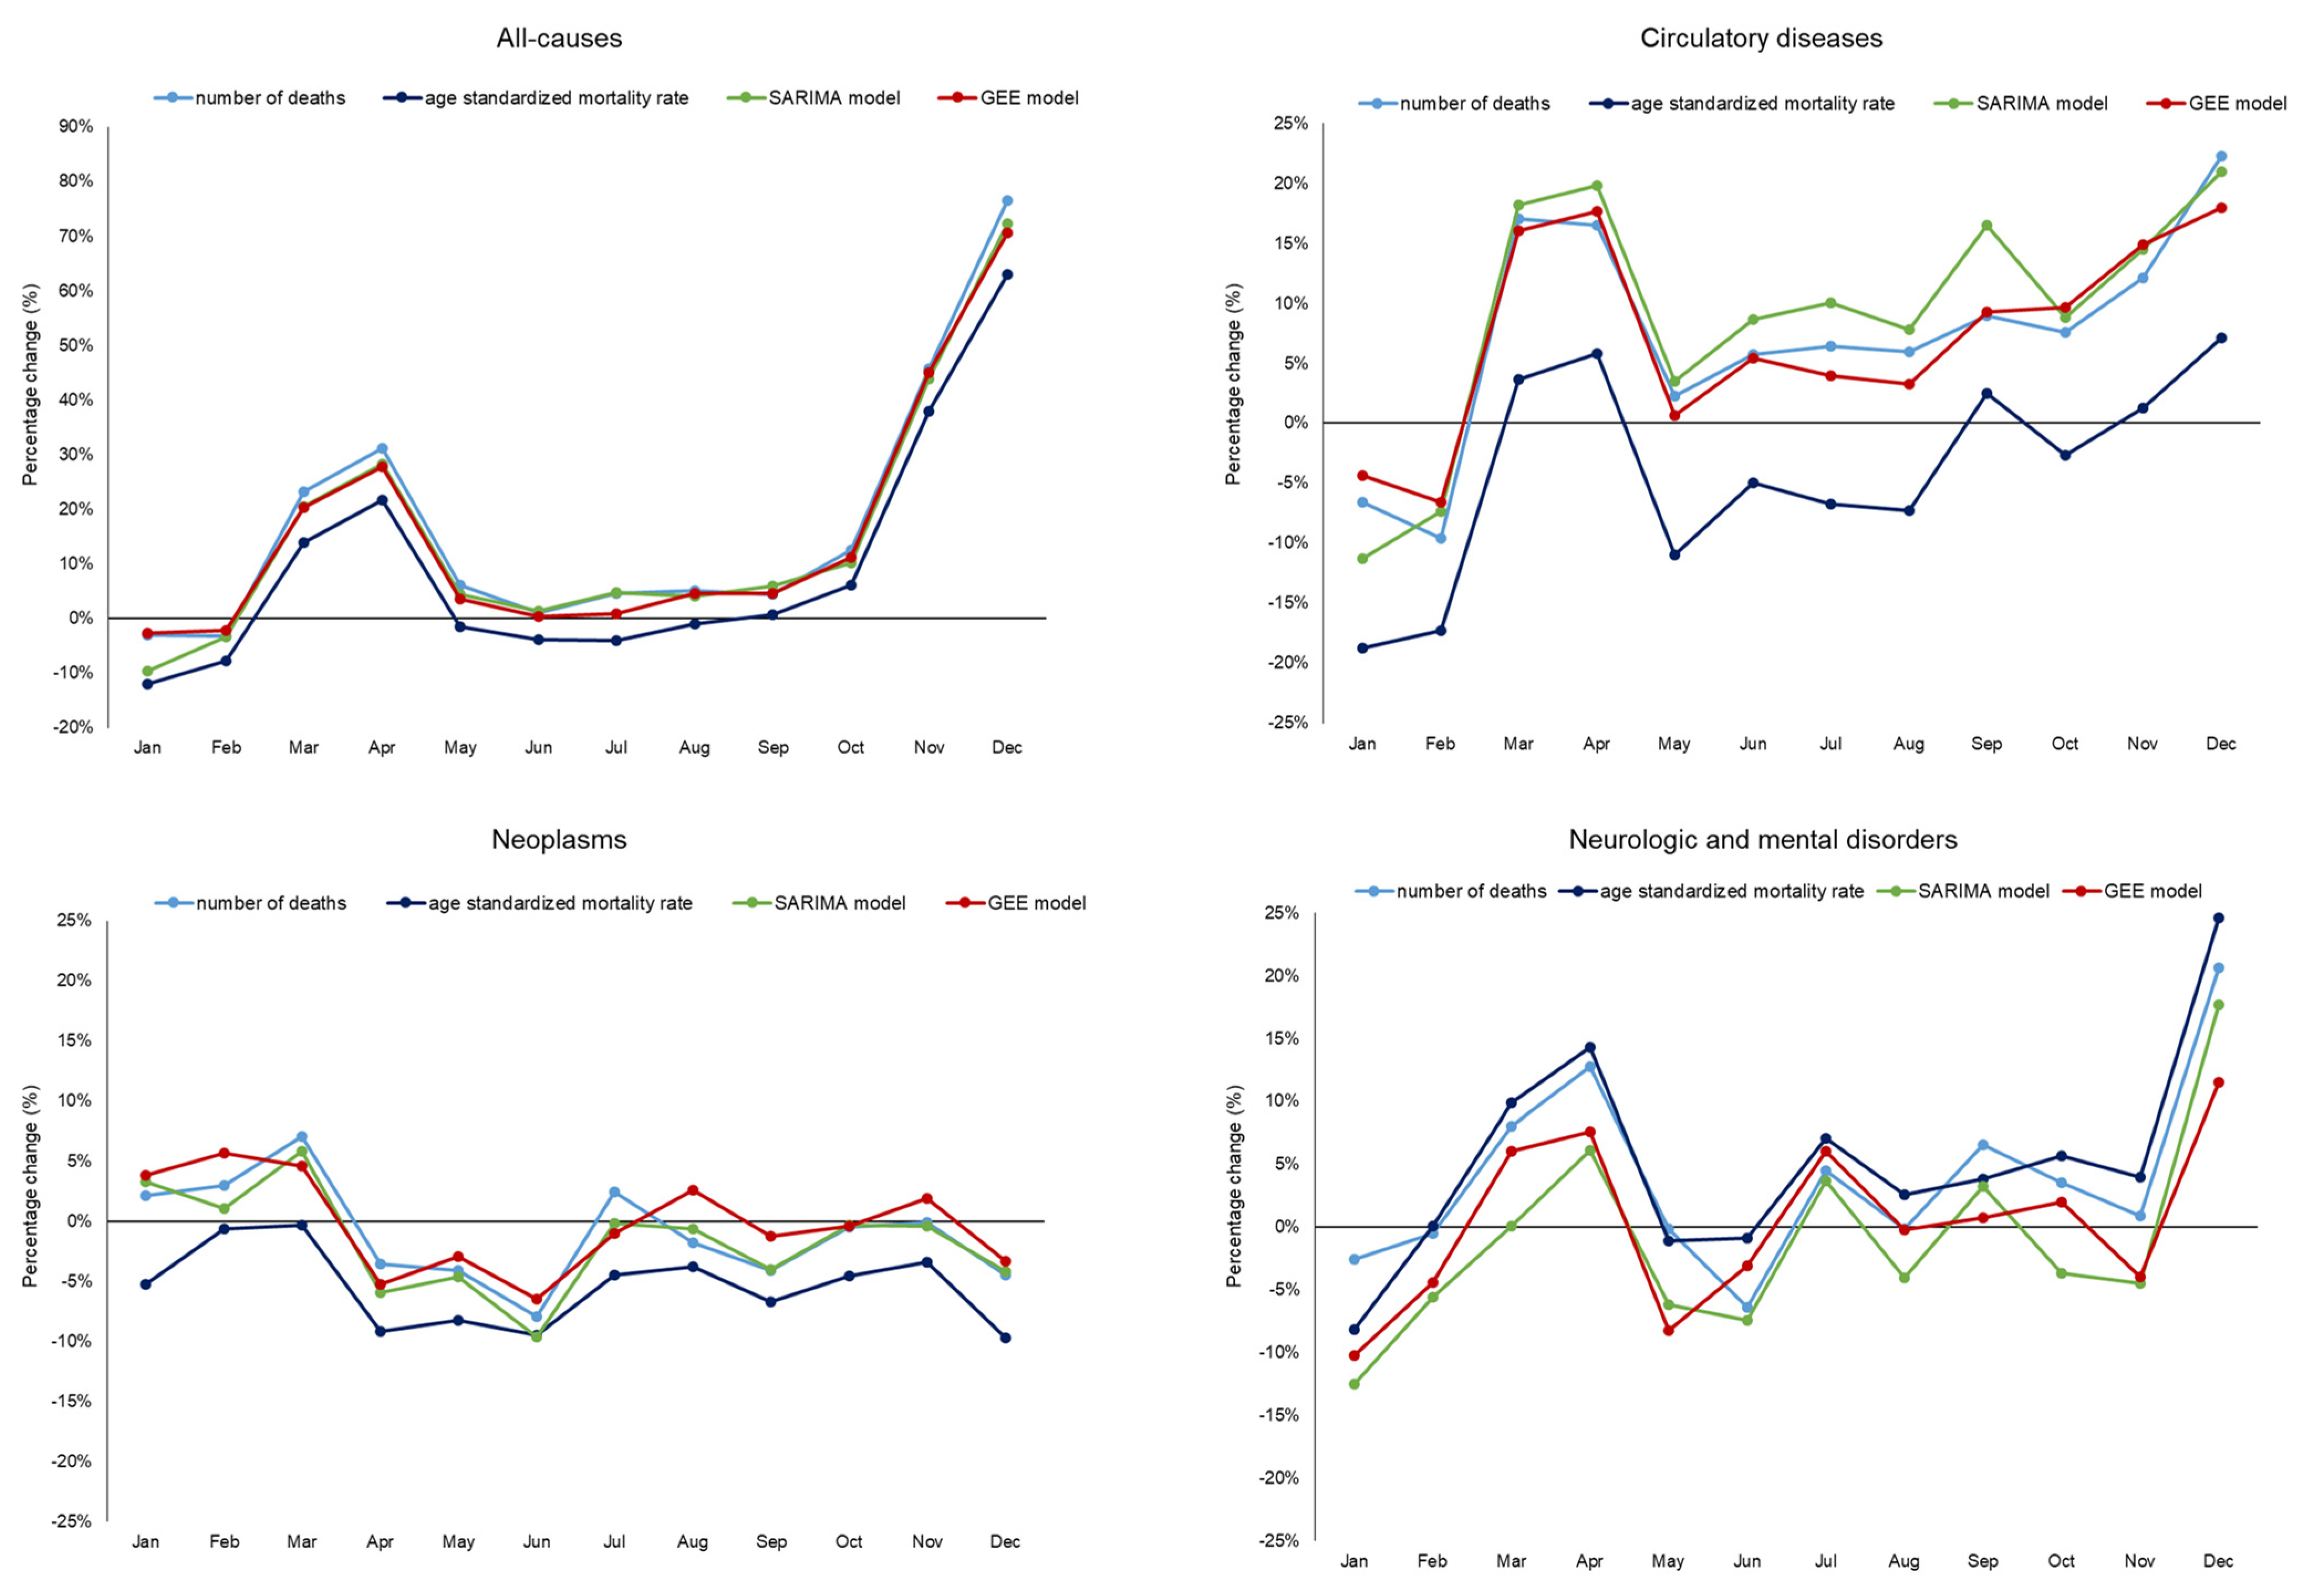
3. Results
4. Discussion
5. Conclusions
Supplementary Materials
Author Contributions
Funding
Institutional Review Board Statement
Informed Consent Statement
Data Availability Statement
Conflicts of Interest
References
- 14.9 Million Excess Deaths Associated with the COVID-19 Pandemic in 2020 and 2021. Available online: https://www.who.int/news/item/05-05-2022-14.9-million-excess-deaths-were-associated-with-the-covid-19-pandemic-in-2020-and-2021 (accessed on 1 November 2022).
- Levitt, M.; Zonta, F.; Ioannidis, J.P.A. Comparison of pandemic excess mortality in 2020–2021 across different empirical calculations. Environ. Res. 2022, 213, 113754. [Google Scholar] [CrossRef] [PubMed]
- Estimating Excess Mortality due to the COVID-19 Pandemic: A Systematic Analysis of COVID-19-Related Mortality, 2020–21—The Lancet. Available online: https://www.thelancet.com/article/S0140-6736(21)02796-3/fulltext#%20 (accessed on 21 November 2022).
- Excess Deaths Associated with COVID-19 Pandemic in 2020: Age and Sex Disaggregated Time Series Analysis in 29 High Income Countries|The BMJ. Available online: https://www.bmj.com/content/373/bmj.n1137 (accessed on 21 November 2022).
- Woolf, S.H.; Chapman, D.A.; Sabo, R.T.; Zimmerman, E.B. Excess Deaths from COVID-19 and Other Causes in the US, March 1, 2020, to January 2, 2021. JAMA 2021, 325, 1786. [Google Scholar] [CrossRef] [PubMed]
- Stokes, A.C.; Lundberg, D.J.; Elo, I.T.; Hempstead, K.; Bor, J.; Preston, S.H. COVID-19 and excess mortality in the United States: A county-level analysis. PLoS Med. 2021, 18, e1003571. [Google Scholar] [CrossRef] [PubMed]
- Excess Mortality-Statistics-European Commission. Available online: https://ec.europa.eu/eurostat/statistics-explained/index.php?title=Excess_mortality_-_statistics (accessed on 15 December 2022).
- Tracking COVID-19 Excess Deaths across Countries. 2021. Available online: https://www.economist.com/graphic-detail/coronavirus-excess-deaths-tracker (accessed on 1 November 2022).
- Wu, J.; McCann, A.; Katz, J.; Peltier, E.; Singh, K.D. The Pandemic’s Hidden Toll: Half a Million Deaths. February 2021. Available online: https://www.nytimes.com/interactive/2020/04/21/world/coronavirus-missing-deaths.html (accessed on 1 November 2022).
- Perotti, P.; Bertuccio, P.; Cacitti, S.; Deandrea, S.; Boschetti, L.; Dalle Carbonare, S.; Marguati, S.; Migliazza, S.; Porzio, E.; Riboli, S.; et al. Impact of the COVID-19 Pandemic on Total and Cause-Specific Mortality in Pavia, Northern Italy. Int. J. Environ. Res. Public Health 2022, 19, 6498. [Google Scholar] [CrossRef] [PubMed]
- Krieger, N.; Chen, J.T.; Waterman, P.D. Excess mortality in men and women in Massachusetts during the COVID-19 pandemic. Lancet 2020, 395, 1829. [Google Scholar] [CrossRef] [PubMed]
- Faust, J.S.; Du, C.; Liang, C.; Mayes, K.D.; Renton, B.; Panthagani, K.; Krumholz, H.M. Excess Mortality in Massachusetts during the Delta and Omicron Waves of COVID-19. JAMA 2022, 328, 74–76. [Google Scholar] [CrossRef]
- Palacio-Mejía, L.S.; Hernández-Ávila, J.E.; Hernández-Ávila, M.; Dyer-Leal, D.; Barranco, A.; Quezada-Sánchez, A.D.; Alvarez-Aceves, M.; Cortés-Alcalá, R.; Fernández-Wheatley, J.L.; Ordoñez-Hernández, I.; et al. Leading causes of excess mortality in Mexico during the COVID-19 pandemic 2020–2021: A death certificates study in a middle-income country. Lancet Reg. Health-Am. 2022, 13, 100303. [Google Scholar] [CrossRef] [PubMed]
- Makinde, O.S.; Oseni, B.M.; Adepetun, A.O.; Olusola-Makinde, O.O.; Abiodun, G.J. 34-The significance of daily incidence and mortality cases due to COVID-19 in some African countries. In Data Science for COVID-19; Kose, U., Gupta, D., de Albuquerque, V.H.C., Khanna, A., Eds.; Academic Press: Cambridge, MA, USA, 2022; pp. 667–680. Available online: https://www.sciencedirect.com/science/article/pii/B978032390769900013X (accessed on 21 December 2022).
- Russo, F.; Pitter, G.; Da Re, F.; Tonon, M.; Avossa, F.; Bellio, S.; Fedeli, U.; Gubian, L.; Monetti, D.; Saia, M.; et al. Epidemiology and public health response in early phase of COVID-19 pandemic, Veneto Region, Italy, 21 February to 2 April 2020. Euro Surveill. 2020, 25, 2000548. [Google Scholar] [CrossRef] [PubMed]
- Lu, T.H.; Hsu, P.Y.; Bjorkenstam, C.; Anderson, R.N. Certifying diabetes-related cause-of-death: A comparison of inappropriate certification statements in Sweden, Taiwan and the USA. Diabetologia 2006, 49, 2878–2881. [Google Scholar] [CrossRef] [PubMed]
- Impatto Dell’implementazione Della Versione 2016 Dell’Icd-10 e del Software Iris Sulle Statistiche di Mortalità in Italia|Epidemiologia & Prevenzione. Available online: https://epiprev.it/articoli_scientifici/impatto-dell-implementazione-della-versione-2016-dell-icd-10-e-del-software-iris-sulle-statistiche-di-mortalita-in-italia (accessed on 11 January 2023).
- Excess Deaths Associated with COVID-19—CDC—National Center for Health Statistics. 2022. Available online: https://www.cdc.gov/nchs/nvss/vsrr/covid19/excess_deaths.htm (accessed on 1 January 2023).
- Methods for Estimating the Excess Mortality Associated with the COVID-19 Pandemic—WHO. 2022. Available online: https://www.who.int/publications/m/item/methods-for-estimating-the-excess-mortality-associatedwith-the-covid-19-pandemic (accessed on 1 January 2023).
- Nepomuceno, M.R.; Klimkin, I.; Jdanov, D.A.; Alustiza-Galarza, A.; Shkolnikov, V.M. Sensitivity Analysis of Excess Mortality due to the COVID-19 Pandemic. Popul. Dev. Rev. 2022, 48, 279–302. [Google Scholar] [CrossRef] [PubMed]
- Wu, J.; Mamas, M.A.; Mohamed, M.O.; Kwok, C.S.; Roebuck, C.; Humberstone, B.; Denwood, T.; Luescher, T.; de Belder, M.A.; Deanfield, J.E.; et al. Place and causes of acute cardiovascular mortality during the COVID-19 pandemic. Heart 2021, 107, 113–119. [Google Scholar] [CrossRef] [PubMed]
- Yoneoka, D.; Kawashima, T.; Makiyama, K.; Tanoue, Y.; Nomura, S.; Eguchi, A. Geographically weighted generalized Farrington algorithm for rapid outbreak detection over short data accumulation periods. Stat. Med. 2021, 40, 6277–6294. [Google Scholar] [CrossRef] [PubMed]
- Wu, J.; Mafham, M.; Mamas, M.A.; Rashid, M.; Kontopantelis, E.; Deanfield, J.E.; de Belder, M.A.; Gale, C.P. Place and Underlying Cause of Death during the COVID-19 Pandemic: Retrospective Cohort Study of 3.5 Million Deaths in England and Wales, 2014 to 2020. Mayo Clin. Proc. 2021, 96, 952–963. [Google Scholar] [CrossRef] [PubMed]
- Bilinski, A.; Thompson, K.; Emanuel, E. COVID-19 and Excess All-Cause Mortality in the US and 20 Comparison Countries, June 2021–March 2022. JAMA 2023, 329, 92–94. [Google Scholar] [CrossRef] [PubMed]
- Scortichini, M.; Schneider Dos Santos, R.; De’ Donato, F.; De Sario, M.; Michelozzi, P.; Davoli, M.; Masselot, P.; Sera, F.; Gasparrini, A. Excess mortality during the COVID-19 outbreak in Italy: A two-stage interrupted time-series analysis. Int. J. Epidemiol. 2021, 49, 1909–1917. [Google Scholar] [CrossRef] [PubMed]
- Chang, S.W.; Zitko, P.; Passi-Solar, Á.; Danaei, G.; Margozzini, P. Changes in cardiovascular mortality in Chile during the COVID-19 pandemic. Heart 2022, 108, 1716–1721. [Google Scholar] [CrossRef] [PubMed]
- Eilers, P.H.C.; Gampe, J.; Marx, B.D.; Rau, R. Modulation models for seasonal time series and incidence tables. Statist. Med. 2008, 27, 3430–3441. [Google Scholar] [CrossRef] [PubMed]
- Singh, S.; Parmar, K.S.; Kumar, J.; Makkhan, S.J.S. Development of new hybrid model of discrete wavelet decomposition and autoregressive integrated moving average (ARIMA) models in application to one month forecast the casualties cases of COVID-19. Chaos Solitons Fractals 2020, 135, 109866. [Google Scholar] [CrossRef] [PubMed]
- Sensitivity Analysis of Excess Mortality Due to the COVID-19 Pandemic—Nepomuceno—2022—Population and Development Review—Wiley Online Library. Available online: https://onlinelibrary.wiley.com/doi/10.1111/padr.12475 (accessed on 21 December 2022).
- Fedeli, U.; Barbiellini Amidei, C.; Marcon, A.; Casotto, V.; Grippo, F.; Grande, E.; Gaisl, T.; Barco, S. Mortality Related to Chronic Obstructive Pulmonary Disease during the COVID-19 Pandemic: An Analysis of Multiple Causes of Death through Different Epidemic Waves in Veneto, Italy. Int. J. Environ. Res. Public Health 2022, 19, 12844. [Google Scholar] [CrossRef] [PubMed]
- Spijker, J.J.A.; Trias-Llimós, S. Cause-specific mortality in Spain during the pandemic: Educational differences and its impact on life expectancy. Eur. J. Public Health 2023, ckad036. [Google Scholar] [CrossRef]


| Month of Death | Deaths, n | Age-Standardized Mortality Rate | Percentage Change (%) | ||||
|---|---|---|---|---|---|---|---|
| Number of Deaths (1) | Age-Standardized Mortality Rate (2) | SARIMA Model (3) | GEE Model (3) | ||||
| All-causes | January | 4725 | 73.86 | −3.0% | −12.0% | −9.7% | −2.6% |
| February | 4280 | 67.20 | −3.3% | −7.8% | −3.3% | −2.2% | |
| March | 5341 | 83.23 | 23.2% | 13.9% | 20.5% | 20.3% | |
| April | 5098 | 79.11 | 31.2% | 21.6% | 28.3% | 27.7% | |
| May | 4047 | 63.68 | 6.2% | −1.5% | 4.4% | 3.6% | |
| June | 3723 | 58.44 | 0.9% | −3.9% | 1.3% | 0.4% | |
| July | 3831 | 60.07 | 4.6% | −4.0% | 4.8% | 0.8% | |
| August | 4024 | 63.12 | 5.1% | −1.0% | 4.1% | 4.6% | |
| September | 3846 | 60.45 | 4.4% | 0.7% | 5.9% | 4.5% | |
| October | 4570 | 71.41 | 12.5% | 6.2% | 10.2% | 11.1% | |
| November | 5885 | 91.82 | 45.8% | 38.0% | 43.9% | 45.0% | |
| December | 7603 | 118.10 | 76.5% | 63.0% | 72.3% | 70.6% | |
| Year 2020 | 56,973 | 890.50 | 17.2% | 9.5% | 15.2% | 15.7% | |
| Circulatory diseases | January | 1522 | 23.10 | −6.6% | −18.7% | −11.3% | −4.4% |
| February | 1356 | 20.77 | −9.6% | −17.3% | −7.3% | −6.6% | |
| March | 1659 | 25.08 | 17.1% | 3.7% | 18.2% | 16.0% | |
| April | 1476 | 22.40 | 16.5% | 5.8% | 19.8% | 17.7% | |
| May | 1230 | 18.80 | 2.2% | −11.0% | 3.5% | 0.6% | |
| June | 1175 | 17.90 | 5.7% | −5.0% | 8.7% | 5.5% | |
| July | 1163 | 17.73 | 6.4% | −6.7% | 10.0% | 4.0% | |
| August | 1161 | 17.67 | 6.0% | −7.3% | 7.8% | 3.3% | |
| September | 1187 | 18.07 | 9.0% | 2.5% | 16.5% | 9.3% | |
| October | 1406 | 21.33 | 7.6% | −2.7% | 8.8% | 9.7% | |
| November | 1460 | 22.24 | 12.1% | 1.3% | 14.5% | 14.9% | |
| December | 1689 | 25.74 | 22.3% | 7.1% | 21.0% | 18.0% | |
| Year 2020 | 16,484 | 250.85 | 7.1% | −4.4% | 8.4% | 7.2% | |
| Neoplasms | January | 1294 | 21.20 | 2.1% | −5.2% | 3.3% | 3.8% |
| February | 1175 | 19.24 | 3.0% | −0.6% | 1.0% | 5.7% | |
| March | 1261 | 20.55 | 7.0% | −0.3% | 5.8% | 4.6% | |
| April | 1082 | 17.61 | −3.5% | −9.2% | −5.9% | −5.3% | |
| May | 1110 | 18.29 | −4.1% | −8.2% | −4.6% | −2.9% | |
| June | 1065 | 17.43 | −7.9% | −9.4% | −9.7% | −6.5% | |
| July | 1167 | 18.97 | 2.5% | −4.5% | −0.2% | −1.0% | |
| August | 1237 | 20.14 | −1.7% | −3.7% | −0.6% | 2.6% | |
| September | 1127 | 18.61 | −4.1% | −6.7% | −4.0% | −1.2% | |
| October | 1220 | 19.99 | −0.5% | −4.6% | −0.3% | −0.4% | |
| November | 1182 | 19.30 | −0.1% | −3.4% | −0.4% | 1.9% | |
| December | 1151 | 18.85 | −4.5% | −9.7% | −4.2% | −3.3% | |
| Year 2020 | 14,071 | 230.19 | −1.0% | −5.5% | −1.6% | −0.1% | |
| Neurologic and mental disorders | January | 509 | 7.71 | −2.6% | −8.1% | −12.5% | −10.2% |
| February | 470 | 7.23 | −0.5% | 0.1% | −5.6% | −4.4% | |
| March | 529 | 8.08 | 8.1% | 9.9% | 0.1% | 6.1% | |
| April | 472 | 7.20 | 12.8% | 14.3% | 6.1% | 7.6% | |
| May | 394 | 6.00 | −0.1% | −1.1% | −6.2% | −8.2% | |
| June | 386 | 5.96 | −6.4% | −0.9% | −7.4% | −3.1% | |
| July | 430 | 6.56 | 4.5% | 7.1% | 3.7% | 6.0% | |
| August | 435 | 6.57 | −0.1% | 2.6% | −4.0% | −0.2% | |
| September | 422 | 6.40 | 6.6% | 3.8% | 3.3% | 0.8% | |
| October | 466 | 7.08 | 3.6% | 5.7% | −3.7% | 2.0% | |
| November | 451 | 6.91 | 0.9% | 4.0% | −4.5% | −4.0% | |
| December | 585 | 8.90 | 20.6% | 24.6% | 17.7% | 11.5% | |
| Year 2020 | 5549 | 84.60 | 4.0% | 5.1% | −1.3% | 0.3% | |
| All-Causes | Circulatory Diseases | Neoplasms | Neurologic and Mental Disorders | |||||
|---|---|---|---|---|---|---|---|---|
| Estimate | (95% CI) | Estimate | (95% CI) | Estimate | (95% CI) | Estimate | (95% CI) | |
| Time trend–year | 0.98 | (0.98–0.99) | 0.97 | (0.96–0.97) | 0.98 | (0.98–0.98) | 1.02 | (1.02–1.02) |
| January | 1.00 | # | 1.00 | # | 1.00 | # | 1.00 | # |
| February | 0.91 | (0.88–0.93) | 0.92 | (0.89–0.96) | 0.89 | (0.87–0.92) | 0.88 | (0.83–0.93) |
| March | 0.91 | (0.89–0.94) | 0.90 | (0.87–0.93) | 0.97 | (0.94–0.99) | 0.88 | (0.84–0.93) |
| April | 0.82 | (0.80–0.84) | 0.79 | (0.77–0.82) | 0.91 | (0.89–0.94) | 0.77 | (0.73–0.82) |
| May | 0.81 | (0.79–0.84) | 0.78 | (0.75–0.81) | 0.93 | (0.90–0.95) | 0.76 | (0.72–0.80) |
| June | 0.77 | (0.75–0.79) | 0.71 | (0.69–0.74) | 0.92 | (0.90–0.95) | 0.71 | (0.67–0.75) |
| July | 0.79 | (0.77–0.81) | 0.72 | (0.69–0.74) | 0.95 | (0.92–0.97) | 0.71 | (0.68–0.75) |
| August | 0.80 | (0.78–0.83) | 0.72 | (0.70–0.75) | 0.97 | (0.95–1.00) | 0.76 | (0.72–0.80) |
| September | 0.77 | (0.75–0.79) | 0.70 | (0.67–0.73) | 0.93 | (0.91–0.96) | 0.73 | (0.69–0.77) |
| October | 0.86 | (0.83–0.88) | 0.83 | (0.80–0.86) | 1.00 | (0.97–1.02) | 0.80 | (0.76–0.84) |
| November | 0.85 | (0.82–0.87) | 0.82 | (0.79–0.86) | 0.94 | (0.92–0.97) | 0.82 | (0.78–0.87) |
| December | 0.93 | (0.90–0.95) | 0.93 | (0.90–0.97) | 0.97 | (0.94–1.00) | 0.91 | (0.87–0.96) |
Disclaimer/Publisher’s Note: The statements, opinions and data contained in all publications are solely those of the individual author(s) and contributor(s) and not of MDPI and/or the editor(s). MDPI and/or the editor(s) disclaim responsibility for any injury to people or property resulting from any ideas, methods, instructions or products referred to in the content. |
© 2023 by the authors. Licensee MDPI, Basel, Switzerland. This article is an open access article distributed under the terms and conditions of the Creative Commons Attribution (CC BY) license (https://creativecommons.org/licenses/by/4.0/).
Share and Cite
Barbiellini Amidei, C.; Fedeli, U.; Gennaro, N.; Cestari, L.; Schievano, E.; Zorzi, M.; Girardi, P.; Casotto, V. Estimating Overall and Cause-Specific Excess Mortality during the COVID-19 Pandemic: Methodological Approaches Compared. Int. J. Environ. Res. Public Health 2023, 20, 5941. https://doi.org/10.3390/ijerph20115941
Barbiellini Amidei C, Fedeli U, Gennaro N, Cestari L, Schievano E, Zorzi M, Girardi P, Casotto V. Estimating Overall and Cause-Specific Excess Mortality during the COVID-19 Pandemic: Methodological Approaches Compared. International Journal of Environmental Research and Public Health. 2023; 20(11):5941. https://doi.org/10.3390/ijerph20115941
Chicago/Turabian StyleBarbiellini Amidei, Claudio, Ugo Fedeli, Nicola Gennaro, Laura Cestari, Elena Schievano, Manuel Zorzi, Paolo Girardi, and Veronica Casotto. 2023. "Estimating Overall and Cause-Specific Excess Mortality during the COVID-19 Pandemic: Methodological Approaches Compared" International Journal of Environmental Research and Public Health 20, no. 11: 5941. https://doi.org/10.3390/ijerph20115941