Network Analysis of Gut Microbiome and Metabolome to Discover Microbiota-Linked Biomarkers in Patients Affected by Non-Small Cell Lung Cancer

 , , , ,
  , , and
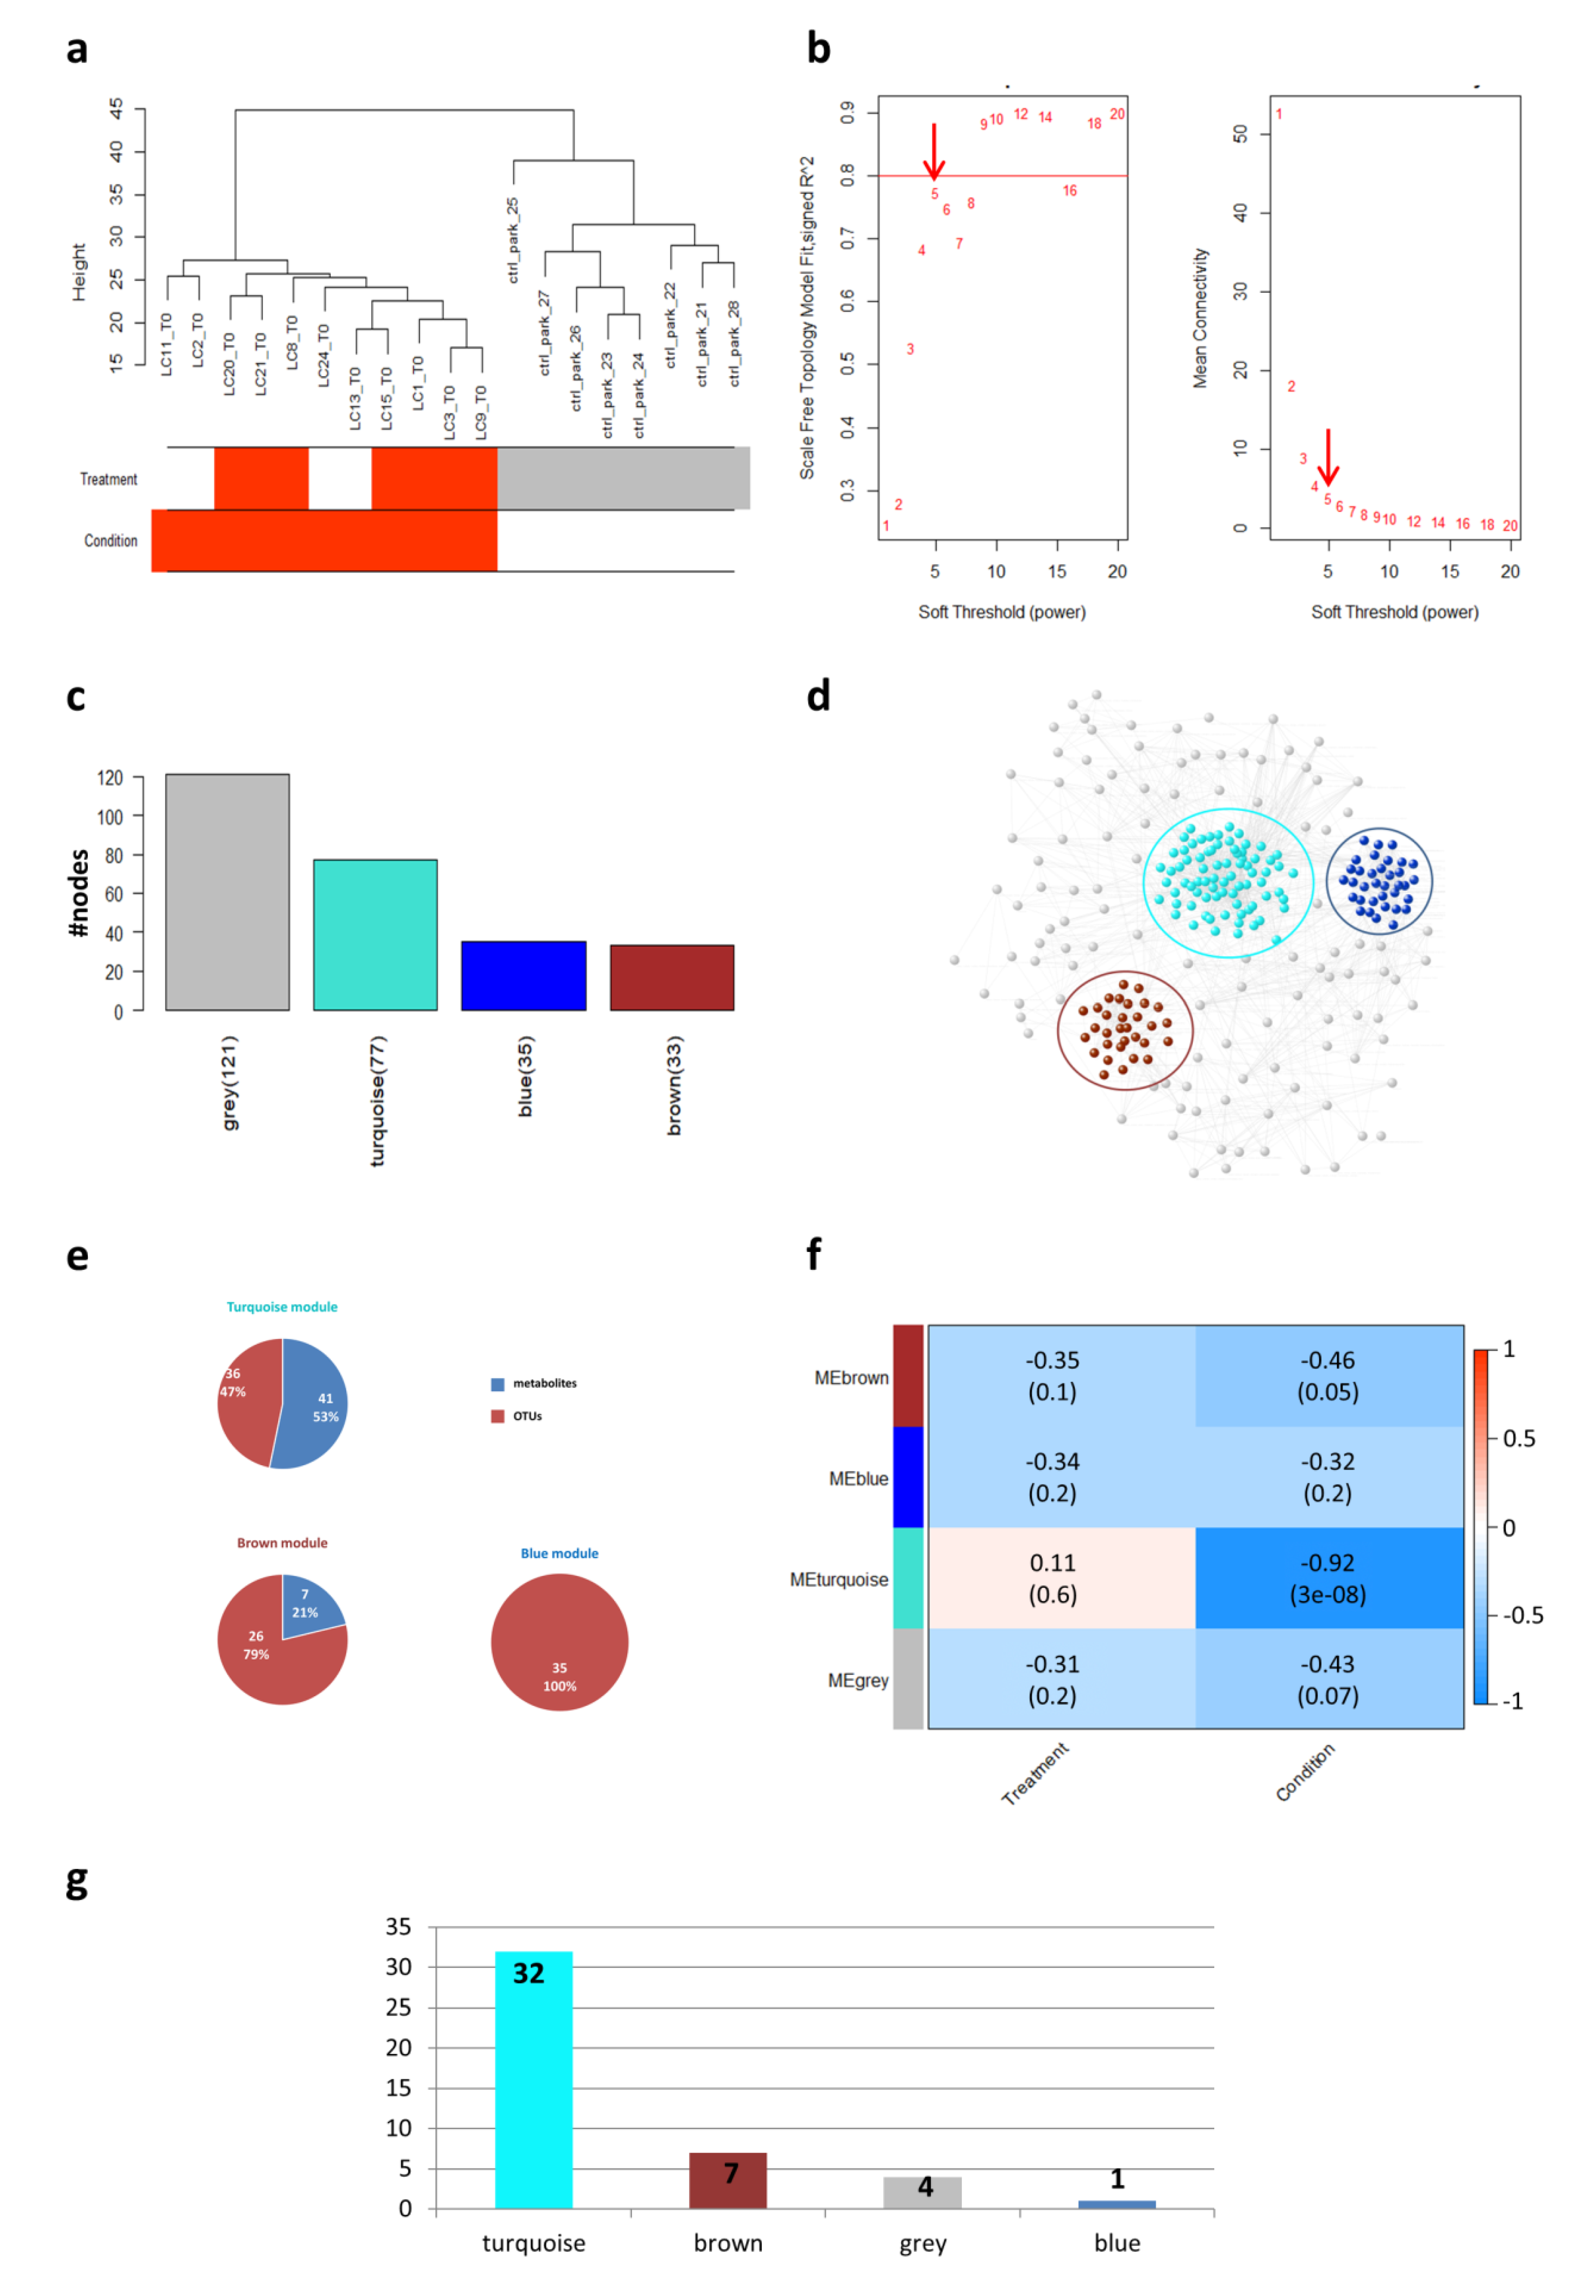
Abstract
:1. Introduction
2. Results and Discussion
2.1. Patient Characterization
2.2. Weighted Gene Co-Expression Network Analysis (WGCNA) Analysis
2.3. Network Analysis
3. Materials and Methods
3.1. Selection of Patients and Controls
3.2. Gut Microbiome-Targeted Metagenomics and Metabolomics Profiling
3.2.1. Targeted Metagenomic Profiling
3.2.2. Metabolomic Profiling
3.3. Data Pre-Processing
3.4. Network Analysis
3.4.1. Degree, Betweenness Centrality and Clustering Coefficient
3.4.2. Communities and Modularity
3.5. Weighted Gene Co-Expression Network Analysis (WGCNA)
4. Conclusions
Supplementary Materials
Author Contributions
Funding
Acknowledgments
Conflicts of Interest
Abbreviations
| GM | Gut microbiome |
| GI | Gastrointestinal |
| CTL-4 | Cytotoxic T-Lymphocyte Antigen 4 |
| PD-1 | Programmed cell death protein 1 |
| PD-L1 | Programmed death-ligand 1 |
| ICIs | Immune checkpoint inhibitors |
| PRR | Pattern recognition receptors |
| NSCLC | Non-small cell lung cancer |
| SCFAs | Short chain fatty acids |
| WGCNA | Weighted Gene Co-expression Network Analysis |
| ECOG | Eastern Cooperative Oncology Group |
| i-RECIST | Response Evaluation Criteria in Solid Tumors |
| PFS | Progression-free survival |
| OS | Overall survival |
| NR | Non-responders |
| R | Responders |
| CTRLs | Controls |
| OTUs | Operational taxonomic units |
| VOCs | Volatile organic compounds |
| GC-MS/ | Gas-chromatography-mass spectrometry/ |
| SPME | Solid phase microextraction/ |
| IS | Internal Standard |
| NMR | Nuclear magnetic resonance spectroscopy |
| TSP | Trimethylsilyl propionic acid sodium salt |
| IQR | Inter Quartile Range |
| FDR | False Discovery Rate |
| ME | Module eigengene |
| MM | Module membership |
| BS | Biomarker significance |
| CAR | Chimeric antigen receptor |
| FMT | Fecal microbiota transplantation |
References
- Kamada, N.; Seo, S.-U.; Chen, G.Y.; Núñez, G. Role of the gut microbiota in immunity and inflammatory disease. Nat. Rev. Immunol. 2013, 13, 321–335. [Google Scholar] [CrossRef] [PubMed]
- Sommer, F.; Anderson, J.M.; Bharti, R.; Raes, J.; Rosenstiel, P. The resilience of the intestinal microbiota influences health and disease. Nat. Rev. Microbiol. 2017, 15, 630–638. [Google Scholar] [CrossRef] [PubMed]
- Rea, D.; Coppola, G.; Palma, G.; Barbieri, A.; Luciano, A.; Del Prete, P.; Rossetti, S.; Berretta, M.; Facchini, G.; Perdonà, S.; et al. Microbiota effects on cancer: From risks to therapies. Oncotarget 2018, 9, 17915–17927. [Google Scholar] [CrossRef] [PubMed] [Green Version]
- Chen, D.S.; Mellman, I. Oncology meets immunology: The cancer-immunity cycle. Immunity 2013, 39, 1–10. [Google Scholar] [CrossRef] [PubMed] [Green Version]
- Bingula, R.; Filaire, M.; Radosevic-Robin, N.; Bey, M.; Berthon, J.-Y.; Bernalier-Donadille, A.; Vasson, M.-P.; Filaire, E. Desired Turbulence? Gut-Lung Axis, Immunity, and Lung Cancer. J. Oncol. 2017, 2017, 5035371. [Google Scholar] [CrossRef] [PubMed]
- Viaud, S.; Saccheri, F.; Mignot, G.; Yamazaki, T.; Daillère, R.; Hannani, D.; Enot, D.P.; Pfirschke, C.; Engblom, C.; Pittet, M.J.; et al. The intestinal microbiota modulates the anticancer immune effects of cyclophosphamide. Science 2013, 342, 971–976. [Google Scholar] [CrossRef] [PubMed] [Green Version]
- Viaud, S.; Daillère, R.; Boneca, I.G.; Lepage, P.; Langella, P.; Chamaillard, M.; Pittet, M.J.; Ghiringhelli, F.; Trinchieri, G.; Goldszmid, R.; et al. Gut microbiome and anticancer immune response: Really hot Sh*t! Cell Death Differ. 2015, 22, 199–214. [Google Scholar] [CrossRef] [Green Version]
- Iida, N.; Dzutsev, A.; Stewart, C.A.; Smith, L.; Bouladoux, N.; Weingarten, R.A.; Molina, D.A.; Salcedo, R.; Back, T.; Cramer, S.; et al. Commensal bacteria control cancer response to therapy by modulating the tumor microenvironment. Science 2013, 342, 967–970. [Google Scholar] [CrossRef]
- Zitvogel, L.; Ayyoub, M.; Routy, B.; Kroemer, G. Microbiome and Anticancer Immunosurveillance. Cell 2016, 165, 276–287. [Google Scholar] [CrossRef] [Green Version]
- Sivan, A.; Corrales, L.; Hubert, N.; Williams, J.B.; Aquino-Michaels, K.; Earley, Z.M.; Benyamin, F.W.; Lei, Y.M.; Jabri, B.; Alegre, M.-L.; et al. Commensal Bifidobacterium promotes antitumor immunity and facilitates anti-PD-L1 efficacy. Science 2015, 350, 1084–1089. [Google Scholar] [CrossRef] [Green Version]
- Vétizou, M.; Pitt, J.M.; Daillère, R.; Lepage, P.; Waldschmitt, N.; Flament, C.; Rusakiewicz, S.; Routy, B.; Roberti, M.P.; Duong, C.P.M.; et al. Anticancer immunotherapy by CTLA-4 blockade relies on the gut microbiota. Science 2015, 350, 1079–1084. [Google Scholar] [CrossRef] [PubMed] [Green Version]
- Bhatt, A.P.; Redinbo, M.R.; Bultman, S.J. The role of the microbiome in cancer development and therapy. CA Cancer J. Clin. 2017, 67, 326–344. [Google Scholar] [CrossRef] [PubMed] [Green Version]
- Miller, P.L.; Carson, T.L. Mechanisms and microbial influences on CTLA-4 and PD-1-based immunotherapy in the treatment of cancer: A narrative review. Gut Pathog. 2020, 12, 43. [Google Scholar] [CrossRef]
- Siegel, R.L.; Miller, K.D.; Jemal, A. Cancer statistics, 2019. CA Cancer J. Clin. 2019, 69, 7–34. [Google Scholar] [CrossRef] [PubMed] [Green Version]
- Carbone, C.; Piro, G.; Di Noia, V.; D’Argento, E.; Vita, E.; Ferrara, M.G.; Pilotto, S.; Milella, M.; Cammarota, G.; Gasbarrini, A.; et al. Lung and Gut Microbiota as Potential Hidden Driver of Immunotherapy Efficacy in Lung Cancer. Mediat. Inflamm. 2019, 2019, 1–10. [Google Scholar] [CrossRef] [PubMed]
- Botticelli, A.; Putignani, L.; Zizzari, I.; Del Chierico, F.; Reddel, S.; DI Pietro, F.; Quagliarello, A.; Onesti, C.E.; Raffaele, G.; Mazzuca, F.; et al. Changes of microbiome profile during nivolumab treatment in NSCLC patients. J. Clin. Oncol. 2018, 36, e15020. [Google Scholar] [CrossRef]
- Botticelli, A.; Vernocchi, P.; Marini, F.; Quagliariello, A.; Cerbelli, B.; Reddel, S.; Del Chierico, F.; Di Pietro, F.; Giusti, R.; Tomassini, A.; et al. Gut metabolomics profiling of non-small cell lung cancer (NSCLC) patients under immunotherapy treatment. J. Transl. Med. 2020, 18, 49. [Google Scholar] [CrossRef]
- Jin, Y.; Dong, H.; Xia, L.; Yang, Y.; Zhu, Y.; Shen, Y.; Zheng, H.; Yao, C.; Wang, Y.; Lu, S. The Diversity of Gut Microbiome is Associated with Favorable Responses to Anti–Programmed Death 1 Immunotherapy in Chinese Patients With NSCLC. J. Thorac. Oncol. 2019, 14, 1378–1389. [Google Scholar] [CrossRef]
- Hakozaki, T.; Richard, C.; Elkrief, A.; Hosomi, Y.; Benlaïfaoui, M.; Mimpen, I.; Terrisse, S.; Derosa, L.; Zitvogel, L.; Routy, B.; et al. The Gut Microbiome Associates with Immune Checkpoint Inhibition Outcomes in Patients with Advanced Non-Small Cell Lung Cancer. Cancer Immunol. Res. 2020, 8, 1243–1250. [Google Scholar] [CrossRef]
- Layeghifard, M.; Hwang, D.M.; Guttman, D.S. Disentangling Interactions in the Microbiome: A Network Perspective. Trends Microbiol. 2017, 25, 217–228. [Google Scholar] [CrossRef]
- Ji, Z.; Yan, K.; Li, W.; Hu, H.; Zhu, X. Mathematical and Computational Modeling in Complex Biological Systems. Biomed. Res. Int. 2017, 2017, 5958321. [Google Scholar] [CrossRef] [PubMed]
- Zhang, B.; Horvath, S. A general framework for weighted gene co-expression network analysis. Stat. Appl. Genet. Mol. Biol. 2005, 4. [Google Scholar] [CrossRef] [PubMed]
- Langfelder, P.; Horvath, S. WGCNA: An R package for weighted correlation network analysis. BMC Bioinform. 2008, 9, 559. [Google Scholar] [CrossRef] [PubMed] [Green Version]
- Vernocchi, P.; Del Chierico, F.; Putignani, L. Gut Microbiota Profiling: Metabolomics Based Approach to Unravel Compounds Affecting Human Health. Front. Microbiol. 2016, 7, 1144. [Google Scholar] [CrossRef] [PubMed]
- Al Hinai, E.A.; Kullamethee, P.; Rowland, I.R.; Swann, J.; Walton, G.E.; Commane, D.M. Modelling the role of microbial p-cresol in colorectal genotoxicity. Gut Microbes 2019, 10, 398–411. [Google Scholar] [CrossRef] [Green Version]
- Verbeke, K.A.; Boobis, A.R.; Chiodini, A.; Edwards, C.A.; Franck, A.; Kleerebezem, M.; Nauta, A.; Raes, J.; van Tol, E.A.F.; Tuohy, K.M. Towards microbial fermentation metabolites as markers for health benefits of prebiotics. Nutr. Res. Rev. 2015, 28, 42–66. [Google Scholar] [CrossRef] [PubMed] [Green Version]
- Saito, Y.; Sato, T.; Nomoto, K.; Tsuji, H. Identification of phenol- and p-cresol-producing intestinal bacteria by using media supplemented with tyrosine and its metabolites. FEMS Microbiol. Ecol. 2018, 94, fiy125. [Google Scholar] [CrossRef] [PubMed]
- Heerdt, B.G.; Houston, M.A.; Augenlicht, L.H. Potentiation by specific short-chain fatty acids of differentiation and apoptosis in human colonic carcinoma cell lines. Cancer Res. 1994, 54, 3288–3293. [Google Scholar] [PubMed]
- Santos, P.M.; del Nogal Sánchez, M.; Pozas, Á.P.C.; Pavón, J.L.P.; Cordero, B.M. Determination of ketones and ethyl acetate—A preliminary study for the discrimination of patients with lung cancer. Anal. Bioanal. Chem. 2017, 409, 5689–5696. [Google Scholar] [CrossRef] [PubMed]
- Filipiak, W.; Sponring, A.; Filipiak, A.; Ager, C.; Schubert, J.; Miekisch, W.; Amann, A.; Troppmair, J. TD-GC-MS Analysis of Volatile Metabolites of Human Lung Cancer and Normal Cells In vitro. Cancer Epidemiol. Biomark. Prev. 2010, 19, 182–195. [Google Scholar] [CrossRef] [PubMed] [Green Version]
- Raman, M.; Ahmed, I.; Gillevet, P.M.; Probert, C.S.; Ratcliffe, N.M.; Smith, S.; Greenwood, R.; Sikaroodi, M.; Lam, V.; Crotty, P.; et al. Fecal microbiome and volatile organic compound metabolome in obese humans with nonalcoholic fatty liver disease. Clin. Gastroenterol. Hepatol. 2013, 11, 868–875.e3. [Google Scholar] [CrossRef] [PubMed]
- Patel, K.P.; Luo, F.J.-G.; Plummer, N.S.; Hostetter, T.H.; Meyer, T.W. The Production of p-Cresol Sulfate and Indoxyl Sulfate in Vegetarians Versus Omnivores. Clin. J. Am. Soc. Nephrol. 2012, 7, 982–988. [Google Scholar] [CrossRef] [PubMed]
- Passmore, I.J.; Letertre, M.P.M.; Preston, M.D.; Bianconi, I.; Harrison, M.A.; Nasher, F.; Kaur, H.; Hong, H.A.; Baines, S.D.; Cutting, S.M.; et al. Para-cresol production by Clostridium difficile affects microbial diversity and membrane integrity of Gram-negative bacteria. PLoS Pathog. 2018, 14, e1007191. [Google Scholar] [CrossRef] [PubMed] [Green Version]
- Odamaki, T.; Kato, K.; Sugahara, H.; Hashikura, N.; Takahashi, S.; Xiao, J.; Abe, F.; Osawa, R. Age-related changes in gut microbiota composition from newborn to centenarian: A cross-sectional study. BMC Microbiol. 2016, 16, 90. [Google Scholar] [CrossRef] [Green Version]
- Mur, L.A.; Huws, S.A.; Cameron, S.J.; Lewis, P.D.; Lewis, K.E. Lung cancer: A new frontier for microbiome research and clinical translation. Ecancermedicalscience 2018, 12, 866. [Google Scholar] [CrossRef]
- Routy, B.; Le Chatelier, E.; Derosa, L.; Duong, C.P.M.; Alou, M.T.; Daillère, R.; Fluckiger, A.; Messaoudene, M.; Rauber, C.; Roberti, M.P.; et al. Gut microbiome influences efficacy of PD-1-based immunotherapy against epithelial tumors. Science 2018, 359, 91–97. [Google Scholar] [CrossRef] [Green Version]
- Zhang, L.; Qin, Q.; Liu, M.; Zhang, X.; He, F.; Wang, G. Akkermansia muciniphila can reduce the damage of gluco/lipotoxicity, oxidative stress and inflammation, and normalize intestine microbiota in streptozotocin-induced diabetic rats. Pathog. Dis. 2018, 76. [Google Scholar] [CrossRef] [Green Version]
- Rothhammer, V.; Mascanfroni, I.D.; Bunse, L.; Takenaka, M.C.; Kenison, J.E.; Mayo, L.; Chao, C.-C.; Patel, B.; Yan, R.; Blain, M.; et al. Type I interferons and microbial metabolites of tryptophan modulate astrocyte activity and central nervous system inflammation via the aryl hydrocarbon receptor. Nat. Med. 2016, 22, 586–597. [Google Scholar] [CrossRef]
- Roager, H.M.; Licht, T.R. Microbial tryptophan catabolites in health and disease. Nat. Commun. 2018, 9, 3294. [Google Scholar] [CrossRef] [Green Version]
- Rondanelli, M.; Perdoni, F.; Infantino, V.; Faliva, M.A.; Peroni, G.; Iannello, G.; Nichetti, M.; Alalwan, T.A.; Perna, S.; Cocuzza, C. Volatile Organic Compounds as Biomarkers of Gastrointestinal Diseases and Nutritional Status. J. Anal. Methods Chem. 2019, 2019, 1–14. [Google Scholar] [CrossRef] [Green Version]
- Caporaso, J.G.; Kuczynski, J.; Stombaugh, J.; Bittinger, K.; Bushman, F.D.; Costello, E.K.; Fierer, N.; Peña, A.G.; Goodrich, J.K.; Gordon, J.I.; et al. QIIME allows analysis of high-throughput community sequencing data. Nat. Methods 2010, 7, 335–336. [Google Scholar] [CrossRef] [PubMed] [Green Version]
- Caporaso, J.G.; Bittinger, K.; Bushman, F.D.; DeSantis, T.Z.; Andersen, G.L.; Knight, R. PyNAST: A flexible tool for aligning sequences to a template alignment. Bioinformatics 2010, 26, 266–267. [Google Scholar] [CrossRef] [PubMed] [Green Version]
- DeSantis, T.Z.; Hugenholtz, P.; Larsen, N.; Rojas, M.; Brodie, E.L.; Keller, K.; Huber, T.; Dalevi, D.; Hu, P.; Andersen, G.L. Greengenes, a chimera-checked 16S rRNA gene database and workbench compatible with ARB. Appl. Environ. Microbiol. 2006, 72, 5069–5072. [Google Scholar] [CrossRef] [PubMed] [Green Version]
- Vernocchi, P.; Del Chierico, F.; Russo, A.; Majo, F.; Rossitto, M.; Valerio, M.; Casadei, L.; La Storia, A.; De Filippis, F.; Rizzo, C.; et al. Gut microbiota signatures in cystic fibrosis: Loss of host CFTR function drives the microbiota enterophenotype. PLoS ONE 2018, 13, e0208171. [Google Scholar] [CrossRef]
- Garner, C.E.; Smith, S.; de Lacy Costello, B.; White, P.; Spencer, R.; Probert, C.S.J.; Ratcliffe, N.M. Volatile organic compounds from feces and their potential for diagnosis of gastrointestinal disease. FASEB J. 2007, 21, 1675–1688. [Google Scholar] [CrossRef] [Green Version]
- Brasili, E.; Hassimotto, N.M.A.; Del Chierico, F.; Marini, F.; Quagliariello, A.; Sciubba, F.; Miccheli, A.; Putignani, L.; Lajolo, F. Daily Consumption of Orange Juice from Citrus sinensis L. Osbeck cv. Cara Cara and cv. Bahia Differently Affects Gut Microbiota Profiling as Unveiled by an Integrated Meta-Omics Approach. J. Agric. Food Chem. 2019, 67, 1381–1391. [Google Scholar] [CrossRef]
- Brasili, E.; Mengheri, E.; Tomassini, A.; Capuani, G.; Roselli, M.; Finamore, A.; Sciubba, F.; Marini, F.; Miccheli, A. Lactobacillus acidophilus La5 and Bifidobacterium lactis Bb12 induce different age-related metabolic profiles revealed by 1H-NMR spectroscopy in urine and feces of mice. J. Nutr. 2013, 143, 1549–1557. [Google Scholar] [CrossRef] [Green Version]
- Wishart, D.S.; Jewison, T.; Guo, A.C.; Wilson, M.; Knox, C.; Liu, Y.; Djoumbou, Y.; Mandal, R.; Aziat, F.; Dong, E.; et al. HMDB 3.0—The Human Metabolome Database in 2013. Nucleic Acids Res. 2013, 41, D801–D807. [Google Scholar] [CrossRef]
- Paci, P.; Colombo, T.; Fiscon, G.; Gurtner, A.; Pavesi, G.; Farina, L. SWIM: A computational tool to unveiling crucial nodes in complex biological networks. Sci. Rep. 2017, 7, 44797. [Google Scholar] [CrossRef] [Green Version]
- Benjamini, Y.; Hochberg, Y. Controlling the False Discovery Rate: A Practical and Powerful Approach to Multiple Testing. J. R. Stat. Soc. Ser. B (Methodol.) 1995, 57, 289–300. [Google Scholar] [CrossRef]
- Caldarelli, G. Scale-Free Networks; Oxford University Press: Oxford, UK, 2007; ISBN 978-0-19-921151-7. [Google Scholar]
- Newman, M. Networks; Oxford University Press: Oxford, UK, 2010; ISBN 978-0-19-920665-0. [Google Scholar]
- Masuda, N.; Sakaki, M.; Ezaki, T.; Watanabe, T. Clustering Coefficients for Correlation Networks. Front. Neuroinform. 2018, 12, 7. [Google Scholar] [CrossRef]
- Watts, D.J.; Strogatz, S.H. Collective dynamics of ‘small-world’ networks. Nature 1998, 393, 440–442. [Google Scholar] [CrossRef] [PubMed]
- Radicchi, F.; Castellano, C.; Cecconi, F.; Loreto, V.; Parisi, D. Defining and identifying communities in networks. Proc. Natl. Acad. Sci. USA 2004, 101, 2658–2663. [Google Scholar] [CrossRef] [PubMed] [Green Version]
- Blondel, V.D.; Guillaume, J.-L.; Lambiotte, R.; Lefebvre, E. Fast unfolding of communities in large networks. J. Stat. Mech. 2008, 2008, P10008. [Google Scholar] [CrossRef] [Green Version]
- Jeong, J.-J.; Kim, K.-A.; Jang, S.-E.; Woo, J.-Y.; Han, M.J.; Kim, D.-H. Orally administrated Lactobacillus pentosus var. plantarum C29 ameliorates age-dependent colitis by inhibiting the nuclear factor-kappa B signaling pathway via the regulation of lipopolysaccharide production by gut microbiota. PLoS ONE 2015, 10, e0116533. [Google Scholar] [CrossRef] [Green Version]
- Han, J.-D.J.; Bertin, N.; Hao, T.; Goldberg, D.S.; Berriz, G.F.; Zhang, L.V.; Dupuy, D.; Walhout, A.J.M.; Cusick, M.E.; Roth, F.P.; et al. Evidence for dynamically organized modularity in the yeast protein–protein interaction network. Nature 2004, 430, 88–93. [Google Scholar] [CrossRef]
- Carter, S.L.; Brechbuhler, C.M.; Griffin, M.; Bond, A.T. Gene co-expression network topology provides a framework for molecular characterization of cellular state. Bioinformatics 2004, 20, 2242–2250. [Google Scholar] [CrossRef] [Green Version]
- Ribas, A.; Wolchok, J.D. Cancer immunotherapy using checkpoint blockade. Science 2018, 359, 1350–1355. [Google Scholar] [CrossRef] [Green Version]
- Kruger, S.; Ilmer, M.; Kobold, S.; Cadilha, B.L.; Endres, S.; Ormanns, S.; Schuebbe, G.; Renz, B.W.; D’Haese, J.G.; Schloesser, H.; et al. Advances in cancer immunotherapy 2019—Latest trends. J. Exp. Clin. Cancer Res. 2019, 38, 268. [Google Scholar] [CrossRef] [Green Version]
- Gopalakrishnan, V.; Spencer, C.N.; Nezi, L.; Reuben, A.; Andrews, M.C.; Karpinets, T.V.; Prieto, P.A.; Vicente, D.; Hoffman, K.; Wei, S.C.; et al. Gut microbiome modulates response to anti-PD-1 immunotherapy in melanoma patients. Science 2018, 359, 97–103. [Google Scholar] [CrossRef] [Green Version]
- Dubin, K.; Callahan, M.K.; Ren, B.; Khanin, R.; Viale, A.; Ling, L.; No, D.; Gobourne, A.; Littmann, E.; Huttenhower, C.; et al. Intestinal microbiome analyses identify melanoma patients at risk for checkpoint-blockade-induced colitis. Nat. Commun. 2016, 7, 10391. [Google Scholar] [CrossRef] [PubMed] [Green Version]
- David, L.A.; Maurice, C.F.; Carmody, R.N.; Gootenberg, D.B.; Button, J.E.; Wolfe, B.E.; Ling, A.V.; Devlin, A.S.; Varma, Y.; Fischbach, M.A.; et al. Diet rapidly and reproducibly alters the human gut microbiome. Nature 2014, 505, 559–563. [Google Scholar] [CrossRef] [PubMed] [Green Version]
- Lim, B.; Zimmermann, M.; Barry, N.A.; Goodman, A.L. Engineered Regulatory Systems Modulate Gene Expression of Human Commensals in the Gut. Cell 2017, 169, 547–558.e15. [Google Scholar] [CrossRef] [PubMed] [Green Version]
- Fessler, J.; Matson, V.; Gajewski, T.F. Exploring the emerging role of the microbiome in cancer immunotherapy. J. Immunother. Cancer 2019, 7, 108. [Google Scholar] [CrossRef] [PubMed]


Publisher’s Note: MDPI stays neutral with regard to jurisdictional claims in published maps and institutional affiliations. |
© 2020 by the authors. Licensee MDPI, Basel, Switzerland. This article is an open access article distributed under the terms and conditions of the Creative Commons Attribution (CC BY) license (http://creativecommons.org/licenses/by/4.0/).
Share and Cite
Vernocchi, P.; Gili, T.; Conte, F.; Del Chierico, F.; Conta, G.; Miccheli, A.; Botticelli, A.; Paci, P.; Caldarelli, G.; Nuti, M.; et al. Network Analysis of Gut Microbiome and Metabolome to Discover Microbiota-Linked Biomarkers in Patients Affected by Non-Small Cell Lung Cancer. Int. J. Mol. Sci. 2020, 21, 8730. https://doi.org/10.3390/ijms21228730
Vernocchi P, Gili T, Conte F, Del Chierico F, Conta G, Miccheli A, Botticelli A, Paci P, Caldarelli G, Nuti M, et al. Network Analysis of Gut Microbiome and Metabolome to Discover Microbiota-Linked Biomarkers in Patients Affected by Non-Small Cell Lung Cancer. International Journal of Molecular Sciences. 2020; 21(22):8730. https://doi.org/10.3390/ijms21228730
Chicago/Turabian StyleVernocchi, Pamela, Tommaso Gili, Federica Conte, Federica Del Chierico, Giorgia Conta, Alfredo Miccheli, Andrea Botticelli, Paola Paci, Guido Caldarelli, Marianna Nuti, and et al. 2020. "Network Analysis of Gut Microbiome and Metabolome to Discover Microbiota-Linked Biomarkers in Patients Affected by Non-Small Cell Lung Cancer" International Journal of Molecular Sciences 21, no. 22: 8730. https://doi.org/10.3390/ijms21228730