
In Situ Raman Study of Neurodegenerated Human Neuroblastoma Cells Exposed to Outer-Membrane Vesicles Isolated from Porphyromonas gingivalis

 , ,
, ,  , ,
, ,  , , and
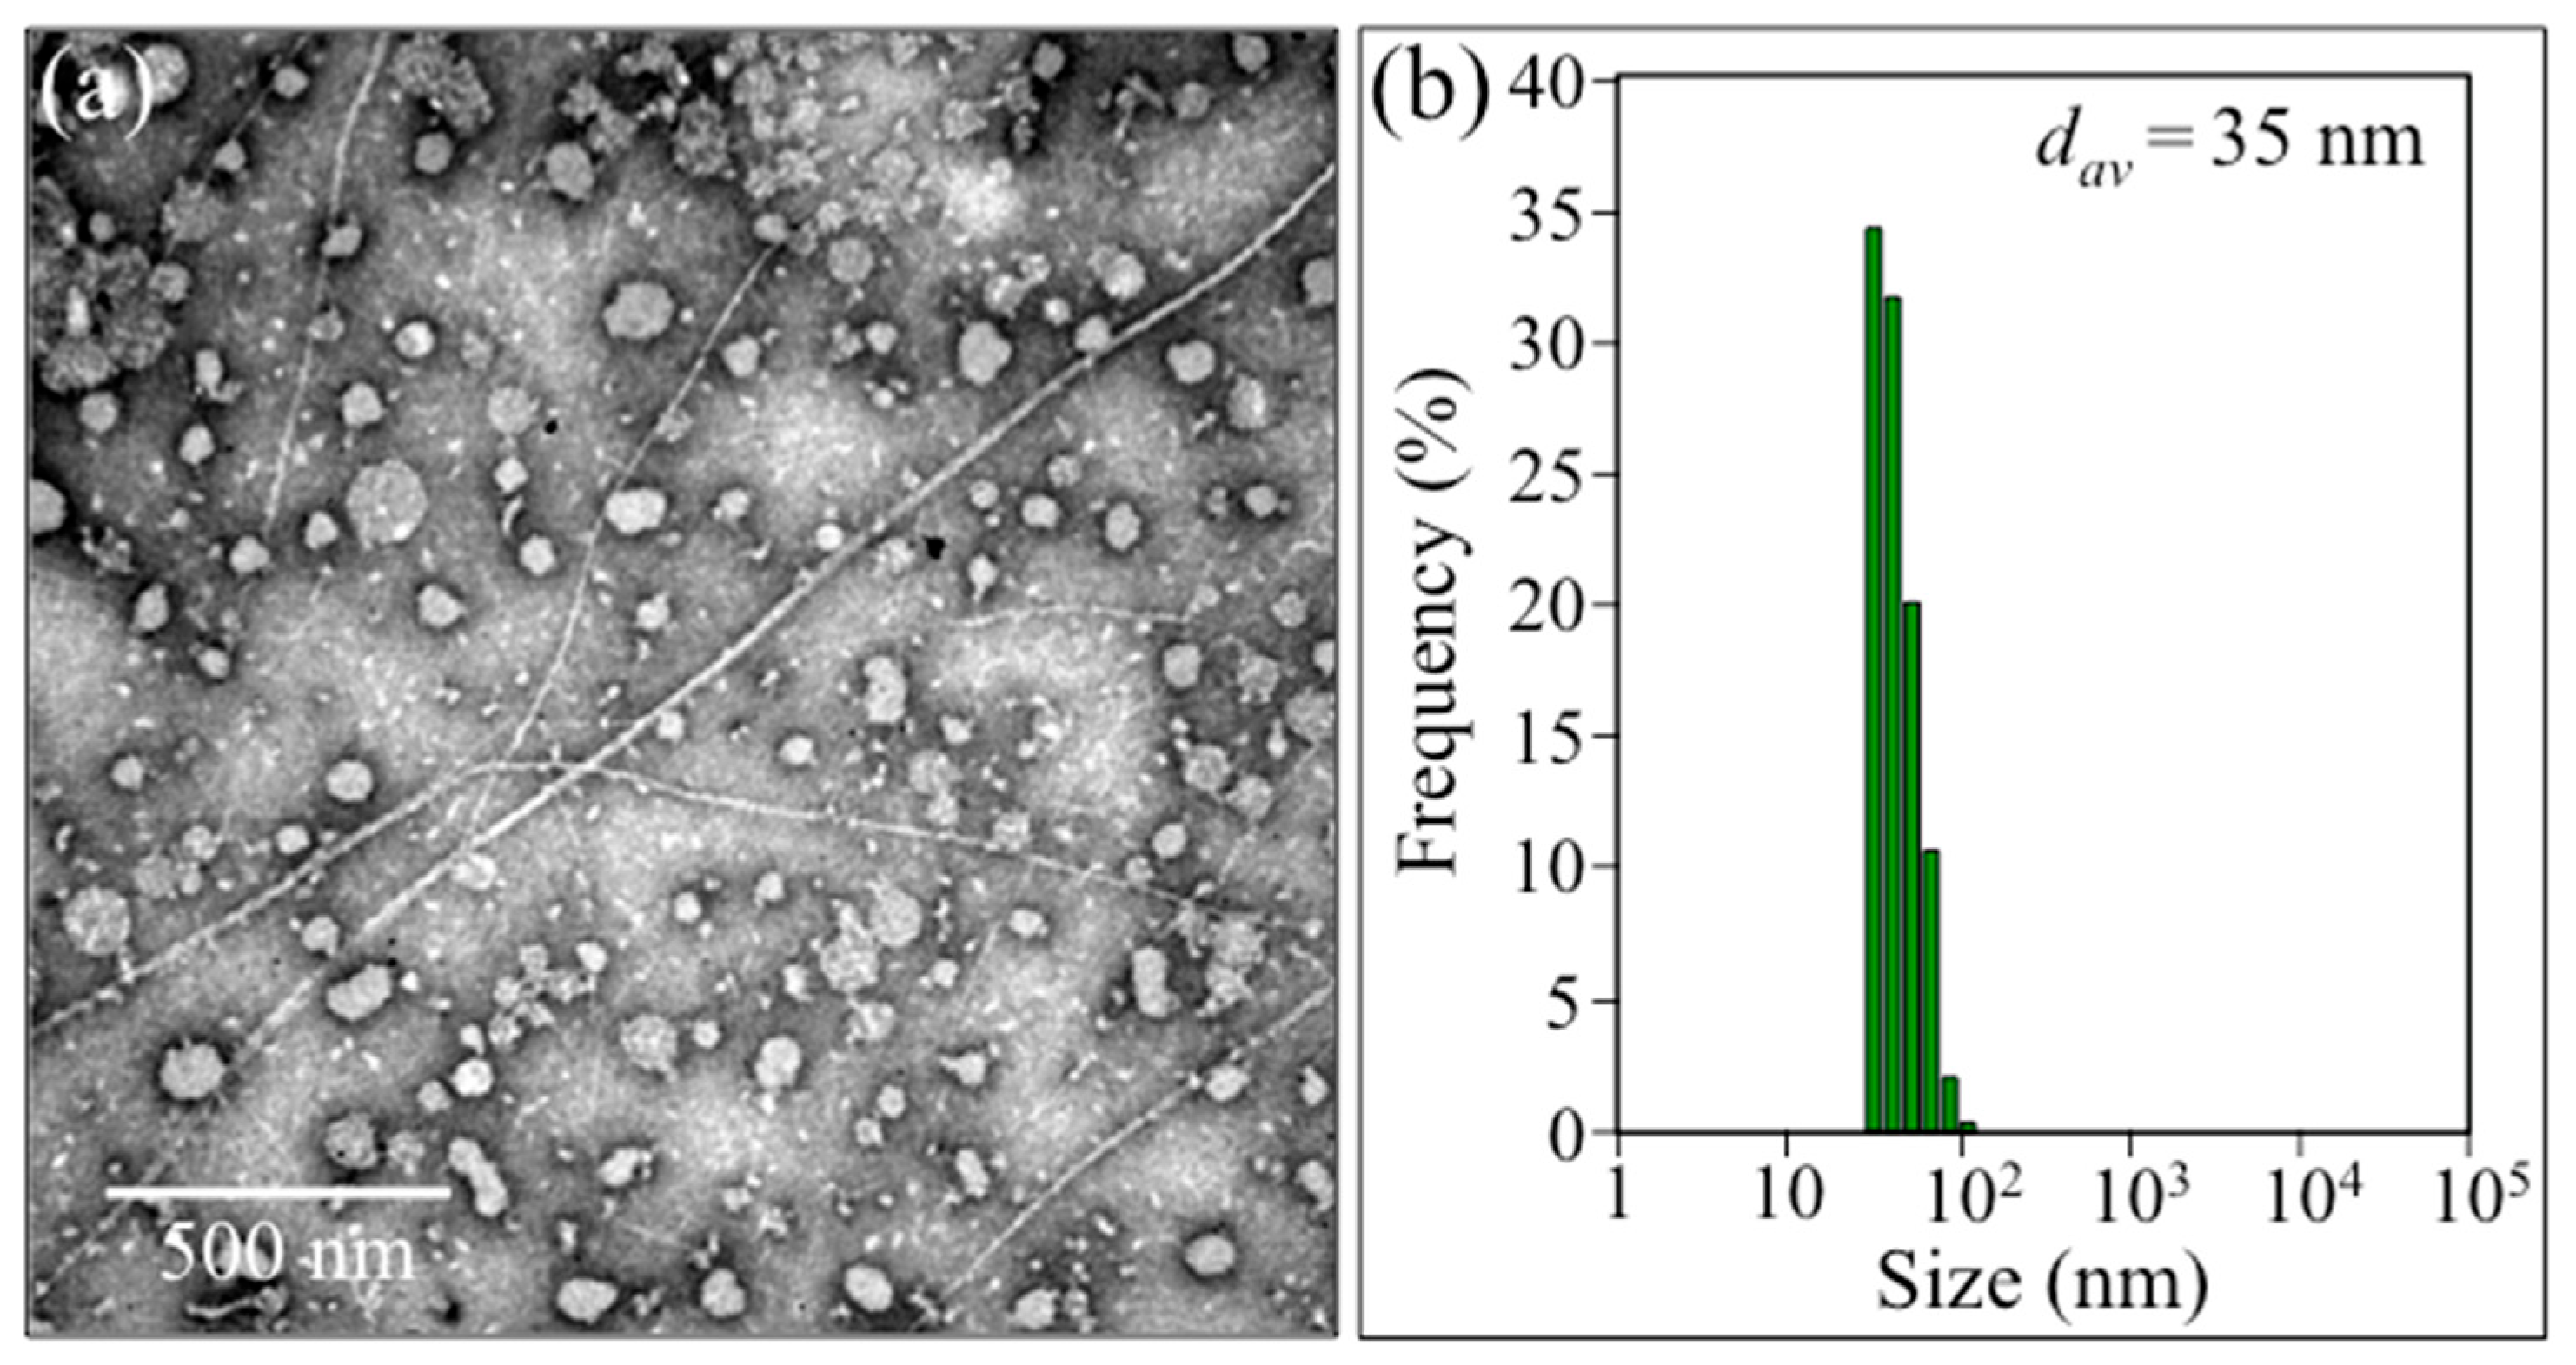
Abstract
:1. Introduction
2. Results
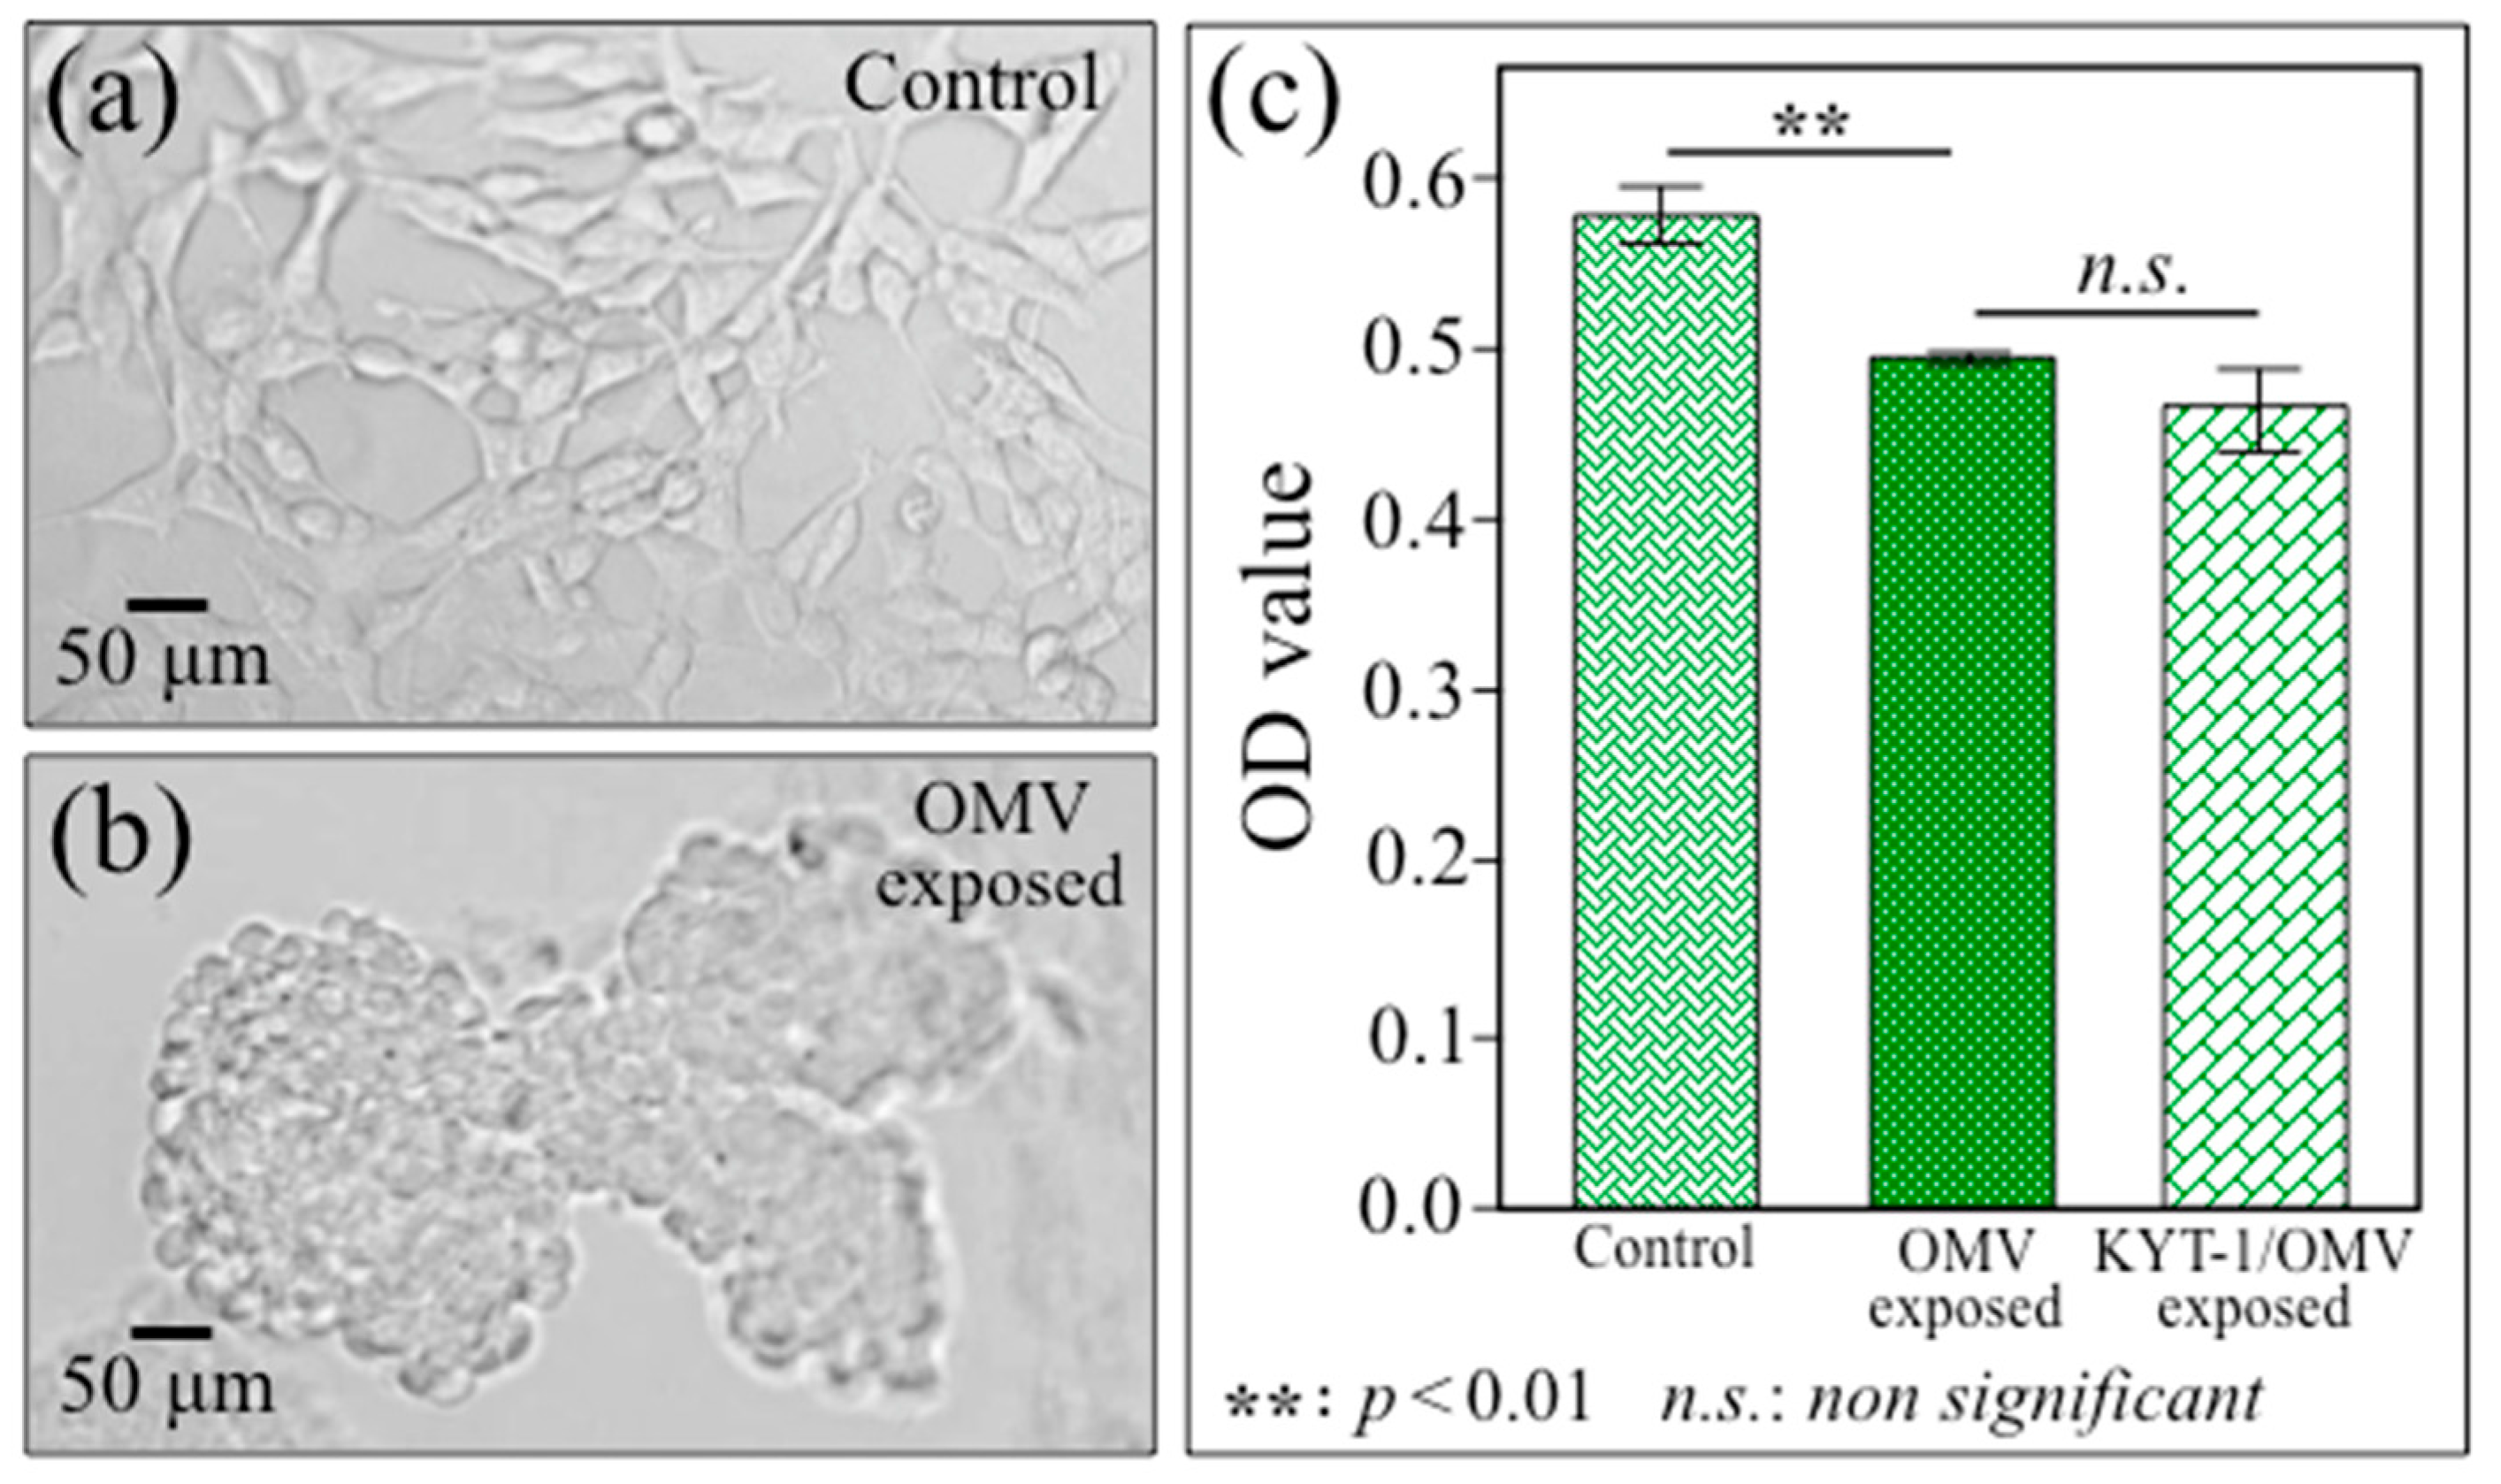
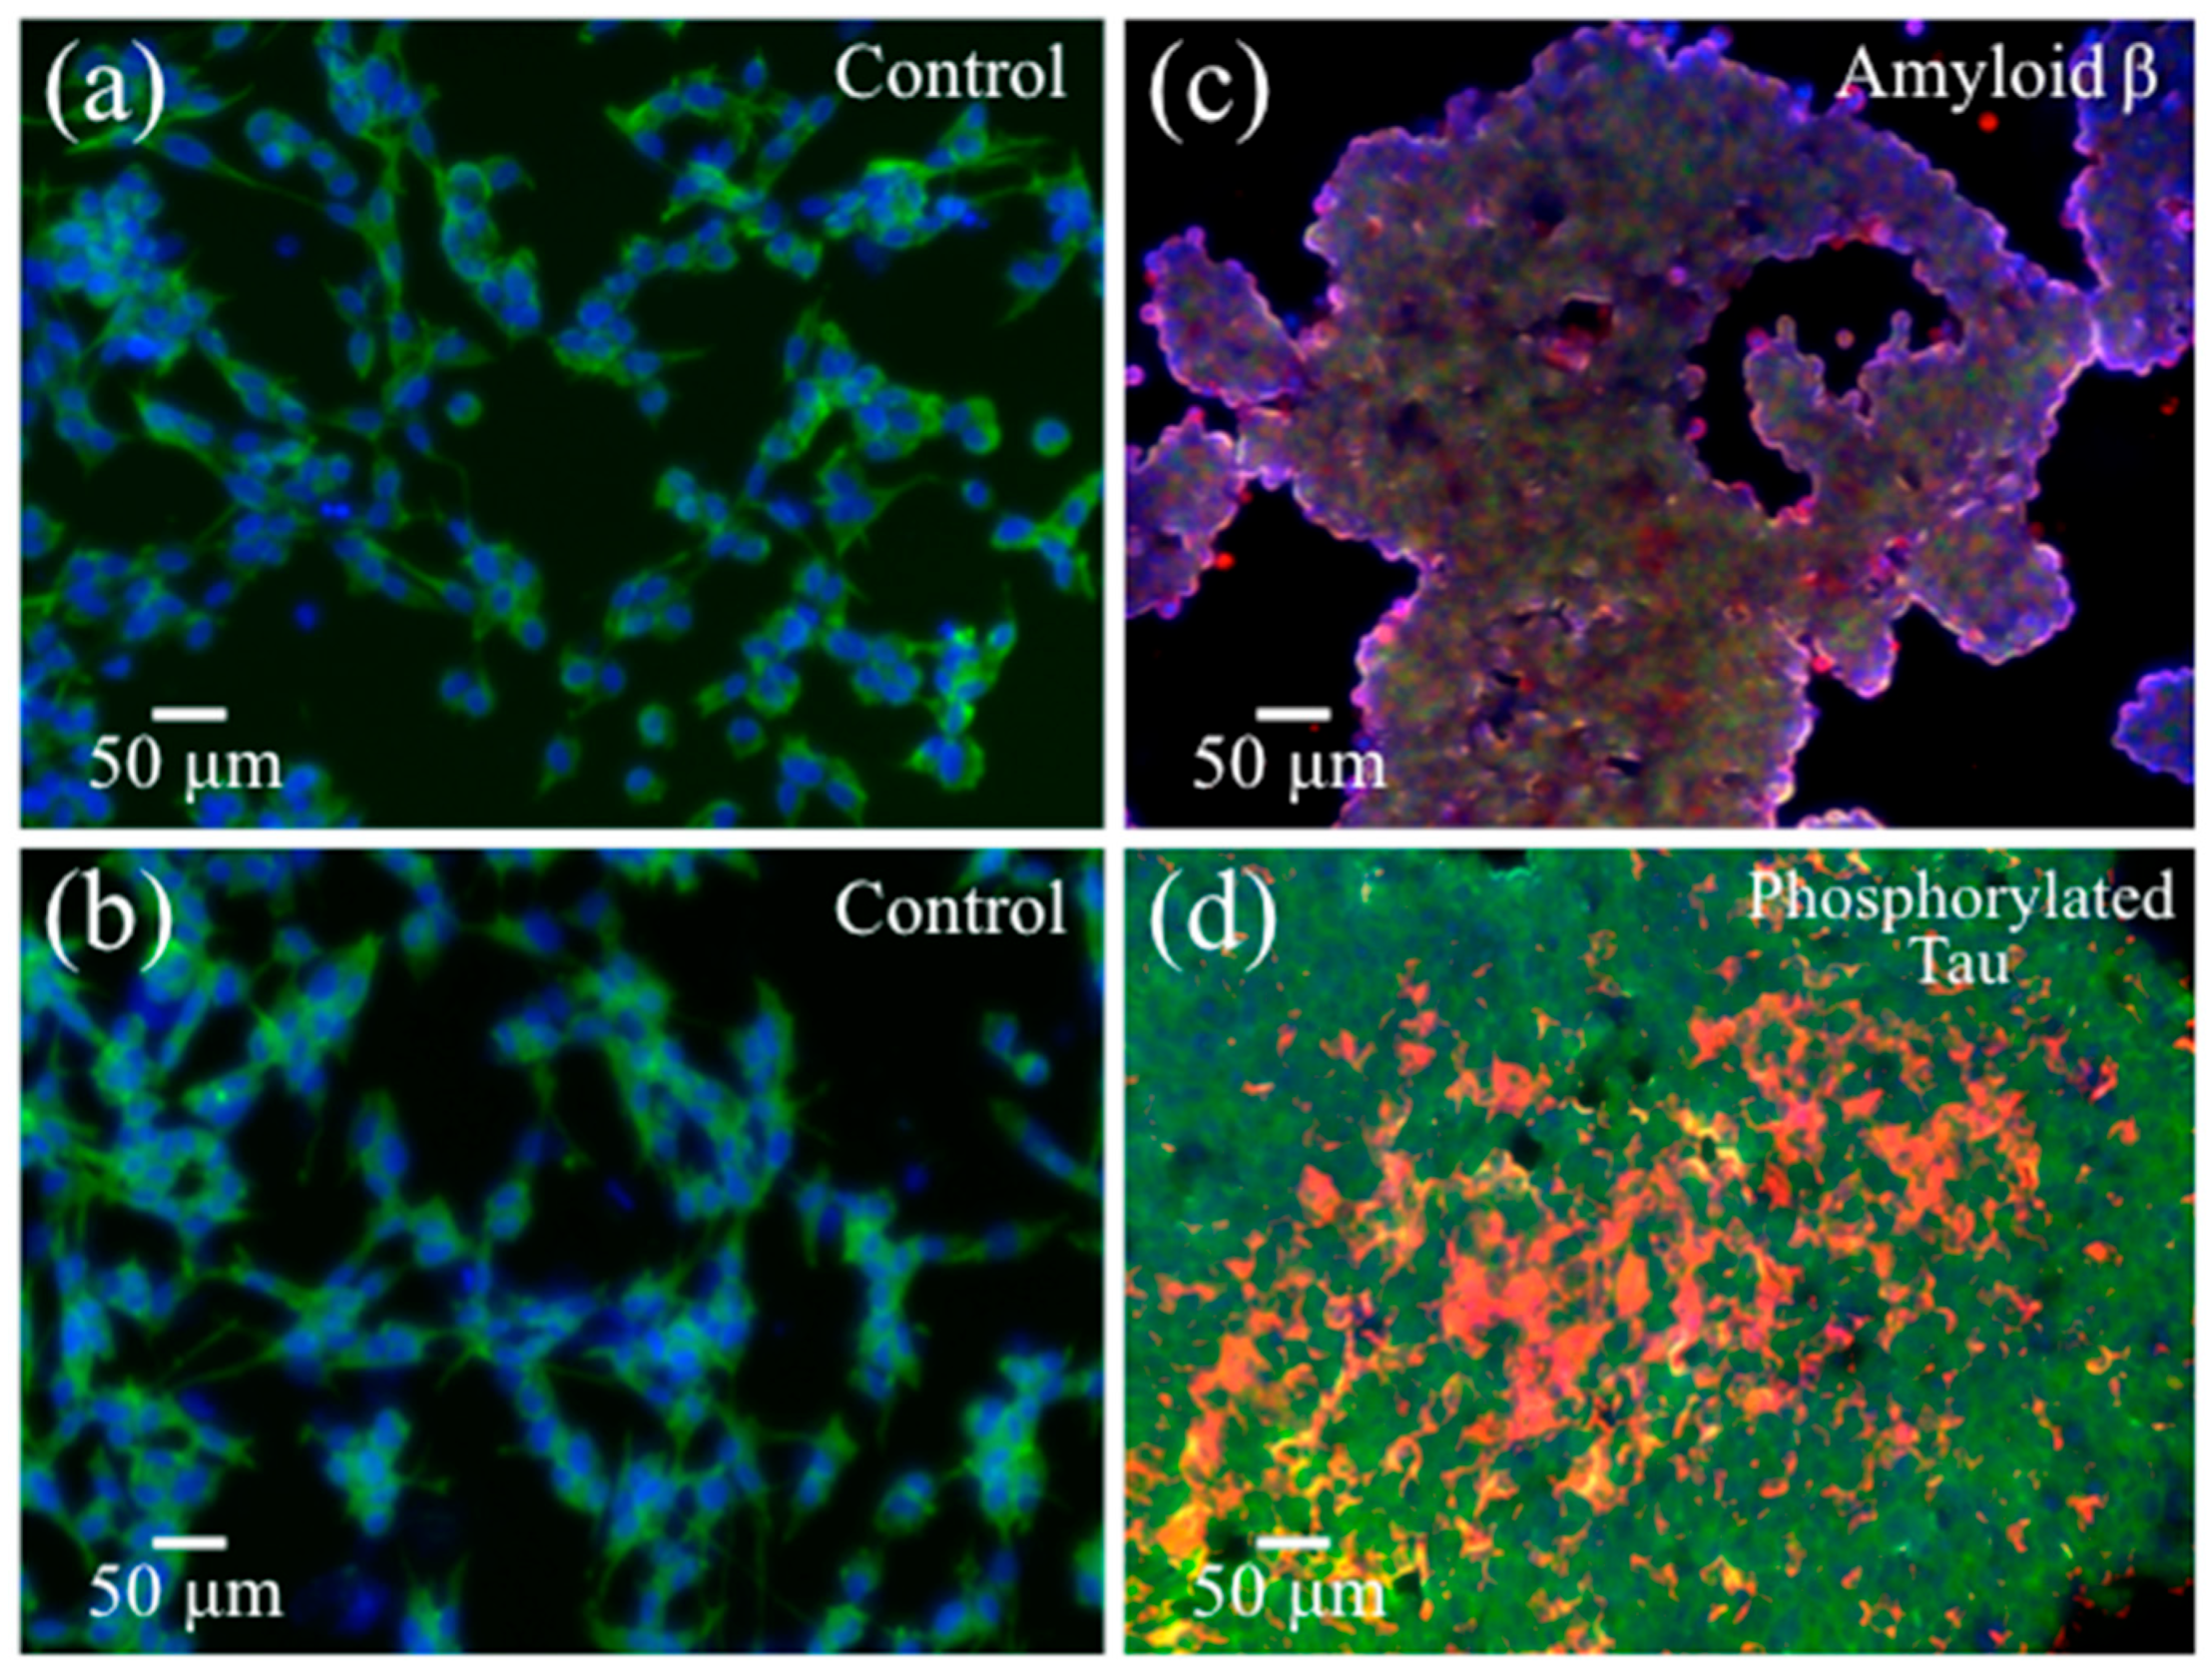
2.1. Transmission Electron Microscopy and Immunochemistry Assessments
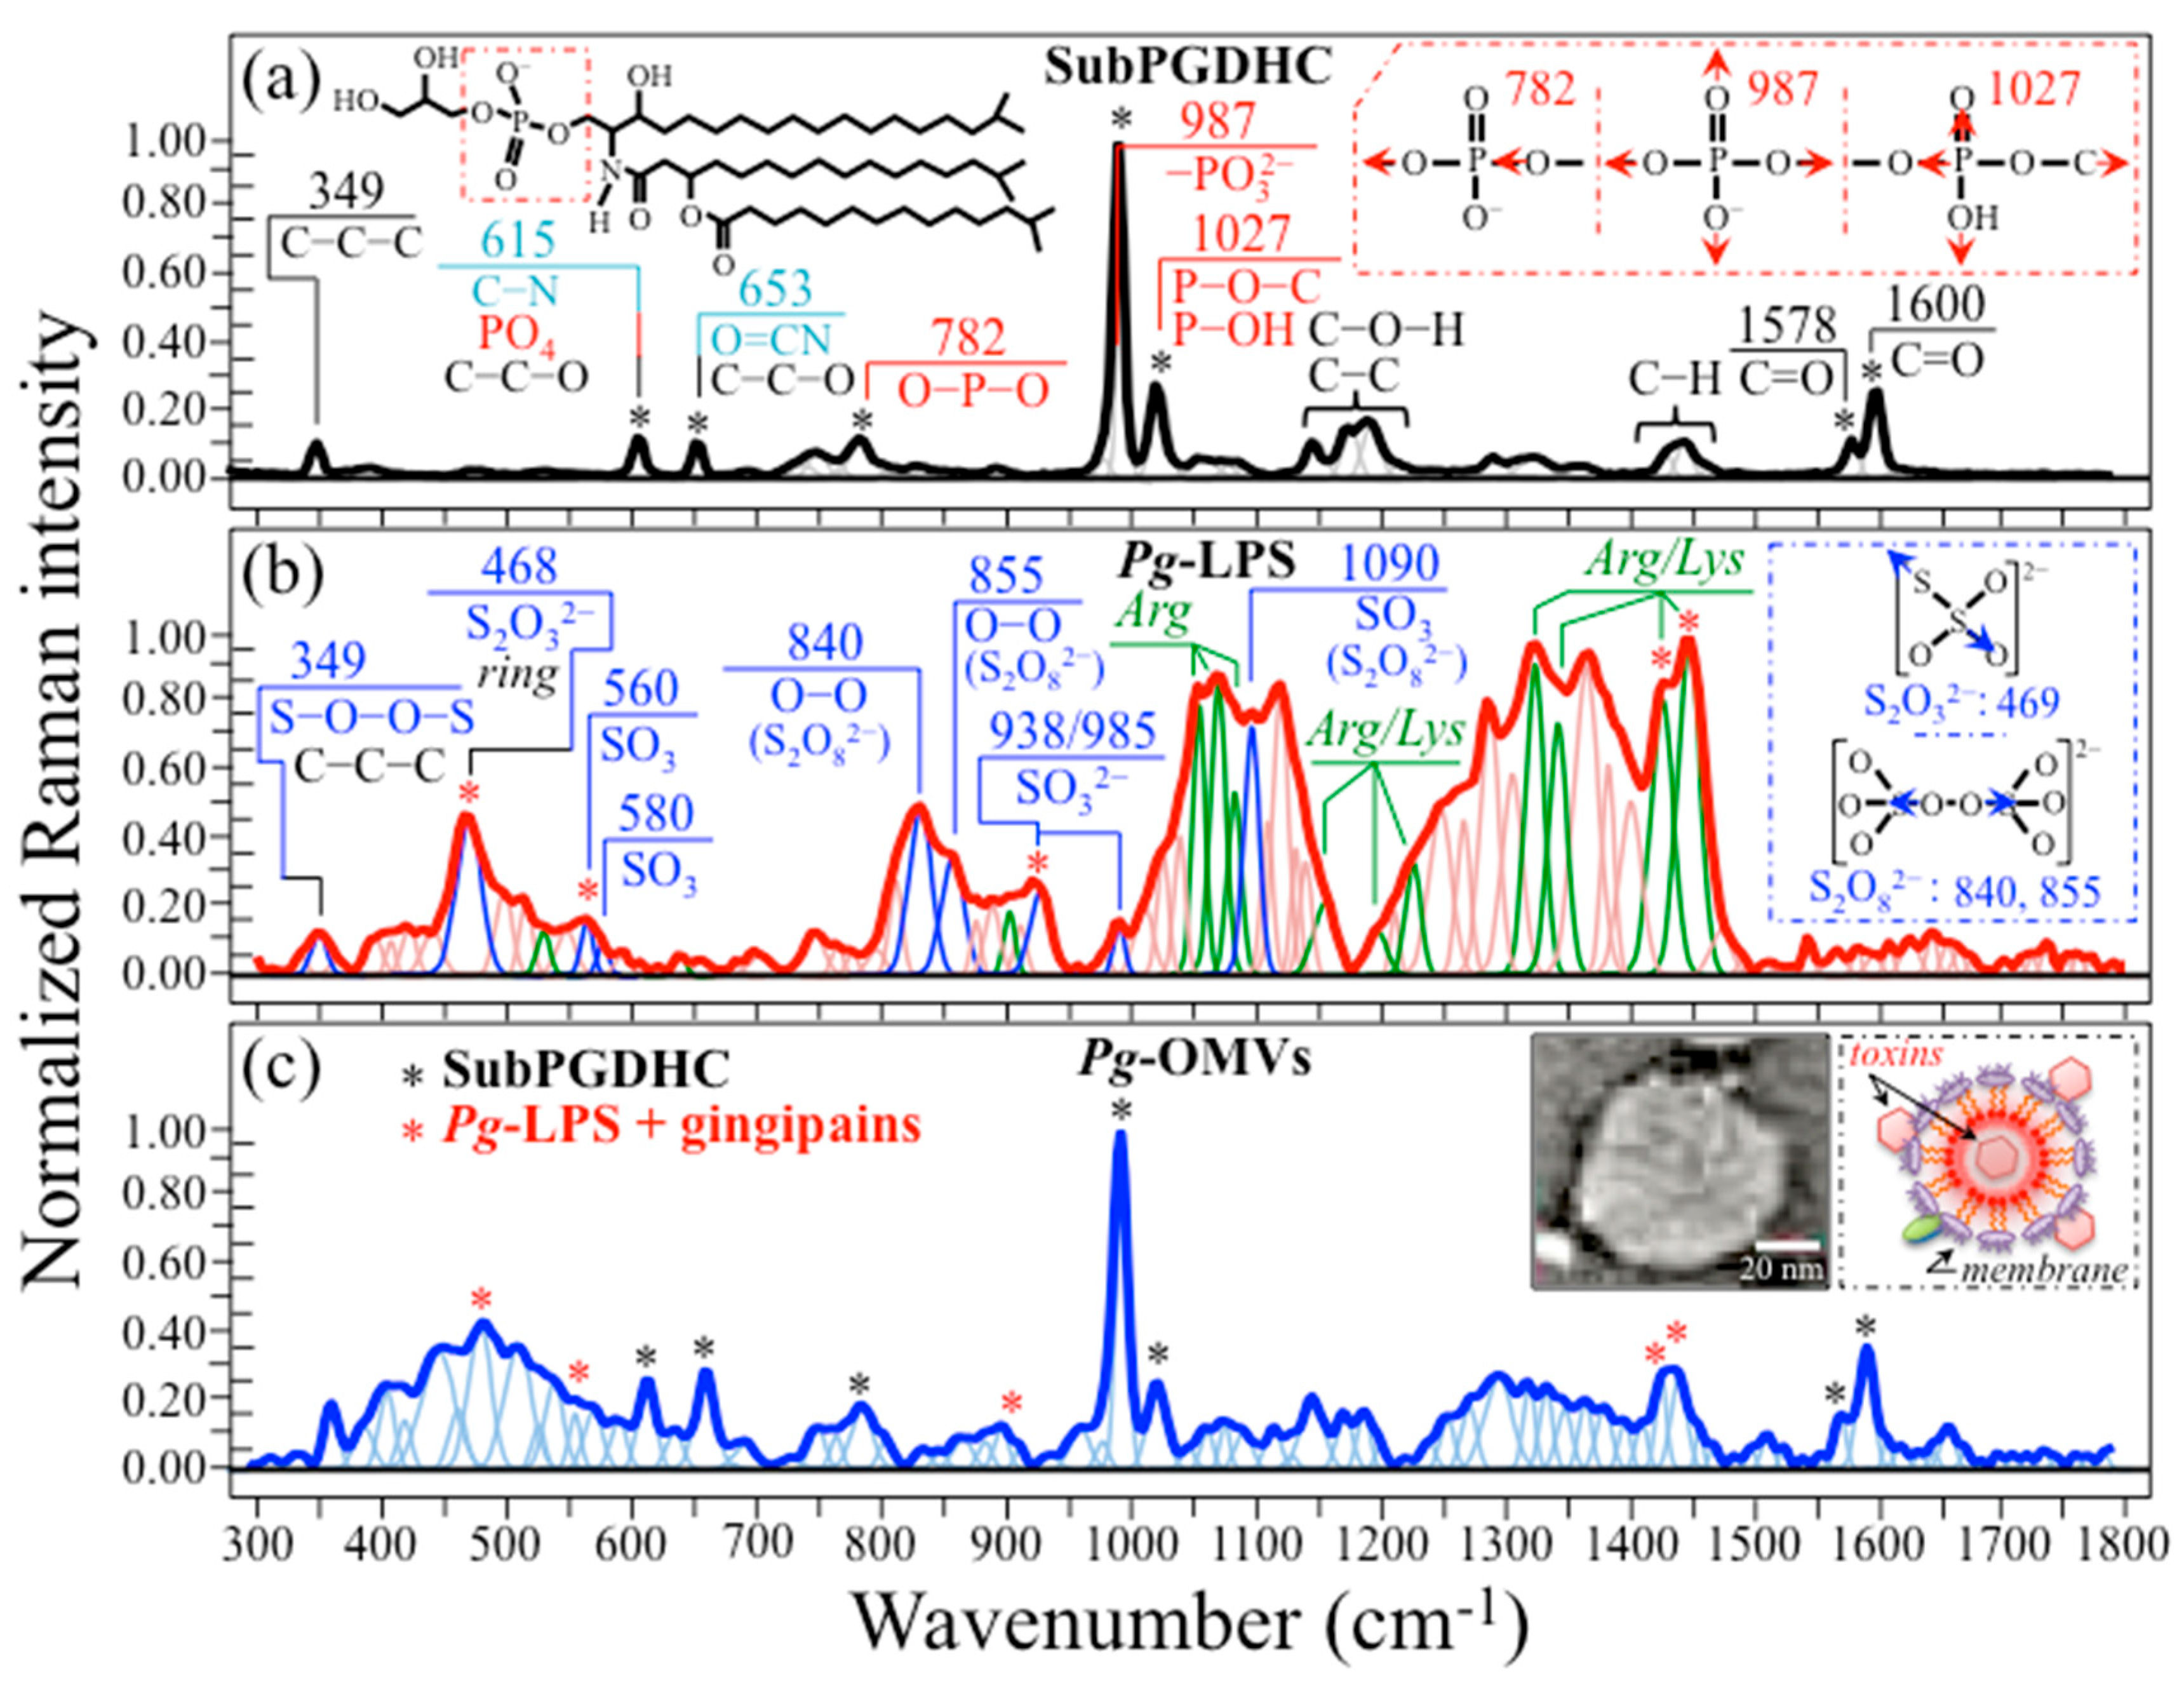
2.2. Raman Spectra of Pg-OMVs and Their Main Constituents
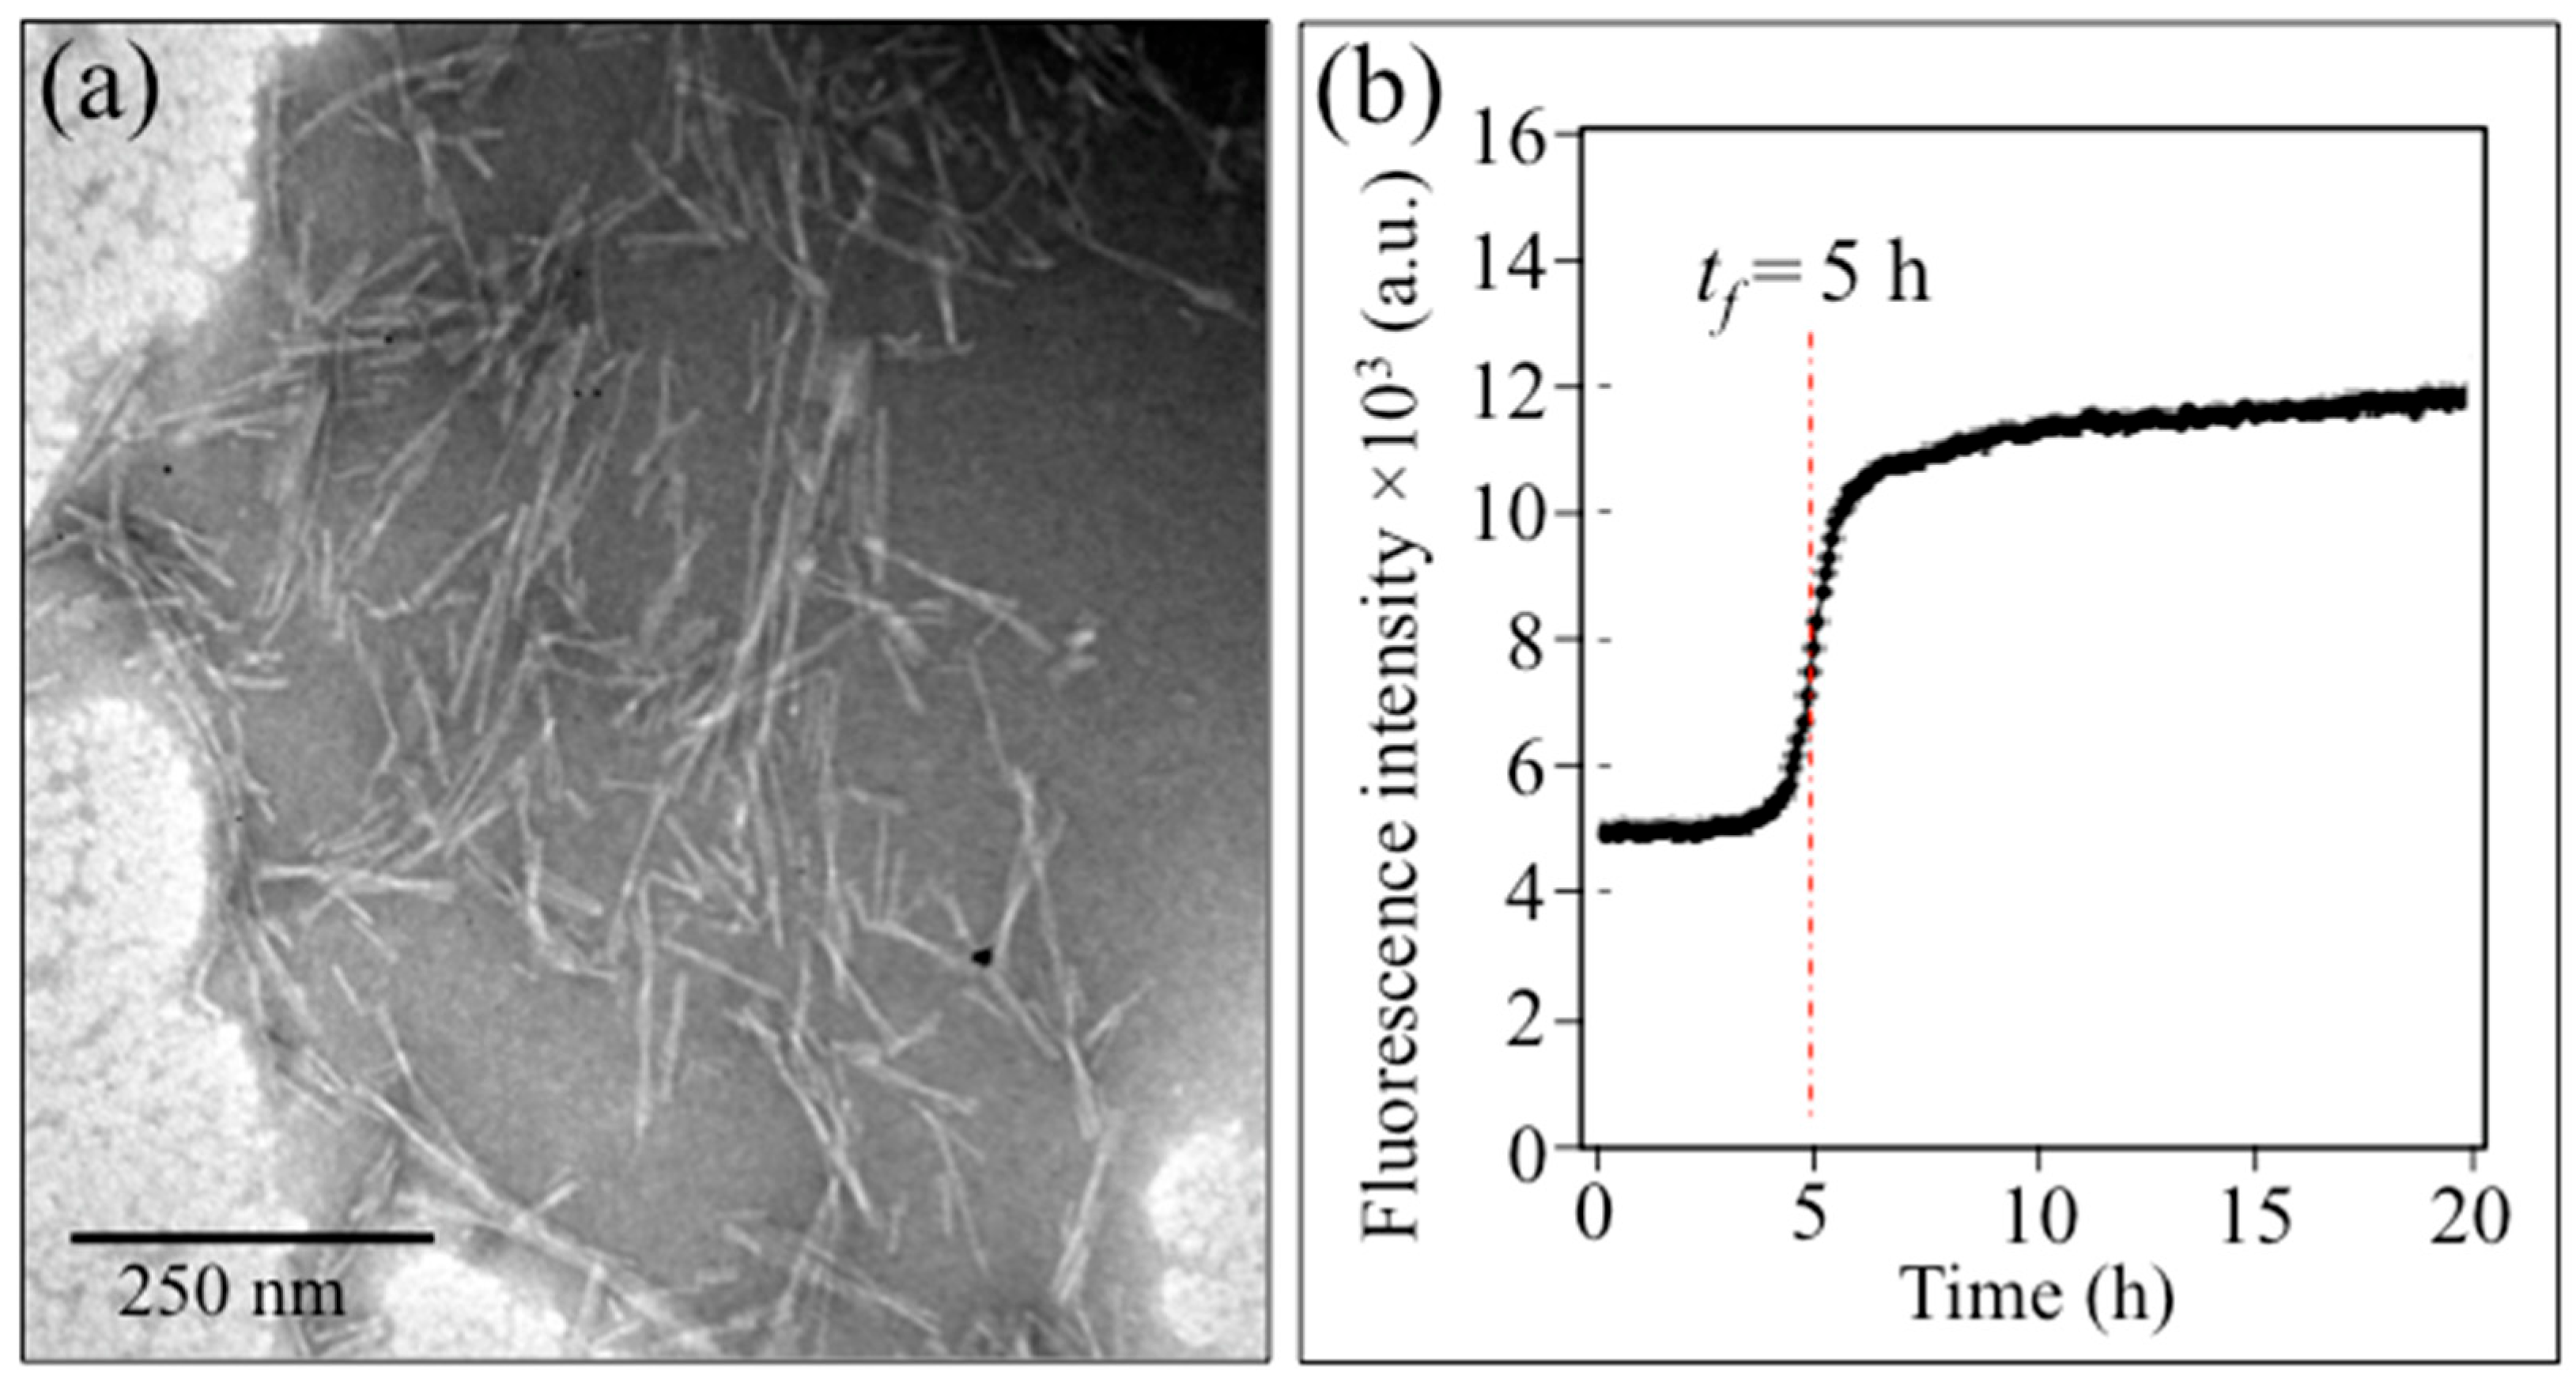
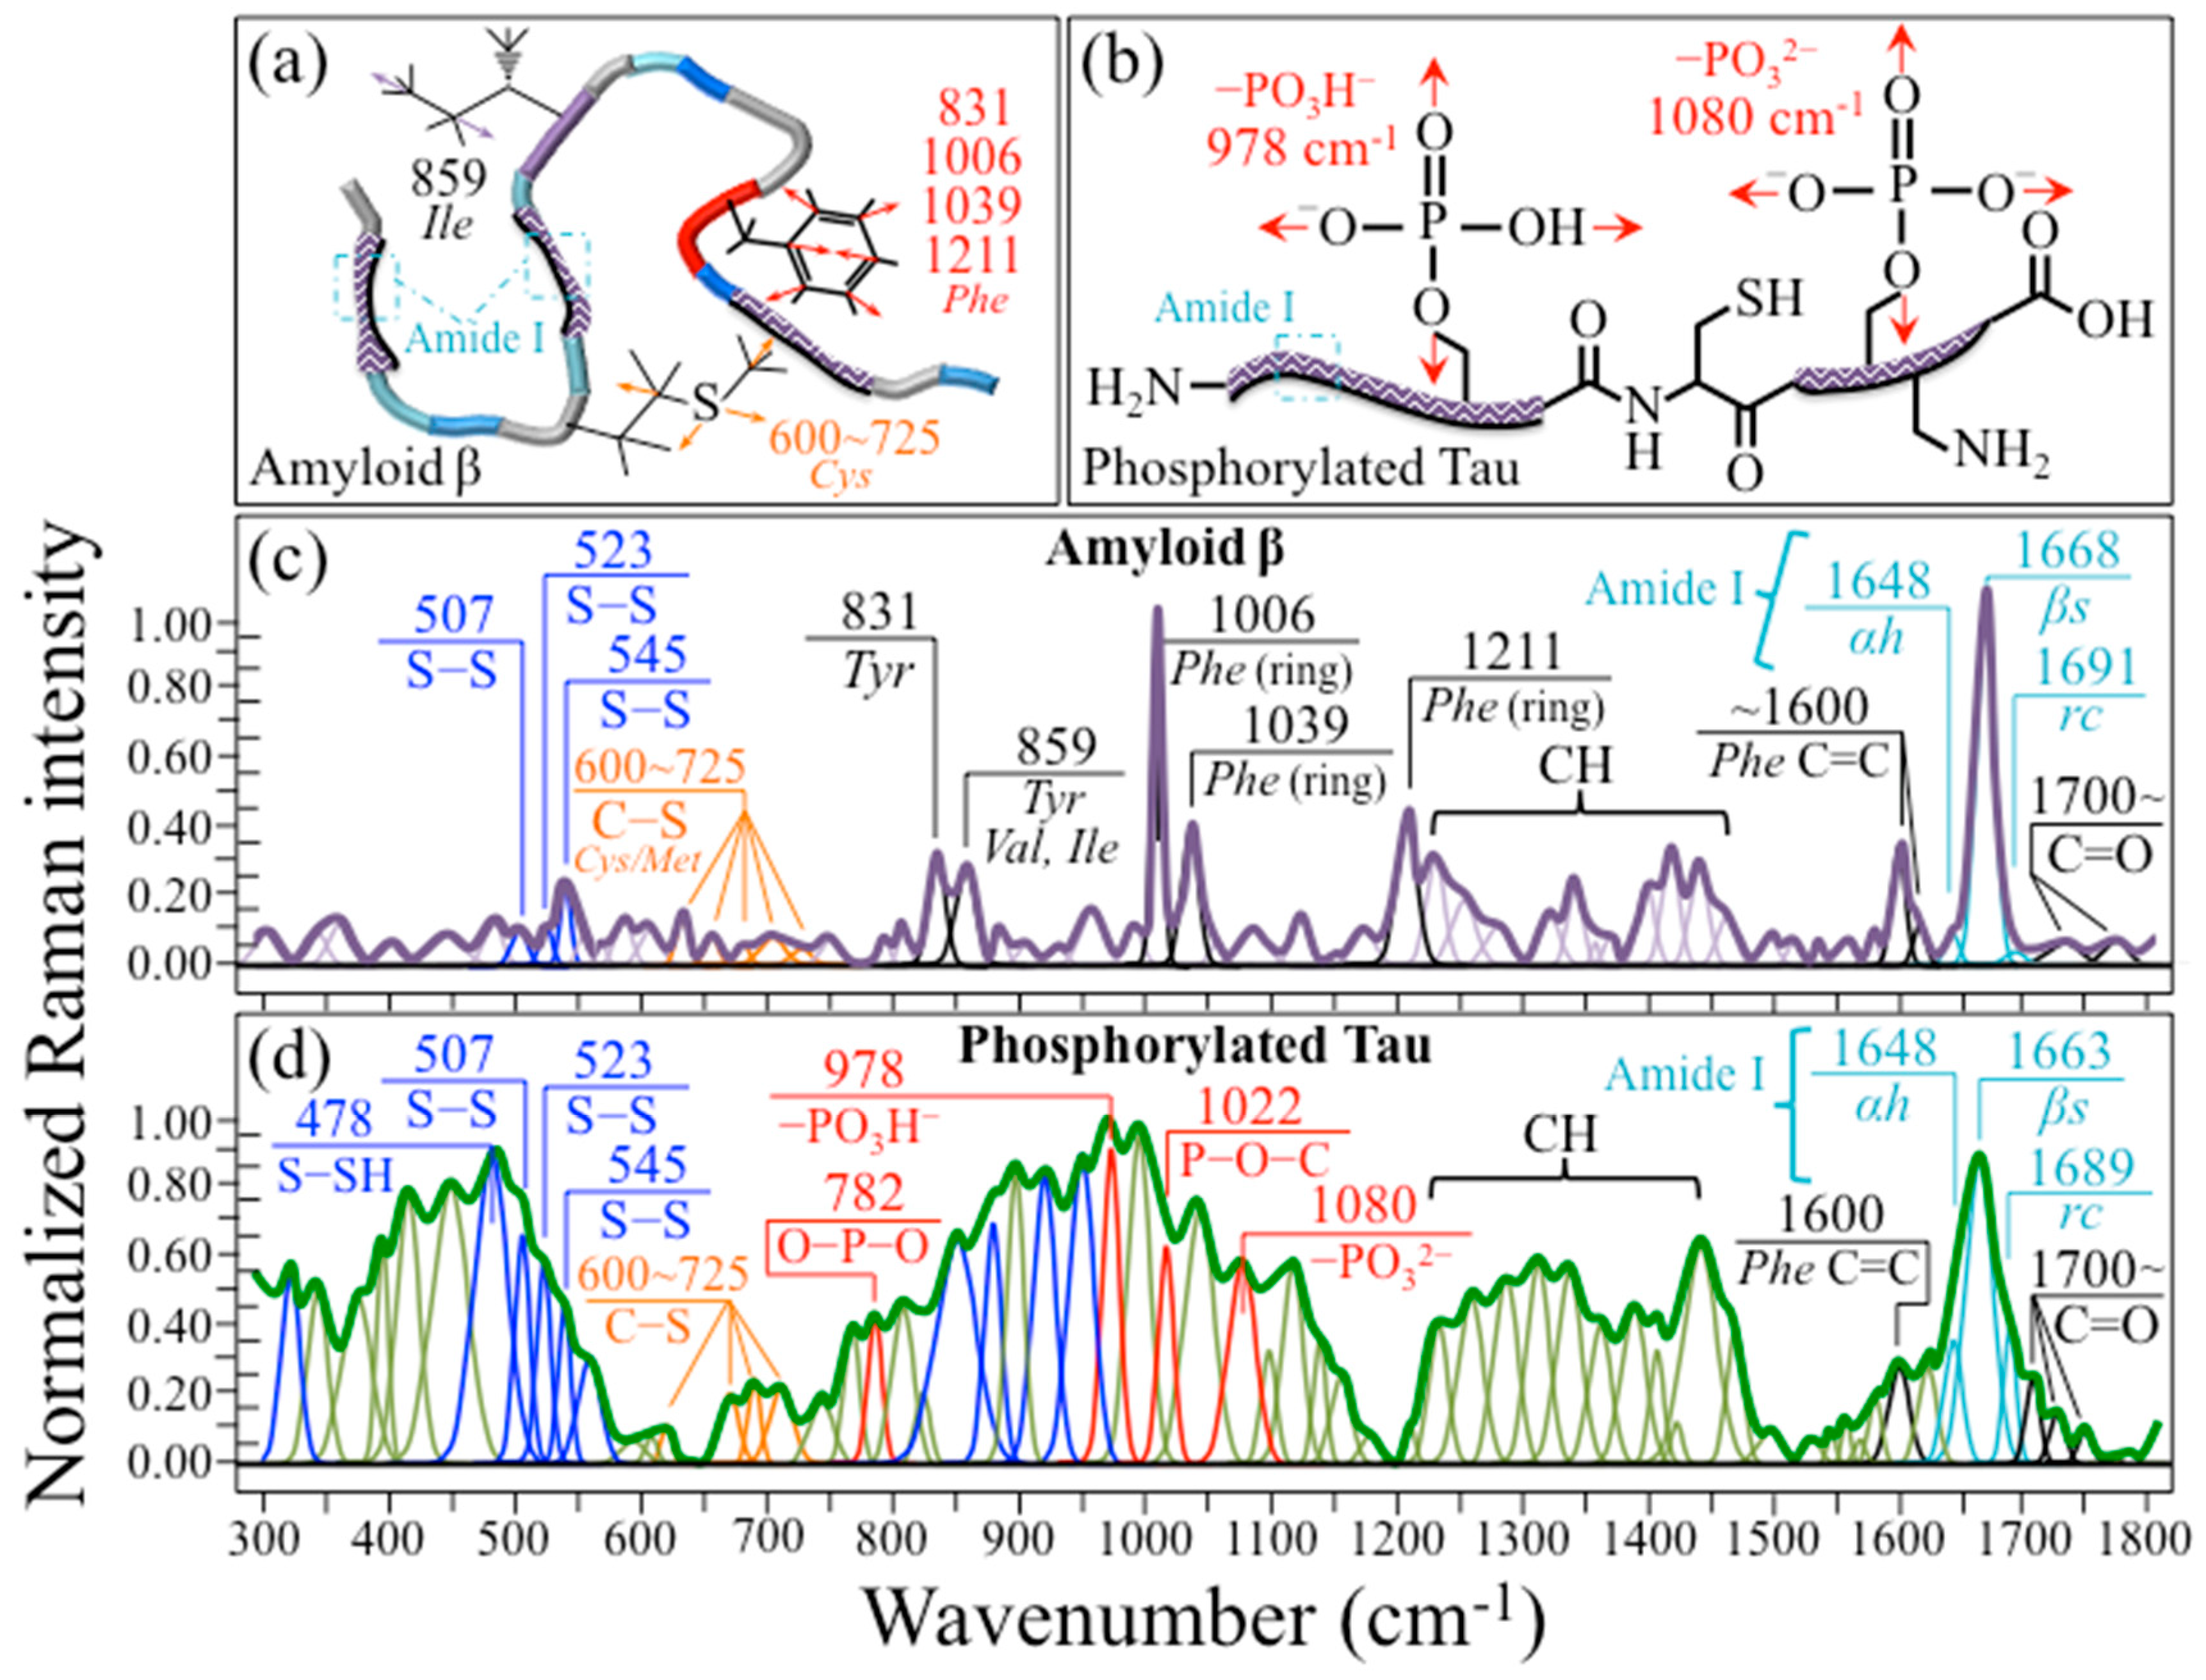
2.3. Raman Spectra of Amyloid β and Phosphorylated Tau Peptides
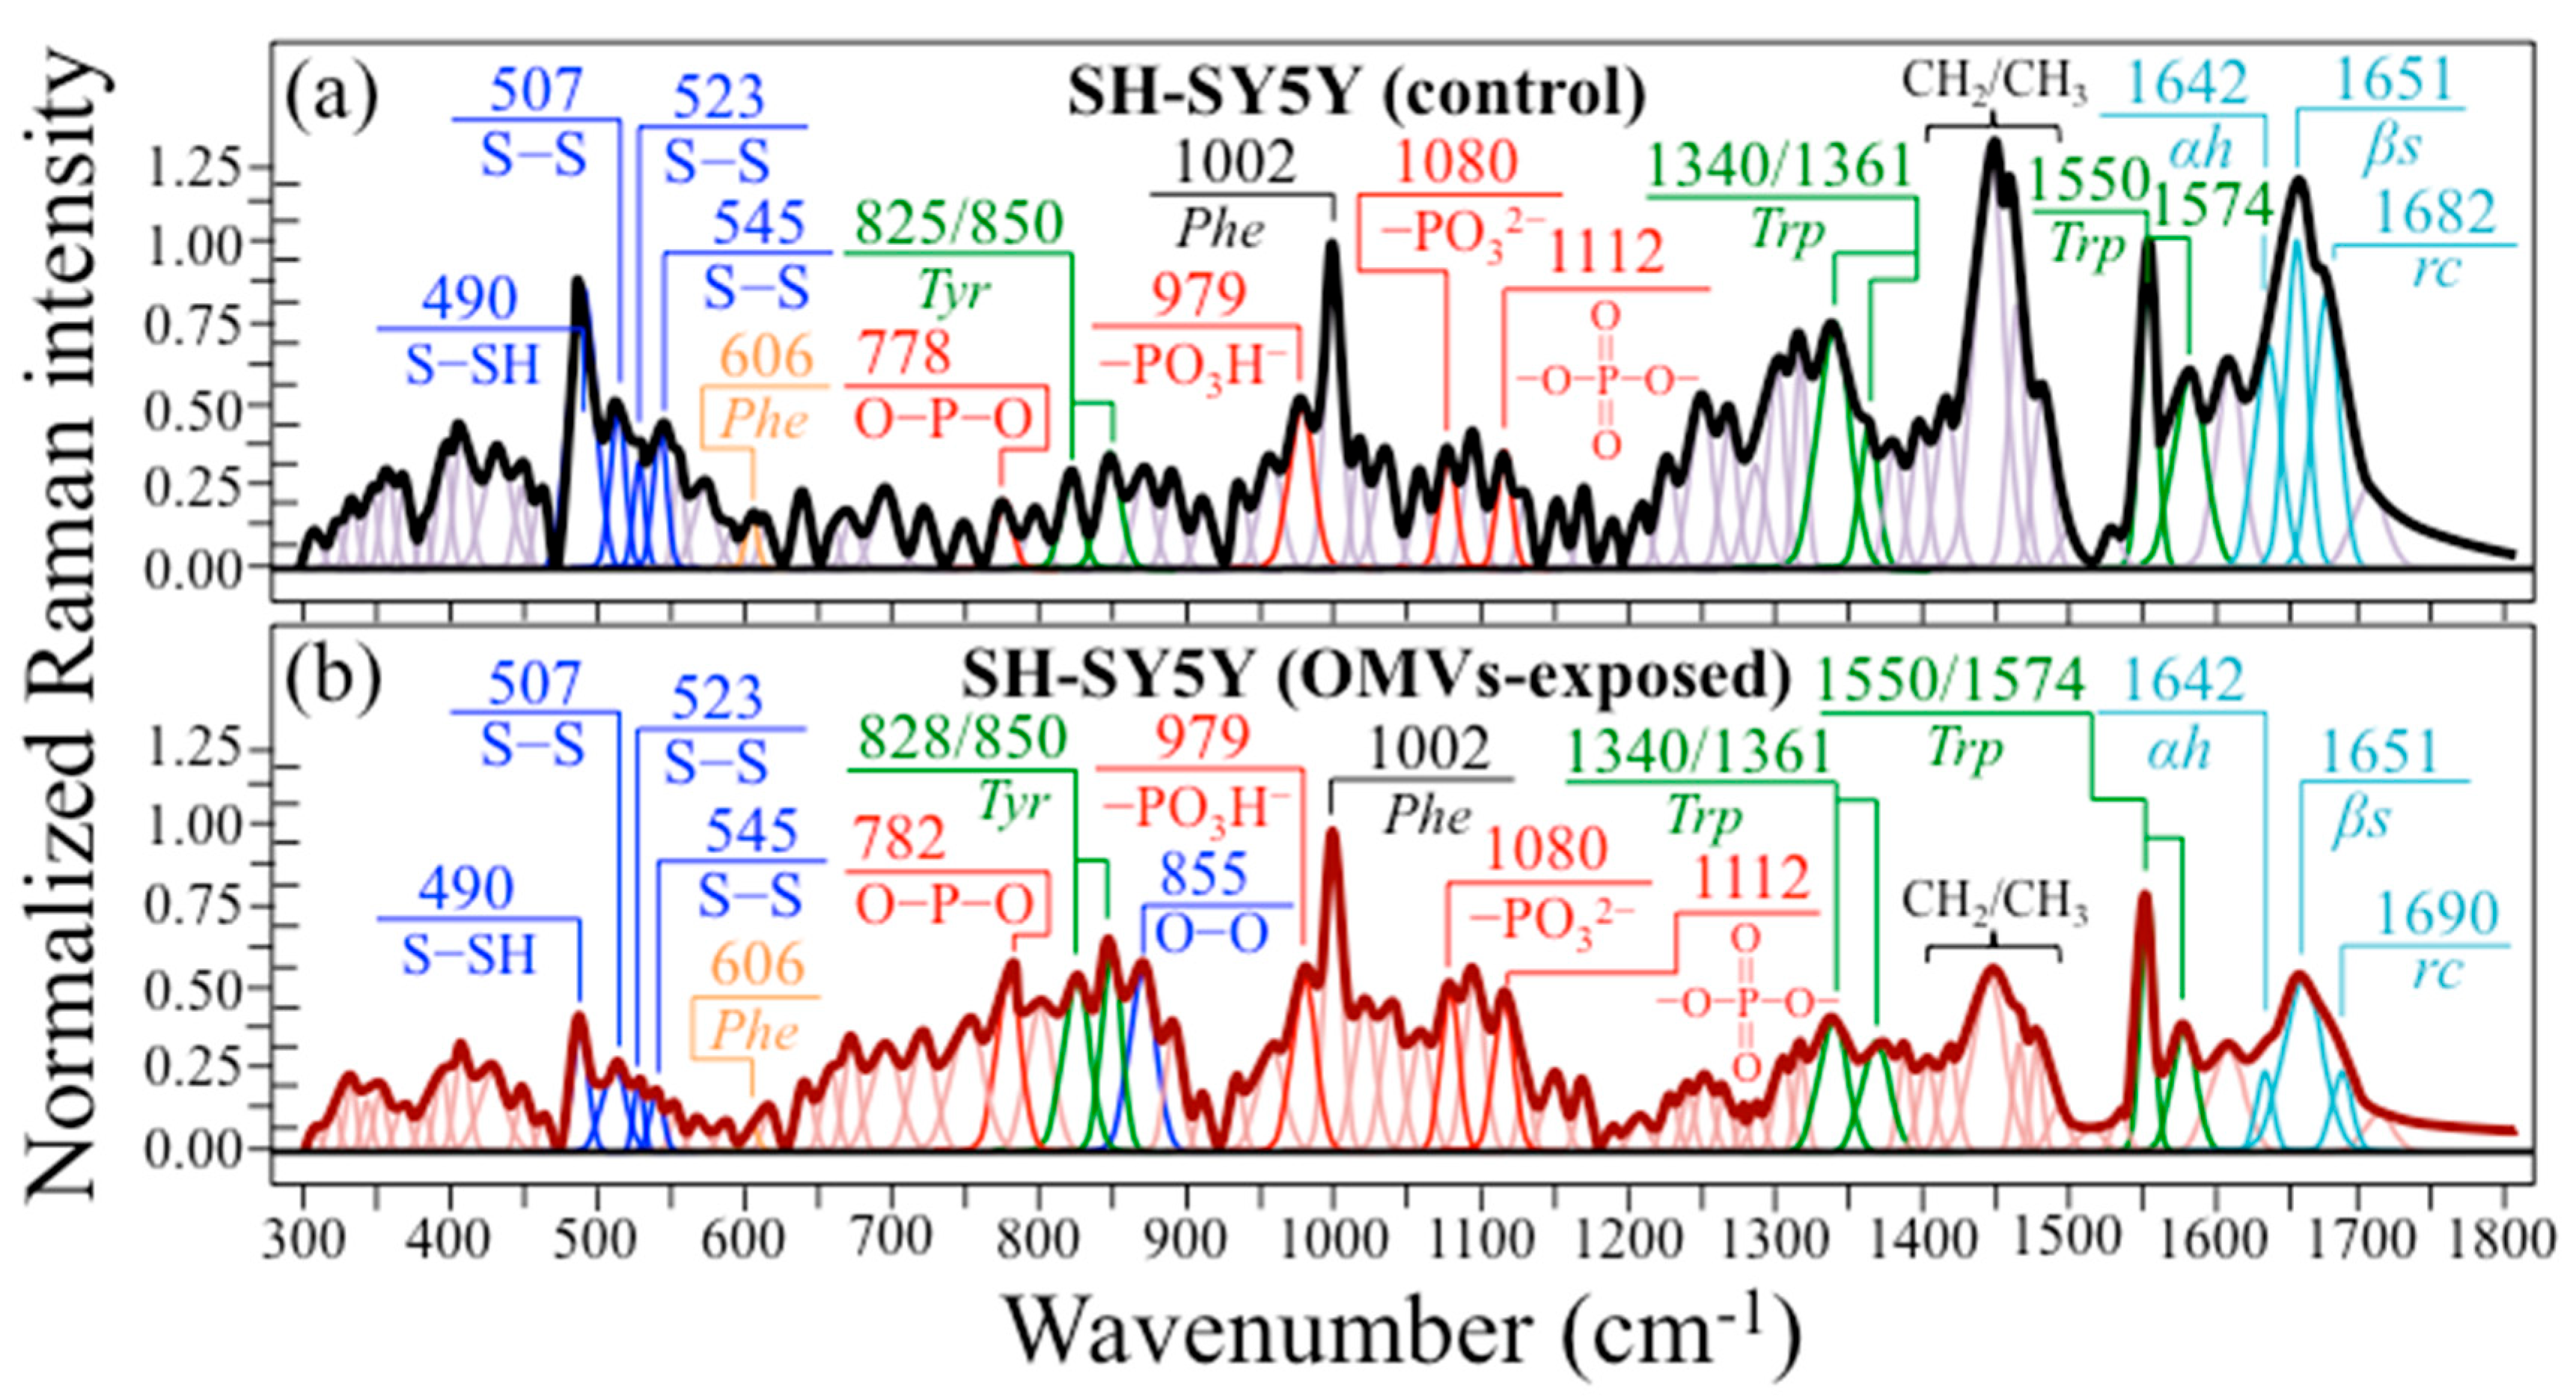
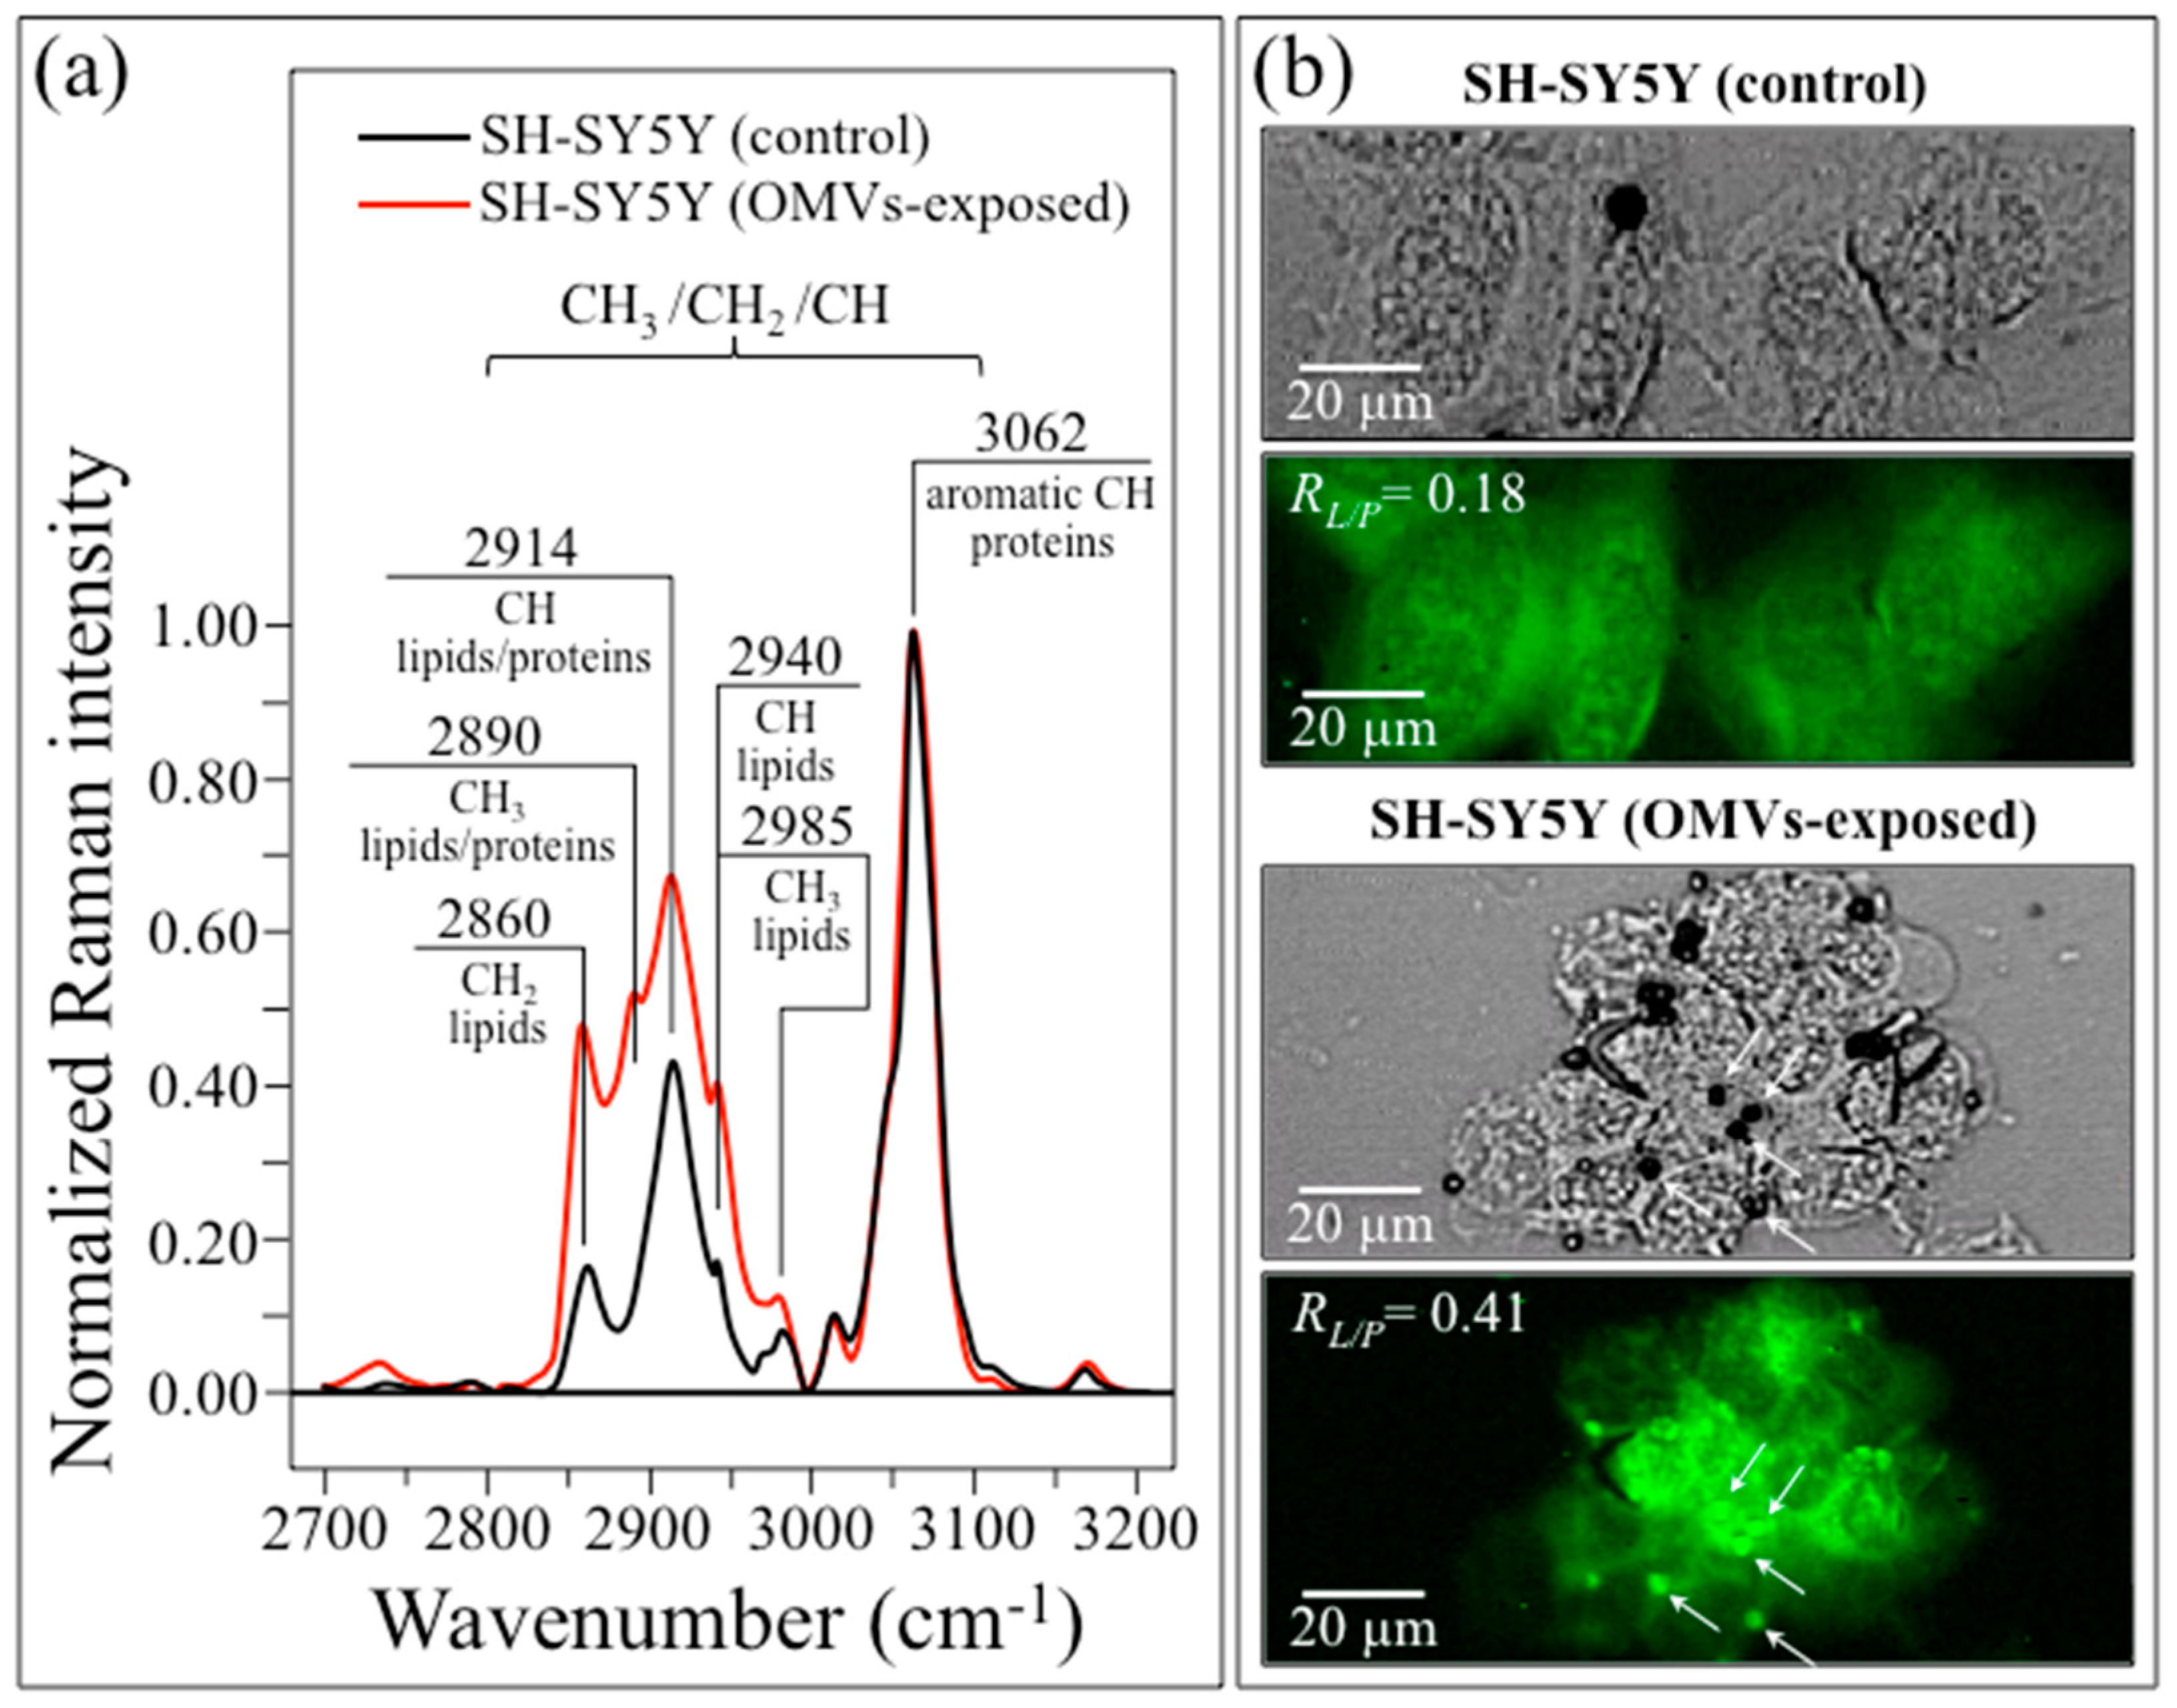
2.4. In Situ Raman Spectra and Imaging of Diseased SH-SY5Y Cells
3. Discussion
3.1. Raman Insights into Pg-OMVs Molecular Structure and Functions
3.2. Spectroscopic Evidence for an Alkaline Shift in Diseased Cell Culture
3.3. Insights into AD Human Neuroblastoma Cells from Molecular Chemistry
4. Materials and Methods
4.1. Isolation and Characterization of Pg-OMVs
4.2. Purification/Activation of Gingipains and Isolation of PDHC
4.3. Amyloid β, Phosphorylated Tau, and Their Characterizations
4.4. Cell Culture and Immunochemistry Assays
4.5. In Situ Raman Spectroscopy and Raman Imaging
4.6. Statistical Analyses
5. Conclusions
Author Contributions
Funding
Institutional Review Board Statement
Informed Consent Statement
Data Availability Statement
Acknowledgments
Conflicts of Interest
References
- Gatz, M.; Mortimer, J.A.; Fratiglioni, L.; Johansson, B.; Berg, S.; Reynolds, C.A.; Pedersen, N.L. Potentially modifiable risk factors for dementia in identical twins. Alzheimer’s Dement. 2006, 2, 110–117. [Google Scholar] [CrossRef] [PubMed]
- Stein, P.S.; Desrosiers, M.; Donegan, S.J.; Yepes, J.F.; Kryscio, R.J. Tooth loss, dementia and neuropathology in the Nun study. J. Am. Dent. Assoc. 2007, 138, 1314–1322. [Google Scholar] [CrossRef]
- Noble, J.M.; Borrell, L.N.; Papapanou, P.N.; Elkind, M.S.V.; Scarmeas, N.; Wright, C.B. Periodontitis is associated with cognitive impairment among older adults: Analysis of NHANES-III. J. Neurol. Neurosurg. Psychiatry 2009, 80, 1206–1211. [Google Scholar] [CrossRef] [PubMed]
- Kaye, E.K.; Valencia, A.; Baba, N.; Spiro, A., III; Dietrich, T.; Garcia, R.I. Tooth loss and periodontal disease predict poor cognitive function in older men. J. Am. Geriatr. Soc. 2010, 58, 713–718. [Google Scholar] [CrossRef] [PubMed]
- Ide, M.; Harris, M.; Stevens, A.; Sussams, R.; Hopkins, V.; Culliford, D.; Fuller, J.; Ibbett, P.; Raybould, R.; Thomas, R.; et al. Periodontitis and cognitive decline in Alzheimer’s disease. PLoS ONE 2016, 11, e0151081. [Google Scholar] [CrossRef] [PubMed]
- Kamer, A.R.; Pirraglia, E.; Tsui, W.; Rusinek, H.; Vallabhajosula, S.; Mosconi, L.; Yi, L.; McHugh, P.; Craig, R.G.; Svetcov, S.; et al. Periodontal disease associates with higher brain amyloid load in normal elderly. Neurobiol. Aging 2015, 36, 627–633. [Google Scholar] [CrossRef] [PubMed]
- Singhrao, S.K.; Harding, A.; Poole, S.; Kesavalu, L.; Crean, S. Porphyromonas gingivalis periodontal infection and its putative links with Alzheimer’s disease. Mediat. Inflamm. 2015, 2015, 137357. [Google Scholar] [CrossRef]
- Guo, Y.; Nguyen, K.-A.; Potempa, J. Dichotomy of gingipains action as virulence factors: From cleaving substrates with the precision of a surgeon’s knife to a meat chopper-like brutal degradation of proteins. Periodontol. 2000 2010, 54, 15–44. [Google Scholar]
- Sheets, S.M.; Potempa, J.; Travis, J.; Casiano, C.A.; Fletcher, H.M. Gingipains from Porphyromonas gingivalis W83 induce cell adhesion molecule cleavage and apoptosis in endothelial cells. Infect. Immun. 2005, 73, 1543–1552. [Google Scholar] [CrossRef]
- Kinane, J.A.; Benakanakere, M.R.; Zhao, J.; Hosur, K.B.; Kinane, D.F. Porphyromonas gingivalis influences actin degradation within epithelial cells during invasion and apoptosis. Cell. Microbiol. 2012, 14, 1085–1096. [Google Scholar] [CrossRef]
- Nelson, P.T.; Alafuzoff, I.; Bigio, E.H.; Bouras, C.; Braak, H.; Cairns, N.J.; Castellani, R.J.; Davies, P.; Del Tredici, K.; Duyckaerts, C.; et al. Correlation of Alzheimer disease neuropathologic changes with cognitive status: A review of the literature. J. Neuropathol. Exp. Neurol. 2012, 71, 362–381. [Google Scholar] [CrossRef] [PubMed]
- Darveau, R.P.; Hajishengallis, G.; Curtis, M.A. Porphyromonas gingivalis as a potential community activist for disease. J. Dent. Res. 2012, 91, 816–820. [Google Scholar] [CrossRef] [PubMed]
- How, K.Y.; Song, K.P.; Chan, K.G. Porphyromonas gingivalis: An overview of periodontopathic pathogen below the gum line. Front. Microbiol. 2016, 7, 53. [Google Scholar] [CrossRef] [PubMed]
- Hajishengallis, G. Immune evasion strategies of Porphyromonas gingivalis. J. Oral Biosci. 2011, 53, 233–240. [Google Scholar] [CrossRef]
- Hajishengallis, G.; Darveau, R.P.; Curtis, M.A. The keystone pathogen hypothesis. Nat. Rev. Microbiol. 2012, 10, 717–725. [Google Scholar] [CrossRef]
- Olsen, I.; Hajishengallis, G. Major neutrophil functions subverted by Porphyromonas gingivalis. J. Oral Microbiol. 2016, 8, 30936. [Google Scholar] [CrossRef]
- Gupta, R.S. Origin of diderm (Gram-negative) bacteria: Antibiotic selection pressure rather than endosymbiosis likely led to the evolution of bacterial cells with two membranes. Antonie Van Leeuwenhoek 2011, 100, 171–182. [Google Scholar] [CrossRef]
- Dominy, S.S.; Linch, C.; Ermini, F.; Benedyk, M.; Marczyk, A.; Konradi, A.; Nguyen, M.; Haditsch, U.; Raha, D.; Griffin, C.; et al. Porphyromonas gingivalis in Alzheimer’s disease brains: Evidence for disease causation and treatment with small-molecule inhibitors. Sci. Adv. 2019, 5, eaau3333. [Google Scholar] [CrossRef]
- Nara, P.L.; Sindelar, D.; Penn, M.S.; Potempa, J.; Griffin, W.S.T. Porphyromonas gingivalis outer membrane vesicles as the major driver of and explanation for neuropathogenesis, the cholinergic hypothesis, iron dyshomeostasis, and salivary lactoferrin in Alzheimer’s disease. J. Alzheimer’s Dis. 2021, 82, 1417–1450. [Google Scholar] [CrossRef]
- Li, Z.; Clarke, A.J.; Beveridge, T.J. Gram-negative bacteria produce membrane vesicles which are capable of killing other bacteria. J. Bacteriol. 1998, 180, 5478–5483. [Google Scholar] [CrossRef]
- Kim, J.H.; Lee, J.; Park, J.; Gho, Y.S. Gram-negative and Gram-positive bacterial extracellular vesicles. Semin. Cell Dev. Biol. 2015, 40, 97–104. [Google Scholar] [CrossRef]
- Schwechheimer, C.; Kuehn, M.J. Outer-membrane vesicles from Gram-negative bacteria: Biogenesis and functions. Nat. Rev. Microbiol. 2015, 13, 605–619. [Google Scholar]
- Gui, M.J.; Dashper, S.G.; Slakeski, N.; Chen, Y.-Y.; Reynolds, E.C. Spheres of influence: Porphyromonas gingivalis outer membrane vesicles. Mol. Oral Microbiol. 2016, 31, 365–378. [Google Scholar] [CrossRef] [PubMed]
- Grenier, D.; Roy, S.; Chandad, F.; Plamondon, P.; Yoshioka, M.; Nakayama, K.; Mayrand, D. Effect of inactivation of the Arg- and/or Lys-gingipain gene on selected virulence and physiological properties of Porphyromonas gingivalis. Infect. Immun. 2003, 71, 4742–4748. [Google Scholar] [CrossRef] [PubMed]
- Stathopoulou, P.G.; Galicia, J.C.; Benakanakere, M.R.; Garcia, C.A.; Potempa, J.; Kinane, D.F. Porphyromonas gingivalis induce apoptosis in human gingival epithelial cells through a gingipain-dependent mechanism. BMC Microbiol. 2009, 9, 107. [Google Scholar] [CrossRef] [PubMed]
- Pezzotti, G. Raman spectroscopy in cell biology and microbiology. J. Raman Spectrosc. 2021, 52, 2348–2443. [Google Scholar]
- Pezzotti, G.; Bock, R.M.; McEntire, B.J.; Jones, E.; Boffelli, M.; Zhu, W.; Baggio, G.; Boschetto, F.; Puppulin, L.; Adachi, T.; et al. Silicon nitride bioceramics induce chemically driven lysis in Porphyromonas gingivalis. Langmuir 2016, 32, 3024–3035. [Google Scholar] [CrossRef] [PubMed]
- Pezzotti, G.; Kobara, M.; Nakaya, T.; Imamura, H.; Asai, T.; Miyamoto, N.; Adachi, T.; Yamamoto, T.; Kanamura, N.; Ohgitani, E.; et al. Raman study of pathogenic Candida auris: Imaging metabolic machineries in reaction to antifungal drugs. Front. Microbiol. 2022, 13, 896359. [Google Scholar] [PubMed]
- Pezzotti, G.; Boschetto, F.; Ohgitani, E.; Fujita, Y.; Shin-Ya, M.; Adachi, T.; Yamamoto, T.; Kanamura, N.; Marin, E.; Zhu, W.; et al. Raman molecular fingerprints of SARS-CoV-2 British variant and the concept of Raman Barcode. Adv. Sci. 2021, 2021, 2103287. [Google Scholar] [CrossRef]
- Pezzotti, G.; Boschetto, F.; Ohgitani, E.; Fujita, Y.; Shin-Ya, M.; Adachi, T.; Yamamoto, T.; Kanamura, N.; Marin, E.; Zhu, W.; et al. Mechanisms of instantaneous inactivation of SARS-CoV-2 by silicon nitride bioceramic. Mater. Today Bio 2021, 12, 100144. [Google Scholar] [PubMed]
- Pezzotti, G.; Zhu, W.; Adachi, T.; Horiguchi, S.; Marin, E.; Boschetto, F.; Ohgitani, E.; Mazda, O. Metabolic machinery encrypted in the Raman spectrum of influenza A virus-inoculated mammalian cells. J. Cell. Physiol. 2020, 235, 5146–5170. [Google Scholar] [CrossRef]
- Pezzotti, G.; McEntire, B.J.; Bock, R.; Zhu, W.; Boschetto, F.; Rondinella, A.; Marin, E.; Marunaka, Y.; Adachi, T.; Yamamoto, T.; et al. In situ spectroscopic screening of osteosarcoma living cells on stoichiometry-modulated silicon nitride bioceramic surfaces. ACS Biomater. Sci. Eng. 2016, 2, 1121–1134. [Google Scholar] [CrossRef]
- Huefner, A.; Kuan, W.-L.; Müller, K.H.; Skepper, J.N.; Barker, R.A.; Mahajan, S. Characterization and visualization of vesicles in the endo-lysosomal pathway with surface-enhanced Raman spectroscopy and chemometrics. ACS Nano 2016, 10, 307–316. [Google Scholar] [CrossRef] [PubMed]
- Krafft, C.; Wilhelm, K.; Eremin, A.; Nestel, S.; von Bubnoff, N.; Schultze-Seemann, W.; Popp, J.; Nazarenko, I. A specific spectral signature of serum and plasma-derived extracellular vesicles for cancer screening. Nanomed. Nanotechnol. Biol. Med. 2016, 13, 835–841. [Google Scholar]
- Tatischeff, I.; Larquet, E.; Falcón-Pérez, J.M.; Turpin, P.Y.; Kruglik, S.G. Fast characterisation of cell-derived extracellular vesicles by nanoparticles tracking analysis, cryo-electron microscopy, and Raman tweezers microspectroscopy. J. Extracell. Vesicles 2012, 1, 19179. [Google Scholar] [CrossRef]
- Potter, M.; Hanson, C.; Anderson, A.J.; Vargis, E.; Britt, D.W. Abiotic stressors impact outer membrane vesicle composition in a beneficial rhizobacterium: Raman spectroscopy characterization. Sci. Rep. 2020, 10, 21289. [Google Scholar]
- Seyama, M.; Yoshida, K.; Yoshida, K.; Fujiwara, N.; Ono, K.; Eguchi, T.; Kawai, H.; Guo, J.; Weng, Y.; Haoze, Y.; et al. Outer membrane vesicles of Porphyromonas gingivalis attenuate insulin sensitivity by delivering gingipains to the liver. Biochim. Biophys. Acta Mol. Basis Dis. 2020, 1866, 165731. [Google Scholar] [CrossRef] [PubMed]
- Kariu, T.; Ikeda, T.; Nakashima, K.; Potempa, J.; Imamura, T. A natural anti-periodontitis agent, epimedokoreanin B, inhibits virulence activities of gingipains from Porphyromonas gingivalis. Biosci. Biotechnol. Biochem. 2019, 83, 1382–1384. [Google Scholar] [CrossRef]
- Nichols, F.C.; Riep, B.; Mun, J.; Morton, M.D.; Kawai, T.; Dewhirst, F.E.; Smith, M.B. Structures and biological activities of novel phosphatidylethanolamine lipids of Porphyromonas gingivalis. J. Lipid Res. 2006, 47, 844–853. [Google Scholar] [CrossRef]
- Nichols, F.C.; Housley, W.J.; O’Conor, C.A.; Manning, T.; Wu, S.; Clark, R.B. Unique lipids from a common human bacterium represent a new class of toll-like Receptor 2 ligands capable of enhancing autoimmunity. Am. J. Pathol. 2009, 175, 2430–2438. [Google Scholar] [CrossRef] [PubMed]
- Nichols, F.C. Novel ceramides recovered from Porphyromonas gingivalis: Relationship to adult periodontitis. J. Lipid Res. 1998, 39, 2360–2372. [Google Scholar] [CrossRef]
- Rohner, E.; Hoff, P.; Matziolis, G.; Perka, C.; Riep, B.; Nichols, F.C.; Kielbassa, A.M.; Detert, J.; Burmester, G.R.; Buttgereit, F.; et al. The impact of Porphyromonas gingivalis lipids on apoptosis of primary human chondrocytes. Connect. Tissue Res. 2012, 53, 327–333. [Google Scholar] [CrossRef]
- Kadowaki, T.; Yamamoto, K. Suppression of virulence of Porphyromonas gingivalis by potent inhibitors specific for gingipains. Curr. Protein Peptide Sci. 2003, 4, 451–458. [Google Scholar] [CrossRef]
- Kadowaki, T.; Baba, A.; Abe, N.; Takii, R.; Hashimoto, M.; Tsukuba, T.; Okazaki, S.; Suda, Y.; Asao, T.; Yamamoto, K. Suppression of pathogenicity of Porphyromonas gingivalis by newly developed gingipain inhibitors. Mol. Pharmacol. 2004, 66, 1599–1606. [Google Scholar] [CrossRef] [PubMed]
- Krafft, C.; Neudert, L.; Simat, T.; Salzer, R. Near Infrared Raman Spectra of Human Brain Lipids. Spectrochim. Acta A Mol. Spectrosc. 2005, 61, 1529–1535. [Google Scholar] [CrossRef] [PubMed]
- Pemberton, J.E.; Chamberlain, J.R. Raman spectroscopy of model membrane monolayers of dipalmitoylphosphatidic acid at the air−water interface using surface enhancement from buoyant thin silver films. Biopolymers 2000, 57, 103–116. [Google Scholar] [PubMed]
- Naumann, D. Infrared and NIR Raman spectroscopy in medical microbiology. Proc. SPIE 1998, 3257, 245–257. [Google Scholar]
- Zivanović, V.; Milewska, A.; Leosson, K.; Kneipp, J. Molecular structure and interactions of lipids in the outer membrane of living cells based on surface-enhanced Raman scattering and liposome models. Anal. Chem. 2021, 93, 10106–10113. [Google Scholar] [CrossRef]
- Zivanović, V.; Seifert, S.; Drescher, D.; Schrade, P.; Werner, S.; Guttmann, P.; Szekeres, G.P.; Bachmann, S.; Schneider, G.; Arenz, C.; et al. Optical nanosensing of lipid accumulation due to enzyme inhibition in live cells. ACS Nano 2019, 13, 9363–9375. [Google Scholar] [CrossRef]
- Wegener, M.; Neubert, R.; Rettig, W.; Wartewig, S. Structure of stratum corneum lipids characterized by FT-Raman spectroscopy and DSC. I. Ceramides. Int. J. Pharm. 1996, 128, 203–213. [Google Scholar] [CrossRef]
- Lin-Vien, D.; Colthup, N.B.; Fateley, W.G.; Grasselli, J.G. The Handbook of Infrared and Raman Characteristic Frequencies of Organic Molecules; Academic Press: San Diego, CA, USA, 1991. [Google Scholar]
- Ried, C.; Wahl, C.; Miethke, T.; Wellnhofer, G.; Landgraf, C.; Schneider-Mergener, J. Hoess, High affinity endotoxin-binding and neutralizing peptides based on the crystal structure of recombinant Limulus anti-lipopolysaccharide factor. J. Biol. Chem. 1996, 271, 28120–28127. [Google Scholar] [CrossRef] [PubMed]
- Rietschel, E.T.; Kirikae, T.; Schade, F.U.; Mamat, U.; Schmidt, G.; Loppnow, H.; Ulmer, A.J.; Zähringer, U.; Seydel, U.; Di Padova, F.; et al. Bacterial endotoxin: Molecular relationships of structure to activity and function. FASEB J. 1994, 8, 217–225. [Google Scholar] [CrossRef] [PubMed]
- Steimle, A.; Autenrieth, I.B.; Frick, J.S. Structure and function: Lipid A modifications in commensals and pathogens. Int. J. Med. Microbiol. 2016, 306, 290–301. [Google Scholar] [CrossRef]
- Jackman, J.E.; Fierke, C.A.; Tumey, L.N.; Pirrung, M.; Uchiyama, T.; Tahir, S.H.; Hindsgaul, O.; Raetz, C.R. Antibacterial agents that target lipid A biosynthesis in gram-negative bacteria. Inhibition of diverse UDP-3-O-(r-3-hydroxymyristoyl)-n-acetylglucosamine deacetylase by substrate analogs containing zinc binding motifs. J. Biol. Chem. 2000, 275, 11002–11009. [Google Scholar] [CrossRef]
- Samuel, G.; Reeves, P. Biosynthesis of O-antigens: Genes and pathways involved in nucleotide sugar precursor synthesis and O-antigen assembly. Carbohydr. Res. 2003, 338, 2503–2519. [Google Scholar] [PubMed]
- Wiercigroch, E.; Szafraniec, E.; Czamara, K.; Pacia, M.Z.; Majzner, K.; Kochan, K.; Kaczor, A.; Baranska, M.; Malek, K. Raman and infrared spectroscopy of carbohydrates: A review. Spectrochim. Acta Part A: Mol. Biomol. Spectrosc. 2017, 185, 317–335. [Google Scholar]
- She, C.Y.; Dinh, N.D.; Tu, A.T. Laser Raman scattering of glucosamine, N-acetylglucosamine, and glucuronic acid. Biochim. Biophys. Acta 1974, 372, 345–357. [Google Scholar] [CrossRef]
- Mayer, B.; Peter, L.; Shaskey-Rosenlund, C. Raman spectra of isotopic bisulfite and disulfite ions in alkali salts and aqueous solution. Spectrochim. Acta 1979, 35A, 345–354. [Google Scholar] [CrossRef]
- Takahashi, H.; Kaneko, N.; Miwa, K. Raman and infrared studies of the structure of the dithionite ion in aqueous solution band force constants of S2Ox2− type ions. Spectrochim. Acta 1982, 38A, 1147–1153. [Google Scholar] [CrossRef]
- Mayer, B.; Ospina, M.; Peter, L.B. Raman spectrometric determination of oxysulfur anions in aqueous systems. Anal. Chim. Acta 1980, 117, 301–311. [Google Scholar] [CrossRef]
- Kumar, S.; Rai, S.B. Spectroscopic study of L-arginine molecule. Indian J. Pure Appl. Phys. 2010, 48, 251–255. [Google Scholar]
- Hernandez, B.; Pflueger, F.; Derbel, N.; De Coninck, J.; Ghomi, M. Vibrational analysis of amino acids and short peptides in hydrated media. VI. Amino acids with positively charged side chains: L-Lysine and L-Arginine. J. Phys. Chem. B 2010, 114, 1077–1088. [Google Scholar] [CrossRef]
- Sharma, A.K.; Pavlova, S.T.; Kim, J.; Finkelstein, D.; Hawco, N.J.; Rath, N.P.; Kim, J.; Mirica, L.M. Bifunctional compounds for controlling metal-mediated aggregation of the Aβ42 peptide. J. Am. Chem. Soc. 2012, 134, 6625–6636. [Google Scholar] [CrossRef]
- Naiki, H.; Higuchi, K.; Hosokawa, M.; Takeda, T. Fluorometric determination of amyloid fibrils in vitro using the fluorescent dye, thioflavine T. Anal. Biochem. 1989, 177, 244–249. [Google Scholar] [CrossRef]
- Levine, H., III. Thioflavine T interaction with synthetic Alzheimer’s disease β−amyloid peptides: Detection of amyloid aggregation in solution. Protein Sci. 1993, 2, 404–410. [Google Scholar] [CrossRef] [PubMed]
- Ono, K.; Hasegawa, K.; Naiki, H.; Yamada, M. Curcumin has potent anti−amyloidogenic effects for Alzheimer’s β−amyloid fibrils in vitro. J. Neurosci. Res. 2004, 75, 742–750. [Google Scholar] [CrossRef]
- Yoshiike, Y.; Akagi, T.; Takashima, A. Surface structure of amyloid-beta fibrils contributes to cytotoxicity. Biochemistry 2007, 46, 9805–9812. [Google Scholar] [CrossRef]
- Hernandez, B.; Pflueger, F.; Kruglik, S.G.; Ghomi, M. Characteristic Raman lines of phenylalanine analyzed by a multiconformal approach. J. Raman Spectrosc. 2013, 44, 827–833. [Google Scholar] [CrossRef]
- Podstawka, E.; Ozaki, Y.; Proniewicz, L.M. Part II: Surface-enhanced Raman spectroscopy investigation of methionine containing heterodipeptides adsorbed on colloidal silver. Appl. Spectrosc. 2004, 58, 581–590. [Google Scholar] [CrossRef] [PubMed]
- Fleming, G.D.; Finnerty, J.J.; Campos-Vallette, M.; Celis, F.; Aliaga, A.E.; Fredes, C.; Koch, R. Experimental and theoretical Raman and surface-enhanced Raman scattering study of cysteine. J. Raman Spectrosc. 2009, 40, 632–638. [Google Scholar] [CrossRef]
- Amyloid β-Protein (Human, 1-42). Available online: https://www.peptide.co.jp/catalog/f-cat?k_code=4349-v (accessed on 22 August 2023).
- Kurouski, D.; Van Duyne, R.P.; Lednev, I.K. Exploring structure and formation mechanism of amyloid fibrils by Raman spectrocopy. A review. Analyst 2015, 140, 4967–4980. [Google Scholar] [CrossRef]
- Kurouski, D.; Washington, J.; Ozbil, M.; Prabhakar, R.; Shekhtman, A.; Lednev, I.K. Disulfide bridges remain intact while native insulin converts into amyloid fibrils. PLoS ONE 2012, 7, e36989. [Google Scholar] [CrossRef] [PubMed]
- Yu, X.; Hayden, E.Y.; Xia, M.; Liang, O.; Cheah, L.; Teplow, D.B.; Xie, Y.-H. Surface enhanced Raman spectroscopy distinguishes amyloid β-protein isoforms and conformational states. Protein Sci. 2018, 27, 1427–1438. [Google Scholar] [CrossRef]
- Rivas-Arancibia, S.; Rodriguez-Martinez, E.; Badillo-Ramirez, I.; Lopez-Gonzales, U.; Saniger, J.M. Structural changes of amyloid beta in hippocampus of rats exposed to ozone: A Raman spectroscopy study. Front. Mol. Neurosci. 2017, 10, 137. [Google Scholar] [CrossRef]
- Baldassarre, M.; Baronio, C.M.; Morozova-Roche, L.A.; Barth, A. Amyloid β-peptides 1-40 and 1-42 form oligomers with mixed β-sheets. Chem. Sci. 2017, 8, 8247–8254. [Google Scholar] [CrossRef]
- Feng, Y.; Kochovski, Z.; Arenz, C.; Lu, Y.; Kneipp, J. Structure and interaction of ceramide-containing liposomes with gold nanoparticles as characterized by SERS and cryo-EM. J. Phys. Chem. C 2022, 126, 13237–13246. [Google Scholar] [CrossRef] [PubMed]
- Xie, Y.; Jiang, Y.; Ben-Amotz, D. Detection of amino acid and peptide phosphate protonation using Raman spectroscopy. Anal. Biochem. 2005, 343, 223–230. [Google Scholar] [CrossRef]
- Chen, W.; Nie, S.; Kuck, J.F.R., Jr.; Yu, N.-T. Near-infrared Fourier transform Raman and conventional Raman studies of calf γ-crystallins in the lyophilized state and in solution. Biophys. J. 1991, 60, 447–455. [Google Scholar] [CrossRef] [PubMed]
- Janz, G.J.; Downey, J.R., Jr.; Roduner, E.; Wasilczyk, G.J.; Coutts, J.W.; Eluard, A. Raman studies of sulfur-containing anions in inorganic polysulfides, sodium polysulfides. Inorg. Chem. 1976, 15, 1759–1763. [Google Scholar] [CrossRef]
- Shiota, M.; Naya, M.; Yamamoto, T.; Hishiki, T.; Tani, T.; Takahashi, H.; Kubo, A.; Koike, D.; Itoh, M.; Ohmura, M.; et al. Gold-nanofeve surface-enhanced Raman spectroscopy visualizes hypotaurine as a robust anti-oxidant consumed in cancer survival. Nat. Commun. 2018, 9, 1561. [Google Scholar] [CrossRef]
- Morikawa, T.; Kajimura, M.; Nakamura, T.; Hishiki, T.; Nakanishi, T.; Yukutake, Y.; Nagahata, Y.; Ishikawa, M.; Hattori, K.; Takenouchi, T.; et al. Hypoxic regulation of the cerebral microcirculation is mediated by a carbon monoxide-sensitive hydrogen sulfide pathway. Proc. Natl Acad. Sci. USA 2012, 109, 1293–1298. [Google Scholar] [CrossRef]
- Avila, J.; Jimenez, J.S.; Sayas, C.L.; Bolos, M.; Zabala, J.C.; Rivas, G.; Hernandez, F. Tau structures. Front. Aging Neurosci. 2016, 8, 262. [Google Scholar] [CrossRef]
- Avila, J. Tau phosphorylation and aggregation in Alzheimer’s disease pathology. FEBS Lett. 2006, 580, 2922–2927. [Google Scholar] [CrossRef]
- Kirschner, D.A.; Abraham, C.; Selkoe, D.J. X-ray diffraction from intraneuronal-paired helical filaments and extraneuronal amyloid fibers in Alzheimer disease indicates cross-beta conformation. Proc. Natl. Acad. Sci. USA 1986, 83, 503–507. [Google Scholar] [CrossRef] [PubMed]
- von Bergen, M.; Friedhoff, P.; Biernat, J.; Heberle, J.; Mandelkow, E.M.; Mandelkow, E. Assembly of tau protein into Alzheimer paired helical filaments depends on a local sequence motif ((306)VQIVYK(311)) forming beta structure. Proc. Natl. Acad. Sci. USA 2000, 97, 5129–5134. [Google Scholar] [CrossRef]
- Sadqi, M.; Hernández, F.; Pan, U.; Pérez, M.; Schaeberle, M.D.; Avila, J.; Muñoz, V. Alpha-helix structure in Alzheimer’s disease aggregates of tau-protein. Biochemistry 2002, 41, 7150–7155. [Google Scholar] [CrossRef] [PubMed]
- Goux, W.J. The conformations of filamentous and soluble tau associated with Alzheimer paired helical filaments. Biochemistry 2002, 41, 13798–13806. [Google Scholar] [CrossRef]
- Eliezer, D.; Barré, P.; Kobaslija, M.; Chan, D.; Li, X.; Heend, L. Residual structure in the repeat domain of tau: Echoes of microtubule binding and paired helical filament formation. Biochemistry 2005, 44, 1026–1036. [Google Scholar] [CrossRef]
- Kunjithapatham, R.; Oliva, F.Y.; Doshi, U.; Pérez, M.; Avila, J.; Muñoz, V. Role for the alpha-helix in aberrant protein aggregation. Biochemistry 2005, 44, 149–156. [Google Scholar] [CrossRef] [PubMed]
- Bancher, C.; Brunner, C.; Lassmann, H.; Budka, H.; Jellinger, K.; Wiche, G.; Seitelberger, F.; Grundke-Iqbal, I.; Iqbal, K.; Wisniewski, H.M. Accumulation of abnormally phosphorylated tau precedes the formation of neurofibrillary tangles in Alzheimer’s disease. Brain Res. 1989, 477, 90–99. [Google Scholar] [CrossRef]
- Wang, Y.; Mandelkow, E. Tau in physiology and pathology. Nat. Rev. Neurosci. 2016, 17, 22–35. [Google Scholar] [CrossRef]
- Multhaup, G.; Huber, O.; Buée, L.; Galas, M.C. Amyloid Precursor Protein (APP) metabolites APP intracellular fragment (AICD), Aβ42, and tau in nuclear roles. J. Biol. Chem. 2015, 290, 23515–23522. [Google Scholar] [CrossRef]
- Sibille, N.; Huvent, I.; Fauquant, C.; Verdegem, D.; Amniai, L.; Leroy, A.; Wieruszeski, J.-M.; Lippens, G.; Landrieu, I. Structural characterization by nuclear magnetic resonance of the impact of phosphorylation in the proline-rich region of the disordered Tau protein. Proteins 2012, 80, 454–462. [Google Scholar] [CrossRef] [PubMed]
- Siamwiza, M.N.; Lord, R.C.; Chen, M.C.; Takamatsu, T.; Harada, I.; Matsuura, H.; Shimanouchi, T. Interpretation of the doublet at 850 and 830 cm−1 in the Raman spectra of tyrosyl residues in proteins and certain model compounds. Biochemistry 1975, 14, 4870–4876. [Google Scholar] [CrossRef]
- Harada, I.; Miura, T.; Takeuchi, H. Origin of the doublet at 1360 and 1340 cm−1 in the Raman spectra of tryptophan and related compounds. Spectrochim. Acta 1986, 42, 307–312. [Google Scholar] [CrossRef]
- Takeuchi, H. Raman structural markers of tryptophan and histidine side chains in proteins. Biopolym. Orig. Res. Biomol. 2003, 72, 305–317. [Google Scholar] [CrossRef]
- Zhu, G.; Zhu, X.; Fan, Q.; Wan, X. Raman spectra of amino acids and their aqueous solutions. Spectrochim. Acta Part A Mol. Biomol. Spectrosc. 2011, 78, 1187–1195. [Google Scholar] [CrossRef] [PubMed]
- Takeuchi, H.; Harada, I. Normal coordinate analysis of the indole ring. Spectrochim. Acta 1986, 42A, 1069–1078. [Google Scholar] [CrossRef]
- Imanbekowa, M.; Suarasan, S.; Rojalin, T.; Mizenko, R.R.; Hilt, S.; Mathur, M.; Lepine, P.; Nicouleau, M.; Mohamed, N.-V.; Durcan, T.M.; et al. Identification of amyloid beta in small extracellular vesicles via Raman spectroscopy. Nanoscale Adv. 2021, 3, 4119. [Google Scholar] [CrossRef]
- Albuquerque-Souza, E.; Sahingur, S.E. Periodontitis, chronic liver diseases, and the emerging oral-gut-liver axis. Periodontology 2000, 89, 125–141. [Google Scholar] [CrossRef]
- Martinez-Martinez, R.E.; Abud-Mendoza, C.; Patiño-Marin, N. Detection of periodontal bacterial DNA in serum and synovial fluid in refractory rheumatoid arthritis patients. J. Clin. Periodontol. 2009, 36, 1004–1010. [Google Scholar] [CrossRef]
- Gong, T.; Chen, Q.; Mao, H.; Zhang, Y.; Ren, H.; Xu, M.; Chen, H.; Yang, D. Outer membrane vesicles of Porphyromonas gingivalis trigger NLRP3 inflammasome and induce neuroinflammation, tau phosphorylation, and memory dysfunction in mice. Front. Cell. Infect. Microbiol. 2022, 12, 925435. [Google Scholar] [CrossRef] [PubMed]
- Okamura, H.; Hirota, K.; Yoshida, K.; Weng, Y.; He, Y.; Shiotsu, N.; Ikegame, M.; Uchida-Fukuhara, Y.; Tanai, A.; Guo, J. Outer membrane vesicles of Porphyromonas gingivalis: Novel communication tool and strategy. Jpn. Dent. Sci. Rev. 2021, 57, 138–146. [Google Scholar] [PubMed]
- Mantri, C.K.; Chen, C.H.; Dong, X.; Goodwin, J.S.; Pratap, S.; Paromov, V. Fimbriae-mediated outer membrane vesicle production and invasion of Porphyromonas gingivalis. Microbiologyopen 2015, 4, 53–65. [Google Scholar] [CrossRef]
- Ho, M.H.; Chen, C.H.; Goodwin, J.S.; Wang, B.Y.; Xie, H. Functional advantages of Porphyromonas gingivalis vesicles. PLoS ONE 2015, 10, e0123448. [Google Scholar] [CrossRef] [PubMed]
- Nakao, R.; Hasegawa, H.; Ochiai, K.; Takashiba, S.; Ainai, A.; Ohnishi, M. Outer membrane vesicles of Porphyromonas gingivalis elicit a mucosal immune response. PLoS ONE 2011, 6, e26163. [Google Scholar] [CrossRef]
- Amano, A.; Kuboniwa, M.; Takeuchi, H. Transcellular invasive mechanisms of Porphyromonas gingivalis in host-parasite interactions. J. Oral Biosci. 2014, 56, 58–62. [Google Scholar] [CrossRef]
- Nichols, F.C.; Riep, B.; Mun, J.; Morton, M.D.; Bojarski, M.T.; Dewhirst, F.E.; Smith, M.B. Structures and biological activity of phosphorylated dihydroceramides of Porphyromonas gingivalis. J. Lipid Res. 2004, 45, 2317–2330. [Google Scholar] [CrossRef]
- Hasegawa, Y.; Nagano, K. Porphyromonas gingivalis FimA and Mfa1 fimbriae: Current insights on localization, function, biogenesis, and genotype. Jpn. Dent. Sci. Rev. 2021, 57, 190–200. [Google Scholar]
- Minamino, M.; Sakaguchi, I.; Naka, T.; Ikeda, N.; Kato, Y.; Tomiyasu, I.; Yano, I.; Kobayashi, K. Bacterial ceramides and sphingophospholipids induce apoptosis of human leukaemic cells. Microbiol. 2003, 149, 2071–2081. [Google Scholar] [CrossRef] [PubMed]
- Nichols, F.C.; Rojanasomsith, K. Porphyromonas gingivalis lipids and diseased dental tissues. Oral Microbiol. Immunol. 2006, 21, 84–92. [Google Scholar] [CrossRef] [PubMed]
- Kanzaki, H.; Movila, A.; Kayal, R.; Napimoga, M.H.; Egashira, K.; Dewhirst, F.; Sasaki, H.; Howait, M.; Al-dharrab, A.; Mira, A.; et al. Phosphoglycerol dihydroceramide, a distinctive ceramide produced by Porphyromonas gingivalis, promotes RANKL-induced osteoclastogenesis by acting on non-muscle myosin II-A (Myh9), an osteoclast cell fusion regulatory factor. Biochim. Biophys. Acta 2017, 1862, 452–462. [Google Scholar] [CrossRef] [PubMed]
- Yamada, C.; Akkaoui, J.; Ho, A.; Duarte, C.; Deth, R.; Kawai, T.; Nichols, F.; Lakshmana, M.K.; Movila, A. Potential role of phosphoglycerol dihydroceramide produced by periodontal pathogen Porphyromonas gingivalis in the pathogenesis of Alzheimer’s disease. Front. Immunol. 2020, 11, 591571. [Google Scholar] [CrossRef]
- Lamont, R.J.; Jenkinson, H.F. Life below the gum line: Pathogenic mechanisms of Porphyromonas gingivalis. Microbiol. Mol. Biol. Rev. 1998, 62, 1244–1263. [Google Scholar] [CrossRef]
- Bostanci, N.; Belibasakis, G.N. Porphyromonas gingivalis: An invasive and evasive opportunistic oral pathogen. FEMS Microbiol. Lett. 2012, 333, 1–9. [Google Scholar] [CrossRef]
- Li, N.; Yun, P.; Nadkarni, M.A.; Ghadikolaee, N.B.; Nguyen, K.-A.; Lee, M.; Hunter, N.; Collyer, C. Structure determination and analysis of a hemolytic gingipain adhesin domain from Porphyromonas gingivalis. Mol. Microbiol. 2010, 76, 861–873. [Google Scholar] [CrossRef] [PubMed]
- Nichols, F.C.; Yao, X.; Bajrami, B.; Downes, J.; Finegold, S.M.; Knee, E.; Gallagher, J.J.; Housley, W.J.; Clark, R.B. Phosphorylated dihydroceramides from common human bacteria are recovered in human tissues. PLoS ONE 2011, 6, e16771. [Google Scholar] [CrossRef]
- Shi, R.; Dong, Z.; Ma, C.; Wu, R.; Lv, R.; Liu, S.; Ren, Y.; Liu, Z.; van der Mei, H.C.; Busscher, H.J.; et al. High-yield, magnetic harvesting of extracellular outer-Membrane vesicles from Escherichia coli. Small 2022, 18, 2204350. [Google Scholar] [CrossRef] [PubMed]
- Mandal, P.K.; Akolkar, H.; Tripathi, M. Mapping of hippocampal pH and neurochemicals from in vivo multi-voxel 31P study in healthy normal young male/female, mild cognitive impairment, and Alzheimer’s disease. J. Alzheimer’s Dis. 2012, 29, 1–12. [Google Scholar] [CrossRef]
- Ayala, A.; Munoz, M.F.; Arguelles, S. Lipid peroxidation: Production, metabolism, and signaling mechanisms of malondialdehyde and 4-hydroxy-2-nonenal. Oxid. Med. Cell Longev. 2014, 2014, 360438. [Google Scholar] [CrossRef]
- Jinsmaa, Y.; Florang, V.R.; Rees, J.N.; Anderson, D.G.; Strack, S.; Doorn, J.A. Products of oxidative stress inhibit aldehyde oxidation and reduction pathways in dopamine catabolism yielding elevated levels of a reactive intermediate. Chem. Res. Toxicol. 2009, 22, 835–841. [Google Scholar] [CrossRef]
- Schaur, R.J.; Siems, W.; Bresgen, N.; Eckl, P.M. Eckl, 4-Hydroxy-nonenal-A bioactive lipid peroxidation product. Biomolecules 2015, 5, 2247–2337. [Google Scholar] [CrossRef] [PubMed]
- Breitzig, M.; Bhimineni, C.; Lockey, R.; Kolliputi, N. 4-Hydroxyl-2-nonenal: A critical target in oxidative stress? Am. J. Physiol. Cell Physiol. 2016, 311, C537–C543. [Google Scholar] [CrossRef]
- Dalleau, S.; Baradat, M.; Gueraud, F.; Huc, L. Cell death and diseases related to oxidative stress: 4-hydroxynonenal (HNE) in the balance. Cell Death Differ. 2013, 20, 1615–1630. [Google Scholar] [CrossRef] [PubMed]
- Eliuk, S.M.; Renfrow, M.B.; Shonsey, E.M.; Barnes, S.; Kim, H. Active site modifications of the brain isoform of creatine kinase by 4-hydroxy-2-nonenal correlate with reduced enzyme activity: Mapping of modified sites by Fourier transform-ion cyclotron resonance mass spectrometry. Chem. Res. Toxicol. 2007, 20, 1260–1268. [Google Scholar] [CrossRef]
- David, S.; Shoemaker, M.; Haley, B.E. Abnormal properties of creatine kinase in Alzheimer’s disease brain: Correlation of reduced enzyme activity and active site photo- labeling with aberrant cytosol-membrane partitioning. Brain Res. Mol. Brain Res. 1998, 54, 276–287. [Google Scholar] [CrossRef]
- Rimai, L.; Cole, T.; Parsons, J.L.; Hickmott, J.T., Jr.; Carew, E.B. Studies of Raman spectra of water solutions of adenosine tri-, di, and monophosphate and some related compound. Biophys. J. 1969, 9, 320–329. [Google Scholar] [CrossRef]
- Shaver, J.M.; Christensen, K.A.; Pezzuti, J.A.; Morris, M.D. Structure of dihydrogen phosphate ion aggregates by Raman-monitored serial dilution. Appl. Spectrosc. 1998, 52, 259–264. [Google Scholar] [CrossRef]
- White, J.C.; Williams, R.W.; Johnston, M.I. Raman spectroscopy of interferon-induced 2′,5′-linked oligoadenylates. Biochemistry 1987, 26, 7737–7744. [Google Scholar] [CrossRef]
- Benevides, J.M.; Kang, C.; Thomas, G.J. Raman signature of the four-stranded intercalated cytosine motif in crystal and solution structures of DNA deoxycytidylates d(CCCT) and d(C-8). Biochemistry 1996, 35, 5747–5755. [Google Scholar] [CrossRef]
- Cohen, P. The origin of protein phosphorylation. Nat. Cell Biol. 2002, 4, E127–E130. [Google Scholar] [CrossRef]
- Ittner, L.M.; Götz, J. Amyloid-β and tau—A toxic pas de deux in Alzheimer’s disease. Nat. Rev. Neurosci. 2011, 12, 65–72. [Google Scholar] [CrossRef]
- Ittner, L.M.; Ke, Y.D.; Delerue, F.; Bi, M.; Gladbach, A.; van Eersel, J.; Wölfing, H.; Chieng, B.C.; Christie, M.J.; Napier, I.A.; et al. Dendridic function of Tau mediates Amyloid-β toxicity in Alzheimer’s disease mouse models. Cell 2010, 142, 387–397. [Google Scholar] [CrossRef]
- Eker, F.; Cao, X.; Nafie, L.; Huang, Q.; Schweitzer-Stenner, R. The structure of alanine based tripeptides in water and dimethyl sulfoxide probed by vibrational spectroscopy. J. Phys. Chem. B 2003, 107, 358–365. [Google Scholar] [CrossRef]
- Shea, D.; Hsu, C.-C.; Bi, T.M.; Paranjapye, N.; Childers, M.C.; Cochran, J.; Tomberlin, C.P.; Wang, L.; Paris, D.; Zonderman, J.; et al. α-sheet secondary structure in amyloid β-peptide drives aggregation and toxicity in Alzheimer’s disease. Proc. Natl. Acad. Sci. USA 2019, 116, 8895–8900. [Google Scholar] [CrossRef] [PubMed]
- Guo, T.; Noble, W.; Hanger, D.P. Roles of tau protein in health and disease. Acta Neuropathol. 2017, 133, 665–704. [Google Scholar] [CrossRef] [PubMed]
- Schweers, O.; Schönbrunn-Hanebeck, E.; Marx, A.; Mandelkow, E. Structural studies of tau protein and Alzheimer paired helical filaments show no evidence for beta-structure. J. Biol. Chem. 1994, 269, 24290–24297. [Google Scholar] [CrossRef]
- Serpell, L.C. Alzheimer’s amyloid fibrils: Structure and assembly. Biochim. Biophys. Acta 2000, 1502, 16–30. [Google Scholar] [CrossRef] [PubMed]
- Chiti, F.; Webster, P.; Taddei, N.; Clark, A.; Stefani, M.; Ramponi, G.; Dobson, C.M. Designing conditions for in vitro formation of amyloid protofilaments and fibrils. Proc. Natl. Acad. Sci. USA 1999, 96, 3590–3594. [Google Scholar] [CrossRef]
- Chiti, F.; Stefani, M.; Taddei, N.; Ramponi, G.; Dobson, C.M. Rationalization of the effects of mutations on peptide and protein aggregation rates. Nature 2003, 424, 805–808. [Google Scholar] [CrossRef] [PubMed]
- Pospich, S.; Raunser, S. The molecular basis of Alzheimer’s plaques. Science 2017, 358, 45–46. [Google Scholar] [CrossRef] [PubMed]
- Rhein, V.; Song, X.; Wiesner, A.; Ittner, L.M.; Baysang, G.; Meier, F.; Ozmen, L.; Bluethmann, H.; Drose, S.; Brandt, U.; et al. Amyloid-beta and tau synergistically impair the oxidative phosphorylation system in triple transgenic Alzheimer’s disease mice. Proc. Natl. Acad. Sci. USA 2009, 106, 20057–20062. [Google Scholar] [CrossRef]
- Moreira, P.I.; Zhu, X.; Liu, Q.; Honda, K.; Siedlak, S.L.; Harris, P.L.; Smith, M.A.; Perry, G. Compensatory responses induced by oxidative stress in Alzheimer disease. Biol. Res. 2006, 39, 7–13. [Google Scholar] [CrossRef] [PubMed]
- Wallace, D.C. Mitochondrial diseases in man and mouse. Science 1999, 283, 1482–1488. [Google Scholar] [CrossRef]
- Kalaria, R.N.; Gravina, S.A.; Schmidley, J.W.; Perry, G.; Harik, S.I. The glucose transporter of the human brain and blood-brain barrier. Ann. Neurol. 1988, 24, 757–764. [Google Scholar] [CrossRef] [PubMed]
- Castellani, R.; Hirai, K.; Aliev, G.; Drew, K.L.; Nunomura, A.; Takeda, A.; Cash, A.D.; Obrenovich, M.E.; Perry, G.; Smith, M.A. Role of mitochondrial dysfunction in Alzheimer’s disease. J. Neurosci. Res. 2002, 70, 357–360. [Google Scholar] [CrossRef]
- Saito, T.; Chiku, T.; Oka, M.; Wada-Kakuda, S.; Nobuhara, M.; Oba, T.; Shinno, K.; Abe, S.; Asada, A.; Sumioka, A.; et al. Disulfide bond formation in microtubule-associated tau protein promotes tau accumulation and toxicity in vivo. Hum. Mol. Genet. 2021, 30, 1955–1967. [Google Scholar] [CrossRef]
- Paulsen, C.E.; Carroll, K.S. Cysteine-mediated redox signaling: Chemistry, biology, and tools for discovery. Chem Rev. 2013, 113, 4633–4679. [Google Scholar]
- Sitia, R.; Molteni, S.N. Stress, protein (mis)folding, and signaling: The redox connection. Sci. STKE 2004, 2004, pe27. [Google Scholar] [CrossRef] [PubMed]
- Cumming, R.C.; Andon, N.L.; Haynes, P.A.; Park, M.; Fischer, W.H.; Schubert, D. Protein disulfide bond formation in the cytoplasm during oxidative stress. J. Biol. Chem. 2004, 279, 21749–21758. [Google Scholar] [CrossRef]
- Brodie, A.E.; Reed, D.J. Cellular recovery of glyceraldehyde-3-phosphate dehydrogenase activity and thiol status after exposure to hydroperoxides. Arch. Biochem. Biophys. 1990, 276, 212–218. [Google Scholar]
- Sabri, M.I.; Ochs, S. Inhibition of glyceraldehyde-3-phosphate dehydrogenase in mammalian nerve by iodoacetic acid. J. Neurochem. 1971, 18, 1509–1514. [Google Scholar] [CrossRef]
- Sirover, M.A. New insights into an old protein: The functional diversity of mammalian glyceraldehyde-3-phosphate dehydrogenase. Biochim. Biophys. Acta 1999, 1432, 159–184. [Google Scholar] [PubMed]
- Chuang, D.M.; Hough, C.; Senatorov, V.V. Glyceraldehyde-3-phosphate dehydrogenase, apoptosis, and neurodegenerative diseases. Annu. Rev. Pharmacol. Toxicol. 2005, 45, 269–290. [Google Scholar]
- Mazzola, J.L.; Sirover, M.A. Subcellular alteration of glyceraldehyde-3-phosphate dehydrogenase in Alzheimer’s disease fibroblasts. J. Neurosci. Res. 2003, 71, 279–285. [Google Scholar] [PubMed]
- Giasson, B.I.; Ischiropoulos, H.; Lee, V.M.Y.; Trojanowski, J.Q. The relationship between oxidative/nitrative stress and pathological inclusions in Alzheimer’s and Parkinson’s diseases. Free Radic. Biol. Med. 2002, 32, 1264–1275. [Google Scholar]
- Schulze, H.; Schuler, A.; Stuber, D.; Dobeli, H.; Langen, H.; Huber, G. Rat brain glyceraldehyde-3-phosphate dehydrogenase interacts with the recombinant cytoplasmic domain of Alzheimer’s beta-amyloid precursor protein. J. Neurochem. 1993, 60, 1915–1922. [Google Scholar]
- Cumming, R.C.; Schubert, D. Amyloid-β induces disulfide bonding and aggregation of GAPDH in Alzheimer’s disease. FASEB J. 2005, 19, 2060–2062. [Google Scholar] [PubMed]
- Rajendran, M.; Claywell, B.; Haynes, E.P.; Scales, U.; Henning, C.K.; Tantama, M. Imaging pH dynamics simultaneously in two cellular compartments using ratiometric pH-sensitive mutant of mCherry. ACS Omega 2018, 3, 9476–9486. [Google Scholar]
- Lv, J.; Chen, L.; Zhu, N.; Sun, Y.; Pan, J.; Gao, J.; Liu, J.; Liu, G.; Tao, Y. Beta amyloid-induced time-dependent learning and memory impairment: Involvement of HPA axis dysfunction. Metab. Brain Dis. 2020, 35, 1385–1394. [Google Scholar]
- Gremer, L.; Schölzel, D.; Schenk, C.; Reinartz, E.; Labahn, J.; Ravelli, R.B.G.; Tusche, M.; Lopez-Iglesias, C.; Hoyer, W.; Heise, H.; et al. Fibril structure of amyloid-β(1-42) by cryo-electron microscopy. Science 2017, 358, 116–119. [Google Scholar] [PubMed]
- Serrano-Pozo, A.; Frosch, M.P.; Masliah, E.; Hyman, B.T. Neuropathological alterations in Alzheimer disease. Cold Spring Harb. Perspect. Med. 2011, 1, a006189. [Google Scholar] [PubMed]
- Sato, S.; Higuchi, S.; Tanaka, S. Identification and determination of oxygen-containing inorganosulfur compounds by laser Raman spectrometry. Appl. Spectrosc. 1985, 39, 822–827. [Google Scholar]
- Ledesma, M.D.; Dotti, C.G. Amyloid excess in Alzheimer’s disease: What is cholesterol to be blamed for? FEBS Lett. 2006, 580, 5525–5532. [Google Scholar] [PubMed]
- Chen, P.; Shen, A.; Zhao, W.; Baek, S.-J.; Yuan, H.; Hu, J. Raman signature from brain hippocampus could aid Alzheimer’s disease diagnosis. Appl. Opt. 2009, 48, 4743–4748. [Google Scholar] [PubMed]
- Canevari, L.; Clark, J.B. Alzheimer’s disease and cholesterol: The fat connection. Neurochem. Res. 2007, 32, 739–750. [Google Scholar]
- Czamara, K.; Majzner, K.; Pacia, M.Z.; Kochan, K.; Kaczor, A.; Baranska, M. Raman spectroscopy of lipids: A review. J. Raman Spectrosc. 2015, 46, 4–20. [Google Scholar]
- Howell, N.K.; Arteaga, G.; Nakai, S.; Li-Chan, E.C.Y. Raman spectral analysis in the C-H stretching region of proteins and amino acids for investigation of hydrophobic interactions. J. Agric. Food Chem. 1999, 47, 924–933. [Google Scholar]
- LeCacheux, P.; Ménard, G.; Quang, H.N.; Dao, N.Q.; Roach, A.G.; Dron, D. Quantitative determination of free and esterified cholesterol concentrations in cholesterol-fed rabbit aorta using near-infrared- Fourier transform-Raman spectroscopy. Spectrochim. Acta Part A Mol. Biomol. Spectrosc. 1996, 52, 1619–1627. [Google Scholar]
- Rapp, J.H.; Connor, W.E.; Lin, D.S.; Inahara, T.; Porter, J.M. Lipids of human atherosclerotic plaques and xanthomas: Clues to the mechanism of plaque progression. J. Lipid Res. 1983, 24, 1329–1335. [Google Scholar]
- Lee, V.M.; Goedert, M.; Trojanowski, J.Q. Neurodegenerative tauopathies. Annu. Rev. Neurosci. 2001, 24, 1121–1159. [Google Scholar] [CrossRef] [PubMed]
- Katsinelos, T.; Zeitler, M.; Dimou, E.; Karakatsani, A.; Mueller, H.-M.; Nachman, E.; Steringer, J.P.; de Almodovar, C.R.; Nickel, W.; Jahn, T.R. Unconventional secretion mediates the trans-cellular spreading of Tau. Cell Rep. 2018, 23, 2039–2055. [Google Scholar]
- Barghorn, S.; Biernat, J.; Mandelkow, E. Purification of recombinant tau protein and preparation of Alzheimer-paired helical filaments in vitro. Methods Mol. Biol. 2005, 299, 35–51. [Google Scholar] [PubMed]
- Paulsen, C.E.; Truong, T.H.; Garcia, F.J.; Homann, A.; Gupta, V.; Leonard, S.E.; Carroll, K.S. Peroxide-dependent sulfenylation of the EGFR catalytic site enhances kinase activity. Nat. Chem. Biol. 2012, 8, 57–64. [Google Scholar]
- Prosser, B.L.; Ward, C.W.; Lederer, W.J. X-ROS signaling: Rapid mechano-chemo transduction in heart. Science 2011, 333, 1440–1445. [Google Scholar] [CrossRef] [PubMed]
- Bae, Y.S.; Kang, S.W.; Seo, M.S.; Baines, I.C.; Tekle, E.; Chock, P.B.; Rhee, S.G.J. Epidermal growth factor (EGF)-induced generation of hydrogen peroxide. Biol. Chem. 1997, 272, 217–221. [Google Scholar]
- Sundaresan, M.; Yu, Z.X.; Ferrans, V.J.; Irani, K.; Finkel, T. Requirement for generation of H2O2 for platelet-derived growth factor signal transduction. Science 1995, 270, 296–299. [Google Scholar] [CrossRef] [PubMed]
- Dickinson, B.C.; Peltier, J.; Stone, D.; Schaffer, D.V.; Chang, C.J. Nox2 redox signaling maintains essential cell populations in the brain. Nat. Chem. Biol. 2011, 7, 106–112. [Google Scholar] [CrossRef]
- Ostman, A.; Hellberg, C.; Bohmer, F.D. Protein-tyrosine phosphatases and cancer. Nat. Rev. Cancer 2006, 6, 307–320. [Google Scholar]
- Burgoyne, J.R.; Madhani, M.; Cuello, F.; Charles, R.L.; Brennan, J.P.; Schroder, E.; Browning, D.D.; Eaton, P. Cysteine redox sensor in PKGIa enables oxidant-induced activation. Science 2007, 317, 1393–1397. [Google Scholar] [CrossRef]
- Guo, Z.; Kozlov, S.; Lavin, M.F.; Person, M.D.; Paull, T.T. ATM activation by oxidative stress. Science 2010, 330, 517–521. [Google Scholar] [CrossRef]
- Zhang, Y.; Tian, Q.; Zhang, Q.; Zhou, X.; Liu, S.; Wang, J.-Z. Hyperphosphorylation of microtubule-associated tau protein plays dual role in neurodegeneration and neuroprotection. Pathophysiology 2009, 16, 311–316. [Google Scholar] [CrossRef] [PubMed]
- Limorenko, G.; Lashuel, H.A. Revisiting the grammar of Tau aggregation and pathology formation: How new insights from brain pathology are shaping show we study and target Tauopathies. Chem. Soc. Rev. 2022, 51, 513–565. [Google Scholar] [CrossRef]
- Rani, L.; Mallajosyula, S.S. Phosphorylation-induced structural reorganization in Tau-paired helical filaments. ACS Chem. Neurosci. 2021, 12, 1621–1631. [Google Scholar] [CrossRef]
- Fitzpatrick, A.W.P.; Falcon, B.; He, S.; Murzin, A.G.; Murshudov, G.; Garringer, H.J.; Crowther, R.A.; Ghetti, B.; Goedert, M.; Scheres, S.H.W. Cryo-EM structures of tau filaments from Alzheimer’s disease. Nature 2017, 547, 185–190. [Google Scholar] [CrossRef] [PubMed]
- Kanagasingam, S.; von Ruhland, C.; Welbury, R.; Singhrao, S.K. Antimicrobial, polarising light, and paired helical filament properties of fragmented tau peptides of selected putative gingipains. J. Alzheimer’s Dis. 2022, 89, 1279–1291. [Google Scholar] [CrossRef] [PubMed]
- Kanagasingam, S.; von Ruhland, C.; Welbury, R.; Chukkapalli, S.S.; Singhrao, S. Porphyromonas gingivalis conditioned medium induces amyloidogenic processing of the amyloid-β protein precursor upon in vitro infection of SH-SY5Y cells. J. Alzheimer’s Dis. Rep. 2022, 6, 577–587. [Google Scholar] [CrossRef]
- He, S.; Zhang, W.; Liu, L.; Huang, Y.; He, J.; Xie, W.; Wu, P.; Du, C. Baseline correction for Raman spectra using an improved asymmetric least squares method. Anal. Methods 2014, 6, 4402–4407. [Google Scholar] [CrossRef]
- Pezzotti, G.; Kobara, M.; Nakaya, T.; Imamura, H.; Miyamoto, N.; Adachi, T.; Yamamoto, T.; Kanamura, N.; Ohgitani, E.; Marin, E.; et al. Raman spectroscopy of oral Candida species: Molecular-scale analyses, chemometrics, and barcode identification. Int. J. Mol. Sci. 2022, 23, 5359. [Google Scholar] [CrossRef]


Disclaimer/Publisher’s Note: The statements, opinions and data contained in all publications are solely those of the individual author(s) and contributor(s) and not of MDPI and/or the editor(s). MDPI and/or the editor(s) disclaim responsibility for any injury to people or property resulting from any ideas, methods, instructions or products referred to in the content. |
© 2023 by the authors. Licensee MDPI, Basel, Switzerland. This article is an open access article distributed under the terms and conditions of the Creative Commons Attribution (CC BY) license (https://creativecommons.org/licenses/by/4.0/).
Share and Cite
Pezzotti, G.; Adachi, T.; Imamura, H.; Bristol, D.R.; Adachi, K.; Yamamoto, T.; Kanamura, N.; Marin, E.; Zhu, W.; Kawai, T.; et al. In Situ Raman Study of Neurodegenerated Human Neuroblastoma Cells Exposed to Outer-Membrane Vesicles Isolated from Porphyromonas gingivalis. Int. J. Mol. Sci. 2023, 24, 13351. https://doi.org/10.3390/ijms241713351
Pezzotti G, Adachi T, Imamura H, Bristol DR, Adachi K, Yamamoto T, Kanamura N, Marin E, Zhu W, Kawai T, et al. In Situ Raman Study of Neurodegenerated Human Neuroblastoma Cells Exposed to Outer-Membrane Vesicles Isolated from Porphyromonas gingivalis. International Journal of Molecular Sciences. 2023; 24(17):13351. https://doi.org/10.3390/ijms241713351
Chicago/Turabian StylePezzotti, Giuseppe, Tetsuya Adachi, Hayata Imamura, Davide Redolfi Bristol, Keiji Adachi, Toshiro Yamamoto, Narisato Kanamura, Elia Marin, Wenliang Zhu, Toshihisa Kawai, and et al. 2023. "In Situ Raman Study of Neurodegenerated Human Neuroblastoma Cells Exposed to Outer-Membrane Vesicles Isolated from Porphyromonas gingivalis" International Journal of Molecular Sciences 24, no. 17: 13351. https://doi.org/10.3390/ijms241713351
APA StylePezzotti, G., Adachi, T., Imamura, H., Bristol, D. R., Adachi, K., Yamamoto, T., Kanamura, N., Marin, E., Zhu, W., Kawai, T., Mazda, O., Kariu, T., Waku, T., Nichols, F. C., Riello, P., Rizzolio, F., Limongi, T., & Okuma, K. (2023). In Situ Raman Study of Neurodegenerated Human Neuroblastoma Cells Exposed to Outer-Membrane Vesicles Isolated from Porphyromonas gingivalis. International Journal of Molecular Sciences, 24(17), 13351. https://doi.org/10.3390/ijms241713351