
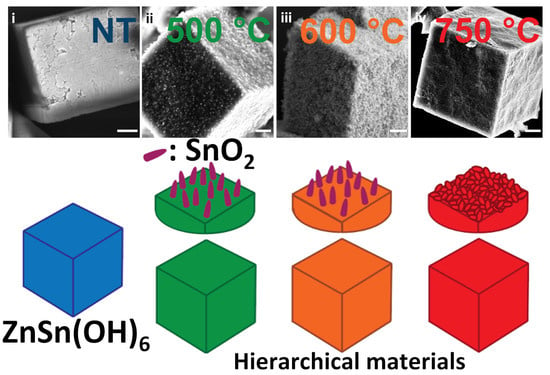
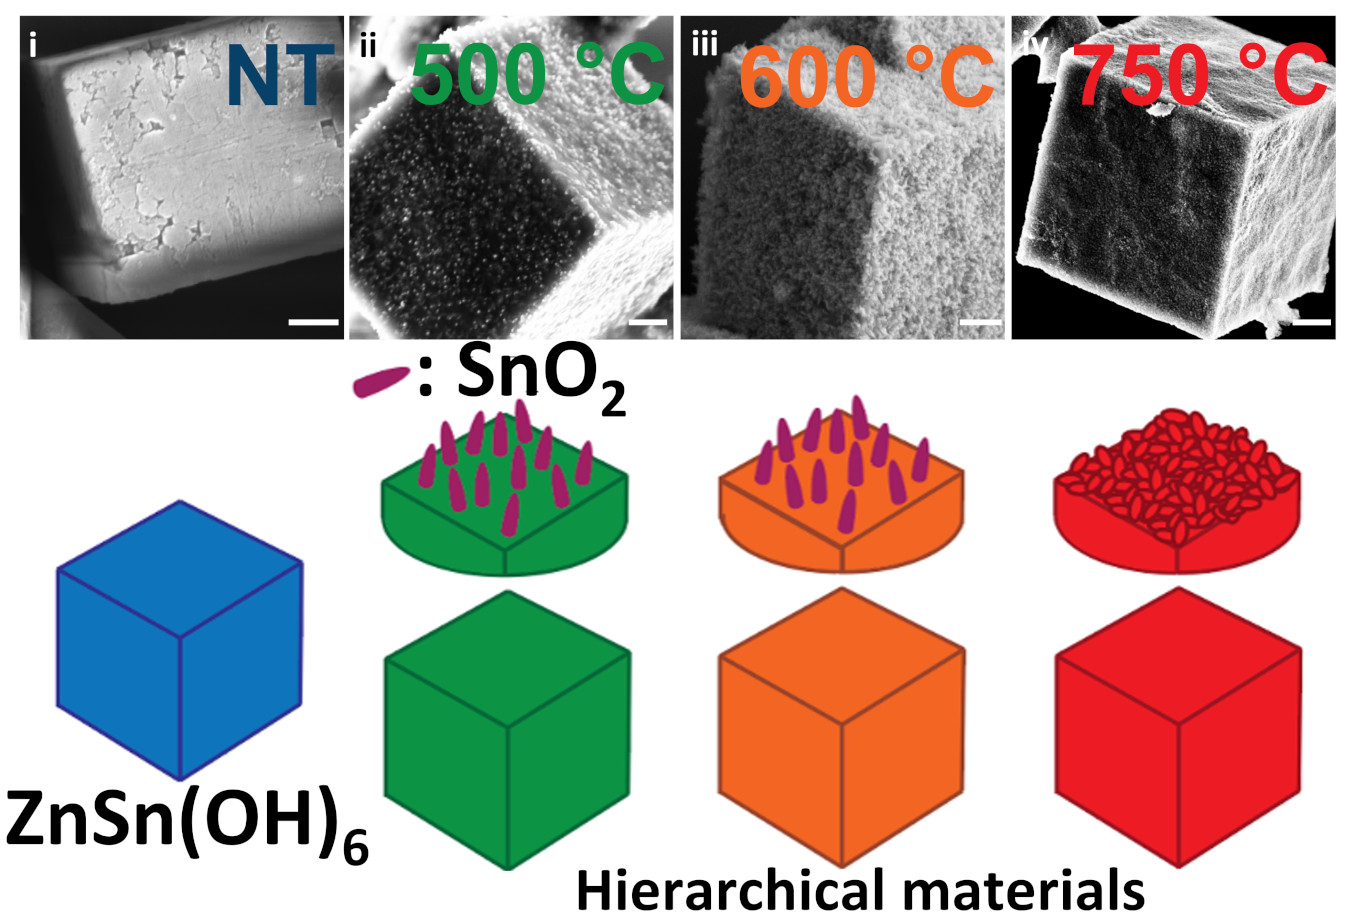
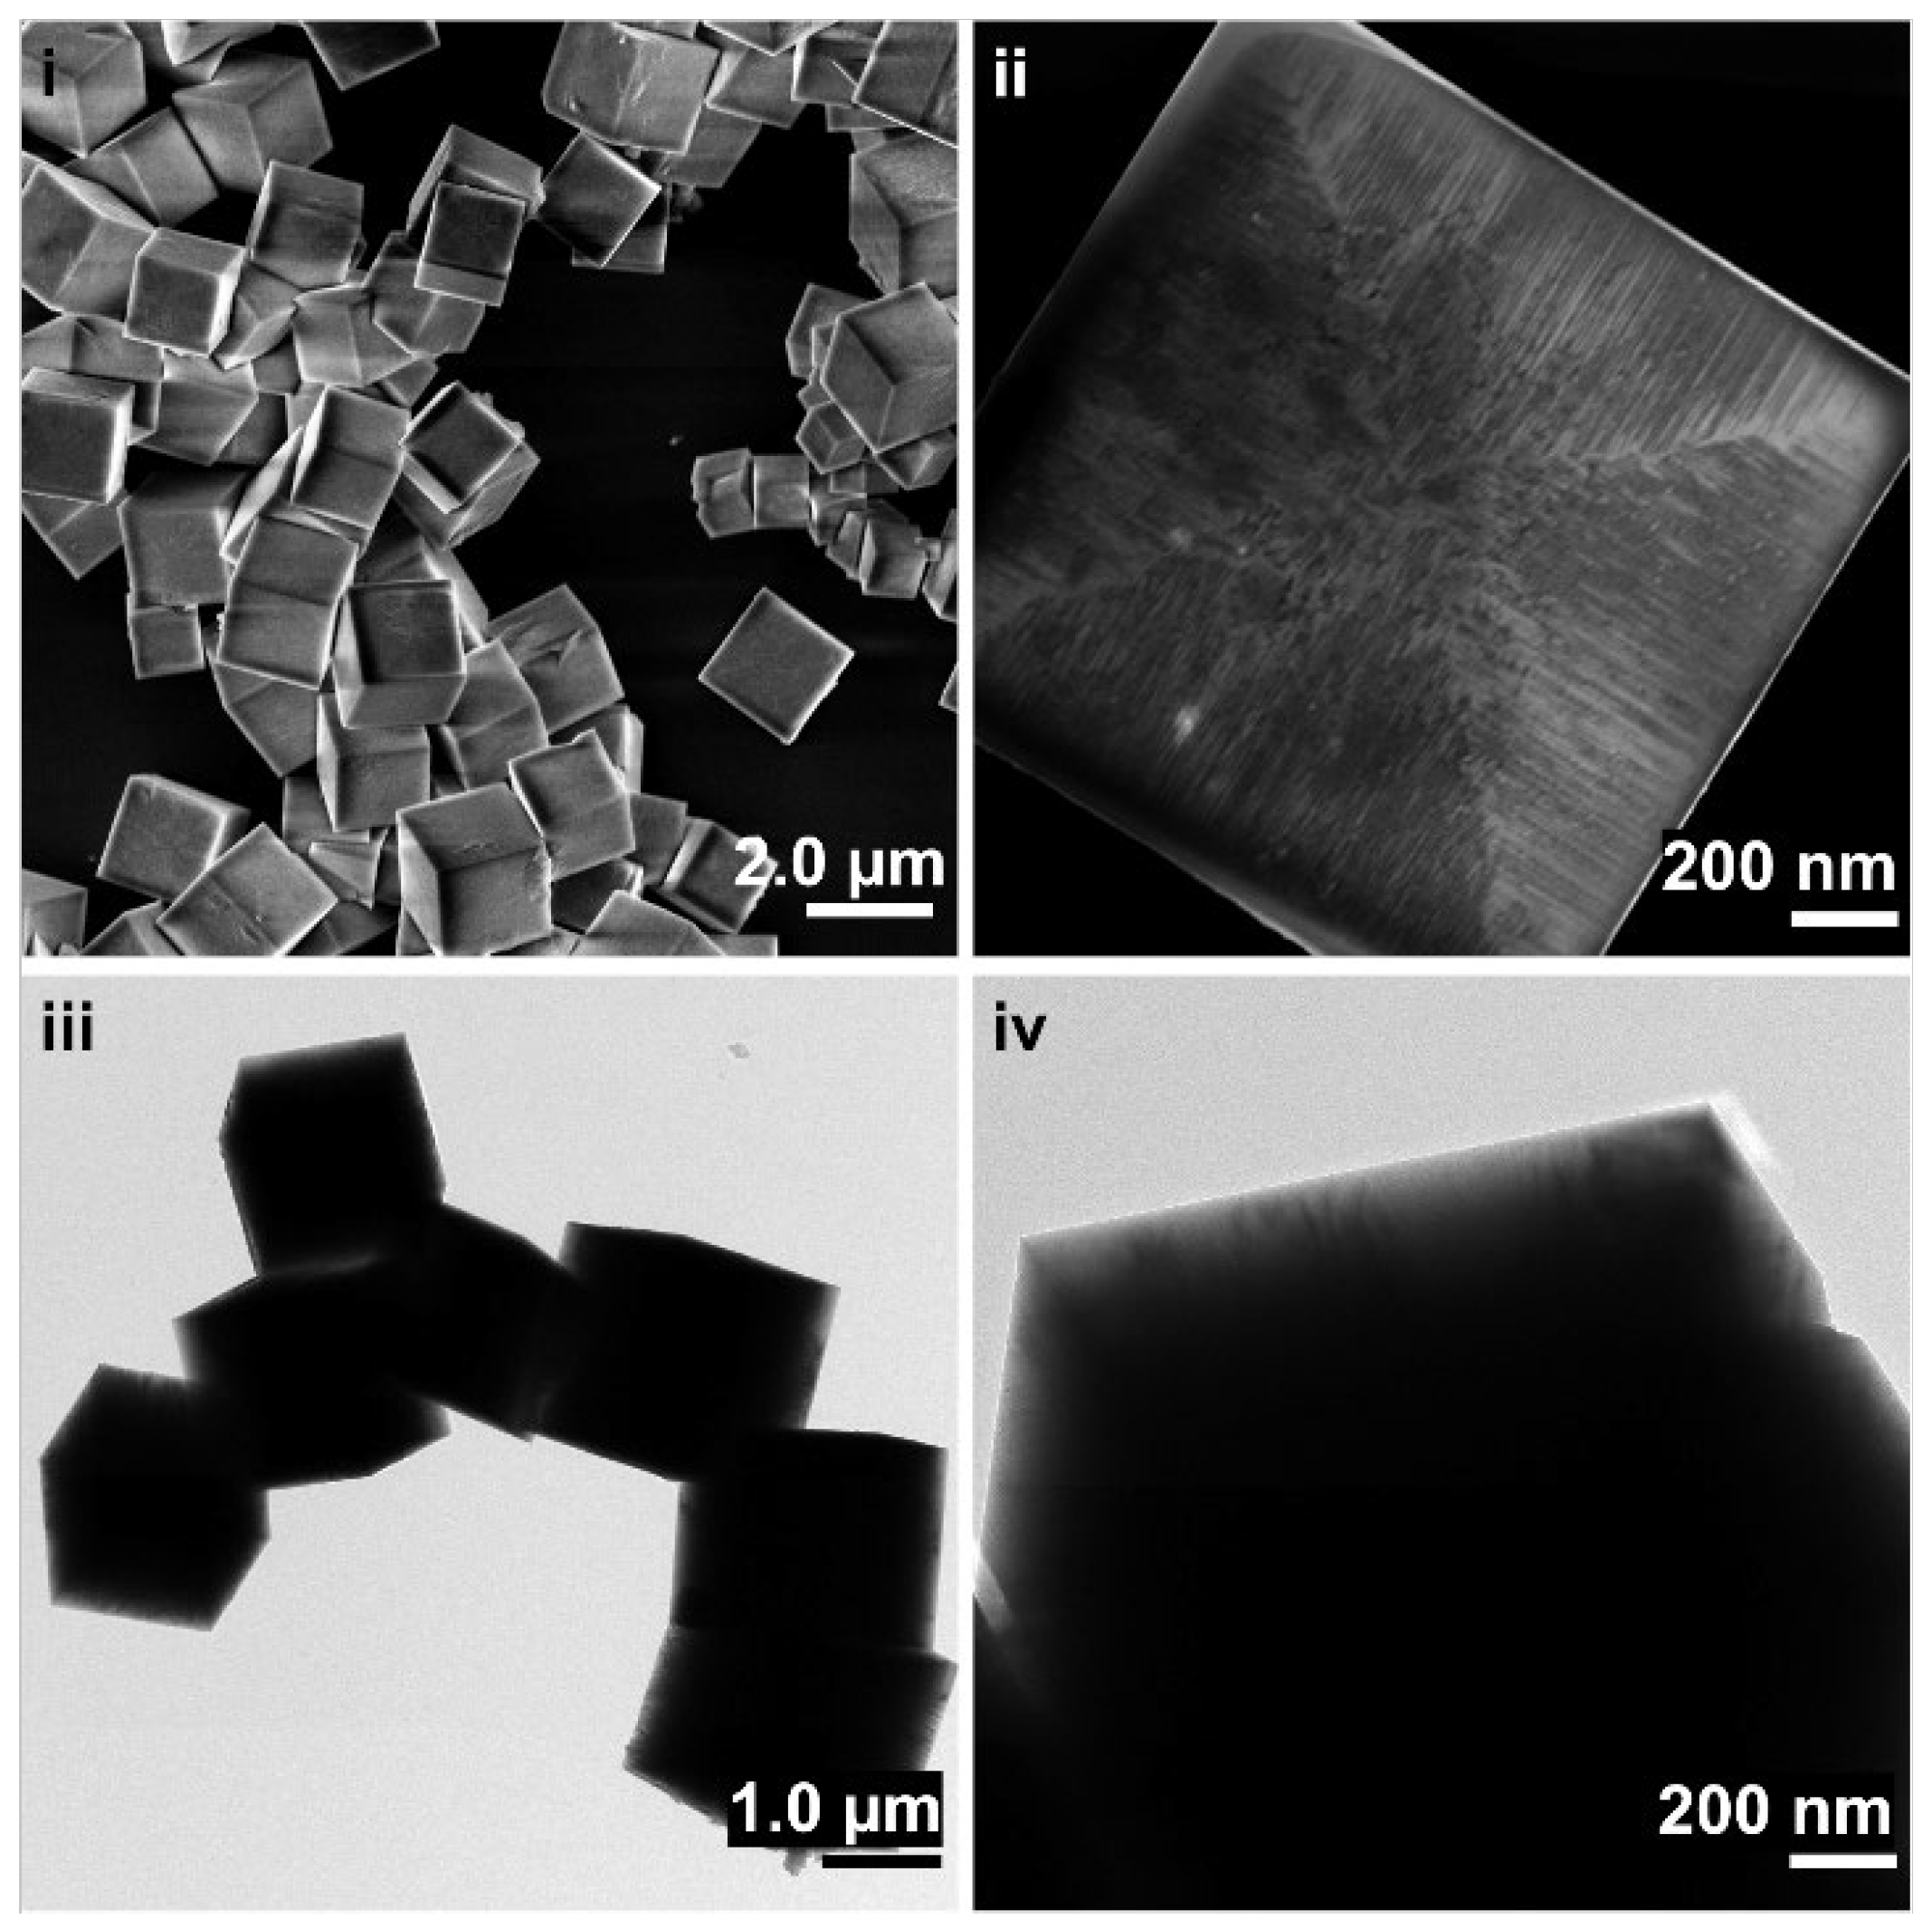
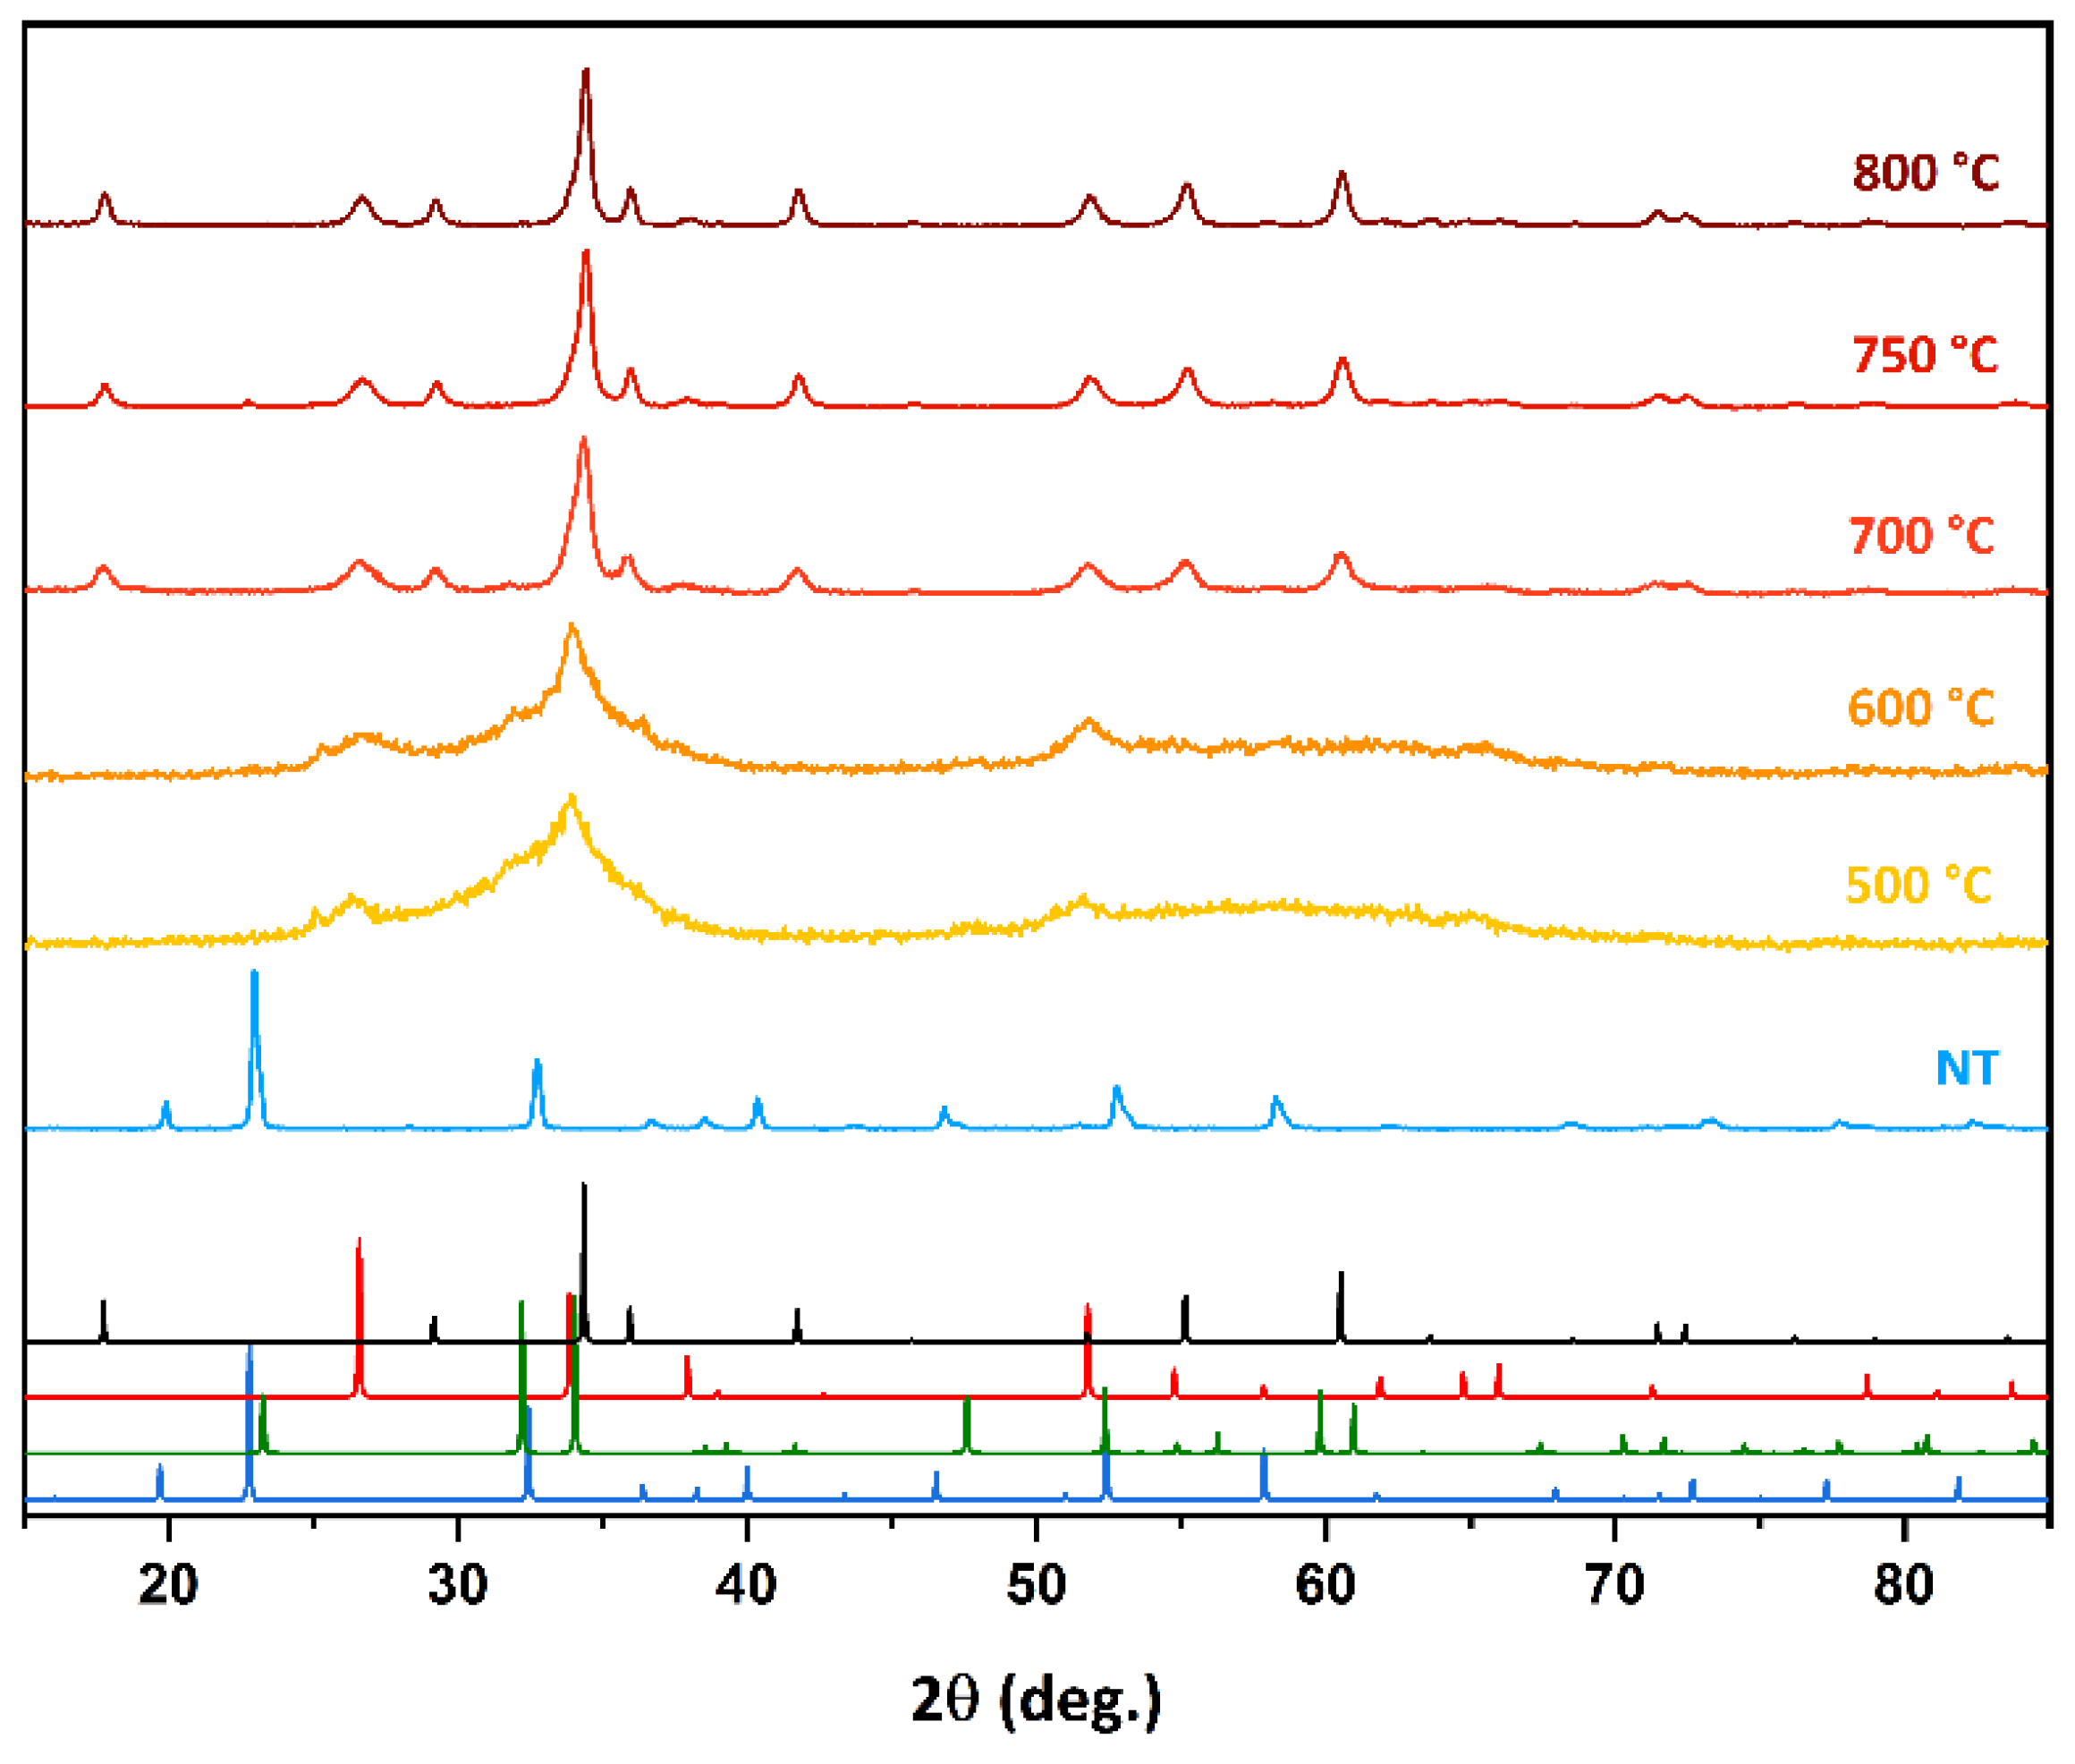
ZnSnO3 or Zn2SnO4/SnO2 Hierarchical Material? Insight into the Formation of ZnSn(OH)6 Derived Oxides
 , , , , and
Abstract
:
1. Introduction
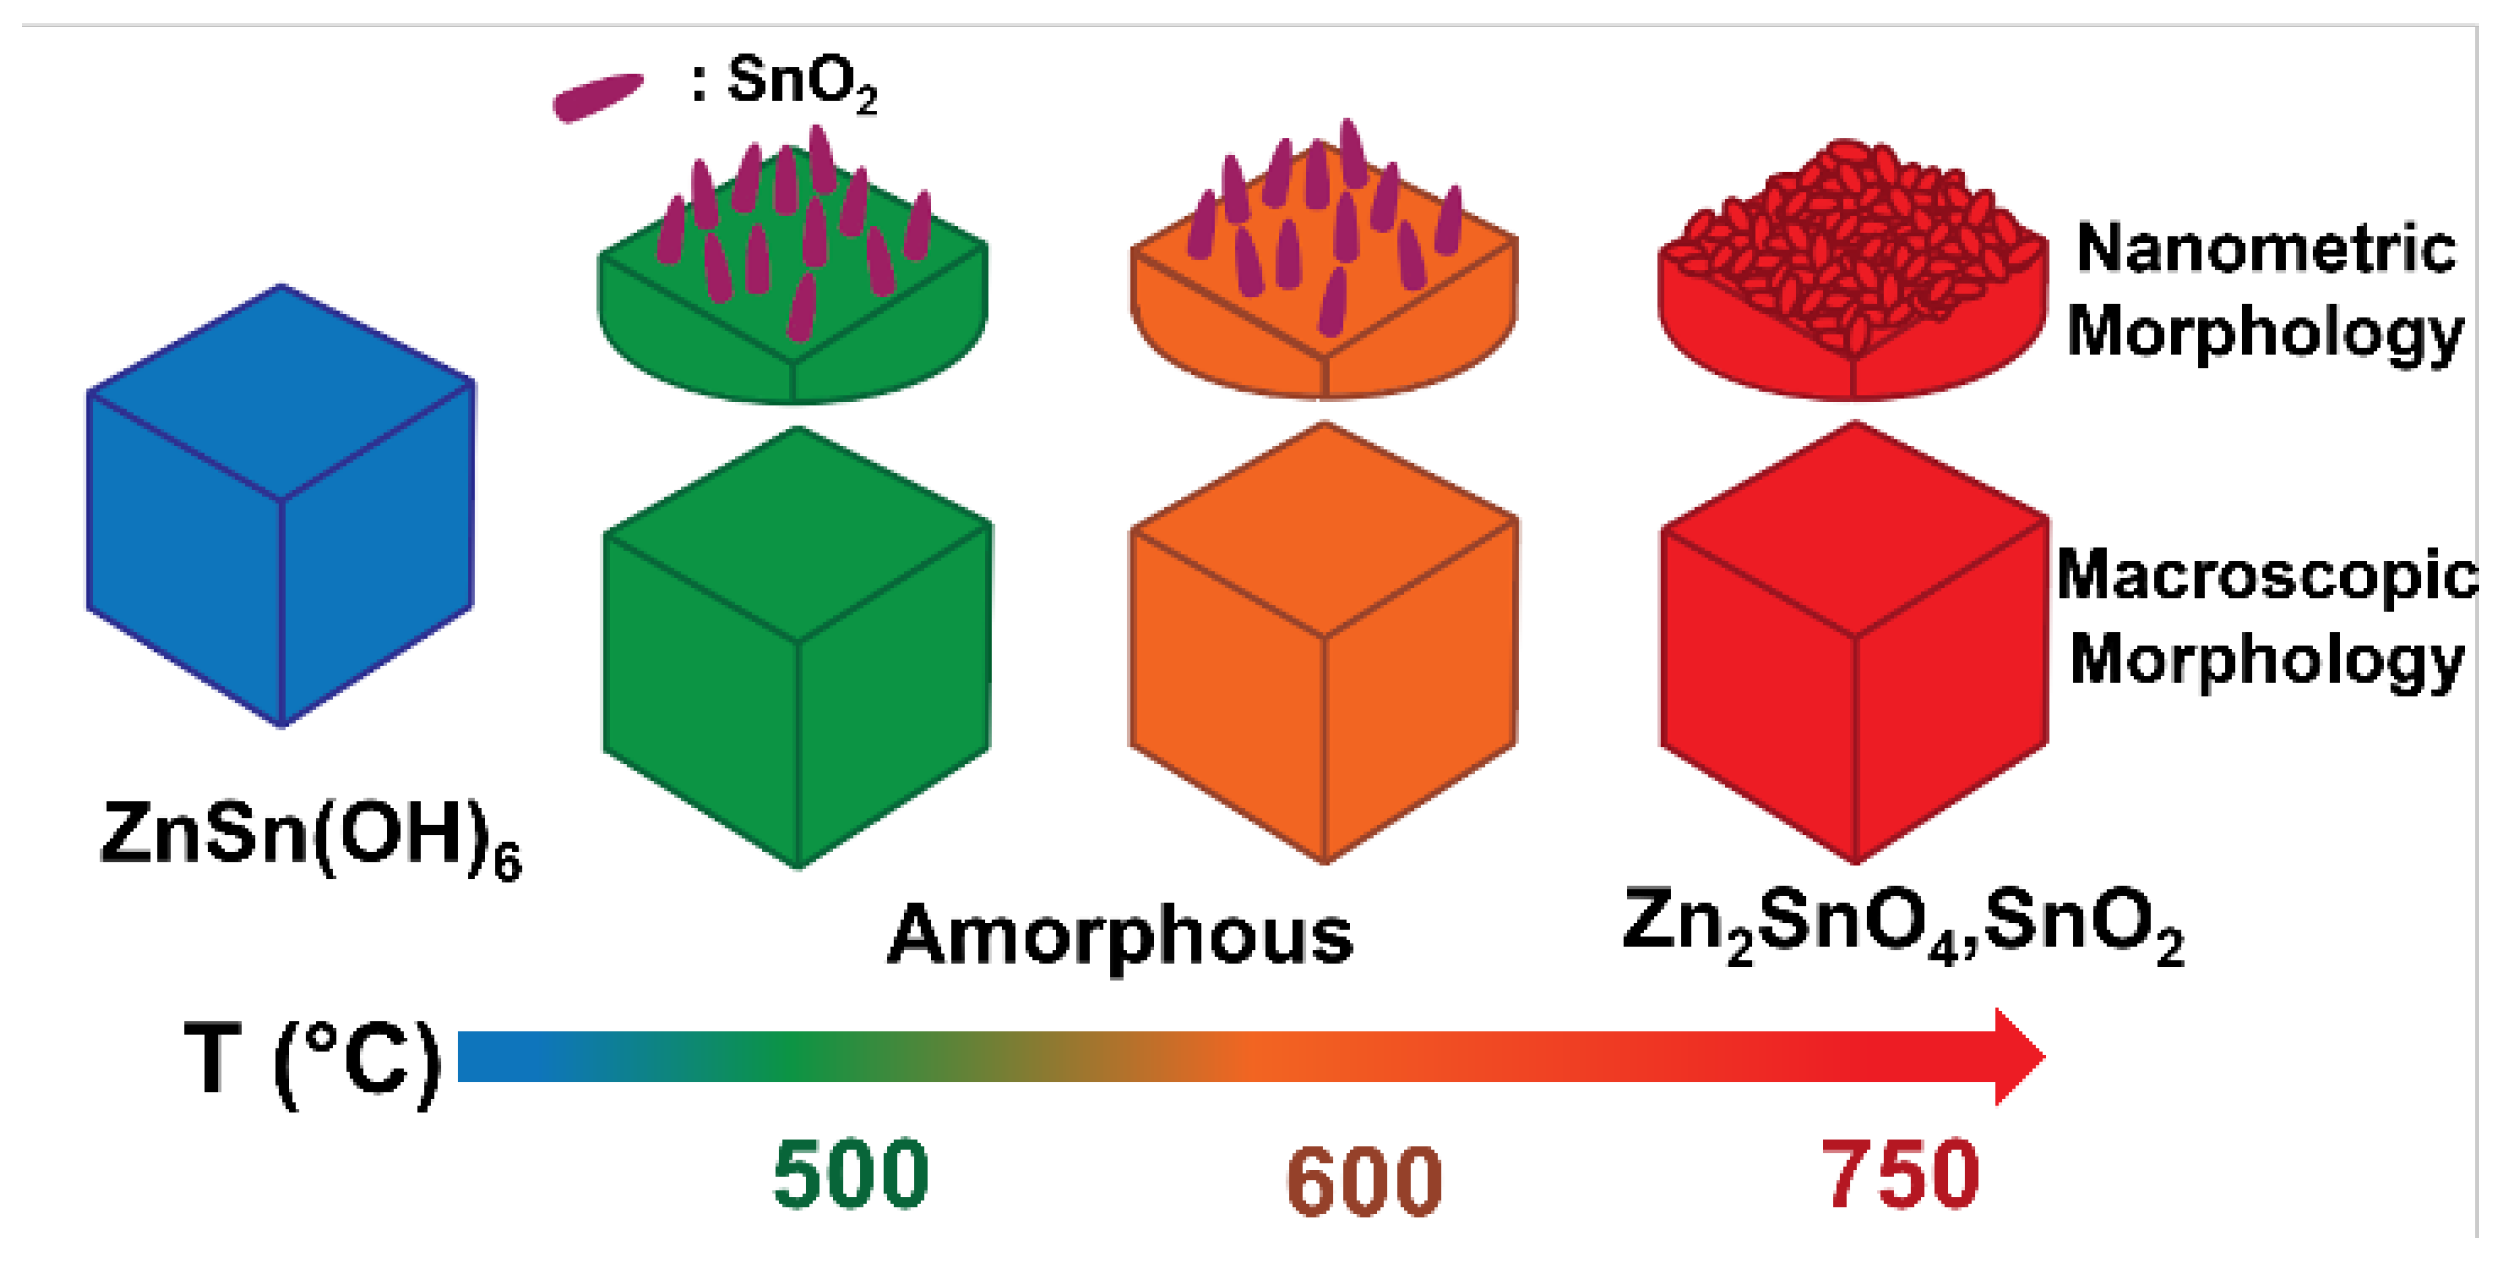
2. Results
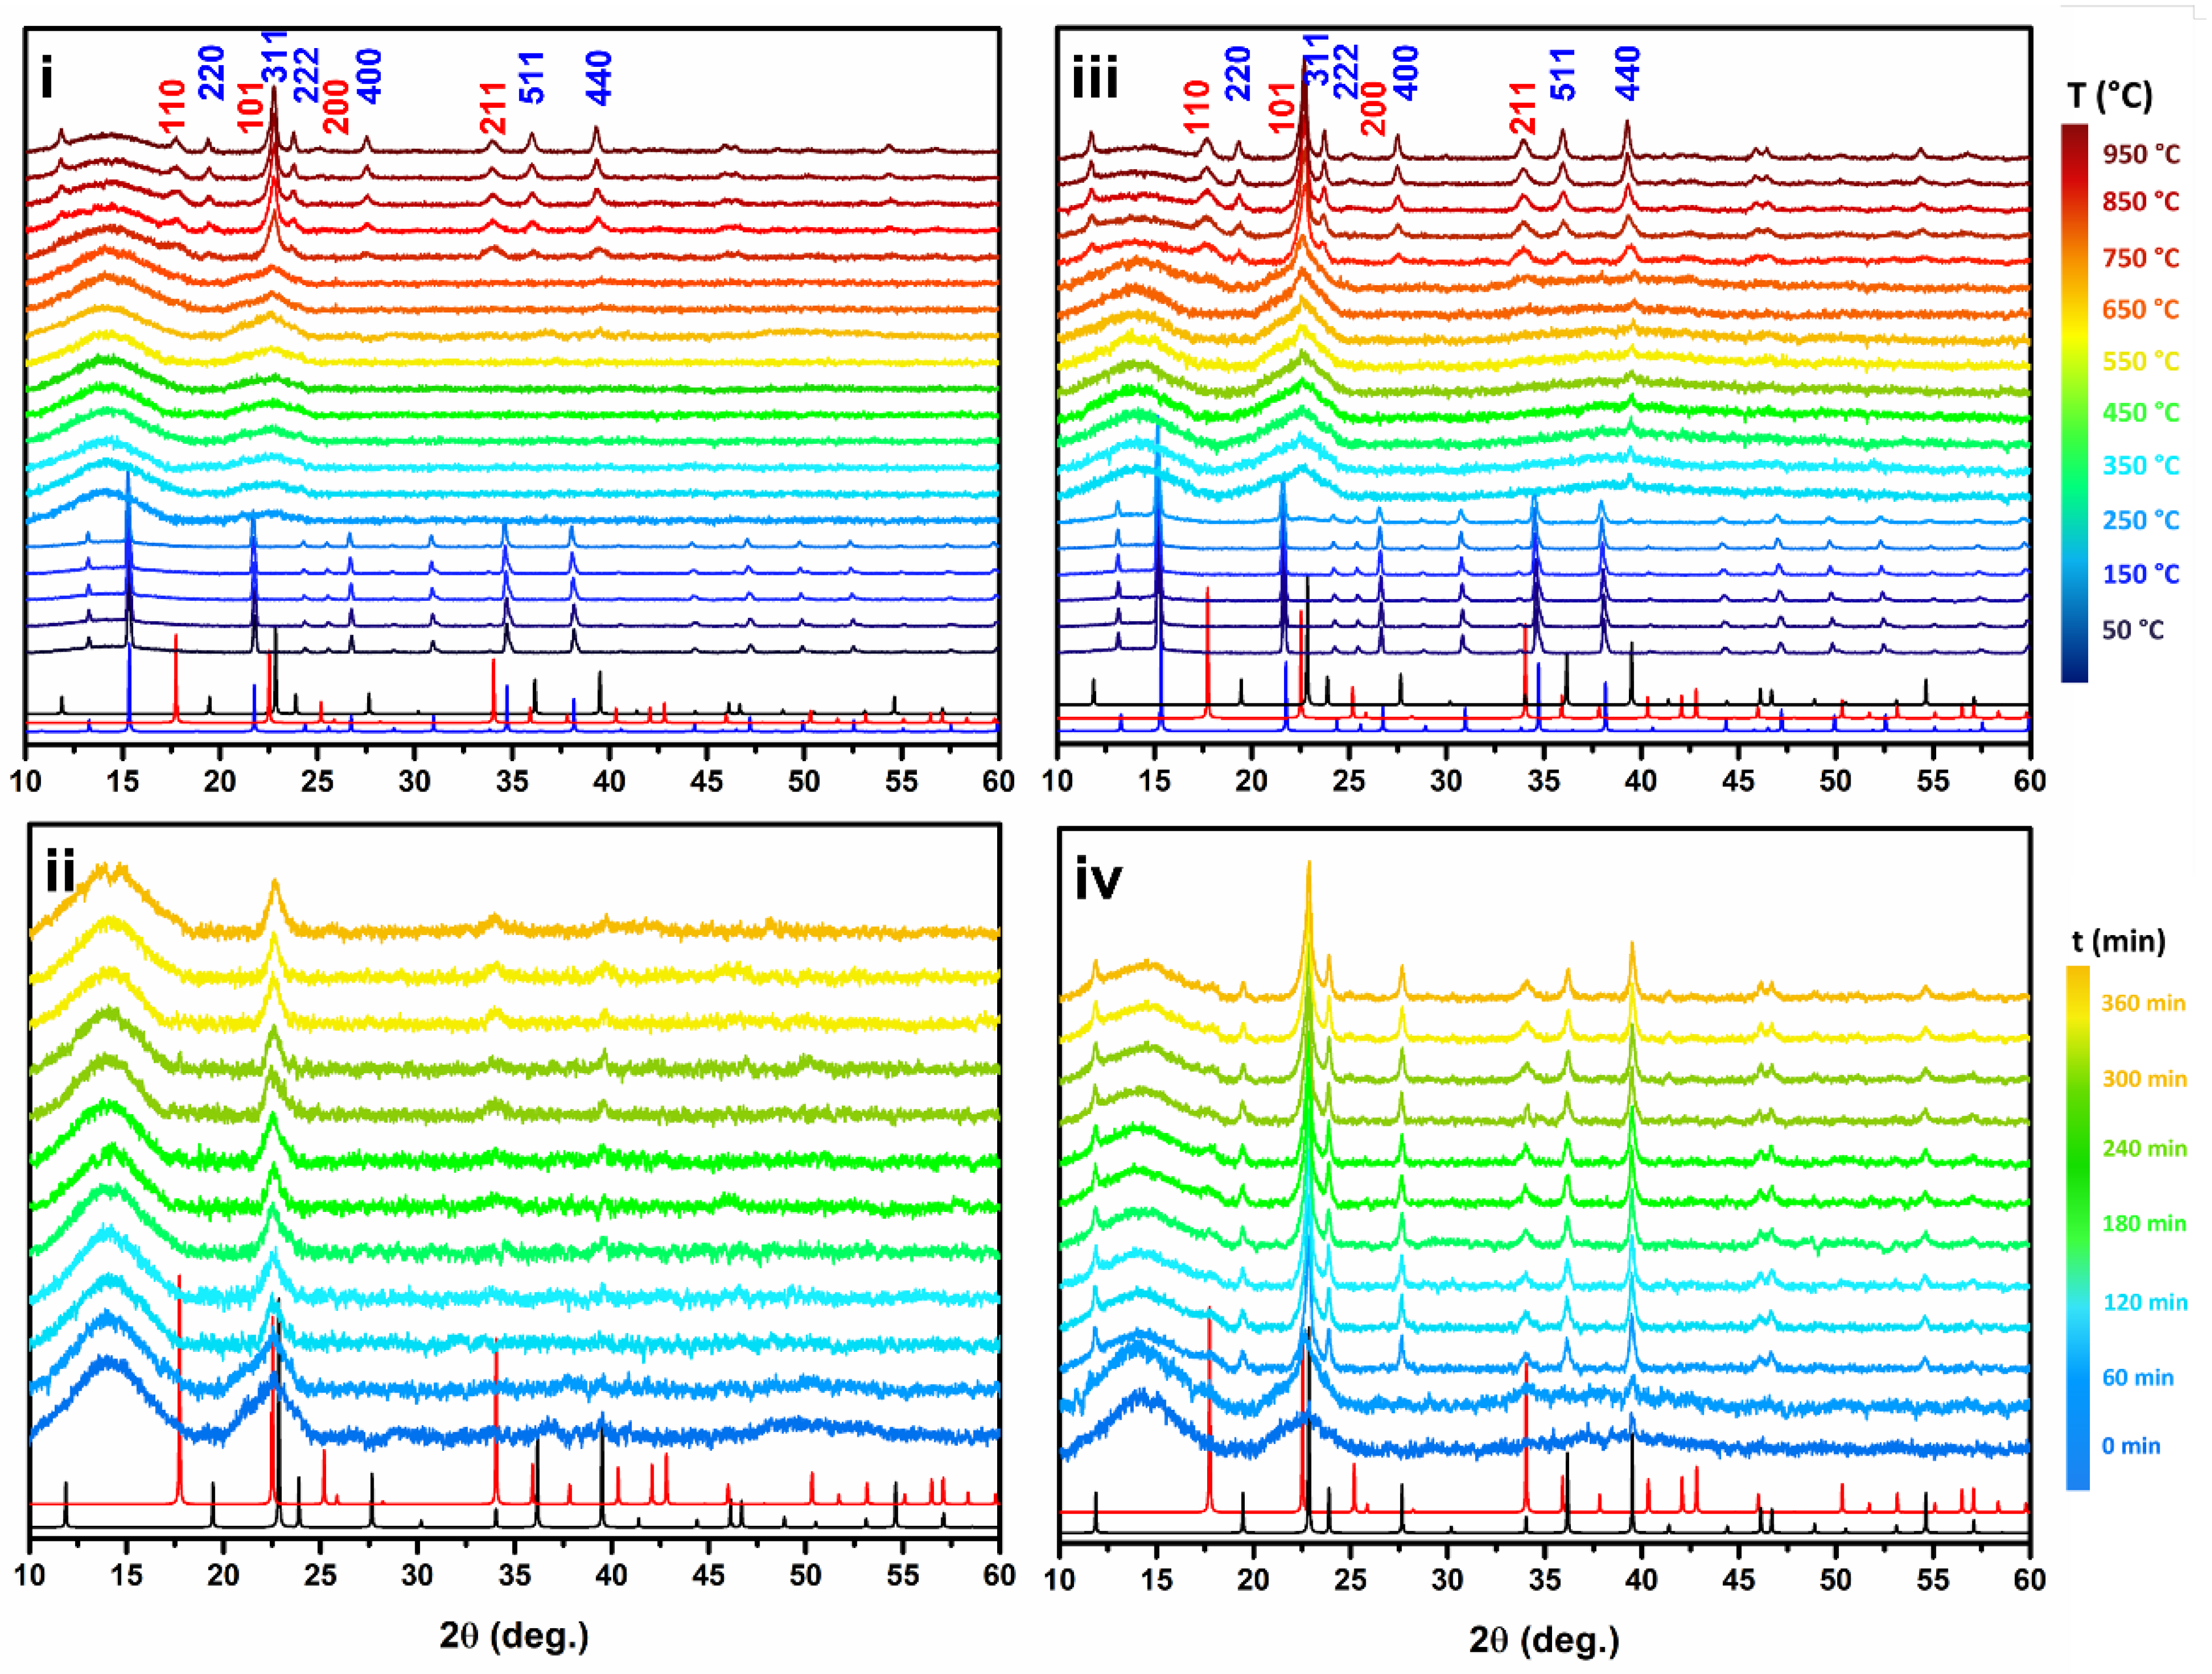
2.1. Air Flux Condition
2.2. Vacuum Condition
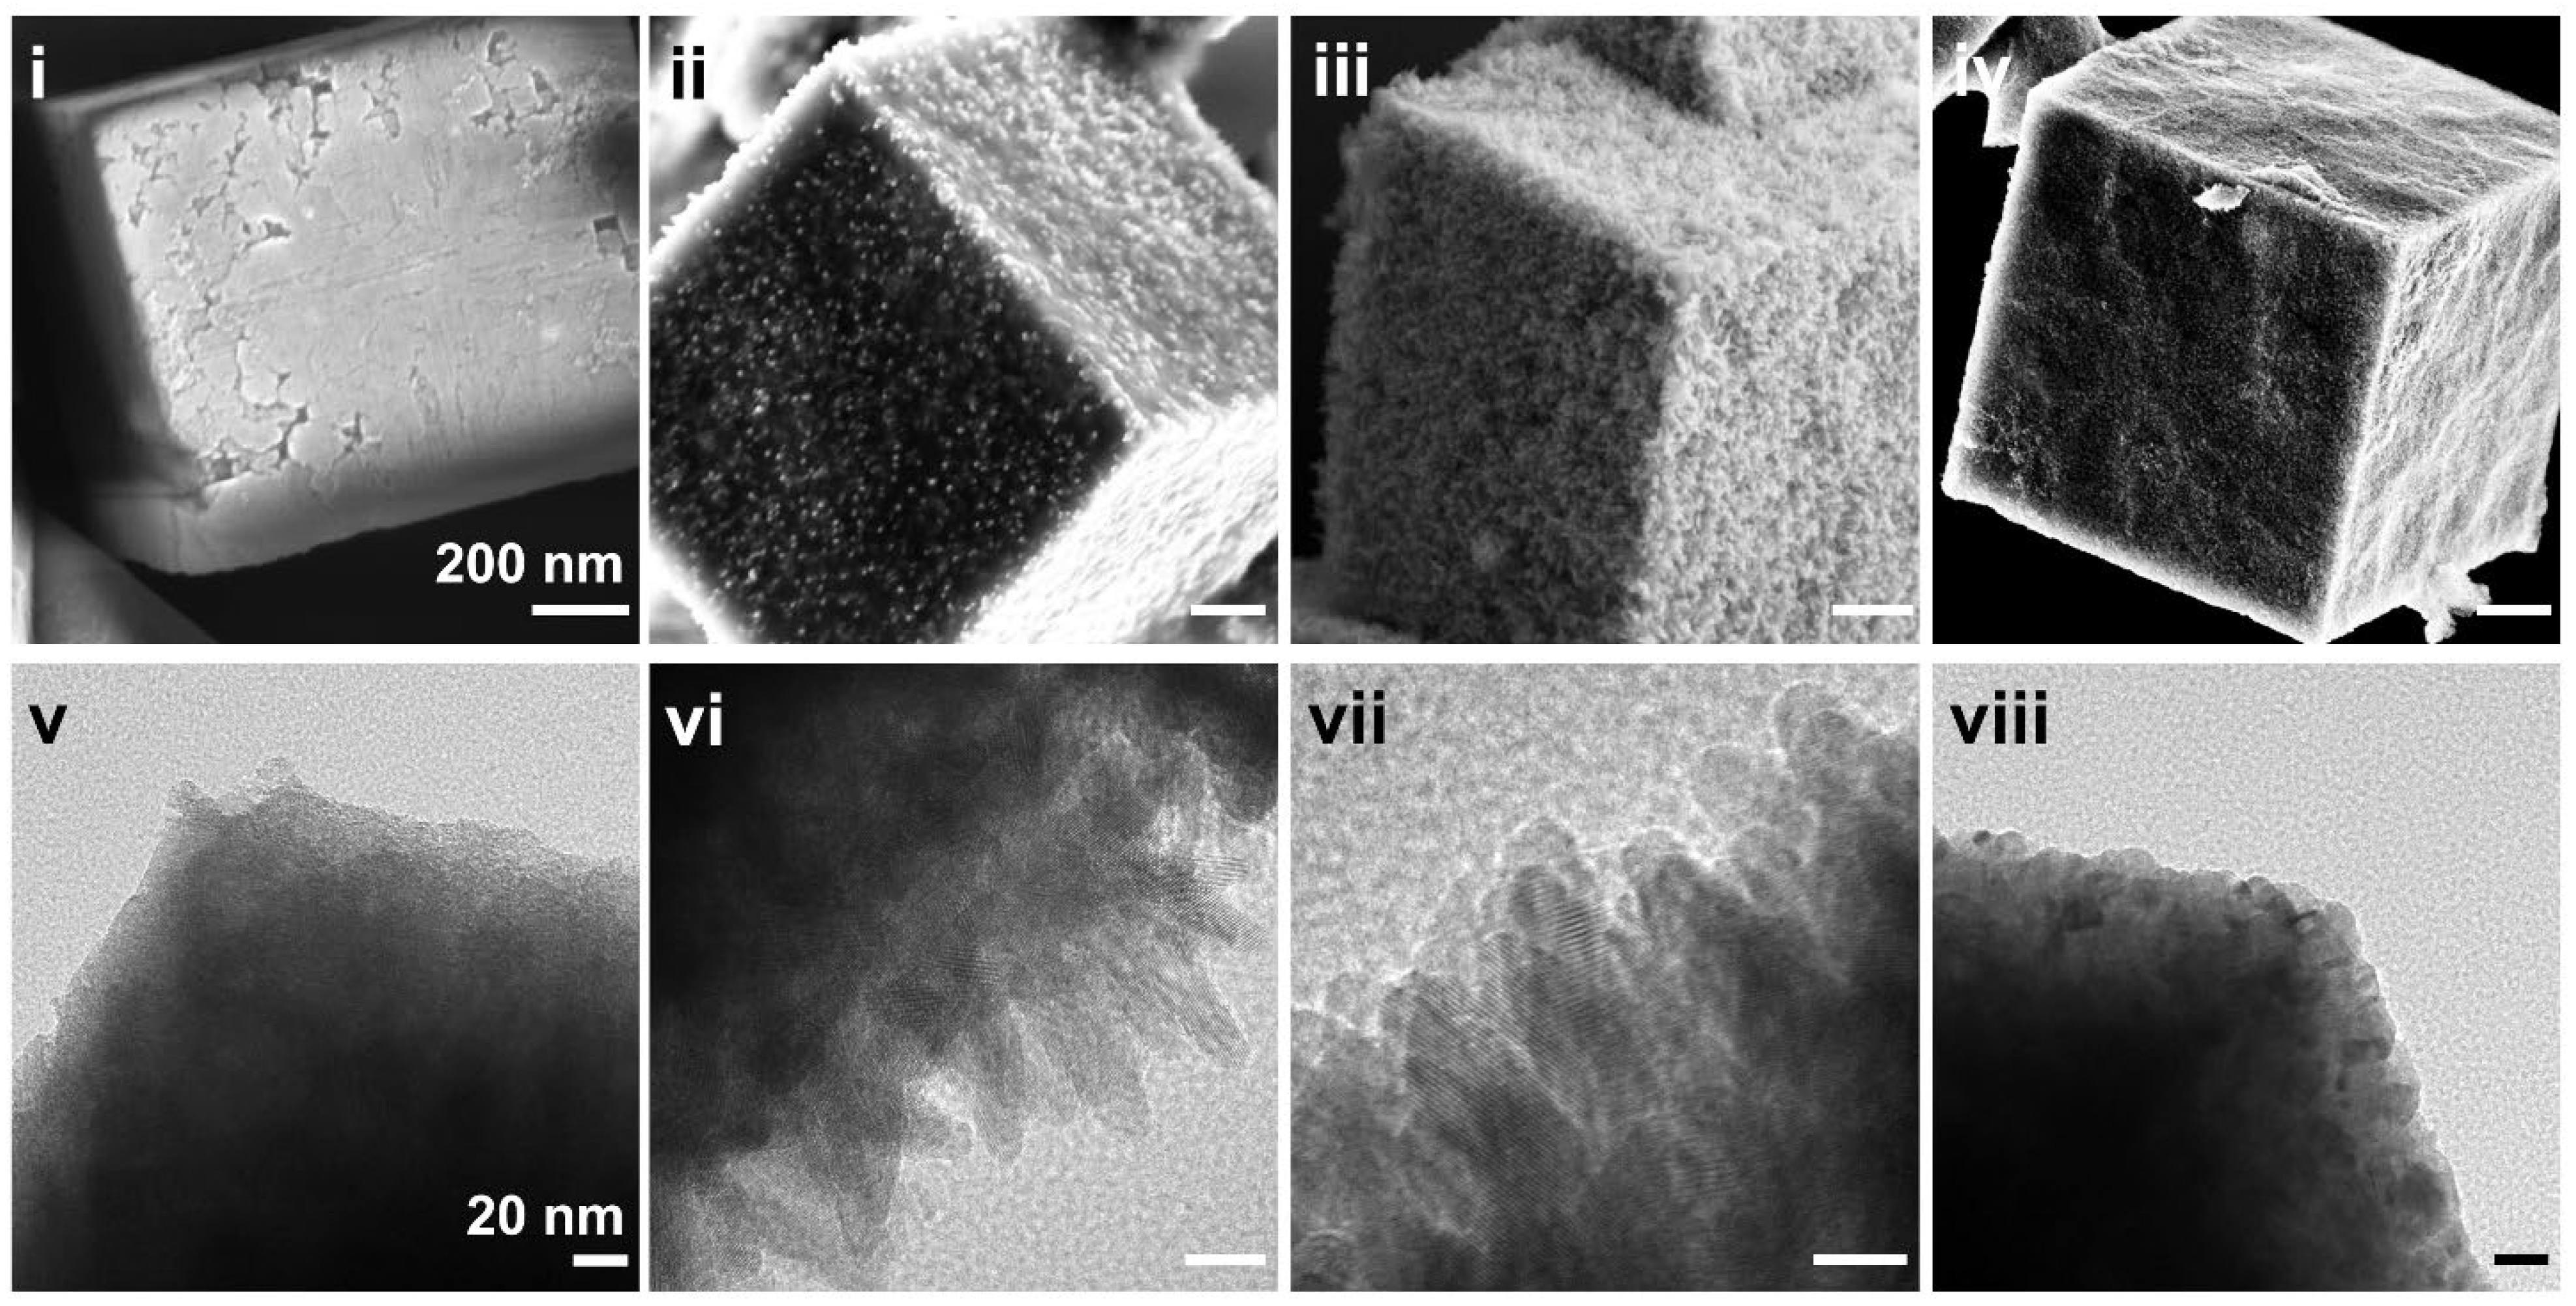
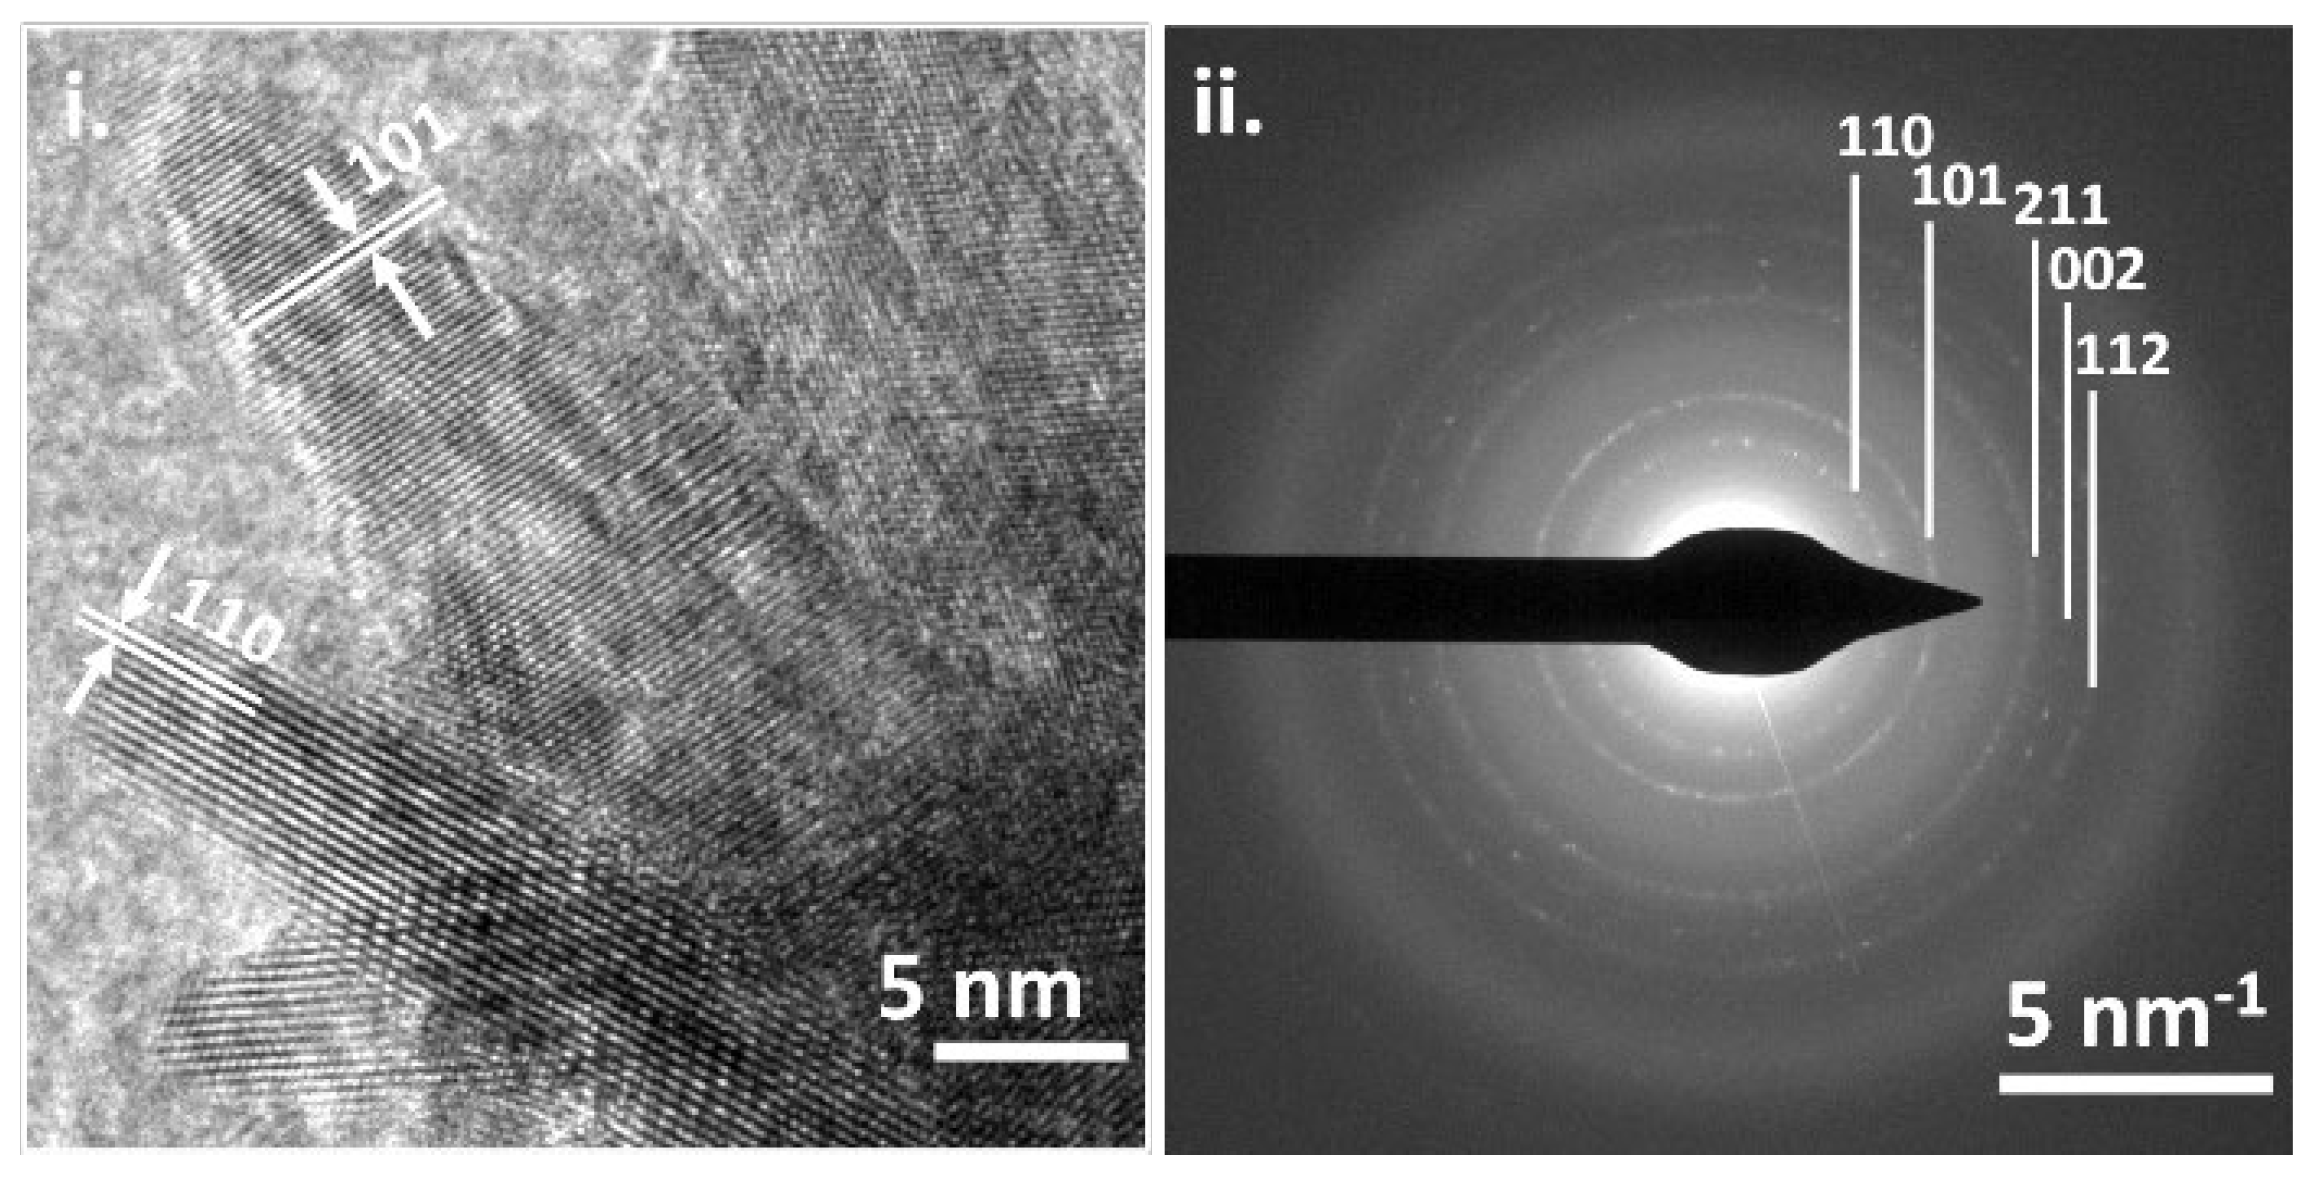
2.3. Morphology
3. Materials and Methods
3.1. Materials
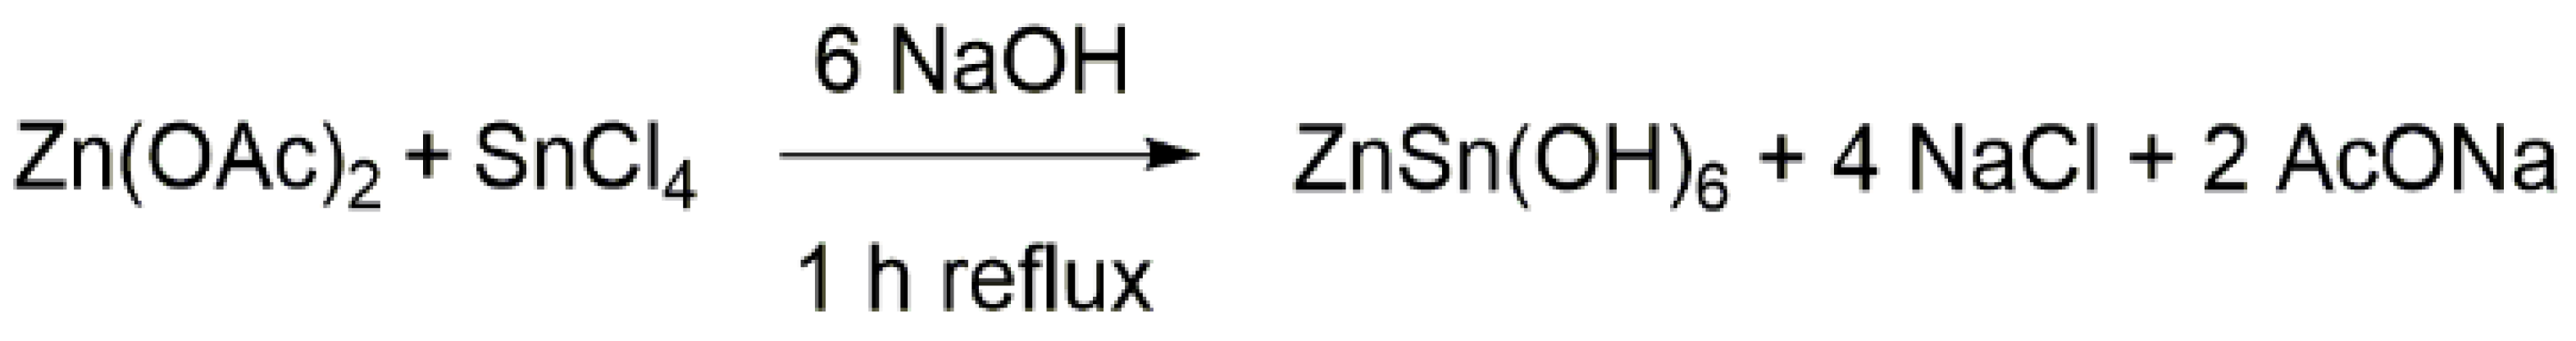
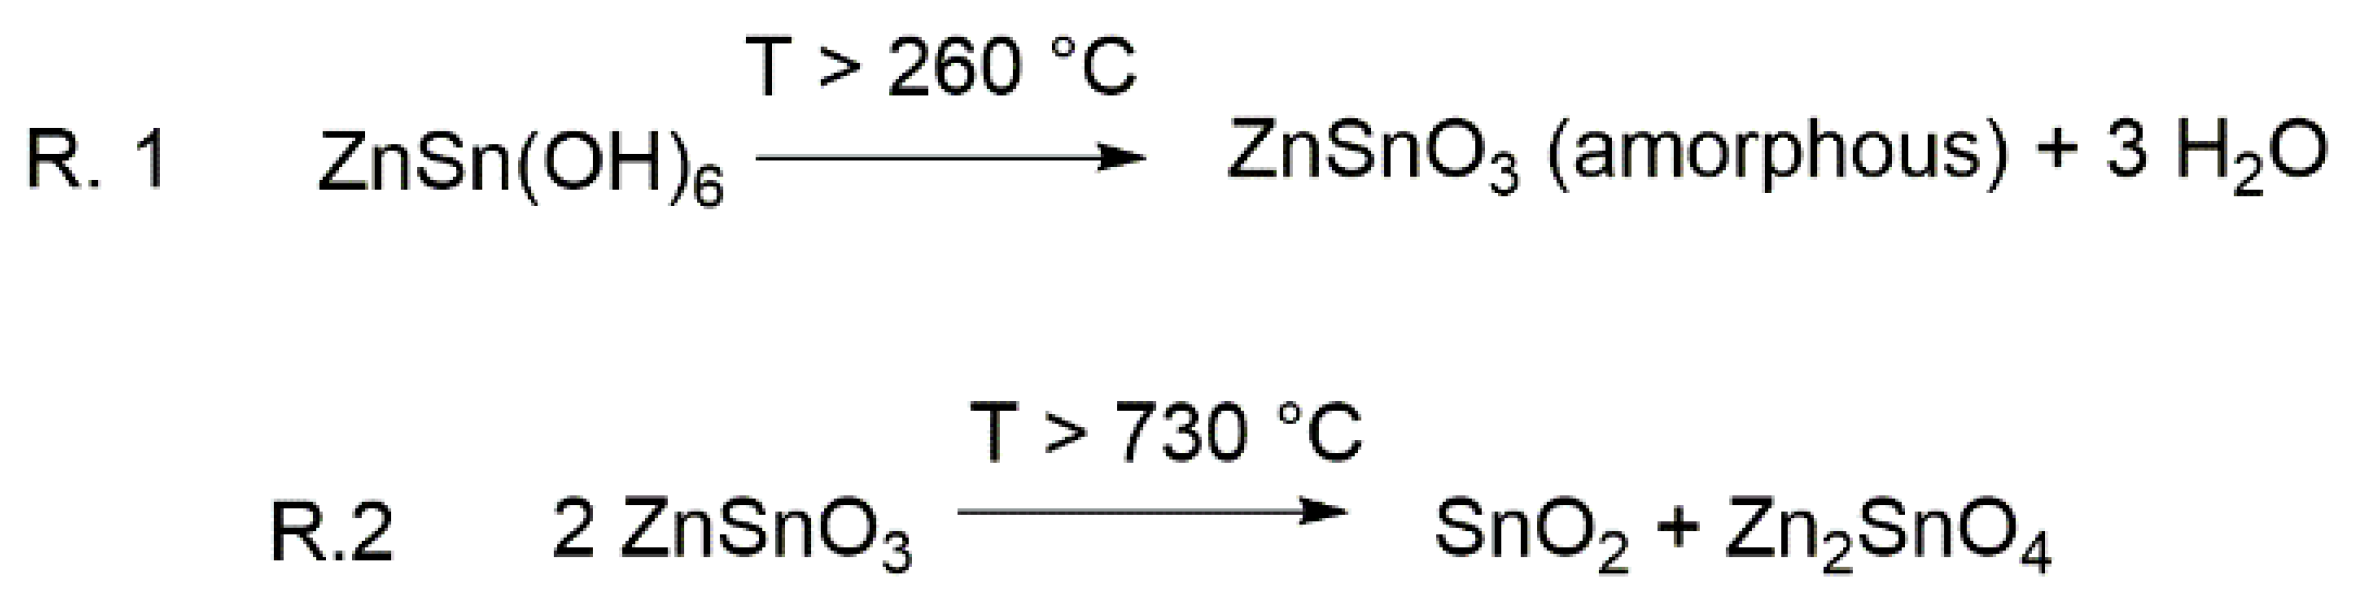
3.2. ZnSn(OH)6 Preparation and Thermal Treatments
3.3. Structural Characterization
4. Conclusions
Supplementary Materials
Author Contributions
Funding
Data Availability Statement
Acknowledgments
Conflicts of Interest
References
- Horrocks, A.R.; Anand, S.C. Handbook of Technical Textiles, 2nd ed.; Technical Textile Applications; Woodhead: Sawston, UK, 2016; Volume 2, ISBN 9780857090560. [Google Scholar]
- Hosseini, E.S.; Manjakkal, L.; Shakthivel, D.; Dahiya, R. Glycine-Chitosan-Based Flexible Biodegradable Piezoelectric Pressure Sensor. ACS Appl. Mater. Interfaces 2020, 12, 9008–9016. [Google Scholar] [CrossRef] [PubMed] [Green Version]
- Chen, Z.; Wang, Z.; Li, X.; Lin, Y.; Luo, N.; Long, M.; Zhao, N.; Xu, J.-B. Flexible Piezoelectric-Induced Pressure Sensors for Static Measurements Based on Nanowires/Graphene Heterostructures. ACS Nano 2017, 11, 4507–4513. [Google Scholar] [CrossRef]
- Zaszczyńska, A.; Gradys, A.; Sajkiewicz, P. Progress in the Applications of Smart Piezoelectric Materials for Medical Devices. Polymers 2020, 12, 2754. [Google Scholar] [CrossRef]
- Zhang, C.; Fan, Y.; Li, H.; Li, Y.; Zhang, L.; Cao, S.; Kuang, S.; Zhao, Y.; Chen, A.; Zhu, G.; et al. Fully Rollable Lead-Free Poly(Vinylidene Fluoride)-Niobate-Based Nanogenerator with Ultra-Flexible Nano-Network Electrodes. ACS Nano 2018, 12, 4803–4811. [Google Scholar] [CrossRef] [PubMed]
- Hu, D.; Yao, M.; Fan, Y.; Ma, C.; Fan, M.; Liu, M. Strategies to Achieve High Performance Piezoelectric Nanogenerators. Nano Energy 2019, 55, 288–304. [Google Scholar] [CrossRef]
- Sezer, N.; Koç, M. A Comprehensive Review on the State-of-the-Art of Piezoelectric Energy Harvesting. Nano Energy 2021, 80, 105567. [Google Scholar] [CrossRef]
- Mahapatra, S.D.; Mohapatra, P.C.; Aria, A.I.; Christie, G.; Mishra, Y.K.; Hofmann, S.; Thakur, V.K. Piezoelectric Materials for Energy Harvesting and Sensing Applications: Roadmap for Future Smart Materials. Adv. Sci. 2021, 8, 2100864. [Google Scholar] [CrossRef] [PubMed]
- Niu, X.; Jia, W.; Qian, S.; Zhu, J.; Zhang, J.; Hou, X.; Mu, J.; Geng, W.; Cho, J.; He, J.; et al. High-Performance PZT-Based Stretchable Piezoelectric Nanogenerator. ACS Sustain. Chem. Eng. 2019, 7, 979–985. [Google Scholar] [CrossRef]
- Kang, M.G.; Jung, W.S.; Kang, C.Y.; Yoon, S.J. Recent Progress on PZT Based Piezoelectric Energy Harvesting Technologies. Actuators 2016, 5, 5. [Google Scholar] [CrossRef]
- Zhang, S.; Lin, X.; Liu, H.; Yuan, Z.; Huan, Y.; Yuan, X.; Huang, S.; Cheng, X. High-Performance Flexible Piezoelectric Nanogenerator Based on Necklace-like PZT Particle Chains. Int. J. Energy Res. 2021, 45, 6213–6226. [Google Scholar] [CrossRef]
- Kim, E.J.; Lee, T.G.; Kim, D.S.; Kim, S.W.; Yee, Y.J.; Han, S.H.; Kang, H.W.; Nahm, S. Textured Pb(Zr,Ti)O3-Pb[(Zn,Ni)1/3Nb2/3]O3 Multilayer Ceramics and Their Application to Piezoelectric Actuators. Appl. Mater. Today 2020, 20, 100695. [Google Scholar] [CrossRef]
- Chen, B.; Li, H.; Tian, W.; Zhou, C. PZT Based Piezoelectric Sensor for Structural Monitoring. J. Electron. Mater. 2019, 48, 2916–2923. [Google Scholar] [CrossRef]
- Wang, H.S.; Hong, S.K.; Han, J.H.; Jung, Y.H.; Jeong, H.K.; Im, T.H.; Jeong, C.K.; Lee, B.-Y.; Kim, G.; Yoo, C.D.; et al. Biomimetic and Flexible Piezoelectric Mobile Acoustic Sensors with Multiresonant Ultrathin Structures for Machine Learning Biometrics. Sci. Adv. 2021, 7, 7. [Google Scholar] [CrossRef] [PubMed]
- Koruza, J.; Bell, A.J.; Frömling, T.; Webber, K.G.; Wang, K.; Rödel, J. Requirements for the Transfer of Lead-Free Piezoceramics into Application. J. Mater. 2018, 4, 13–26. [Google Scholar] [CrossRef]
- Chen, X.; Sun, J.; Guo, B.; Wang, Y.; Yu, S.; Wang, W.; Bai, J. Effect of the Particle Size on the Performance of BaTiO3 Piezoelectric Ceramics Produced by Additive Manufacturing. Ceram. Int. 2022, 48, 1285–1292. [Google Scholar] [CrossRef]
- Jiang, J.; Tu, S.; Fu, R.; Li, J.; Hu, F.; Yan, B.; Gu, Y.; Chen, S. Flexible Piezoelectric Pressure Tactile Sensor Based on Electrospun BaTiO3/Poly(Vinylidene Fluoride) Nanocomposite Membrane. ACS Appl Mater Interfaces 2020, 12, 33989–33998. [Google Scholar] [CrossRef] [PubMed]
- Gao, J.; Xue, D.; Liu, W.; Zhou, C.; Ren, X. Recent Progress on BaTiO3-Based Piezoelectric Ceramics for Actuator Applications. Actuators 2017, 6, 24. [Google Scholar] [CrossRef] [Green Version]
- Branzi, L.; Back, M.; Cortelletti, P.; Pinna, N.; Benedetti, A.; Speghini, A. Sodium Niobate Based Hierarchical 3D Perovskite Nanoparticle Clusters. Dalton Trans. 2020, 49, 15195–15203. [Google Scholar] [CrossRef] [PubMed]
- Ji, S.; Liu, H.; Sang, Y.; Liu, W.; Yu, G.; Leng, Y. Synthesis, Structure, and Piezoelectric Properties of Ferroelectric and Antiferroelectric NaNbO3 Nanostructures. CrystEngComm 2014, 16, 7598–7604. [Google Scholar] [CrossRef]
- Jung, J.H.; Lee, M.; Hong, J.; Ding, Y.; Chen, C.Y.; Chou, L.J.; Wang, Z.L. Lead-Free NaNbO3 Nanowires for a High Output Piezoelectric Nanogenerator. ACS Nano 2011, 5, 10041–10046. [Google Scholar] [CrossRef]
- Xu, M.; Kang, H.; Guan, L.; Li, H.; Zhang, M. Facile Fabrication of a Flexible LiNbO3 Piezoelectric Sensor through Hot Pressing for Biomechanical Monitoring. ACS Appl. Mater. Interfaces 2017, 9, 34687–34695. [Google Scholar] [CrossRef]
- Clementi, G.; Lombardi, G.; Margueron, S.; Suarez, M.A.; Lebrasseur, E.; Ballandras, S.; Imbaud, J.; Lardet-Vieudrin, F.; Gauthier-Manuel, L.; Dulmet, B.; et al. LiNbO3 Films—A Low-Cost Alternative Lead-Free Piezoelectric Material for Vibrational Energy Harvesters. Mech. Syst. Signal Process. 2021, 149, 107171. [Google Scholar] [CrossRef]
- Kil Yun, B.; Keun Park, Y.; Lee, M.; Lee, N.; Jo, W.; Lee, S.; Hoon Jung, J. Lead-Free LiNbO3 Nanowire-Based Nanocomposite for Piezoelectric Power Generation. Nanoscale Res. Lett. 2014, 9, 4. [Google Scholar]
- Ge, Q.; Liu, C.; Zhao, Y.; Wang, N.; Zhang, X.; Feng, C.; Zhang, S.; Wang, H.; Jiang, W.; Liu, S.; et al. Phase Evolution in Preparing ZnSnO3 Powders by Precipitation Method. Appl. Phys. A 2021, 127, 89. [Google Scholar] [CrossRef]
- Inaguma, Y.; Yoshida, M.; Katsumata, T. A Polar Oxide ZnSnO3 with a LiNbO3-Type Structure. J. Am. Chem. Soc. 2008, 130, 6704–6705. [Google Scholar] [CrossRef]
- Jong, Y.S.; Lee, G.; Jo, M.H.; Kim, H.; Jang, H.M.; Shin, Y.H. Heteroepitaxial Ferroelectric ZnSnO3 Thin Film. J. Am. Chem. Soc. 2009, 131, 8386–8387. [Google Scholar] [CrossRef]
- Wang, Y.C.; Wu, J.M. Effect of Controlled Oxygen Vacancy on H2-Production through the Piezocatalysis and Piezophototronics of Ferroelectric R3C ZnSnO3 Nanowires. Adv. Funct. Mater. 2020, 30, 1907619. [Google Scholar] [CrossRef]
- Datta, A.; Mukherjee, D.; Kons, C.; Witanachchi, S.; Mukherjee, P. Evidence of Superior Ferroelectricity in Structurally Welded ZnSnO3 Nanowire Arrays. Small 2014, 10, 4093–4099. [Google Scholar] [CrossRef]
- Cao, Y.; Jia, D.; Zhou, J.; Sun, Y. Simple Solid-State Chemical Synthesis of ZnSnO3 Nanocubes and Their Application as Gas Sensors. Eur. J. Inorg. Chem. 2009, 2009, 4105–4109. [Google Scholar] [CrossRef]
- Song, P.; Wang, Q.; Yang, Z. Biomorphic Synthesis of ZnSnO3 Hollow Fibers for Gas Sensing Application. Sens. Actuators B Chem. 2011, 156, 983–989. [Google Scholar] [CrossRef]
- Para, T.A.; Reshi, H.A.; Shelke, V. Synthesis of ZnSnO3 Nanostructure by Sol Gel Method. AIP Conf. Proc. 2016, 1731, 050002. [Google Scholar]
- Paria, S.; Karan, S.K.; Bera, R.; Das, A.K.; Maitra, A.; Khatua, B.B. A Facile Approach to Develop a Highly Stretchable PVC/ZnSnO3 Piezoelectric Nanogenerator with High Output Power Generation for Powering Portable Electronic Devices. Ind. Eng. Chem. Res. 2016, 55, 10671–10680. [Google Scholar] [CrossRef]
- Lee, K.Y.; Kim, D.; Lee, J.H.; Kim, T.Y.; Gupta, M.K.; Kim, S.W. Unidirectional High-Power Generation via Stress-Induced Dipole Alignment from ZnSnO3 Nanocubes/Polymer Hybrid Piezoelectric Nanogenerator. Adv. Funct. Mater. 2014, 24, 37–43. [Google Scholar] [CrossRef]
- Ul Haq, M.; Zhang, Z.; Chen, X.; Rahman, N.; Khan, S.; Khatoon, R.; Hassan, S.S.; Ye, Z.; Zhu, L. A Two-Step Synthesis of Microsphere-Decorated Fibers Based on NiO/ZnSnO3 Composites towards Superior Ethanol Sensitivity Performance. J. Alloys Compd. 2019, 777, 73–83. [Google Scholar] [CrossRef]
- Chen, Q.; Wang, Y.; Wang, M.; Ma, S.; Wang, P.; Zhang, G.; Chen, W.; Jiao, H.; Liu, L.; Xu, X. Enhanced Acetone Sensor Based on Au Functionalized In-Doped ZnSnO3 Nanofibers Synthesized by Electrospinning Method. J. Colloid Interface Sci. 2019, 543, 285–299. [Google Scholar] [CrossRef] [PubMed]
- Sasmal, A.; Medda, S.K.; Devi, P.S.; Sen, S. Nano-ZnO Decorated ZnSnO3 as Efficient Fillers in PVDF Matrixes: Toward Simultaneous Enhancement of Energy Storage Density and Efficiency and Improved Energy Harvesting Activity. Nanoscale 2020, 12, 20908–20921. [Google Scholar] [CrossRef]
- Guo, R.; Guo, Y.; Duan, H.; Li, H.; Liu, H. Synthesis of Orthorhombic Perovskite-Type ZnSnO3 Single-Crystal Nanoplates and Their Application in Energy Harvesting. ACS Appl. Mater. Interfaces 2017, 9, 8271–8279. [Google Scholar] [CrossRef]
- Wang, G.; Xi, Y.; Xuan, H.; Liu, R.; Chen, X.; Cheng, L. Hybrid Nanogenerators Based on Triboelectrification of a Dielectric Composite Made of Lead-Free ZnSnO3 Nanocubes. Nano Energy 2015, 18, 28–36. [Google Scholar] [CrossRef]
- Kovacheva, D.; Petrov, K. Preparation of Crystalline ZnSnO from Li SnO by Low-3 2 3 Temperature Ion Exchange. Solid State Ion 1998, 109, 327–332. [Google Scholar] [CrossRef]
- Kholkin, A.L.; Pertsev, N.A.; Goltsev, A.V. Piezoelectricity and Crystal Symmetry; Springer: Boston, MA, USA, 2008. [Google Scholar]
- Park, D.-S.; Hadad, M.; Riemer, L.M.; Ignatans, R.; Spirito, D.; Esposito, V.; Tileli, V.; Gauquelin, N.; Chezganov, D.; Jannis, D.; et al. Induced Giant Piezoelectricity in Centrosymmetric Oxides. Science 2022, 375, 653–657. [Google Scholar] [CrossRef]
- Yang, M.M.; Luo, Z.D.; Mi, Z.; Zhao, J.; Alexe, M. Piezoelectric and Pyroelectric Effects Induced by Interface Polar Symmetry. Nature 2020, 584, 377–381. [Google Scholar] [CrossRef] [PubMed]
- Lu, J.; Xie, Y.; Luo, F.; Fu, H.; Huang, X.; Liu, Y.; Liu, H. Heterostructures of Mesoporous Hollow Zn2SnO4/SnO2 Microboxes for High-Performance Acetone Sensors. J. Alloys Compd. 2020, 844, 155788. [Google Scholar] [CrossRef]
- Wang, K.; Liu, D.; Deng, P.; Liu, L.; Lu, S.; Sun, Z.; Ma, Y.; Wang, Y.; Li, M.; Xia, B.Y.; et al. Band Alignment in Zn2SnO4/SnO2 Heterostructure Enabling Efficient CO2 Electrochemical Reduction. Nano Energy 2019, 64, 103954. [Google Scholar] [CrossRef]
- Zhang, R.; Ma, S.Y.; Zhang, Q.X.; Zhu, K.M.; Tie, Y.; Pei, S.T.; Wang, B.J.; Zhang, J.L. Highly Sensitive Formaldehyde Gas Sensors Based on Ag Doped Zn2SnO4/SnO2 Hollow Nanospheres. Mater. Lett. 2019, 254, 178–181. [Google Scholar] [CrossRef]
- Sunagawa, I. Crystals: Growth, Morphology, and Perfection; Cambridge University Press: Cambridge, UK, 2005. [Google Scholar]
- Cölfen, H.; Antonietti, M. Mesocrystal and Non-Classical Crystallization; John Wiley & Sons: Hoboken, NJ, USA, 2008. [Google Scholar]
- Lee, J.; Lee, S.C.; Hwang, C.S.; Choi, J.H. Thermodynamic Stability of Various Phases of Zinc Tin Oxides from Ab Initio Calculations. J. Mater. Chem. C Mater. 2013, 1, 6364–6374. [Google Scholar] [CrossRef] [Green Version]
- Hoel, C.A.; Mason, T.O.; Gaillard, J.F.; Poeppelmeier, K.R. Transparent Conducting Oxides in the ZnO-In2O3-SnO2 System. Chem. Mater. 2010, 22, 3569–3579. [Google Scholar] [CrossRef]
- Hoel, C.A.; Amores, J.M.G.; Morán, E.; Álario-Franco, M.A.; Gaillard, J.F.; Poeppelmeier, K.R. High-Pressure Synthesis and Local Structure of Corundum-Type In 2-2xZnxSnxO3 (x ≤ 0.7). J. Am. Chem. Soc. 2010, 132, 16479–16487. [Google Scholar] [CrossRef]


Publisher’s Note: MDPI stays neutral with regard to jurisdictional claims in published maps and institutional affiliations. |
© 2022 by the authors. Licensee MDPI, Basel, Switzerland. This article is an open access article distributed under the terms and conditions of the Creative Commons Attribution (CC BY) license (https://creativecommons.org/licenses/by/4.0/).
Share and Cite
Redolfi-Bristol, D.; Branzi, L.; Back, M.; Riello, P.; Speghini, A.; Pinna, N.; Benedetti, A. ZnSnO3 or Zn2SnO4/SnO2 Hierarchical Material? Insight into the Formation of ZnSn(OH)6 Derived Oxides. Inorganics 2022, 10, 183. https://doi.org/10.3390/inorganics10110183
Redolfi-Bristol D, Branzi L, Back M, Riello P, Speghini A, Pinna N, Benedetti A. ZnSnO3 or Zn2SnO4/SnO2 Hierarchical Material? Insight into the Formation of ZnSn(OH)6 Derived Oxides. Inorganics. 2022; 10(11):183. https://doi.org/10.3390/inorganics10110183
Chicago/Turabian StyleRedolfi-Bristol, Davide, Lorenzo Branzi, Michele Back, Pietro Riello, Adolfo Speghini, Nicola Pinna, and Alvise Benedetti. 2022. "ZnSnO3 or Zn2SnO4/SnO2 Hierarchical Material? Insight into the Formation of ZnSn(OH)6 Derived Oxides" Inorganics 10, no. 11: 183. https://doi.org/10.3390/inorganics10110183