DEA-BSC and Diamond Performance to Support Museum Management


1
Department of Economics, Ca’ Foscari University of Venice, Cannaregio 873, 30121 Venice, Italy
2
Department of Management, Ca’ Foscari University of Venice, Cannaregio 873, 30121 Venice, Italy
*
Author to whom correspondence should be addressed.
†
These authors contributed equally to this work.
Mathematics 2020, 8(9), 1402; https://doi.org/10.3390/math8091402
Submission received: 23 July 2020
/
Revised: 7 August 2020
/
Accepted: 19 August 2020
/
Published: 21 August 2020
(This article belongs to the Special Issue Financial Mathematics II)
Abstract
:In the present paper, we propose some models for the computation of an overall indicator which measures the performance of a set of museums from a multidimensional point of view. One of the most used methodologies that provide a multiple input–multiple output performance score is Data Envelopment Analysis (DEA), which in recent years has also been applied to museums. Recently, the literature on museums performance has proposed a model that combines DEA with the Balanced Scorecard (BSC) approach, which is used in the management control of organisations and focuses on a multidimensional framework based on four different dimensions of the organisation management. In the present contribution, we propose a two-stage DEA-BSC model which adopts more plain DEA models without weight restrictions and can be better understood by museums’ managers. In addition, in order to overcome the drawback of the low discriminatory power shown by this model when applied to a few museums, we propose some alternative ways to compute the overall performance at the second stage. One indicator computes the area of a special geometric representation of the efficiency scores obtained at the first stage for the four BSC perspectives and for this reason is named diamond efficiency. Finally, the models proposed are applied to the set of municipal museums of Venice.
1. Introduction
In the present paper, we propose some quantitative models for the computation of an overall indicator that can be used to measure and compare the performance of a set of museums from a multidimensional point of view.
One of the most used methodologies that provides a performance score which take into consideration the intrinsically multidimensional nature of museums’ management is Data Envelopment Analysis (DEA). This methodology has been applied in a number of ways to museums since 2002 [1,2,3,4] and since then it has given rise to various quantitative models.
More recently, Basso, Casarin and Funari [5] have proposed a two-stage DEA-BSC model that combines Data Envelopment Analysis with another approach, called the Balanced Scorecard (BSC), which is used in the management control of profit-oriented but also nonprofit organisations. BSC provides a multidimensional framework which helps to focus on four different dimensions of the organisation management, namely the Economic-financial perspective, the Customer perspective, the Internal process perspective, and the Innovation and learning perspective. The joint use of DEA and BSC enables us to define a quantitative tool which provides a performance evaluation according to the four BSC perspectives mentioned.
Analogously to [5], the models that are proposed in the present paper consist of two stages: a first stage in which for each BSC perspective we define a specific DEA model that computes an efficiency score; and a second stage in which we compute an overall performance indicator by taking into account the DEA-BSC efficiency scores obtained at the first stage. Nevertheless, unlike [5], in order to obtain a model that is better understood by the museums’ managers, in this paper, we explore the use of plain output oriented variable return-to scale DEA models, without the inclusion of weights’ restriction constraints.
In addition, in order to overcome the drawback of the low discriminatory power shown by this model when it is applied to a set of museums with low cardinality, with a high number of museums often classified as efficient, we propose some alternatives procedures to compute the synthetic performance at the second stage. One of these alternative approaches derives from a special geometric representation of the efficiency scores obtained at the first stage for the four BSC perspectives. Actually, the BSC scores can be displayed using a four-axes radar chart giving rise to a diamond-shaped polygon and, for this reason, the indicator obtained is named diamond efficiency. The model with the diamond efficiency indicator actually succeeds in better discriminating the efficient museums also when the DEA approach provides a high number of efficient units.
In the final part of the paper, the models proposed are applied to the same set of municipal museums of Venice analysed in [5].
The remainder of the paper is structured as follows: Section 2 briefly presents the DEA and BSC methodologies and their use for museums. In Section 3, we propose the two-stage variable returns-to-scale DEA-BSC model for the assessment of the museums’ performance and discuss the super-efficiency DEA model. In Section 4, we present the diamond efficiency indicator and analyse its use in the second stage as an alternative overall efficiency measure for the two-stage DEA-BSC model. Section 5, Section 6 and Section 7 discuss the data and the results of the empirical application of the first and second stage models, respectively. Finally, Section 8 draws the conclusions.
2. Data Envelopment Analysis and Balanced Scorecard for Museums
In recent years, the Data Envelopment Analysis methodology has also been employed to measure the performance of museums, in addition to other types of cultural institutions.
Different DEA models are proposed in several papers to study museums’ performance; in particular, Pignataro [2] and Basso and Funari [3,4] undertake an empirical analysis on a set of Italian museums; Mairesse and Vanden Eeckaut [1] analyse a group of museums from the French speaking region of Belgium; Del Barrio, Herrero and Sanz [6] and Del Barrio and Herrero [7] present an application to a regional system of Spanish museums; Carvalho, Silva Costa and Carvalho [8] consider a set of Portuguese museums; Taheri and Ansari [9] examine a set of museums in Tehran. More recently, Basso, Casarin and Funari [5] analyse the performance of a set of Venetian museums with a two-stage model that combines the DEA and BSC approaches and imposes weights restrictions; Del Barrio Tellado and Herrero Prieto [10] apply a two-stage DEA SBM network model to a set of Spanish state-run museums; Guccio et al. [11] employ a generalised conditional efficiency model, derived from the Free Disposal Hull (FDH) model, to assess the efficiency of Italian museums while Basso and Funari [12] measure the museum’s performance with a model that combines DEA and BSC with the Analytic Hierarchy Process (AHP) methodology, often used to support decision-making.
Similarly to [5], in the present contribution, we adopt a two-stage model that combines DEA and BSC. However, unlike what is proposed in [5], in the following, we will adopt more plain DEA models, whose functioning can be better understood by museums’ managers, rarely experts in quantitative methods.
Let be a set of museums under investigation. Moreover, let us suppose that each museum utilises m inputs and produces t outputs; let represent the amount of input i () used by museum j and represent the amount of output r () produced by museum j.
The efficiency score associated with a given museum can be computed by solving the following linear programming problem:
subject to
where , , , and are the variables of the DEA optimisation problem (for an introduction to DEA models, see, for example, [13]). The efficiency score is computed as the reciprocal of the optimal value of . By construction, we have , with the maximum value 1 reached by the so-called efficient museums. Problems (1)–(2) represent the dual form of a general output oriented variable returns-to-scale (VRS) DEA model (see, for example, [13]).
The choice of an output oriented VRS model seems natural for museums since it avoids imposing constancy of scale returns and we may assume that museums generally aim to increase the outputs rather than reduce the inputs.
As for the Balance Scorecard (BSC) approach, it has been originally proposed to evaluate profit-oriented organisations (see [14]), but it has recently also been applied to museums, which are usually nonprofit organisations.
Actually, a few papers use a Balanced Scorecard to define a conceptual scheme for the management of museums: Marcon [15] discusses a framework that adapts BSC to nonprofit organisations, with an emphasis on museums, Wei, Davey and Coy [16] illustrate a disclosure index based on BSC, applied to museums in New Zealand and the UK, Haldma and Lääts [17] report an application of BSC to a central museum in Estonia, Zorloni [18] analyses the use of a theoretical BSC framework focusing on a set of critical success factors for visual art museums, and Plaček, Puček and Šilhánková [19] use BSC to analyse the current state of strategic management in museums in the Czech Republic.
On the other hand, by combining BSC with DEA, Basso, Casarin and Funari [5] manage to provide an operational tool that enables one to actually measure and compare the performance of a set of museums.
An advantage of BSC is that it analyses an organisation from multiple points of view, represented by the following four perspectives:
- the Economic-Financial Perspective (or simply Financial Perspective), which considers the profitability and the ability to meet the needs of shareholders;
- the Customer Perspective, which regards the way the company should be viewed by customers in order to implement its vision;
- the Internal processes Perspective, which regards what must be done internally in an excellent way in order to satisfy the expectations of shareholders and customers;
- the Innovation and learning Perspective, which concerns the ability of the company to improve, innovate, and learn.
For a discussion on the application of BSC to museum organisations, we refer to [5].
3. A Plain Two-Stage DEA-BSC Model to Assess the Performance of a Set of Museums
In Section 2, we have mentioned that, by combining DEA with BSC, it is possible to devise a model which may succeed in utilising a BSC framework to measure the performance of a set of organisations.
In particular, with regard to museum organisations, a first DEA-BSC model is proposed in [5]. This is a two-stage model that employs output oriented VRS DEA models with restrictions on the virtual outputs. The BSC approach is translated into four DEA models, one for each BSC perspective that constitute altogether the first stage of the model. A further DEA model with a similar structure is used in the second stage in order to obtain an overall performance indicator.
In the present contribution, we propose a model which draws inspiration from [5], and is indeed another two-stage DEA-BSC model. In particular, in the first stage, we analyse the individual perspectives suggested by BSC and then, for each perspective, we identify the variables relevant for museum organisations. Then, we define a different DEA model for each perspective, in order to study the performance of the museums along each perspective.
However, unlike the model proposed in [5], in this paper, we adopt more plain DEA models, and precisely output oriented VRS models without weights restrictions, like models (1)–(2) presented in Section 2.
The model orientation is still to output, making the implicit assumption that museums will strive to maximise the outputs with the resources at hand.
Table 1 presents the input and output variables chosen for each DEA model of the first stage. These variables are focused on the main characteristics of the museum activities that are relevant for the BSC perspective to which the model refers and must be measurable. For example, the conservation and restoration costs are included as a measure of the fulfillment of the preservation of the cultural heritage and artworks for the future generations, which is one of the main goals of a museum.
However, due to the small number of museums considered in the empirical analysis carried out, we had to keep the number of input–output variables actually used low, since it is known that the number of DMUs limits the number of variables that can effectively be used in DEA models. For this reason, in the empirical investigation, we had to reduce the number of variables, selecting only the most relevant ones; the variables of the synthetic model are reported in the third column of Table 1.
Let us point out that the input variable of the model for the Innovation and learning perspective is a constant, since the outputs of these perspectives are not proportional to the museum size. From the point of view of the properties of the resulting DEA model, this feature has some interesting consequences, highlighted in [5]. Actually, the case of an output oriented BCC model with a single constant input is equivalent to an output oriented BCC model without inputs, as proved in [20].
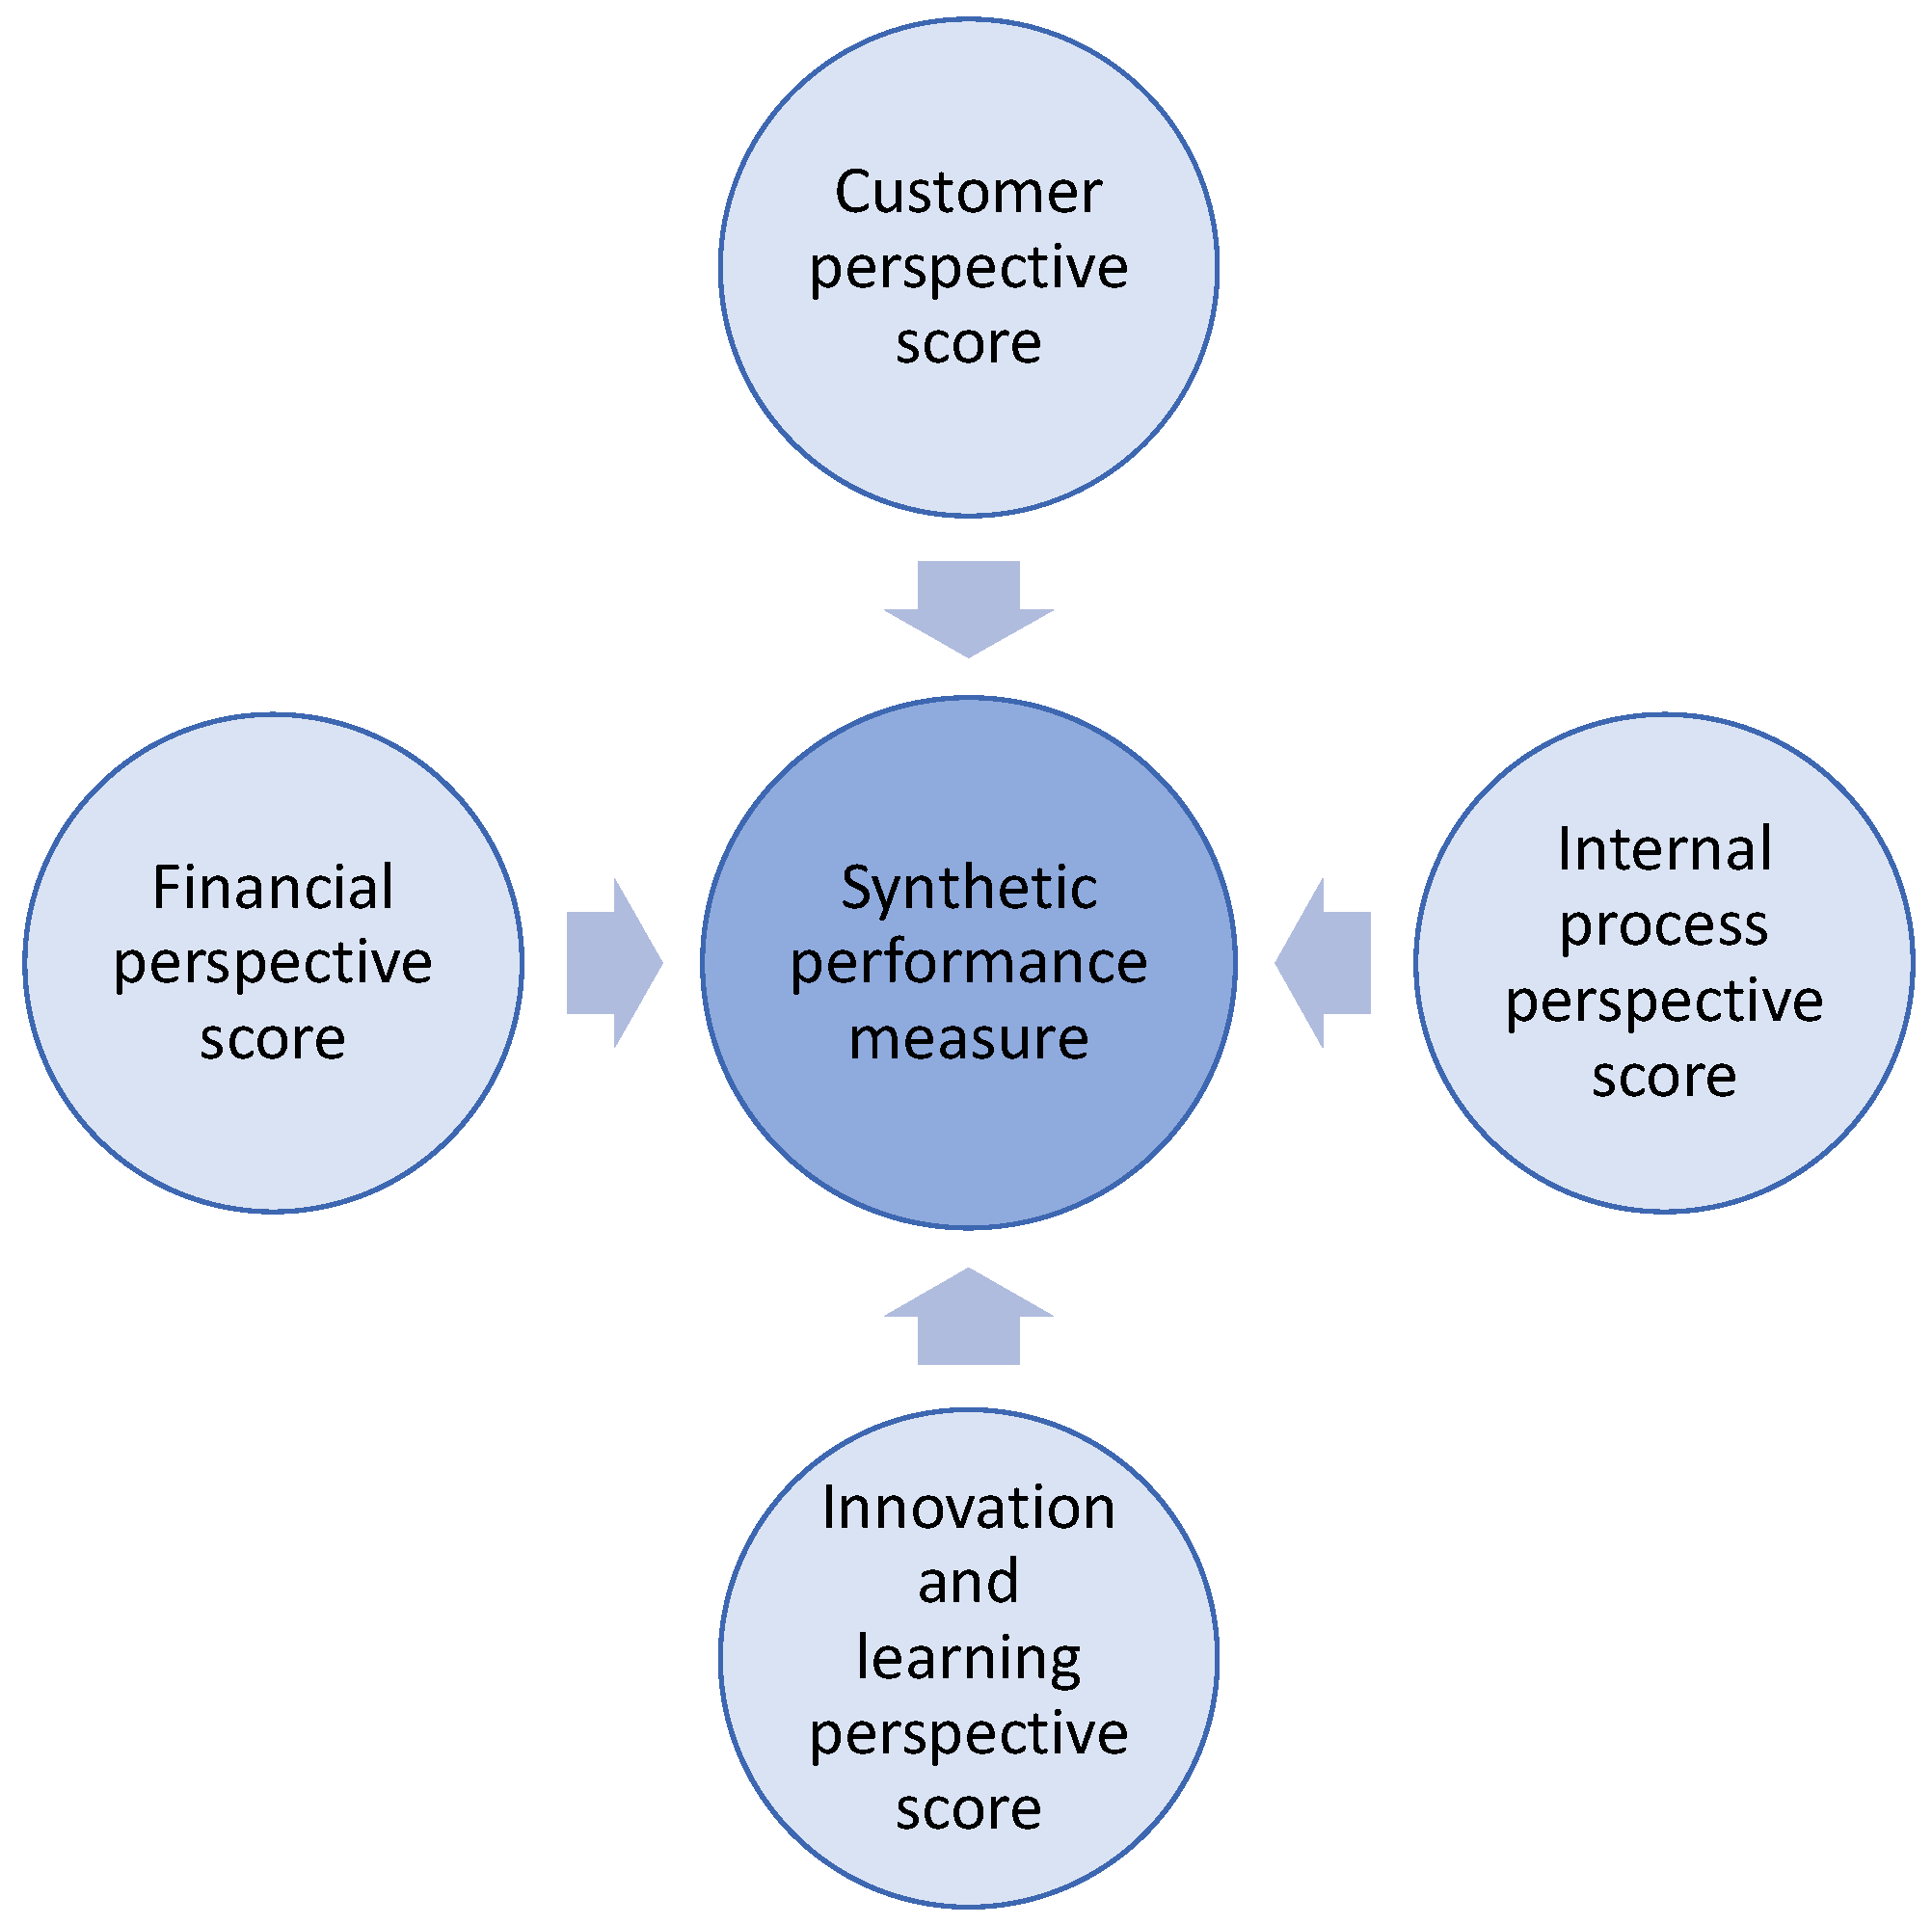
Furthermore, the second stage of the DEA-BSC model aims to synthesise the performance indicators of the single perspectives in an overall indicator. Figure 1 provides the flow chart of the whole two-stage model.
The overall indicator can be obtained with different approaches. First of all, to this aim, we can use a second stage DEA model. This is also an output oriented VRS model with a constant input, in which the output variables are given by the efficiency scores obtained by each museum in the four DEA models of stage 1, one per each perspective. The model variables used in the stage 2 model are summarised in the second column of Table 2. However, when the number of museums is small, it may be necessary to reduce the number of variables; in such a case, we chose to omit the innovation perspective score; the variables of the synthetic model are reported in the third column of Table 2.
On the other hand, given the general structure of DEA models, we may well have several efficient units for each perspective, as well as for the second stage DEA-BSC model. This is the typical case in which a basic DEA model may not be able to discriminate sufficiently between different units [21], and we may end up classifying a high percentage of museums as efficient. In these instances, super-efficiency DEA models may be used in order to discriminate among the efficient units [21]. To this aim, we may define a super-efficiency two-stage DEA-BSC model, in which the museum under evaluation is excluded from the reference set, which can be written in an output oriented dual form as follows:
subject to
The “super-efficiency” score is the reciprocal of the optimal value of and is greater than or equal to 1 for the efficient units and comprised between 0 and 1 for the inefficient ones [21].
Of course, we have to recall that super-efficiency models suffer from an inconvenient and well known drawback, namely the infeasibility problem, since, not in all cases, problems (3) and (4) are feasible (see, e.g., [22]).
In the next section, we will present two additional alternative approaches that will allow us to compute an overall performance indicator which strongly discriminates among the efficient units.
4. An Alternative Performance Indicator for the Second Stage: The Diamond Efficiency Measure
As we have seen in Section 3, when the number of museums taken into account is low, we have to resort to the synthetic model summarised in Table 2 which leaves out one of the perspectives. In such cases, it may be useful to consider additional performance measures in the overall assessment of the second stage.
A third simple indicator can simply be given by the arithmetic mean of the efficiency scores obtained by a museum for all four of the perspectives in the first stage:
where , , , and denote the efficiency scores obtained by museum o for the Customer, Internal process, Innovation, and Financial perspectives, respectively. Clearly, the mean efficiency score attributes the same importance to the efficiency/inefficiency of all perspectives obtained in the first stage.
In general, we can consider a weighted mean of the efficiency scores, if the decision maker is able to identify his subjective weights , with :
Of course, this is a linear function of the efficiency scores obtained in the first stage, so that an increase in the efficiency of the perspectives is reflected in a linear way in the mean score of the second stage.
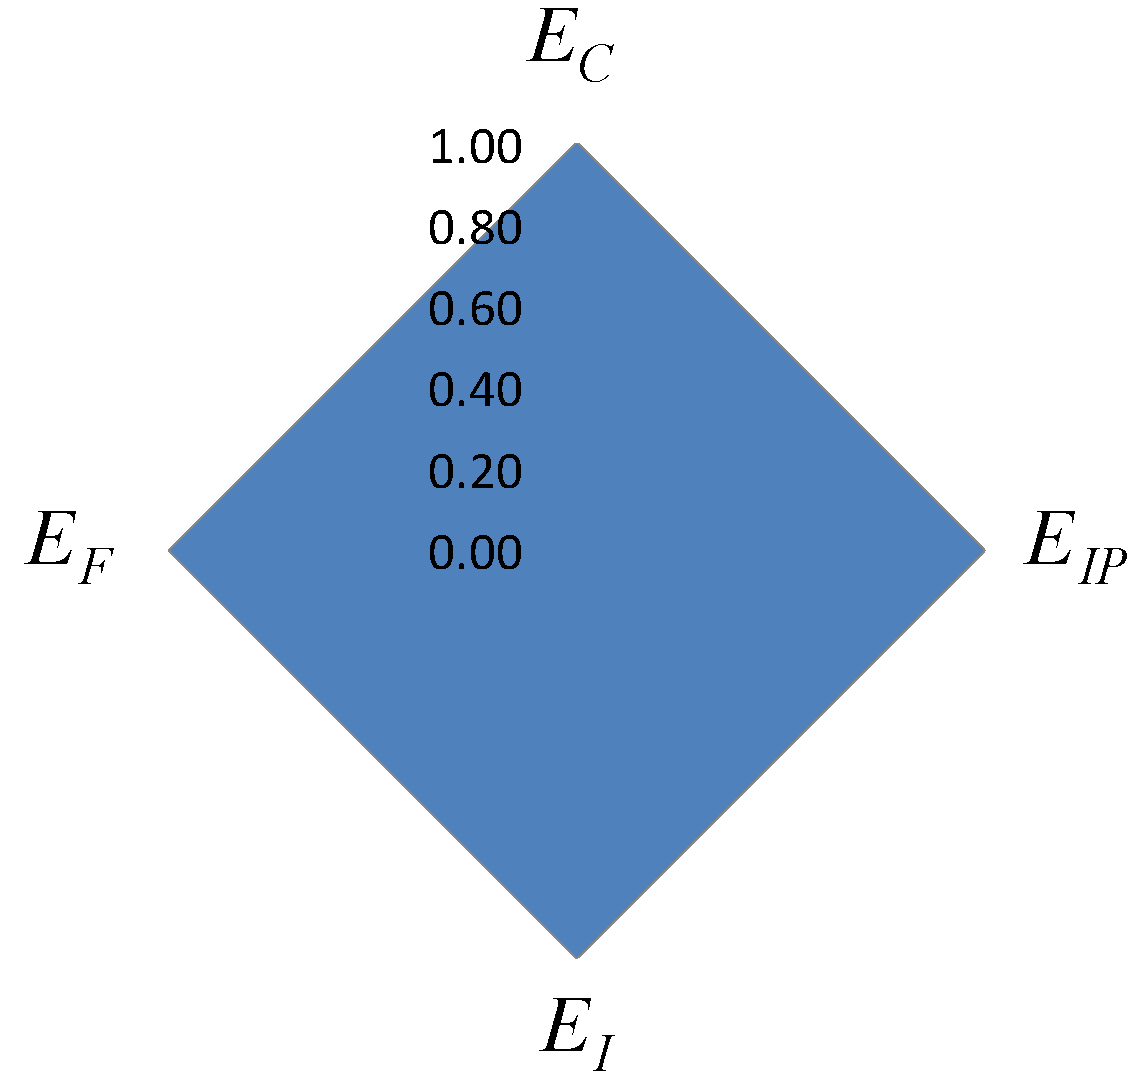
In order to introduce a less naive (and nonlinear) overall efficiency indicator, let us start from an interesting geometric representation of the performance scores obtained for the four perspectives in the first stage: a radar chart in which we represent along each of the four semiaxes the score of a different perspective; some examples are shown in Figure 2 and Figure 3. What we obtain is a diamond-shaped polygon; the biggest diamond is related to the case of a museum which is fully efficient with respect to all four of the perspectives, i.e., with (Figure 2), while the diamond “shrinks” asymmetrically when the efficiency score of a perspective decreases (Figure 3).
Obviously, in general, each museum is represented by a different diamond, and the more efficient a museum is with respect to all perspectives, the higher the area of its diamond is. From this observation, let us explore the idea to associate with every museum the area of its diamond as a possible overall efficiency measure which could be easily communicated to the museum management.
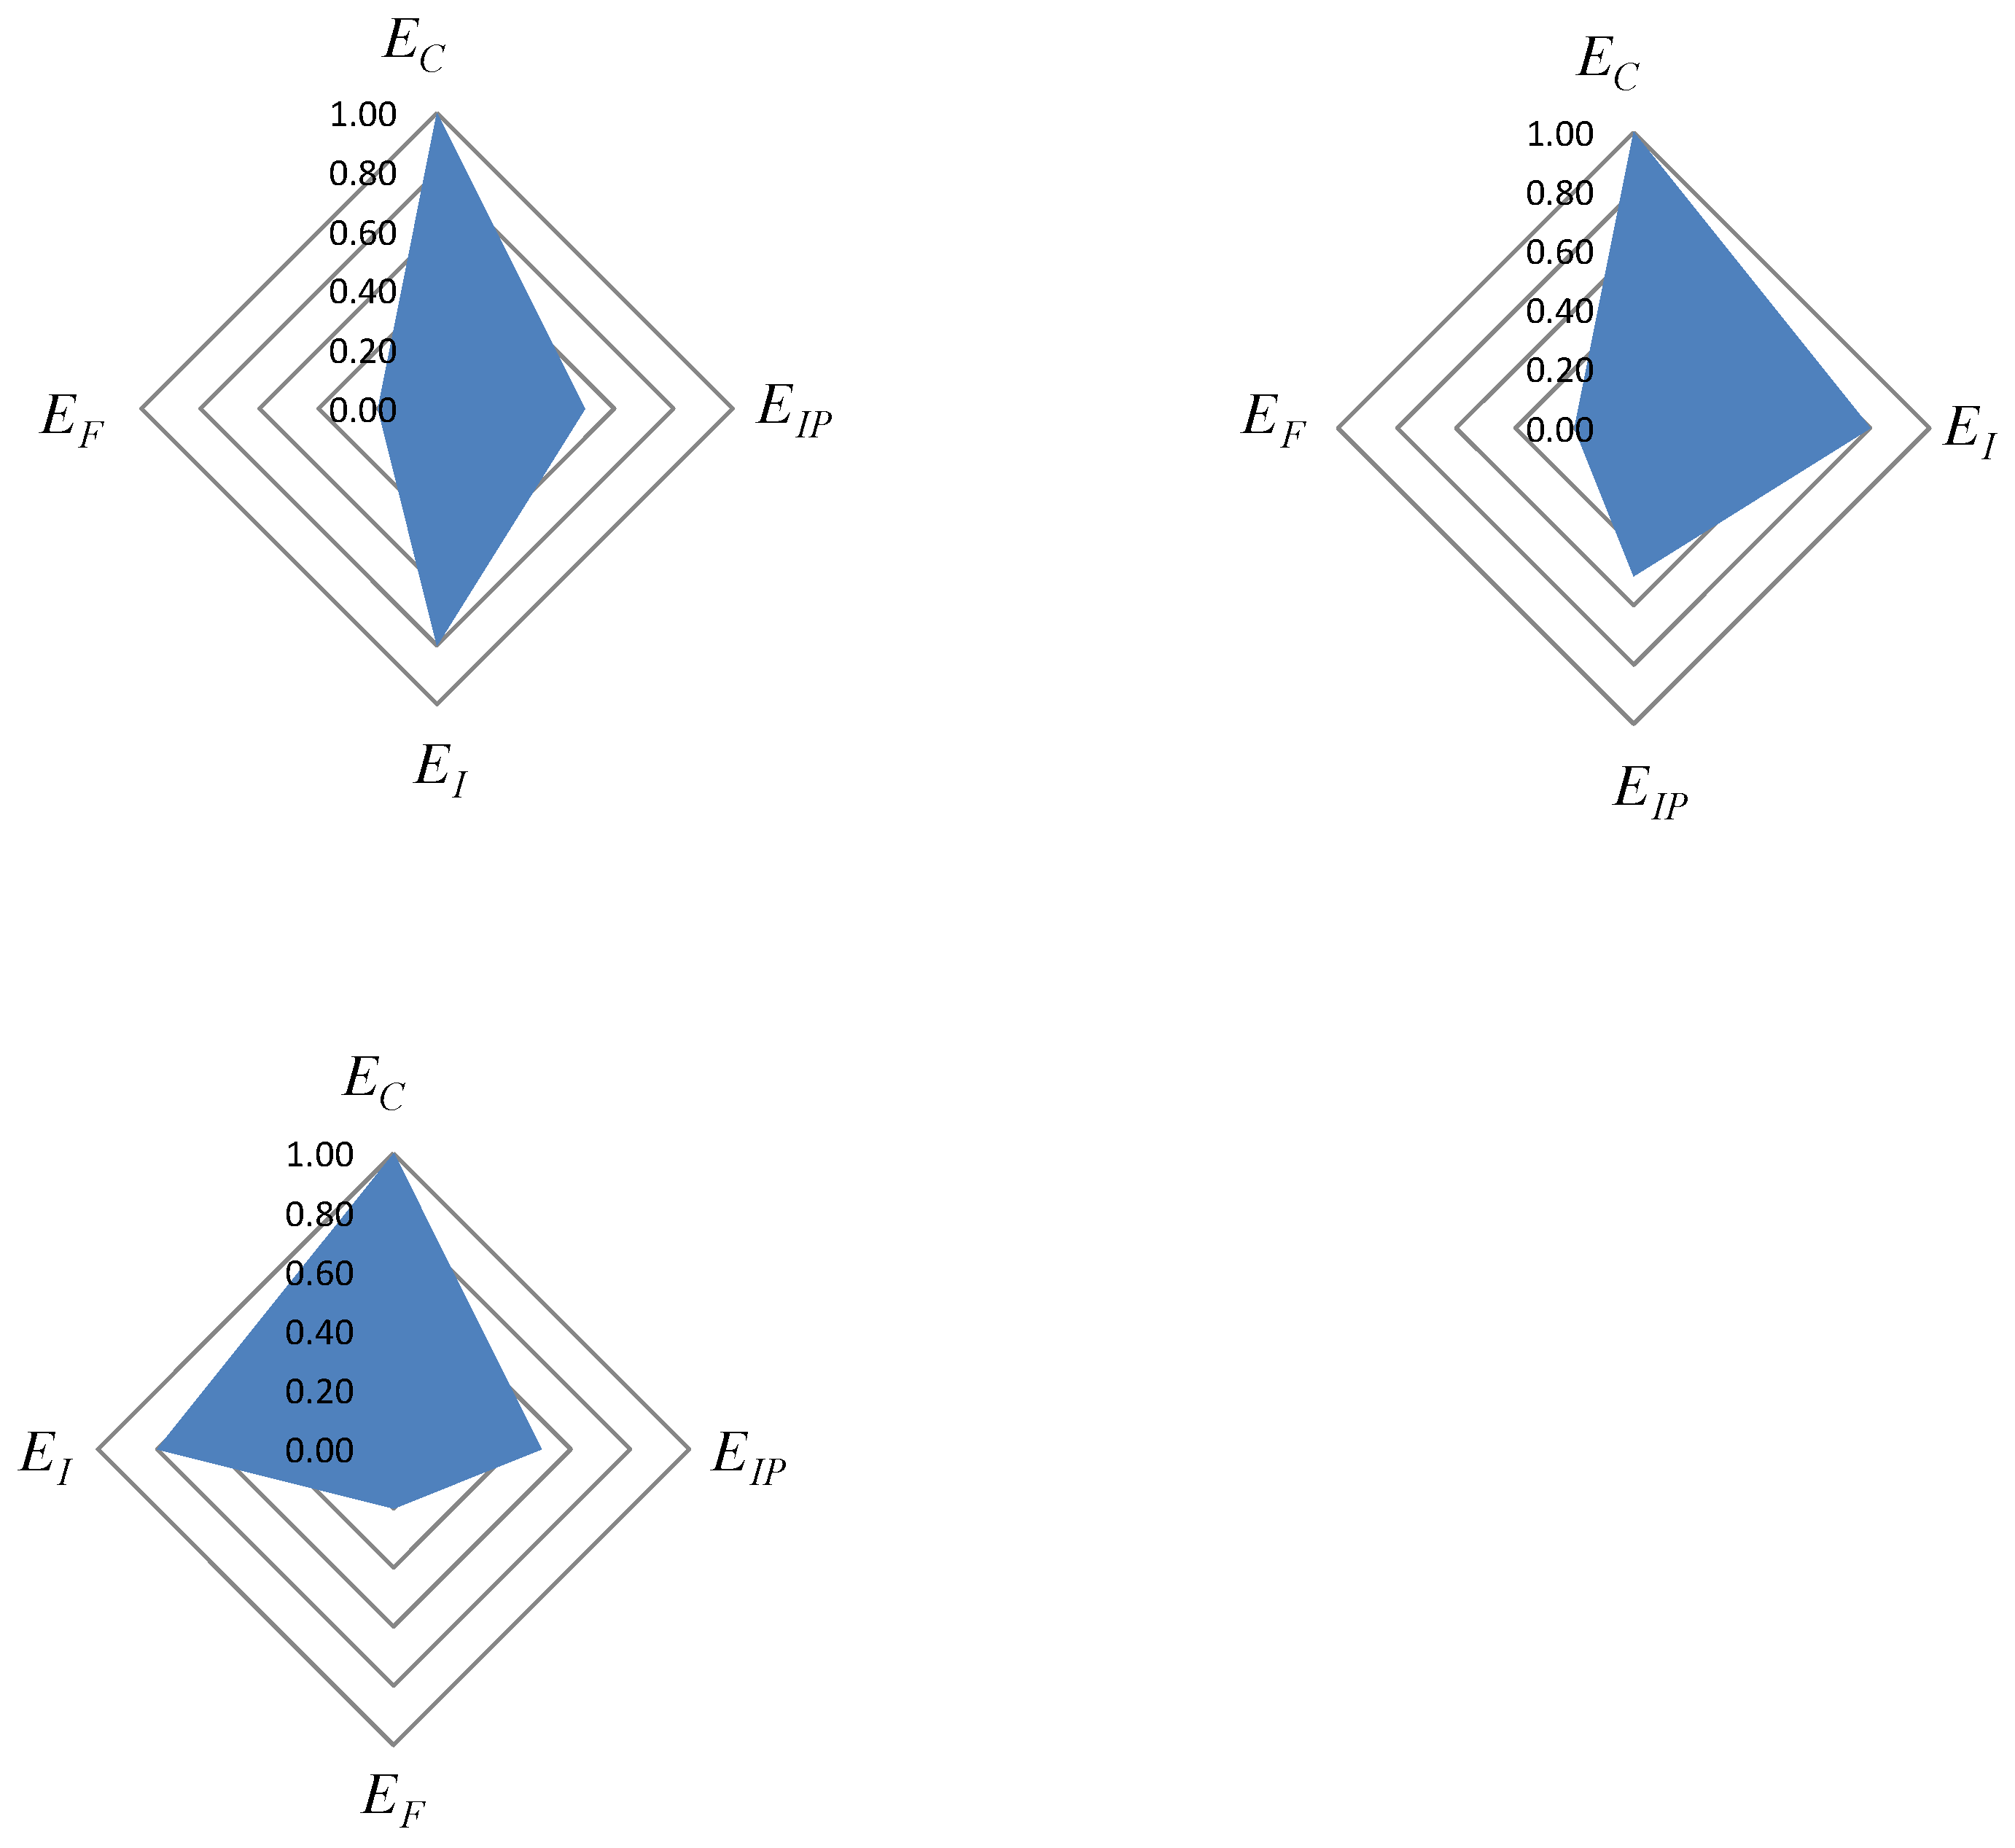
However, the “diamond” representation is not univocal. Indeed, there are 24 different radar representations, depending on which perspective is associated with each semiaxis; their number is equal to the number of permutations () of the four performance scores , , , ; see Figure 3 for three diamonds representing the same museum with , , , .
As for the area of the 24 diamonds that can be used to represent the perspectives performance scores of a museum, we can identify three equivalence classes, each including eight diamonds with the same area. Table 3 shows the equivalence classes for the instance , , , with the related areas . Note that Figure 3 displays a representative from each class.
In order to define a suitable overall performance measure, we can compute the average value of the areas of the diamonds associated with the perspectives’ efficiency of a museum. More precisely, since it is easy to see that the maximum value obtainable for the area of each diamond is equal to 2, in order to obtain an efficiency measure with values in the interval , we propose to define the diamond efficiency measure as half the average area of the diamonds:
Since
the diamond efficiency measure for museum o can be written as
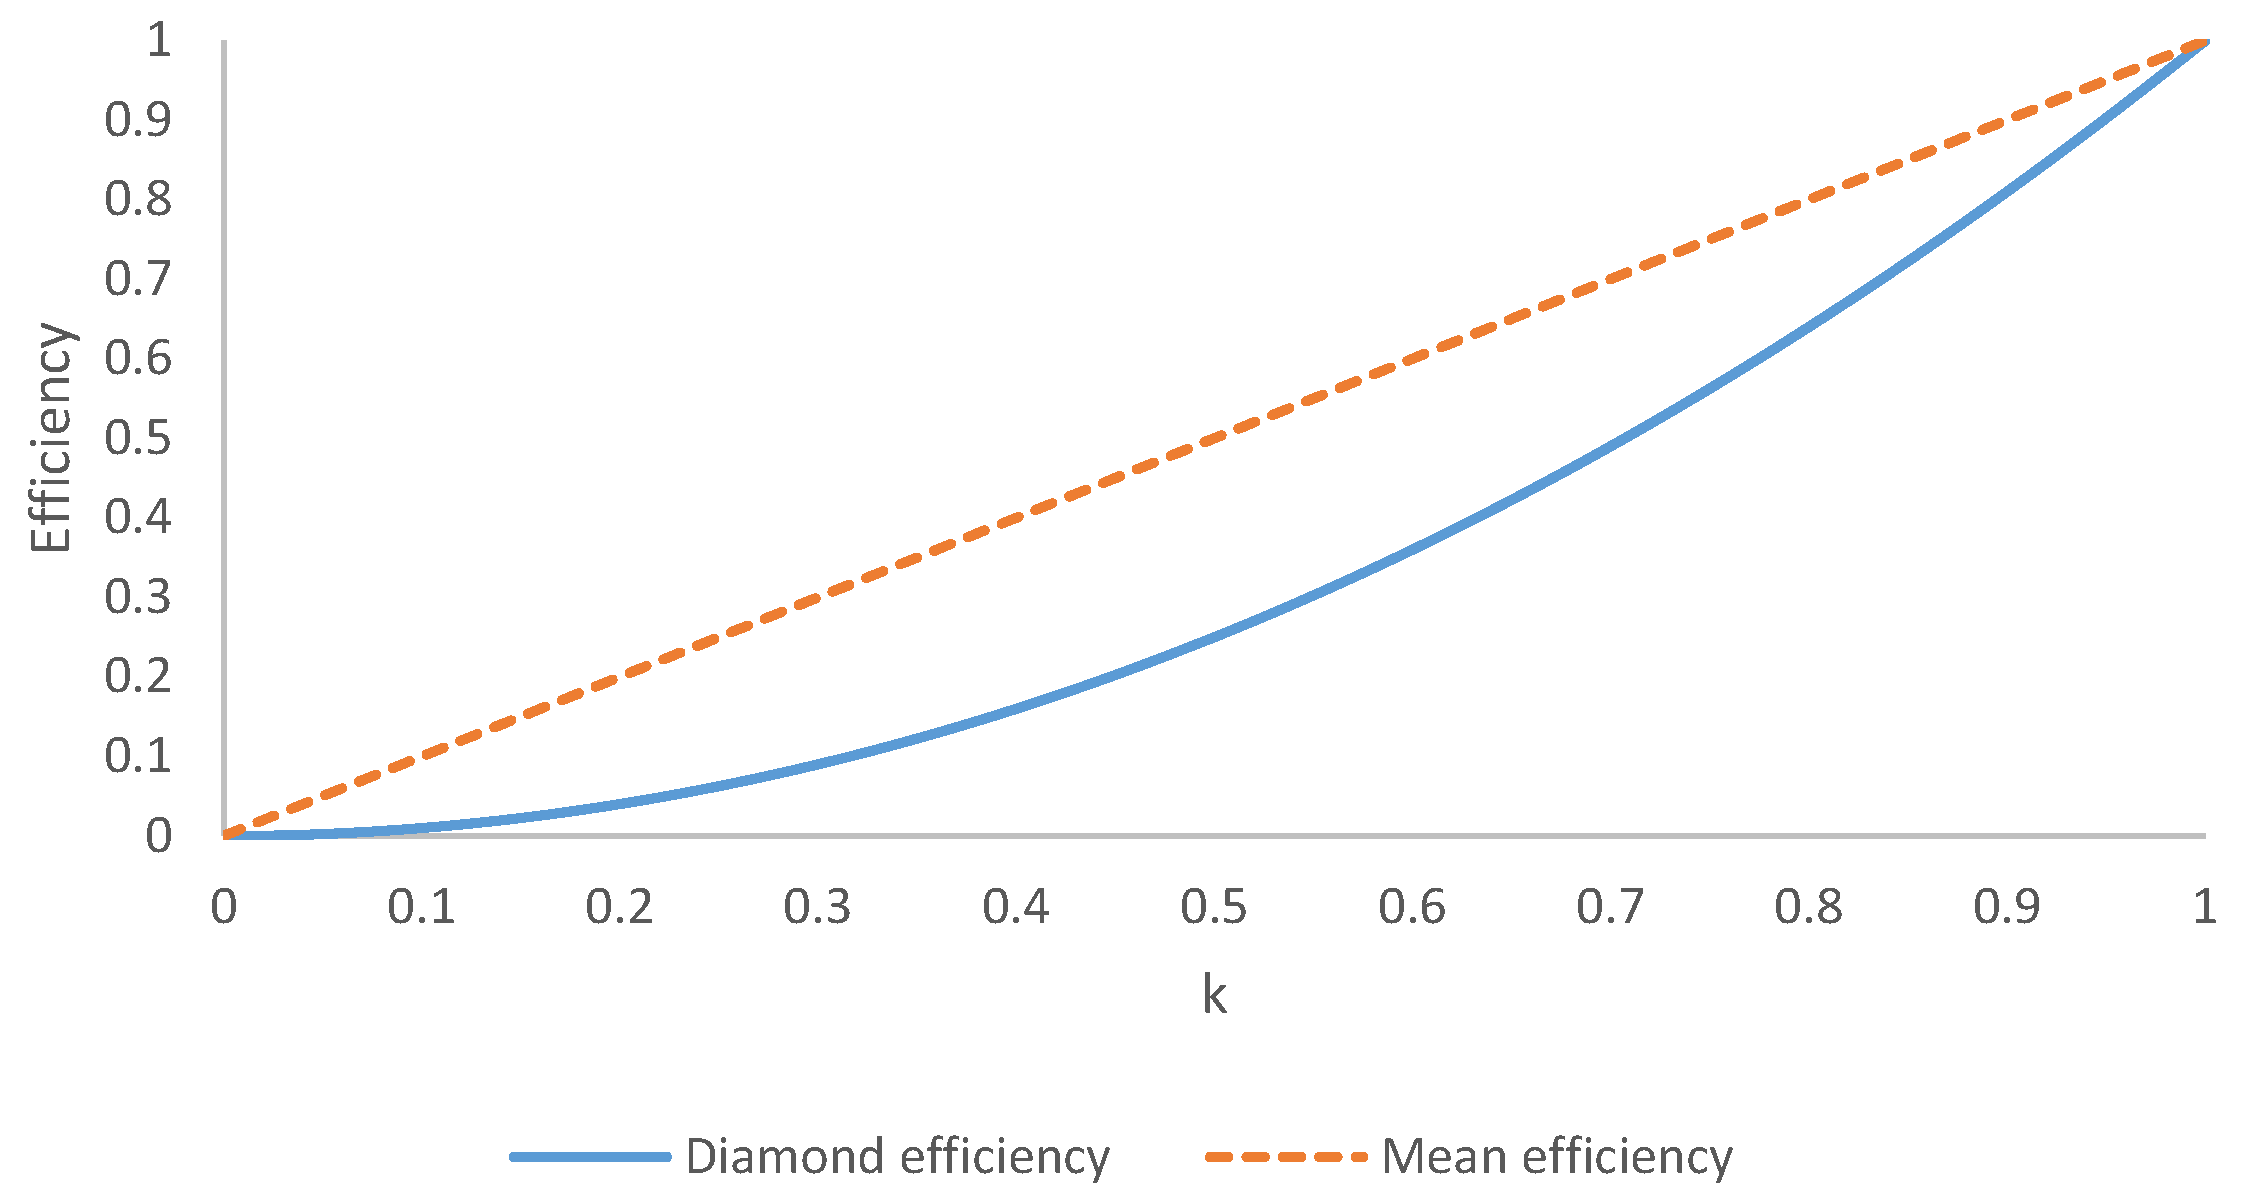
It is straightforward to see that the diamond efficiency measure is not linear, but, on the contrary, if the efficiency scores of all perspectives are multiplied by the same factor k, then the diamond efficiency score is multiplied by a square factor .
From the point of view of performance measurement, this entails that the diamond efficiency penalizes the museums that are inefficient with respect to all perspectives considerably, much more than the mean efficiency (see Figure 4).
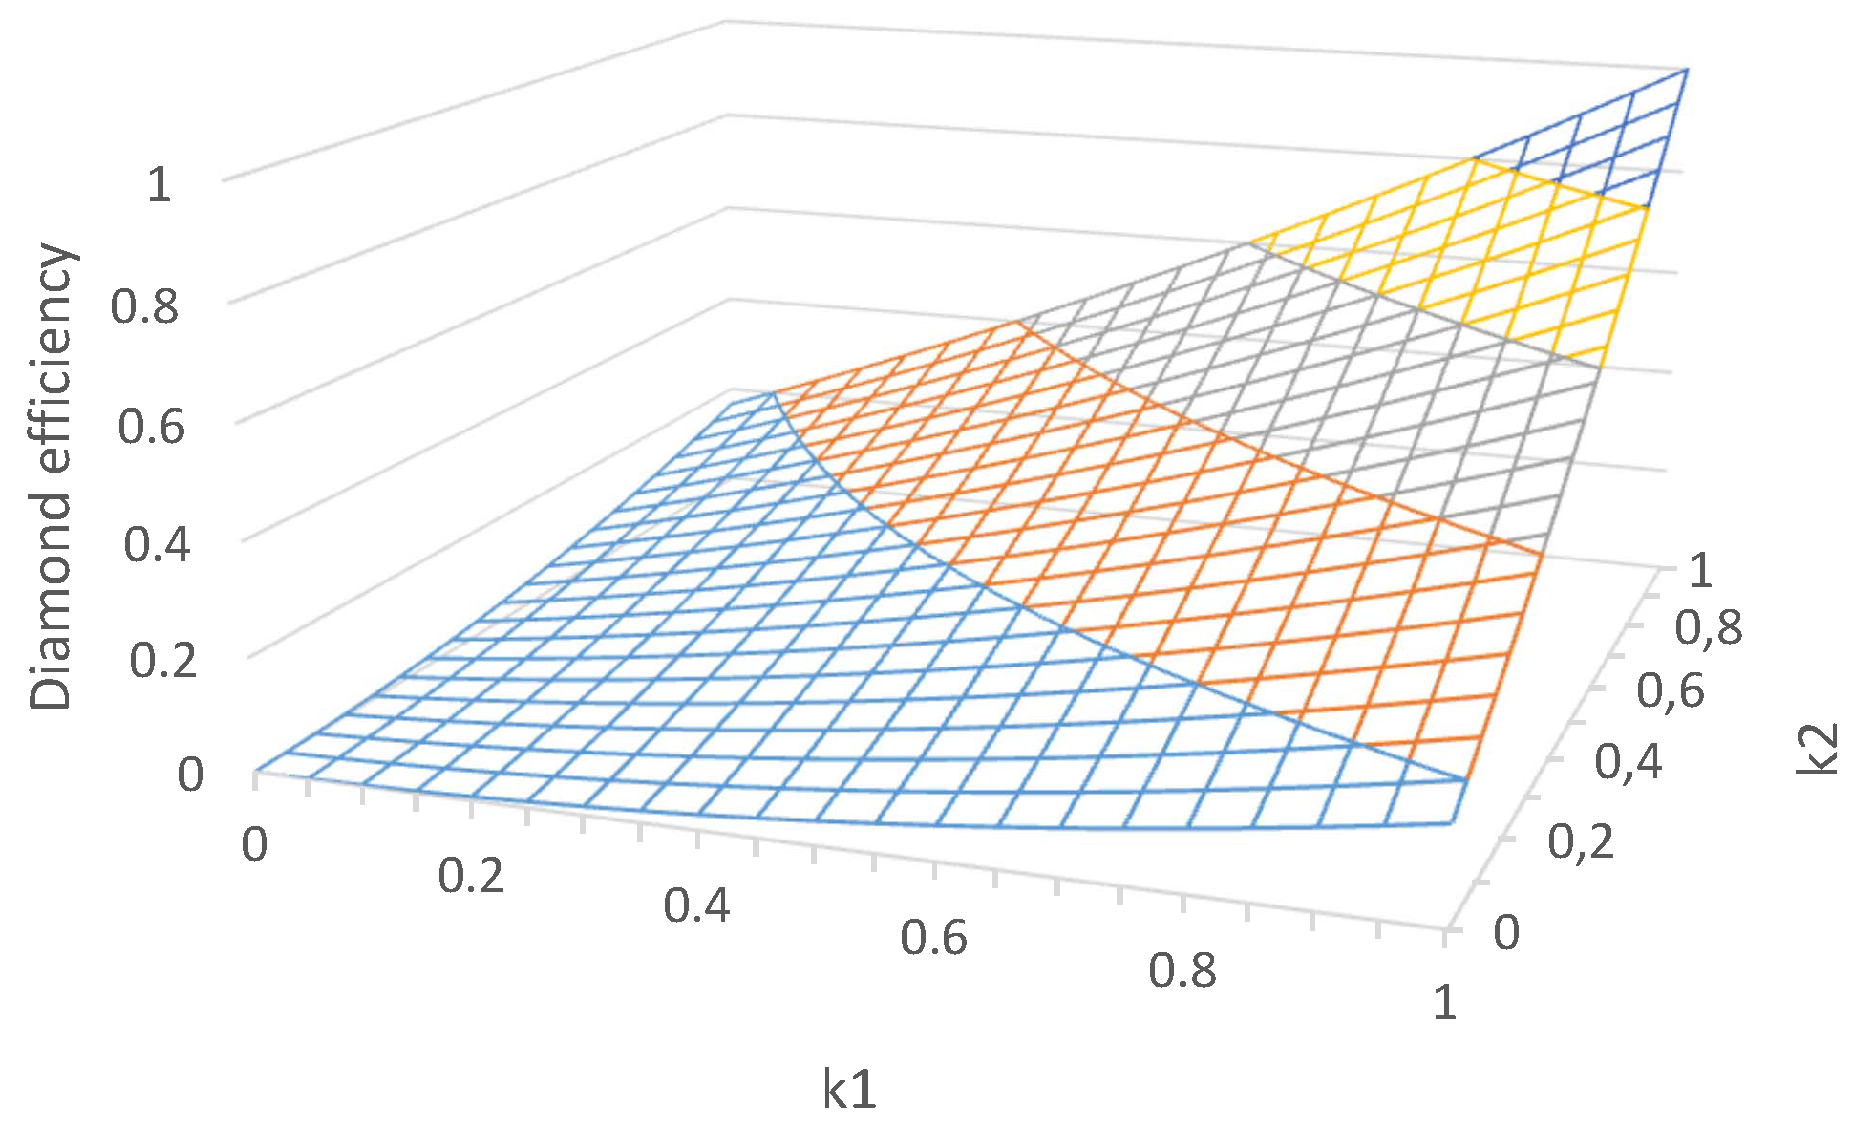
In order to visualise, in some way, the behaviour of the diamond efficiency as a function of the perspectives’ performance scores, we display in Figure 5 the behaviour in the case in which the scores of two perspectives are equal to and the scores of the other two are equal to , with and varying in the interval .
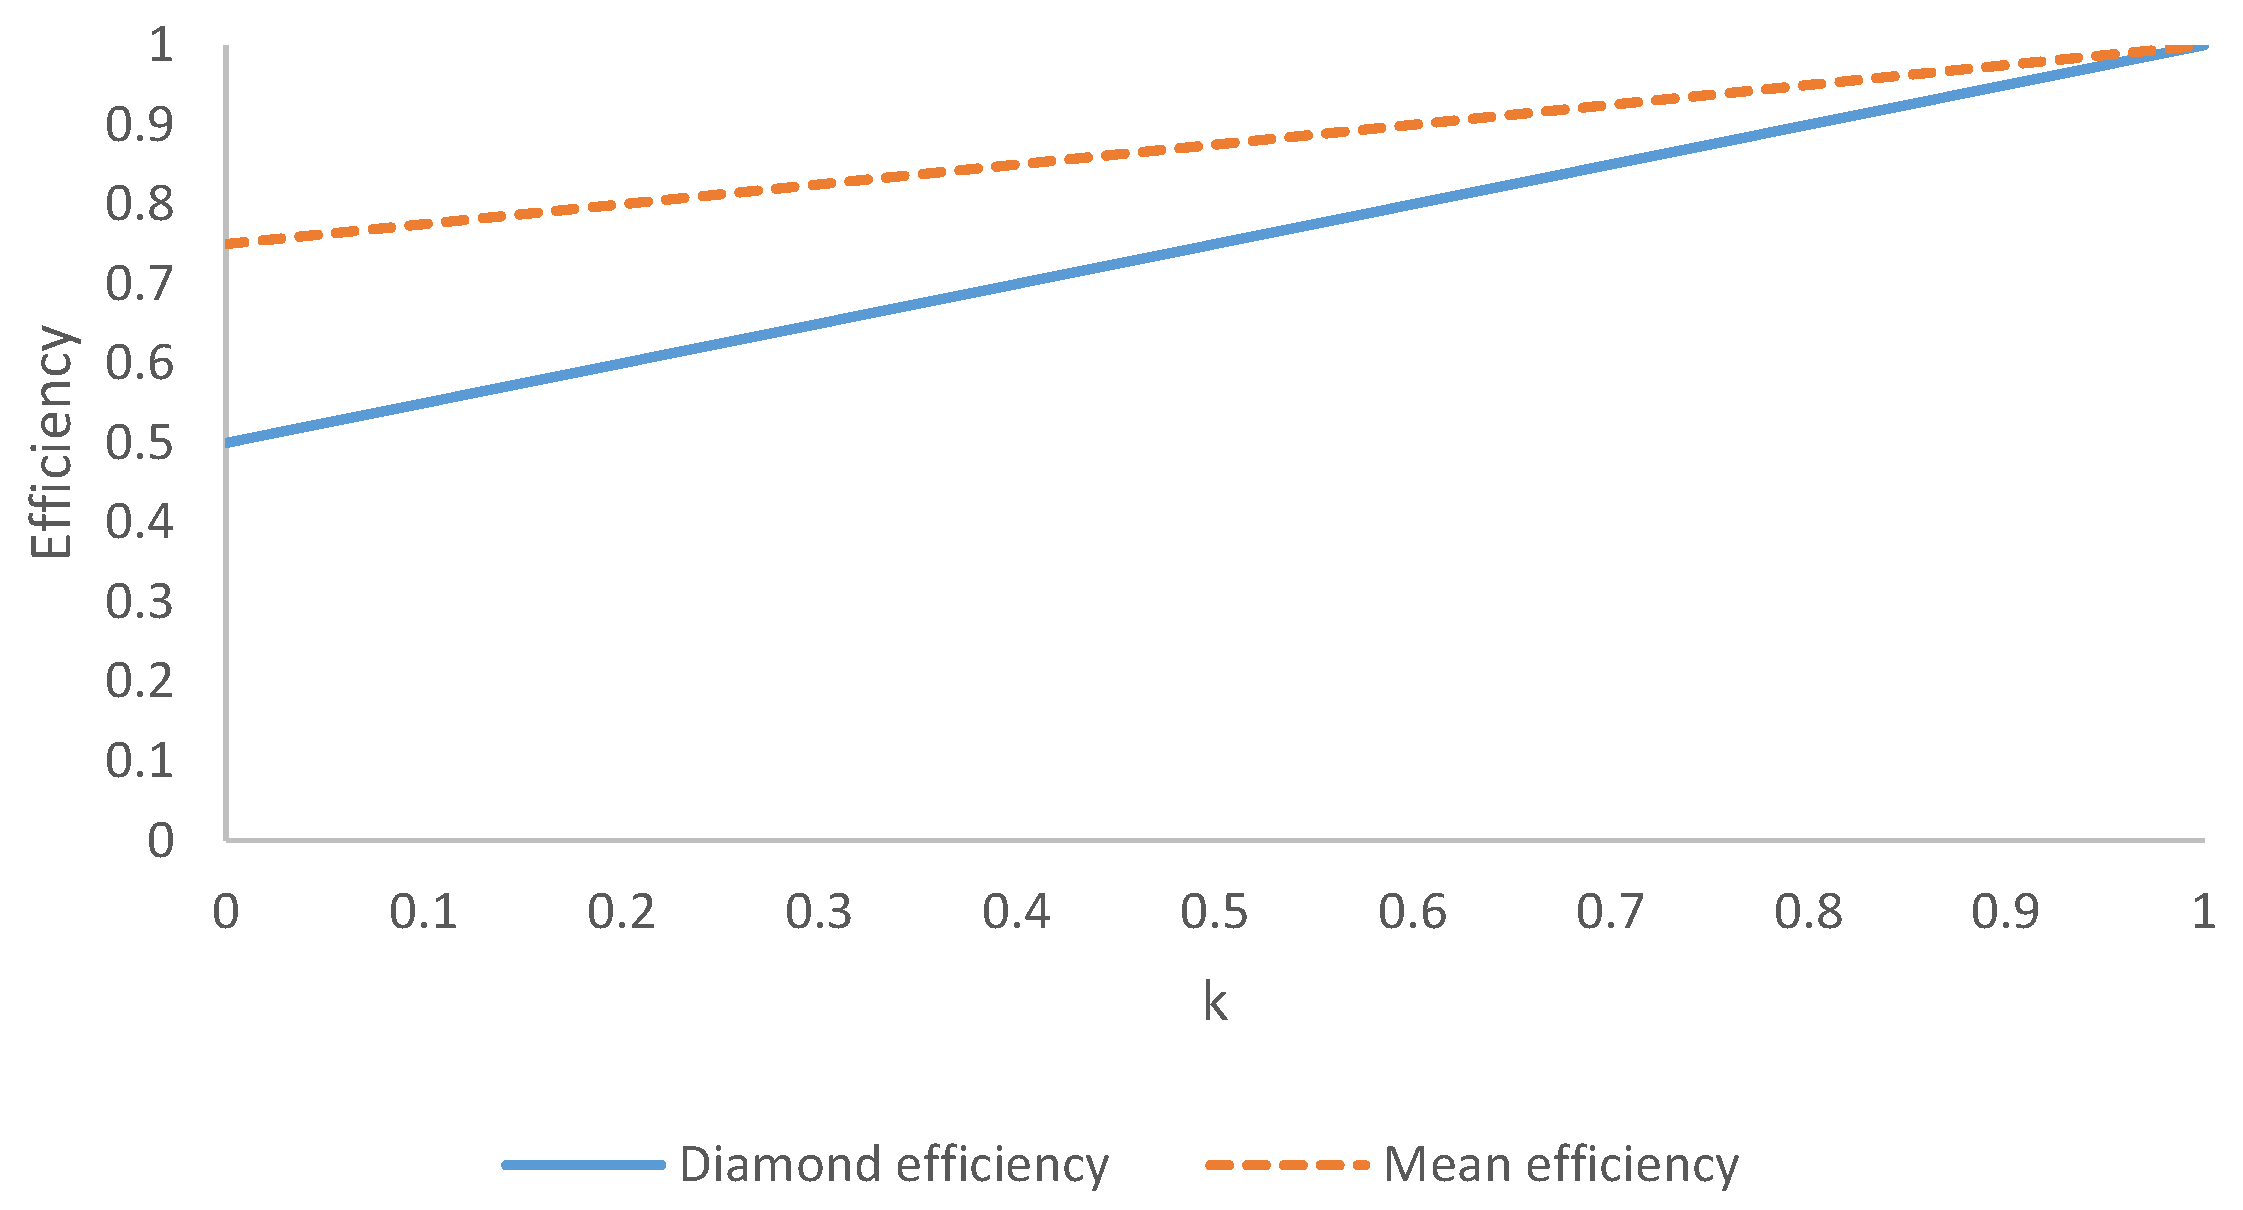
On the other hand, if we vary the score of only one perspective (for example ) while keeping the scores of the other perspectives constant, we obtain a straight line (Figure 6):
We have seen that the diamond efficiency measure is nonlinear; we may wonder about convexity. It can be shown that it is not even convex. Let us denote by the vector of the efficiency scores of a generic museum. For the diamond efficiency measure D to be convex, it should satisfy the following condition:
However, let us consider the following two examples.
Example 1.
Let and be defined as follows:
Example 2.
Let and be defined as follows:
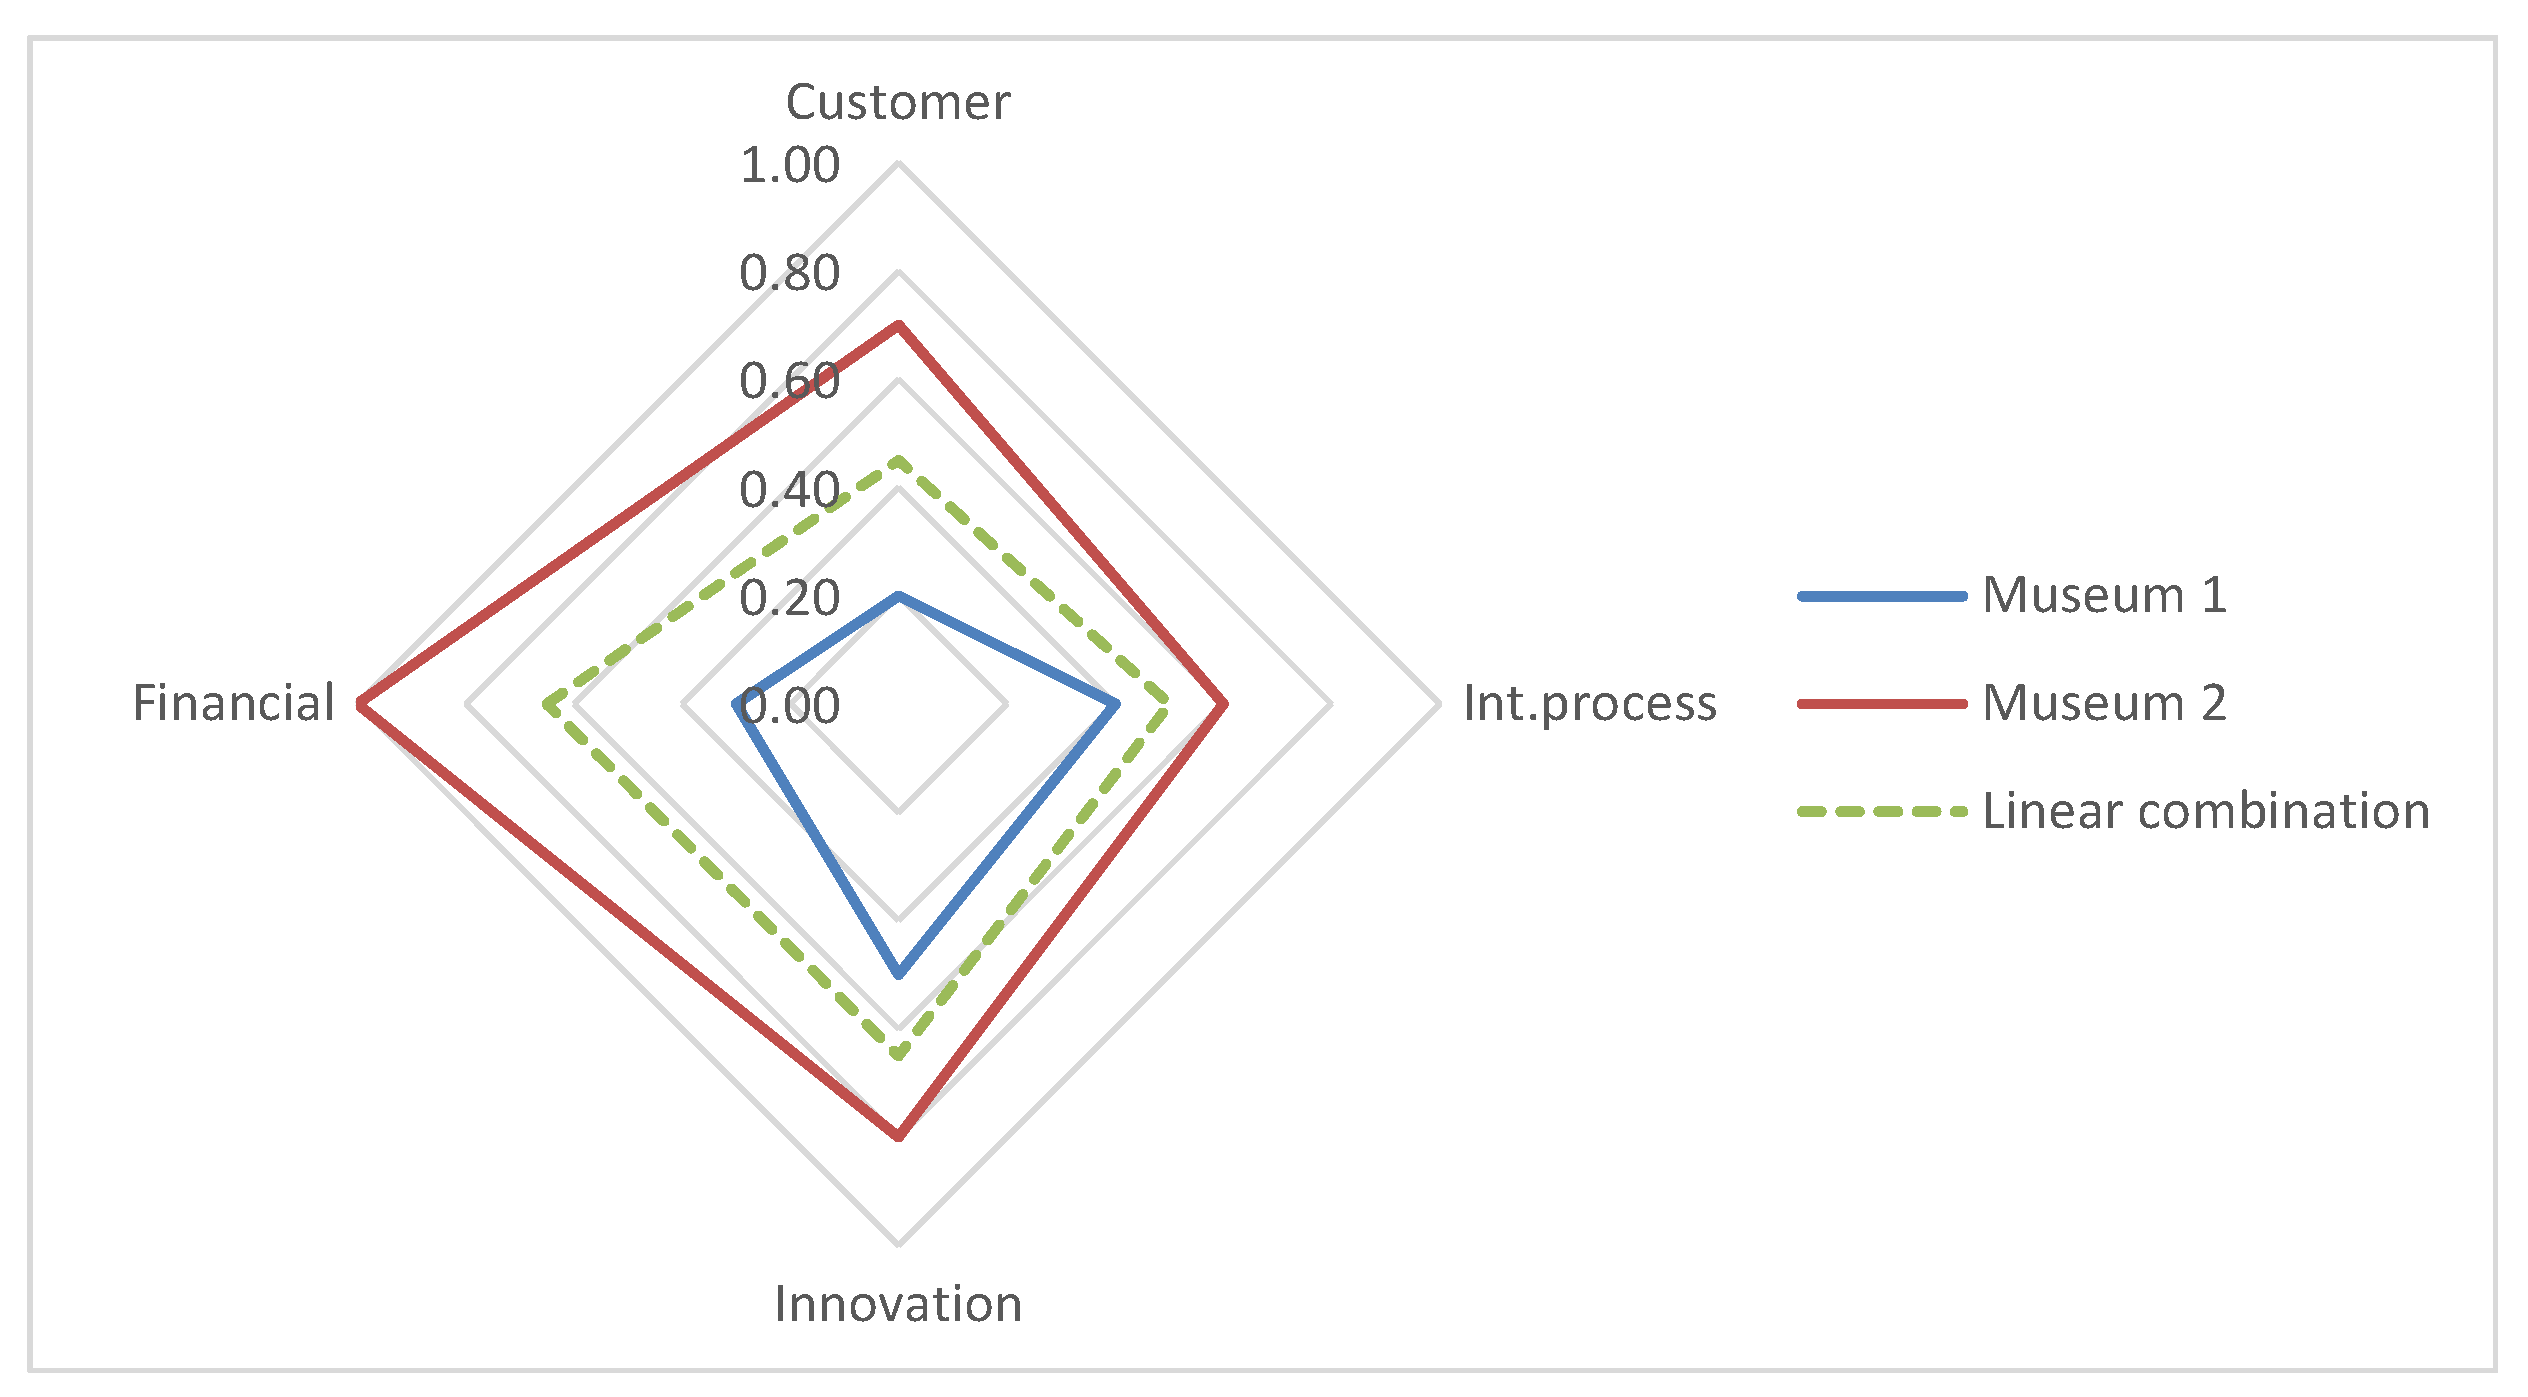
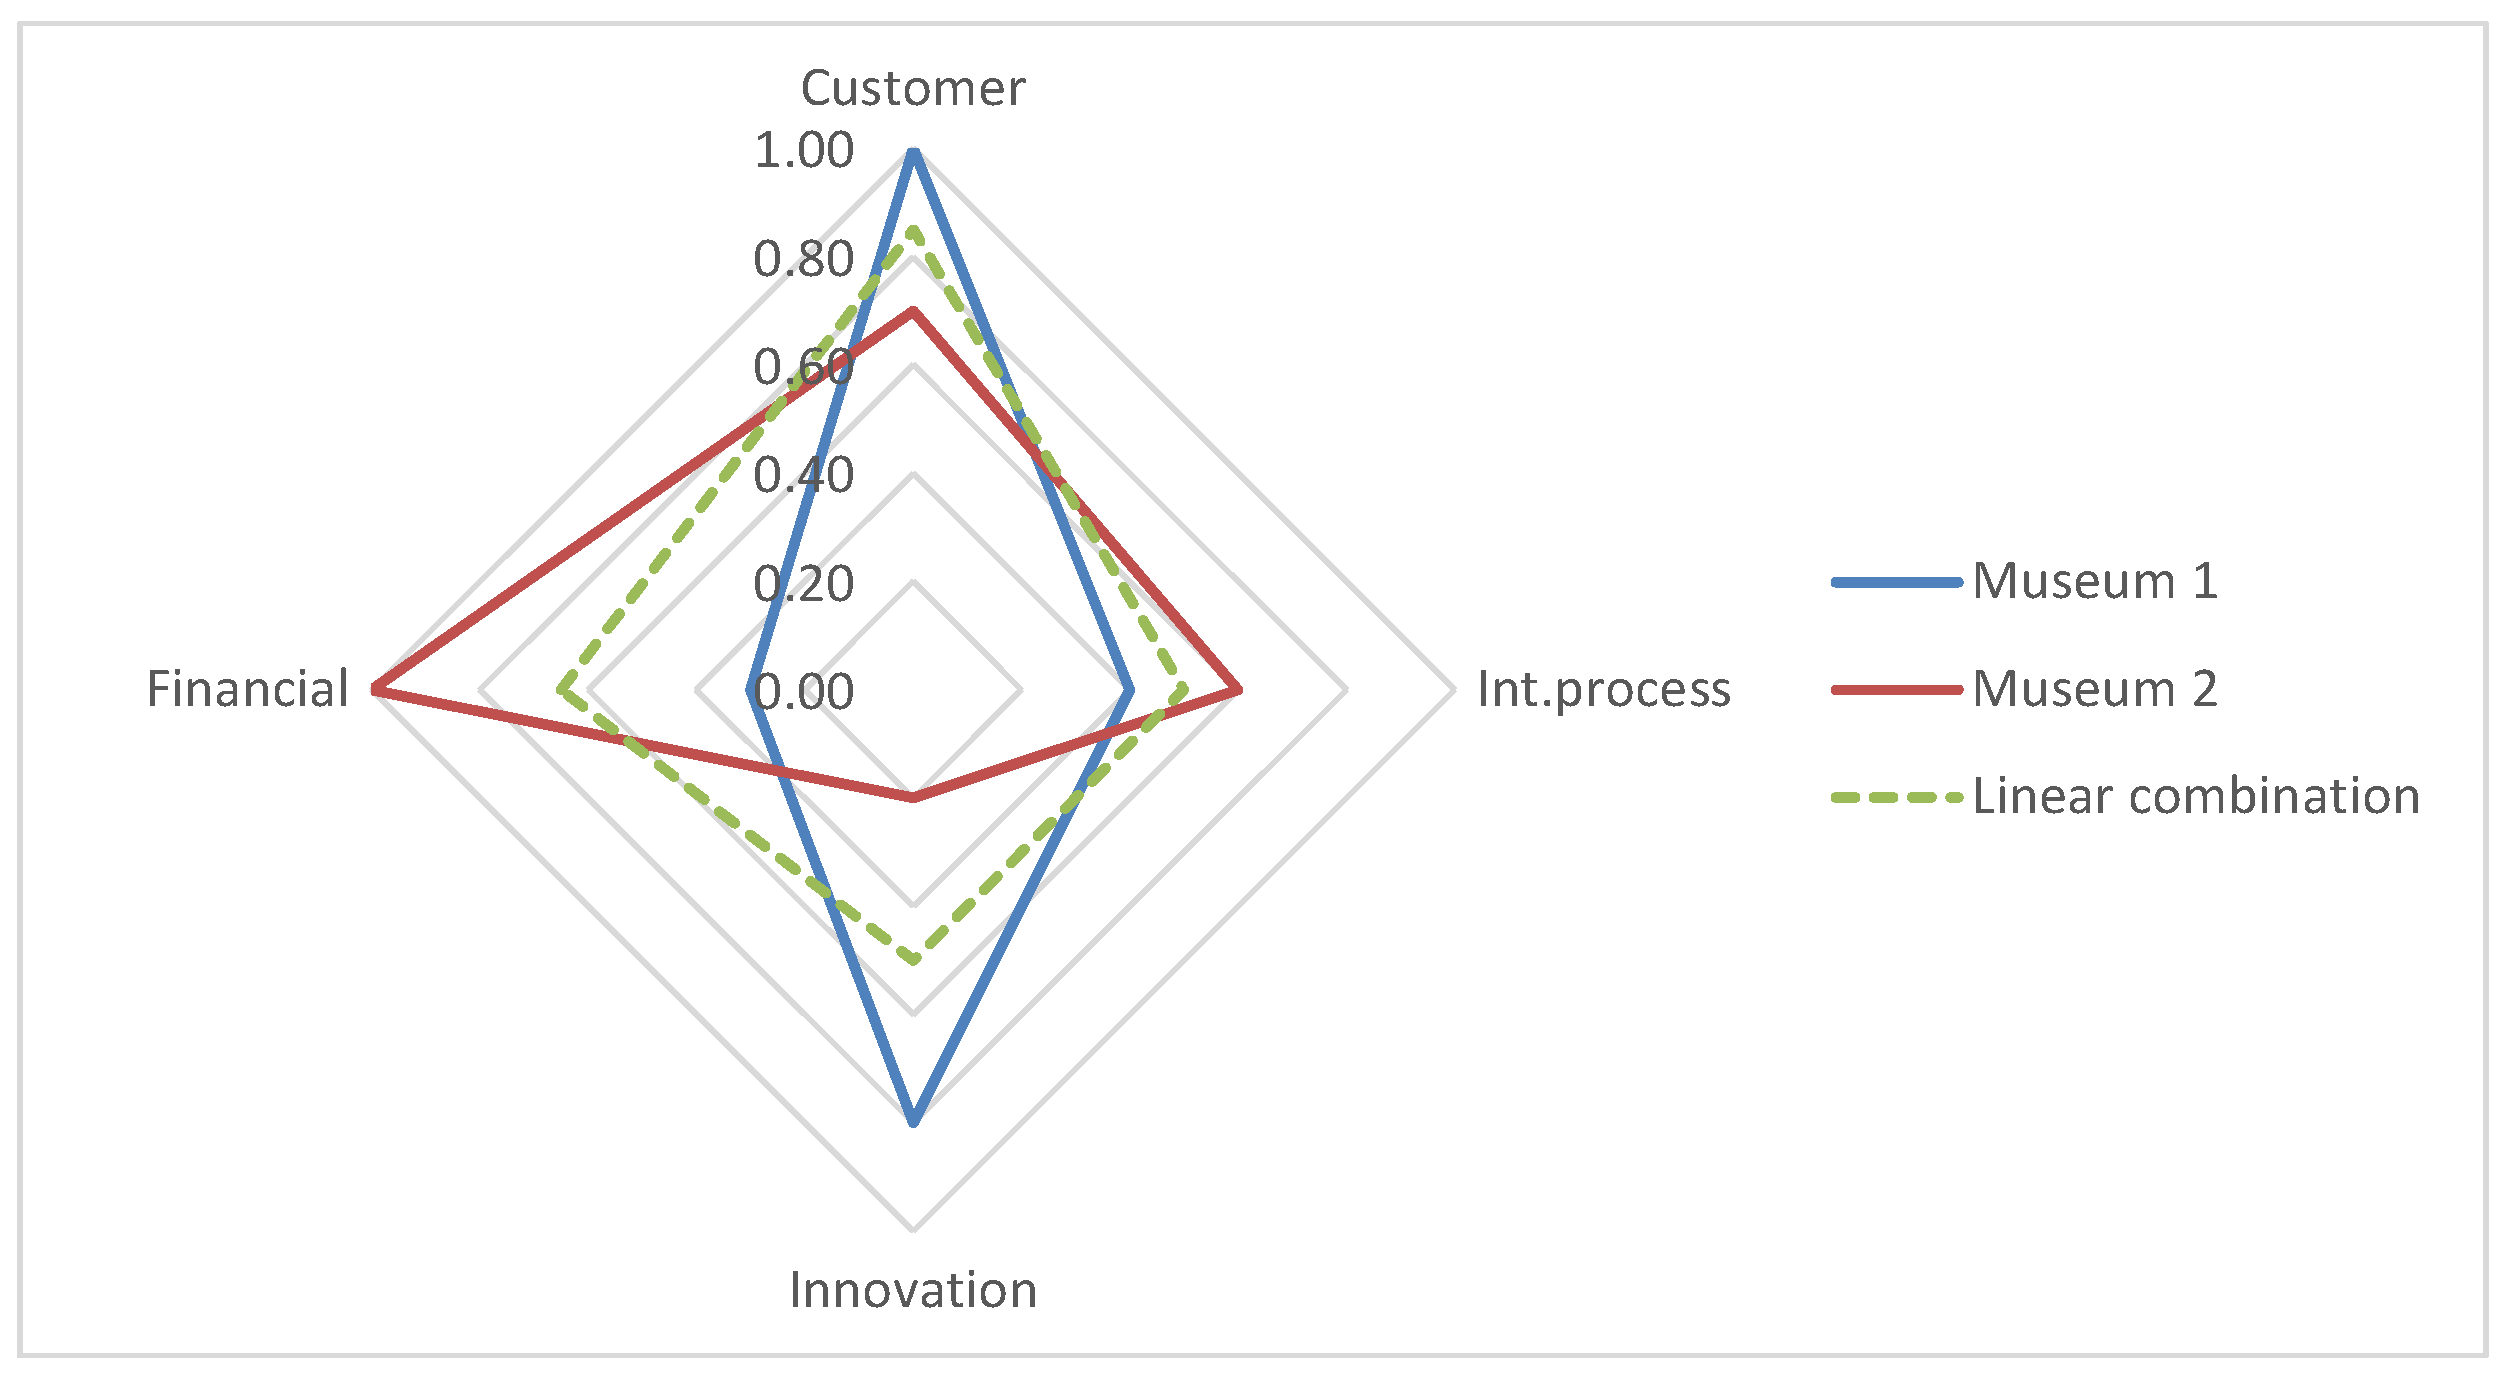
The radar charts for the museums of examples 1 and 2, as well as their linear combination with , are displayed in Figure 7 and Figure 8, respectively. It is easy to see that, for the two museums of example 1, holds, while, for the two museums of example 2, the opposite inequality holds: . Hence, the diamond efficiency measure is neither convex nor concave.
At this point, we may briefly compare the four efficiency measures proposed at the second stage to obtain an overall performance indicator with regard to the performance assessment of museums.
As for the DEA overall performance indicator, it clearly rewards every museum, which is efficient with respect to one or more perspectives, while the super-efficiency DEA indicator strives to improve the discrimination among the efficient units.
On the contrary, we have seen that the diamond efficiency tends to severely penalise the museums that are inefficient with respect to one or more perspectives, and the penalty for the museums that are inefficient with respect to all perspectives simultaneously is particularly heavy since it is “raised to the square”.
On the other hand, the mean efficiency indicator depends linearly on the perspectives efficiency scores and makes the penalty of the inefficiencies lighter.
5. Empirical Application to the MUVE Museums: The Data
In the final part of the paper, we illustrate an empirical application of the two-stage DEA-BSC model and of the various overall indicators proposed to the set of 11 municipal museums of Venice, managed by the MUVE Foundation (http://www.visitmuve.it/en/home/).
In order to implement the model, we collected all the data listed in the analytic model of Table 1. However, as anticipated in Section 3, due to the relatively low number of museums analysed that limits the inclusion in the DEA models of a high number of input and output variables, we carried out the analysis focusing on the variables of the synthetic model. The results obtained will be presented in the next sections.
The data on the municipal museums of Venice have been supplied by the MUVE Foundation—which the authors wish to thank—and concern the year 2013. The data on the input and output variables are reported in Table 4 and Table 5, respectively.
We point out that one of the MUVE museums is predominant over the others: it is the Doge’s Palace, the most famous Venetian museum that overlooks S. Mark’s square, one of the very symbols of Venice.
6. Empirical Application to the MUVE Museums: First Stage
6.1. First Stage Results for the DEA-BSC Perspective Models
Let us begin with the results obtained by applying the four DEA models associated with the four BSC perspectives. These models are considered in their synthetic form and represent the first stage of the two-stage DEA-BSC model presented in Section 3.
Table 6 summarises the overall results of the two-stage DEA-BSC model. Columns 2 to 5 of this table report for each perspective the value of the pure efficiency score computed by using the VRS output oriented model of the first stage.
In addition, Table 7 exhibits also for all perspectives the decomposition of the global technical efficiency of the first stage DEA models into the pure technical and scale efficiency.
Indeed, a measure of scale efficiency is given by the ratio between the efficiency scores obtained with the constant returns-to-scale (CRS) model and the VRS model (1) and (2) (let us remind readers that the CRS model omits the constraint in the set of constraints (2)):
The global technical efficiency of a museum o coincides with the CRS efficiency score () and can be written as the product of the pure technical efficiency score under VRS, , times the scale efficiency factor that is: (see [4,13]).
From Table 6, we may observe that the number of efficient museums is relatively high, especially for the Customer and the Innovation perspective models. This may be due to the relatively low number of museums, but it may also reflect the fact that the museums considered all pertain to the same foundation, which manages some resources jointly in order to get scale economies. From the results of our analysis reported in Table 7, it seems that scale economies are indeed obtained by the MUVE museums through the use of shared resources.
Nevertheless, it is interesting to note that one museum is efficient with regard to all perspectives: it is the Doge’s Palace, the biggest and most visited one by far.
With regard to the Internal process perspective, four museums (Doge’s Palace, Correr Museum, Ca’ Rezzonico, and Clock Tower) operate in a locally efficient manner (. However, whereas the Doge’s Palace and the Clock Tower exhibit also a maximum global efficiency score (, thus being fully efficient, Correr Museum and Ca’ Rezzonico operate in a locally efficient manner even if they are not globally efficient because of their scale size. The global inefficiency of all other museums is caused at the same time by their inefficient operation and their scale size.
The Doge’s Palace maintains its status of a fully efficient museum also in the Financial perspective. On the other hand, the only other museum that is efficient with regard to this perspective is the Clock Tower that, however, is locally but not globally efficient.
The situation changes when the Customer perspective is considered: there is an increase in the number of fully efficient museums (Carlo Goldoni’s House, Clock Tower, Lace Museum); the Doge’s Palace loses its status of fully efficient museum, while maintaining that of locally efficient. The high number of locally efficient units in the Customer perspective (8 out of 11) may suggest that the marketing objectives are pursued by the MUVE museums in a fairly efficient way.
As far as the Innovation perspective is concerned, the MUVE museums are managed by the Foundation in a similar way (see column 6 of Table 5); hence, it is not surprising that they obtain a similar efficiency score with respect to this perspective. As observed in Section 3, as a consequence of the presence of a single constant input, the model for the Innovation perspective constitutes a special case in which the VRS and CRS efficiency scores coincide for all the museums considered. On the other hand, this entails that the scale efficiency is equal to 1 for all museums; moreover, the majority of them (7 out of 11 museums) are fully efficient.
6.2. A More Detailed Analysis of Efficiency in the Various Perspectives
One of the advantages of the DEA approach is that it indicates a benchmark, called a reference set, which the non-efficient units can look at for improvements. A non-efficient museum could improve its efficiency by increasing the value of the outputs while using the same amount of inputs, or even less, by emulating a virtual museum defined as a proper linear combination of the efficient museums in the reference set. In addition, it is possible to compute the maximum improvements attainable in terms of outputs increase (see, e.g., [13]). Table 8 displays the reference set obtained for each museum by the four DEA-BSC models in the first stage.
For the Innovation perspective, it is interesting to note that the reference set is given by the same museum (the Correr Museum) for all the museums considered. This is probably due to the fact that the Correr Museum has the highest value of the two output variables considered by the Innovation perspective model (the aggregate sustainability indicator and the personnel training) while having the same (constant) input level. Moreover, as for the Financial perspective, the reference set is given by the same pair of efficient units (Doge’s Palace and the Clock Tower) for of all inefficient museums.
On the contrary, for the Customer and the Internal process perspectives, the reference set varies according to the museum considered. For instance, Ca’ Rezzonico could improve its performance in the Customer perspective by trying to imitate the behaviour of a virtual museum whose outputs (inputs) are a convex linear combination of the outputs (inputs) of the following museums: Correr Museum, Glass Museum, Carlo Goldoni’s House, and Fortuny Palace.
In addition, it could be interesting to compute the maximum improvements attainable in terms of output increase. Table 9 shows the output improvements (percentage) obtained by projecting each museum onto the efficient frontier for all the different perspectives considered in the first stage. These represent the percentage increase of a given output variable that would cause an inefficient museum to become efficient.
For the analysis at hand, however, the actual applicability of the optimal improvements suggested by the outcomes displayed in Table 9 may be doubtful. Indeed, the presence of a museum like the Doge’s Palace, which is universally recognised as “the icon” of Venice, makes it difficult, most likely almost impossible, for the other Venetian museums to imitate it.
6.3. First Stage Results for the Super-Efficiency Model
We have also applied to the data under consideration the super-efficiency model presented in Section 3. The results are displayed in columns 2 to 5 of Table 10.
It is not surprising that Doge’s Palace is by far the most efficient among the efficient museums for three out of four perspectives; the Correr Museum, instead, turns out to be the most efficient museum for the Innovation perspective.
The well-known infeasibility drawback of the super-efficiency DEA models occurs only for one museum, the Clock Tower, for three out of four BSC perspectives. This will entail the impossibility to compute the super efficiency model of the second stage on the ground of the super-efficiency scores , , obtained at the first stage. For this reason, the second stage of the super-efficiency DEA-BSC model will be computed using the scores , , obtained in the first stage with the usual DEA models instead of the scores , , and obtained with the first stage super efficiency models.
7. Empirical Application to the MUVE Museums: Second Stage
7.1. Second Stage Results with the DEA Approach
In the second stage of the DEA-BSC model, we have computed the value of the efficiency score by considering the synthetic form presented in Table 2. As described, the output variables of the second stage model are given by the efficiency scores , , obtained for the various BSC perspectives in the first stage.
As specified in Section 3, for computational reasons in the synthetic model, we can only consider three output variables. We decided to leave out the score of the Innovation perspective () since this is the perspective with the lowest variability in the efficiency scores amongst the museums.
The last column of Table 6 reports the value of the overall indicator obtained with the second stage model. We can note that only two museums are efficient with respect to all three BSC perspectives (Doge’s Palace and Clock Tower); clearly, they are also efficient in the second stage.
However, in theory, other museums that are efficient only with respect to some perspectives may reach the maximum value of the final performance indicator anyway. In our analysis, this happens for all museums that get a unit score for at least one perspective. Overall, as many as 9 out of 11 museums are efficient in the second stage DEA model.
Moreover, it is interesting to note that, in our analysis, the value obtained for the overall efficiency indicator coincides for all museums with the maximum of the efficiency scores obtained in the first stage for the different perspectives. Nevertheless, a brief investigation with different simulated data showed that this result is linked to the data at hand and may not be generalized to all cases.
As for the super-efficiency model, in the second stage, this model is not able to improve the maximum score for any of the efficient museums (see the last column of Table 10), so that we cannot further discriminate among the efficient museums.
7.2. Second Stage Results with the Diamond Efficiency Measure
We have seen in the previous section that, for the MUVE museums, the second stage DEA model declares several museums as efficient, and a super efficient DEA model is not able to discriminate among the efficient museums either. On the one hand, such a result may be politically appreciated; on the other hand, it may be useful to complement this information with results obtained with a supplemental analysis.
As suggested in Section 5, a first naive method is simply given by the weighted mean of the efficiency scores obtained for the four perspective in the first stage Equation (6). Note that we may take into account the scores of all the four perspectives, and that it is also possible to assign different weights to the various perspective; however, in the absence of indications by the decision makers, a natural choice is given by the arithmetic mean computed using equal weights Equation (5). The fourth column of Table 11 presents the mean efficiency scores computed with equal weights.
On the other hand, in Section 5, we have also proposed an alternative efficiency measure that can be applied in the second stage: the diamond efficiency measure defined in Equations (7) and (9). The results obtained for the MUVE museums with this efficiency measure are presented in the last column of Table 11.
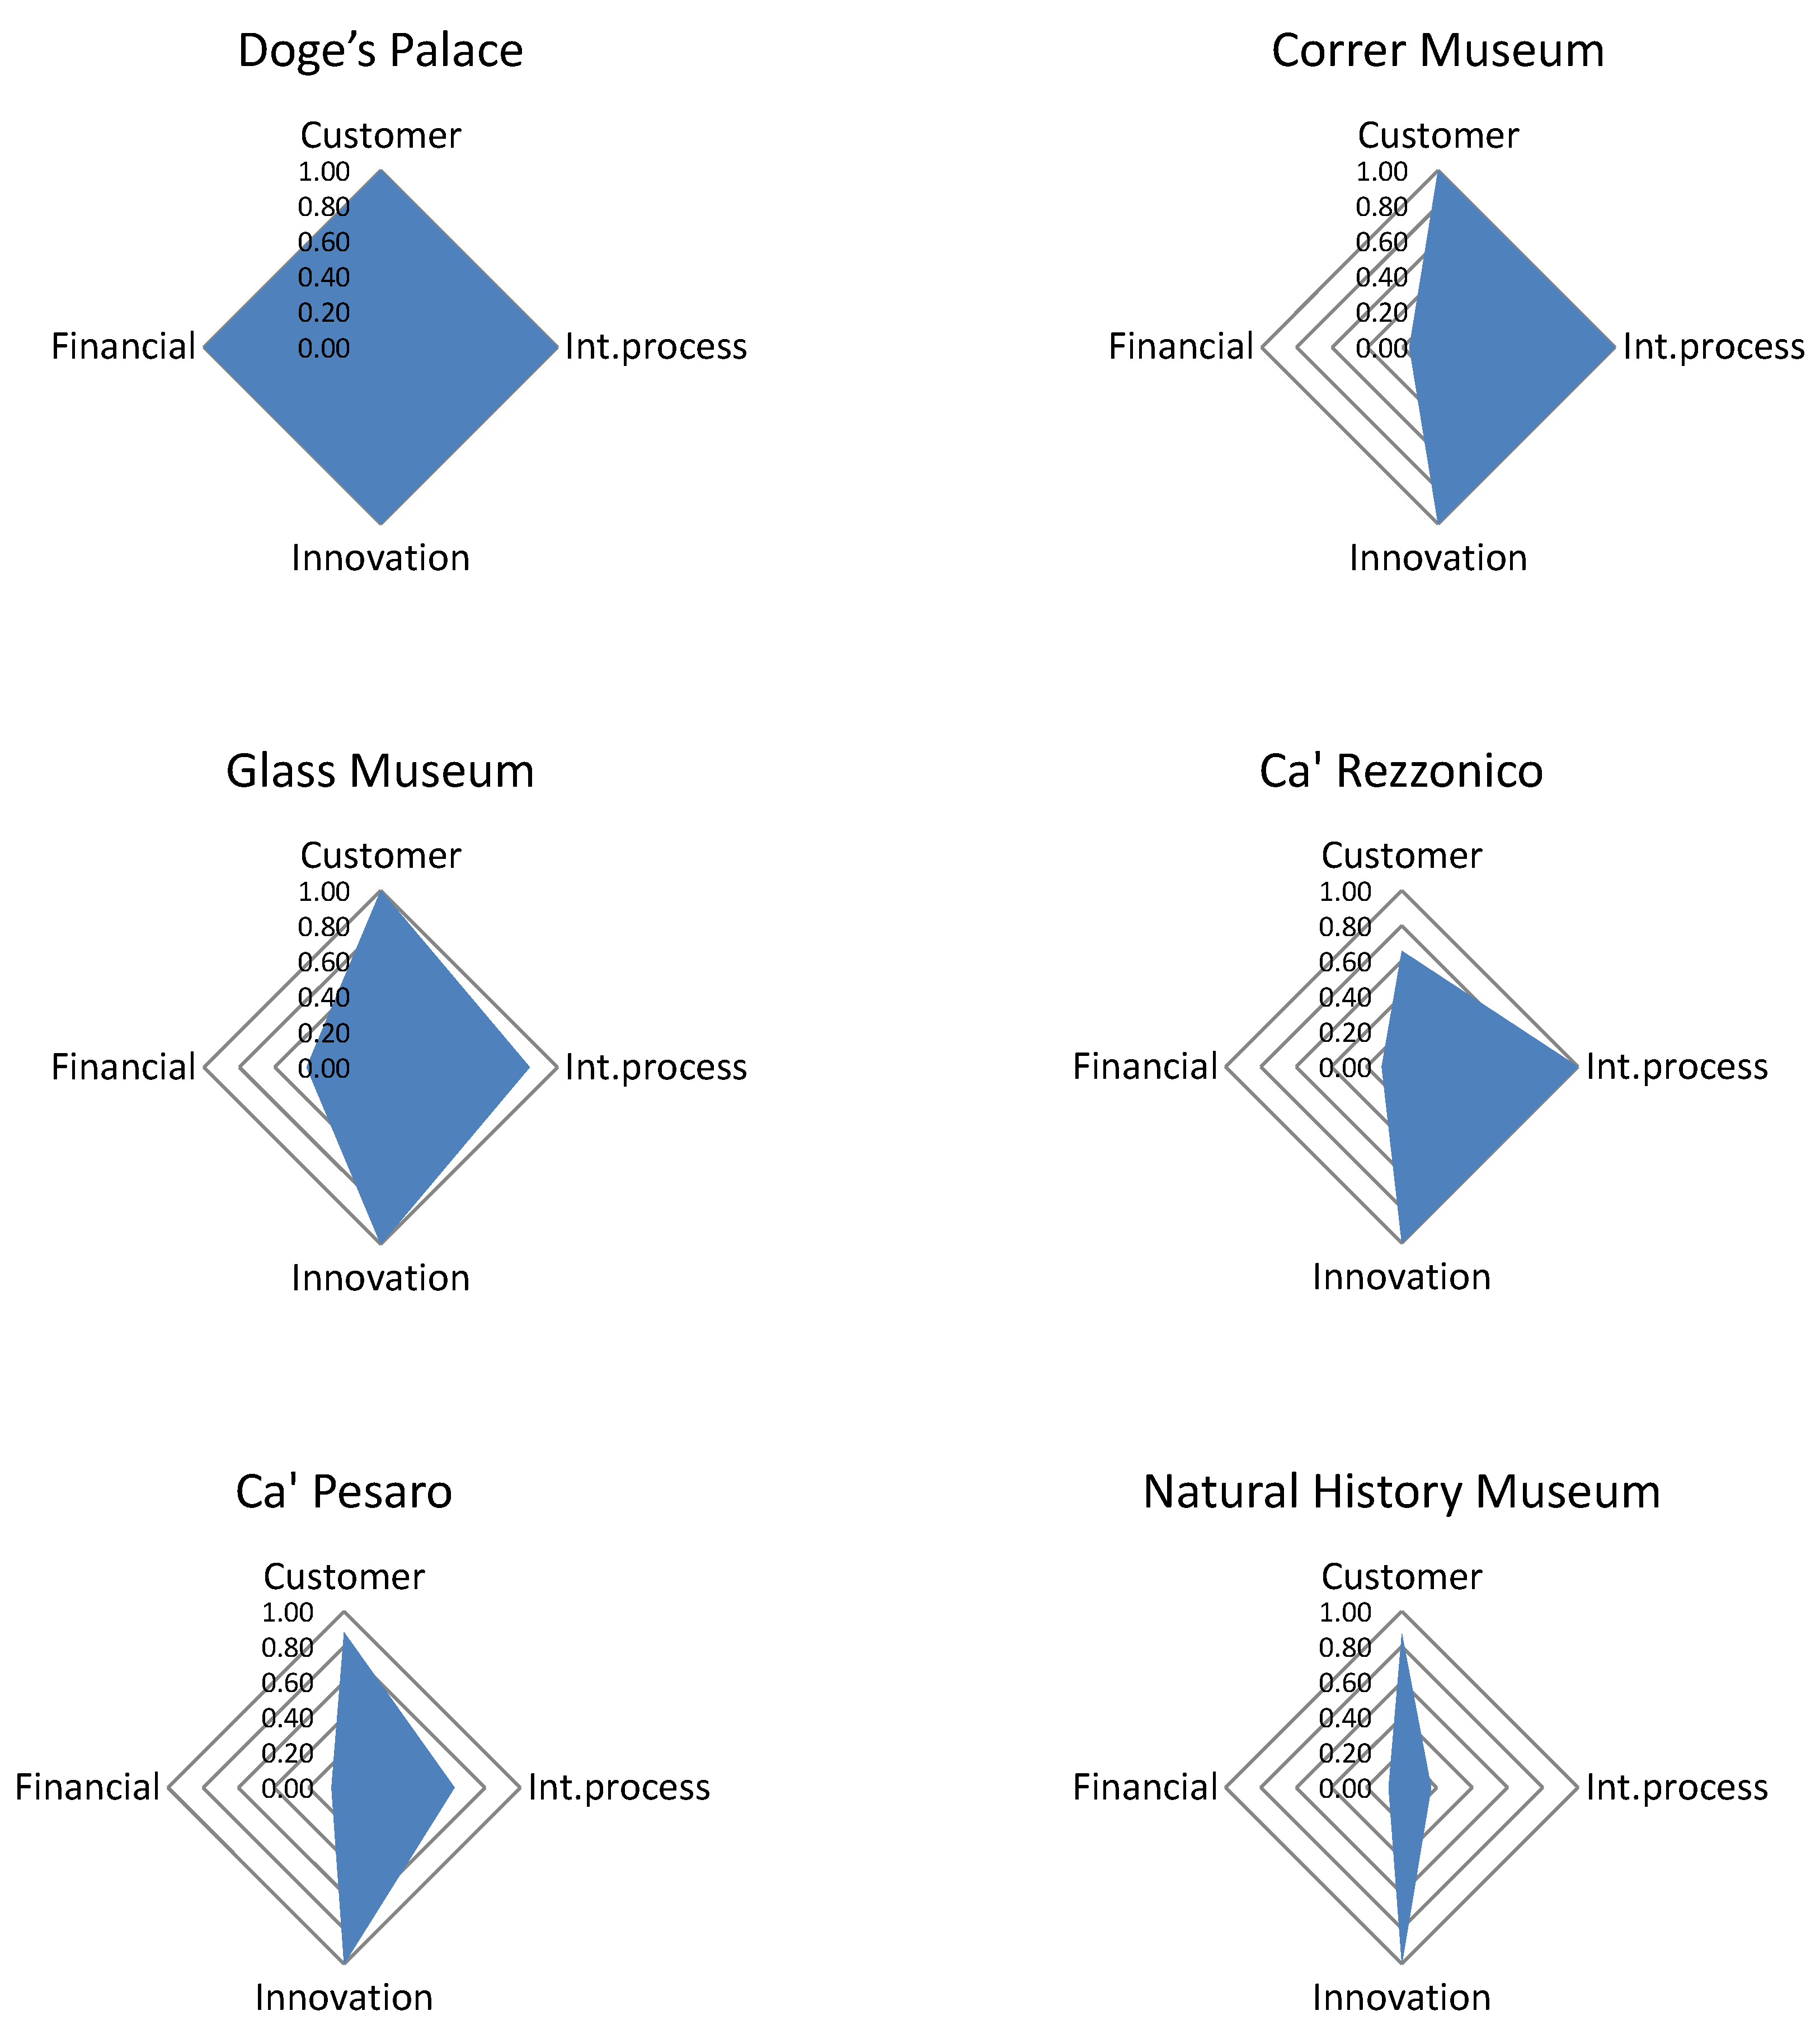
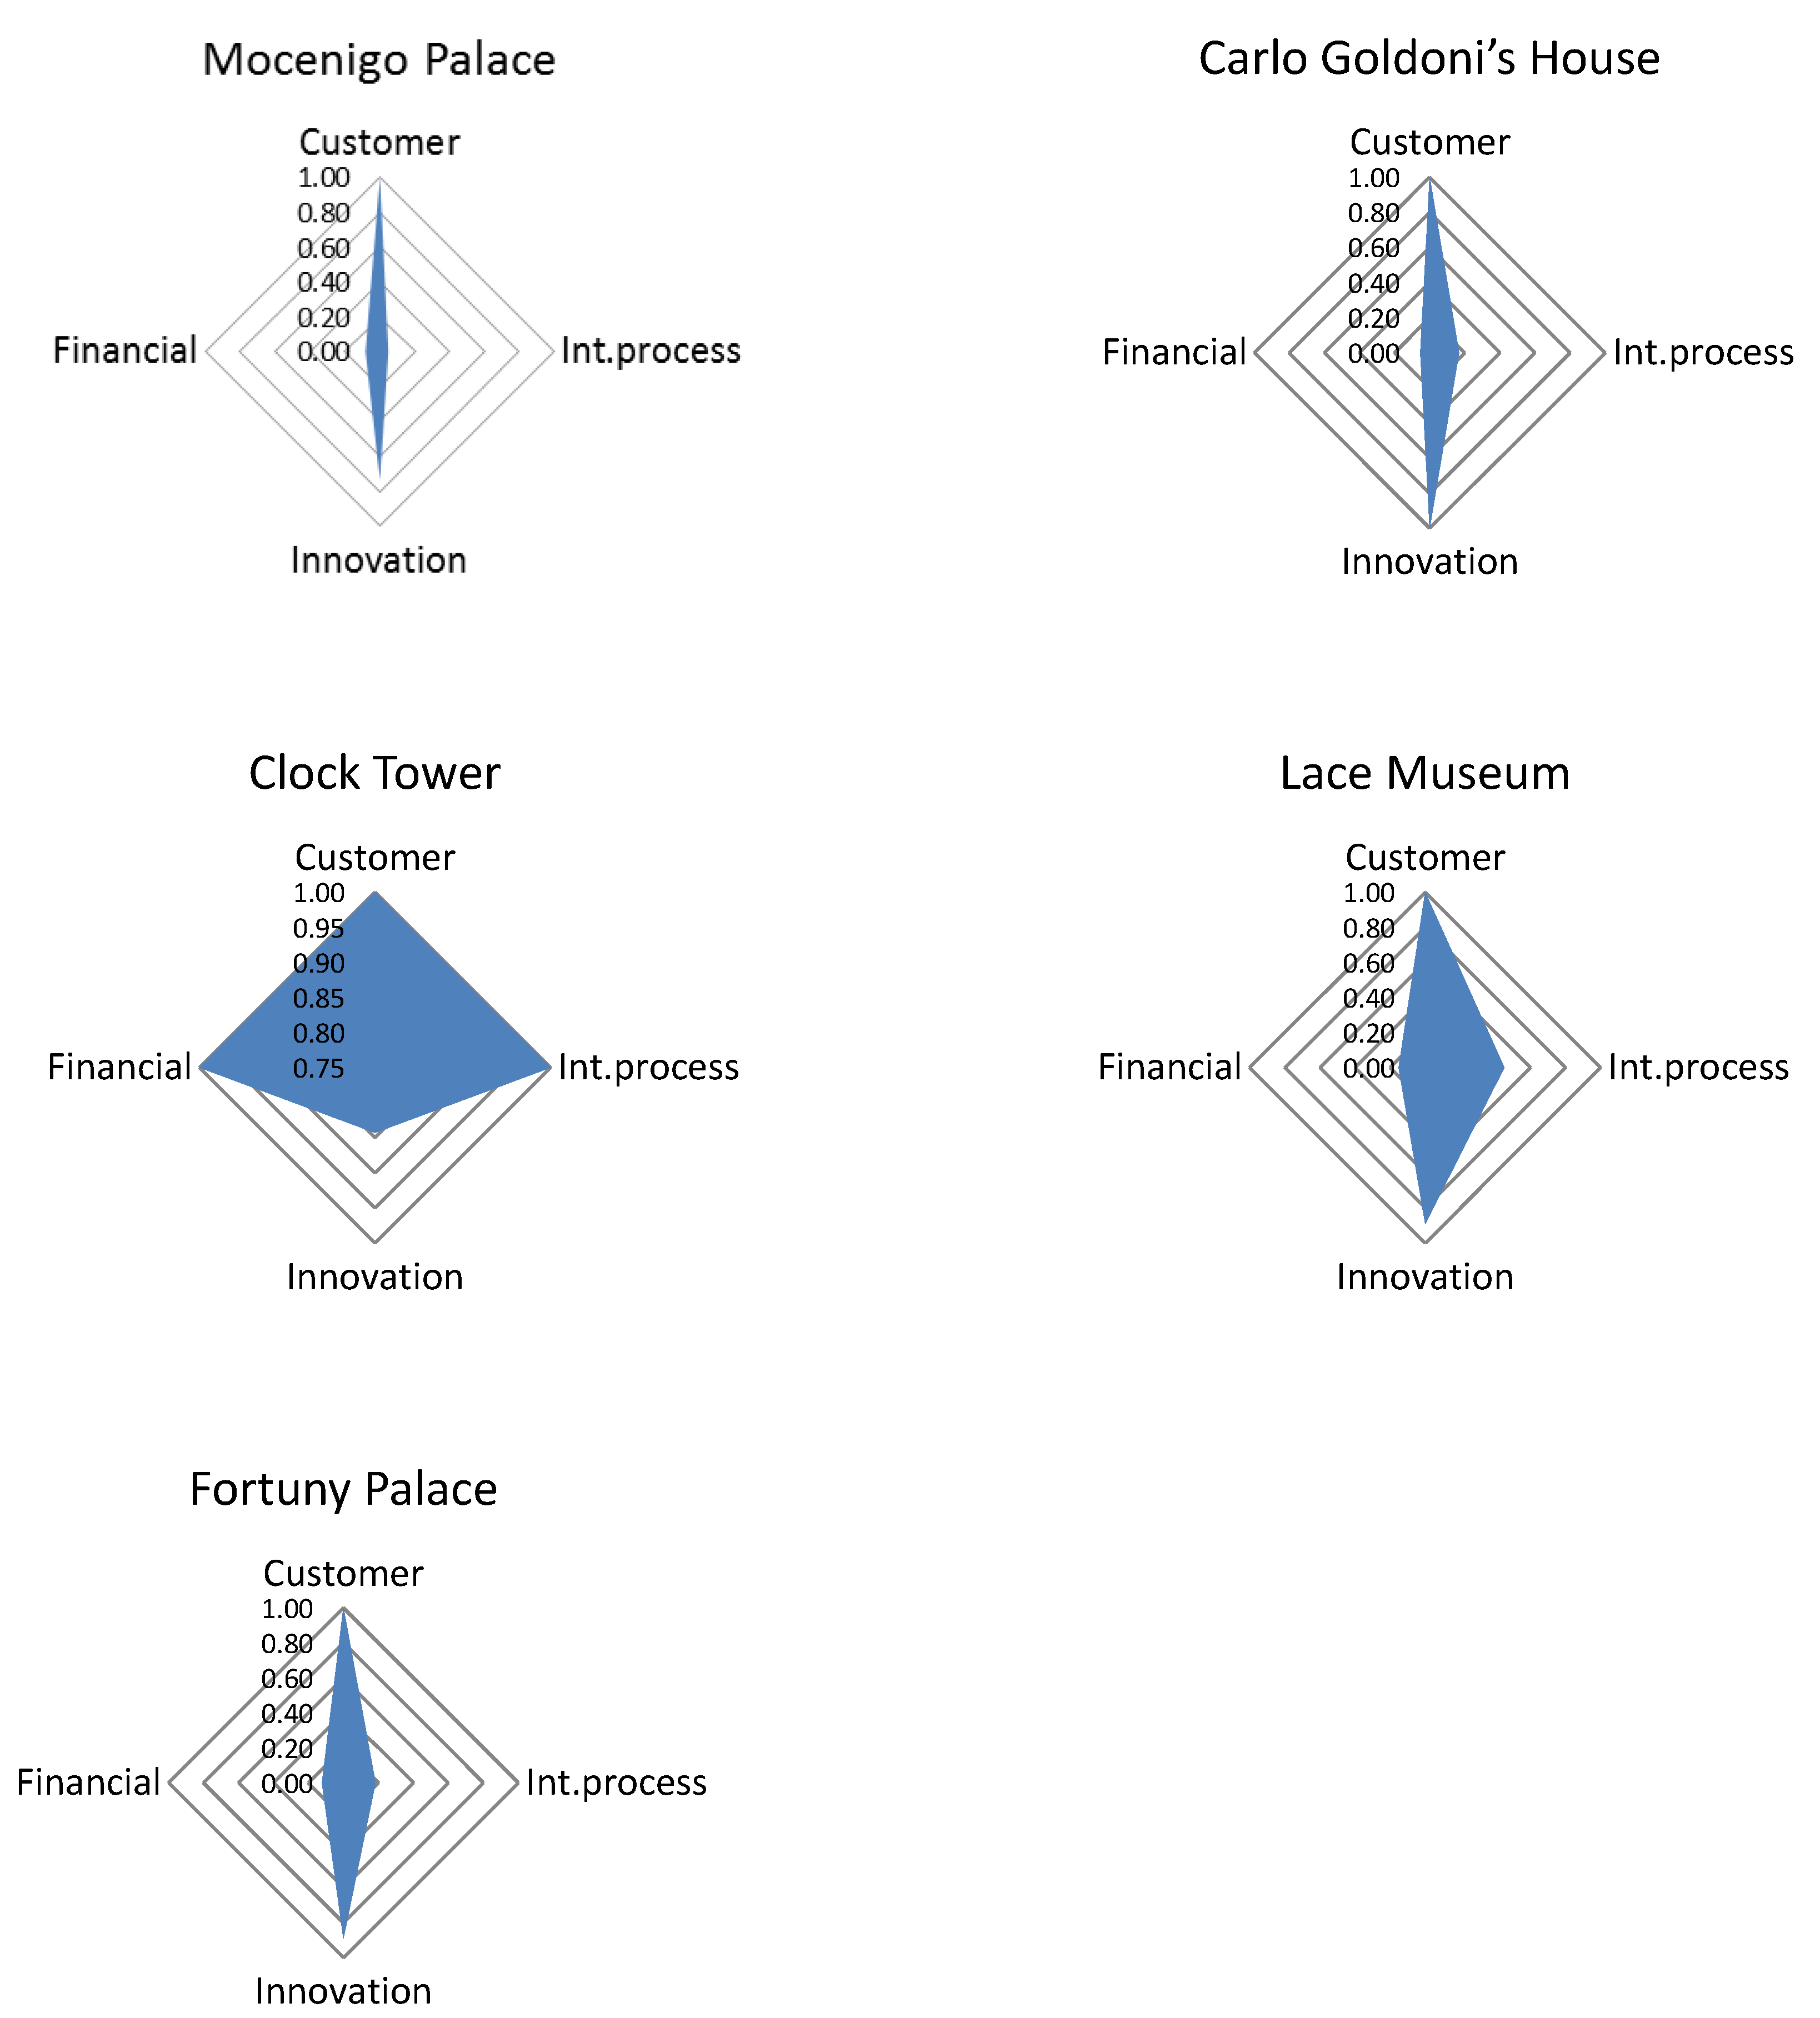
Figure 9 illustrates the DEA-BSC efficiency scores obtained for the various museums in the first stage using a radar chart in which the scores of the different perspectives are displayed along the semiaxes. We may observe that the situation is fairly diversified, even among the museums declared as efficient by the second stage DEA model.
Indeed, only the Doge’s Palace is fully efficient with respect to all four of the perspectives: therefore, this is the only museum that gets the maximum value for the area of the diamond defined by the perspective scores , , , , and exhibits a diamond efficiency score D equal to 1 (see the last column of Table 11). The Clock Tower, Glass Museum, and Correr Museum display a diamond efficiency score greater than while, on the contrary, the Mocenigo Palace exhibits the lowest score with respect to the diamond efficiency despite being efficient according to the DEA model.
By comparing the results obtained with the different efficiency measures presented in Table 11, it is apparent that DEA easily rewards any label of efficiency attained by a perspective while, on the contrary, the diamond efficiency is much stricter and penalises every inefficiency shown with regard to a perspective. In the middle, we find the mean efficiency score that linearly depends on the efficiency scores of the different perspectives.
8. Conclusions
In this contribution, we propose a two-stage model to assess the performance of a set of museums.
In the first stage, we compute the museum performance with a specially designed DEA-BSC model for each BSC perspective, with the idea to apply to museums a BSC (Balanced Scorecard) approach which is widely used in management control. In the second stage, the performance scores obtained at the first stage are summarised in a unique overall performance measure.
As for the second stage, a basic DEA model may sometimes prove incapable of effectively discriminating among the museums, especially in cases with a low number of museums. Therefore, in order to improve the discriminatory power of the two-stage model, we explore three different alternative methods, namely: DEA super-efficiency, a simple weighted mean of the DEA-BSC performance scores, and a specially designed efficiency measure called diamond efficiency.
In order to implement and test the theoretical model proposed, the overall efficiency measures are compared in a case study, evaluating the performance of the municipal museums of Venice. The results show that the diamond efficiency effectively discriminates the overall performance among the museums investigated, strongly penalising the inefficiencies shown with respect to one or more BSC perspectives.
On the other hand, with regard to the computation of the overall performance indicator, we have to point out that the diamond efficiency measure severely penalises the museums that exhibit a low efficiency score with respect to one or more BSC perspectives.
As for future research, it will be interesting to test the different overall performance indicators computed in the second stage on different sets of museums, or even on different cultural institutions.
Author Contributions
Conceptualization, A.B. and S.F.; formal analysis, A.B. and S.F.; investigation, A.B. and S.F.; methodology, A.B. and S.F.; writing—original draft, A.B. and S.F. All authors have read and agreed to the published version of the manuscript.
Funding
This research received no external funding.
Conflicts of Interest
The authors declare no conflict of interest.
References
- Mairesse, F.; Vanden Eeckaut, P. Museum assessment and FDH technology: Towards a global approach. J. Cult. Econ. 2002, 26, 261–286. [Google Scholar] [CrossRef]
- Pignataro, G. Measuring the efficiency of museums: A case study in Sicily. In The Economics of Heritage: A Study in the Political Economy of Culture in Sicily; Rizzo, I., Towse, R., Eds.; Edward Elgar Publishing Ltd.: Cheltenham, UK; Northampton, MA, USA, 2002; pp. 65–78. [Google Scholar]
- Basso, A.; Funari, S. Measuring the performance of museums: Classical and FDH DEA models. Rend. Per Gli Studi Econ. Quant. 2003, 2003, 1–16. [Google Scholar]
- Basso, A.; Funari, S. A quantitative approach to evaluate the relative efficiency of museums. J. Cult. Econ. 2004, 28, 195–216. [Google Scholar] [CrossRef]
- Basso, A.; Casarin, F.; Funari, S. How well is the museum performing? A joint use of DEA and BSC to measure the performance of museums. Omega 2018, 81, 67–84. [Google Scholar] [CrossRef]
- Del Barrio, M.J.; Herrero, L.C.; Sanz, J.A. Measuring the efficiency of heritage institutions: A case study of a regional system of museums in Spain. J. Cult. Herit. 2009, 10, 258–268. [Google Scholar] [CrossRef]
- Del Barrio, M.J.; Herrero, L.C. Evaluating the efficiency of museums using multiple outputs: Evidence from a regional system of museums in Spain. Int. J. Cult. Policy 2014, 20, 221–238. [Google Scholar] [CrossRef]
- Carvalho, P.; Silva Costa, J.; Carvalho, A. The economic performance of Portuguese museums. Urban Public Econ. Rev. 2014, 20, 12–37. [Google Scholar]
- Taheri, H.; Ansari, S. Measuring the relative efficiency of cultural-historical museums in Tehran: DEA approach. J. Cult. Herit. 2013, 14, 431–438. [Google Scholar] [CrossRef]
- Del Barrio-Tellado, M.J.; Herrero-Prieto, L.C. Modelling museum efficiency in producing inter-reliant outputs. J. Cult. Econ. 2019, 43, 485–512. [Google Scholar] [CrossRef]
- Guccio, C.; Martorana, M.; Mazza, I.; Pignataro, G.; Rizzo, I. An analysis of the managerial performance of Italian museums using a generalised conditional efficiency model. Socio-Econ. Plan. Sci. 2020. [Google Scholar] [CrossRef]
- Basso, A.; Funari, S. A three-system approach that integrates DEA, BSC and AHP for museum evaluation. Decis. Econ. Financ. 2020. forthcoming. [Google Scholar]
- Cooper, W.W.; Seiford, L.M.; Tone, K. Data Envelopment Analysis: A Comprehensive Text with Models, Applications, References and DEA-Solver Software; Kluwer Academic Publishers: Boston, MA, USA, 2000. [Google Scholar]
- Kaplan, R.S.; Norton, D.P. The Balanced Scorecard–measures that drive performance. Harv. Bus. Rev. 1992, 70, 71–79. [Google Scholar] [PubMed]
- Marcon, G. La gestione del museo in un’ottica strategica: L’approccio della Balanced Scorecard. In Misurare e Comunicare i Risultati L’accountability del Museo; Sibilio Parri, B., Ed.; Franco Angeli: Milano, Italy, 2004; pp. 21–56. [Google Scholar]
- Wei, T.L.; Davey, H.; Coy, D. A disclosure index to measure the quality of annual reporting by museums in New Zealand and the UK. J. Appl. Account. Res. 2008, 9, 29–51. [Google Scholar]
- Haldma, T.; Lääts, K. The Balanced Scorecard as a performance management tool for museums. In Best Practices in Management Accounting; Gregoriou, G.N., Finch, N., Eds.; Palgrave Macmillan: London, UK, 2011; pp. 232–252. [Google Scholar]
- Zorloni, A. Designing a strategic framework to assess museum activities. Int. J. Arts Manag. 2012, 14, 31–47. [Google Scholar]
- Plaček, M.; Puček, M.J.; Šilhánková, V. New trends in the strategic management of museums in the Czech Republic. Mus. Manag. Curatorship 2017, 32, 302–318. [Google Scholar] [CrossRef]
- Lovell, C.A.K.; Pastor, J.T. Radial DEA models without inputs or without outputs. Eur. J. Oper. Res. 1999, 118, 46–51. [Google Scholar] [CrossRef]
- Andersen, P.; Petersen, N.C. A procedure for ranking efficient units in Data Envelopment Analysis. Manag. Sci. 1993, 39, 1261–1264. [Google Scholar] [CrossRef]
- Seiford, L.M.; Zhu, J. Infeasibility of super-efficiency Data Envelopment Analysis models. INFOR 1999, 37, 174–187. [Google Scholar] [CrossRef]
Figure 1.
Flow chart of the two-stage DEA-BSC model.

Figure 2.
Radar chart showing the score of a different perspective along each of the four semiaxes in the fully efficient case with .
Figure 2.
Radar chart showing the score of a different perspective along each of the four semiaxes in the fully efficient case with .

Figure 3.
Radar charts showing three representative diamonds for the instance with , , , .

Figure 4.
Behavior of the diamond and mean efficiency measures as a function of the perspectives’ efficiency scores when .
Figure 4.
Behavior of the diamond and mean efficiency measures as a function of the perspectives’ efficiency scores when .

Figure 5.
Behaviour of the diamond efficiency measure as a function of the perspectives’ efficiency scores when and .
Figure 5.
Behaviour of the diamond efficiency measure as a function of the perspectives’ efficiency scores when and .

Figure 6.
Behaviour of the diamond and mean efficiency measures as a function of the efficiency score of the customer perspective when .
Figure 6.
Behaviour of the diamond and mean efficiency measures as a function of the efficiency score of the customer perspective when .

Figure 7.
Radar chart showing a representative diamond of the BSC perspective scores for the museums of Example 1.
Figure 7.
Radar chart showing a representative diamond of the BSC perspective scores for the museums of Example 1.

Figure 8.
Radar chart showing a representative diamond of the BSC perspective scores for the museums of Example 2.
Figure 8.
Radar chart showing a representative diamond of the BSC perspective scores for the museums of Example 2.

Figure 9.
Radar charts showing for each museum the first stage DEA-BSC efficiency score of a different perspective along each of the four semiaxes.
Figure 9.
Radar charts showing for each museum the first stage DEA-BSC efficiency score of a different perspective along each of the four semiaxes.


Table 1.
Input and output variables of the first stage DEA-BSC models.
| First Stage | Analytic Model | Synthetic Model |
|---|---|---|
| Customer perspective | Input variable: Insured value | Input variable: Insured value |
| Output variables: | Output variables: | |
| 1. Visitors | 1. Visitors | |
| 2. Web site visits | 2. Web site visits | |
| 3. Members | 3. Members | |
| 4. Donations | ||
| 5. Catalogues | ||
| Internal process perspective | Input variable: Total costs | Input variable: Total costs |
| Output variables: | Output variables: | |
| 1. Conservation and restoration costs | 1. Conservation and restoration costs | |
| 2. Amount spent for new acquisitions | 2. Visitors | |
| 3. Visitors | ||
| Innovation and learning perspective | Input variable: constant | Input variable: constant |
| Output variables: | Output variables: | |
| 1. Innovative lighting | 1. Aggregate sustainability indicator | |
| 2. Environmental sustainability | 2. Personnel training | |
| 3. Facilities for people with disability | ||
| 4. Personnel training | ||
| Financial perspective | Input variable: Expenditure | Input variable: Expenditure |
| Output variable: Income | Output variable: Income |
Table 2.
Input and output variables of the second stage DEA-BSC model.
| Second Stage | Analytic Model | Synthetic Model |
|---|---|---|
| Input variable: constant | Input variable: constant | |
| Output variables: | Output variables: | |
| 1. Customer perspective score | 1. Customer perspective score | |
| 2. Internal process perspective score | 2. Internal process perspective score | |
| 3. Innov. and learning persp. score | 3. Financial perspective score | |
| 4. Financial perspective score |
Table 3.
Equivalence classes for the diamond representation of the perspectives performance scores of a museum with respect to the diamonds area (for the second and third class, only one representative diamond is reported); the area in the last column is computed for the instance , , , .
Table 3.
Equivalence classes for the diamond representation of the perspectives performance scores of a museum with respect to the diamonds area (for the second and third class, only one representative diamond is reported); the area in the last column is computed for the instance , , , .
| Diamond Representation | Area Computation | Diamond Area |
|---|---|---|
| ⋮ | ⋮ | |
| ⋮ | ⋮ |
Table 4.
MUVE museums: data on input variables (percentage values).
| Museums | Insured Value | Total Costs | Expenditure |
|---|---|---|---|
| Doge’s Palace | 57.73 | 30.95 | 30.95 |
| Correr Museum | 12.08 | 19.31 | 19.31 |
| Glass Museum | 5.13 | 4.01 | 4.01 |
| Ca’ Rezzonico | 7.62 | 10.70 | 10.70 |
| Ca’ Pesaro | 4.67 | 10.70 | 10.71 |
| Natural History Museum | 4.88 | 9.06 | 9.06 |
| Mocenigo Palace | 1.95 | 4.34 | 4.34 |
| Carlo Goldoni’s House | 0.82 | 2.77 | 2.77 |
| Clock Tower | 0.47 | 0.55 | 0.55 |
| Lace Museum | 0.96 | 1.69 | 1.69 |
| Fortuny Palace | 3.70 | 5.91 | 5.92 |
| Total | 100.00 | 100.00 | 100.00 |
Table 5.
MUVE museums: data on output variables (percentage values).
| Museums | Visitors | Web Site Visits | Members | Conservation Rest. Costs | Sustainabil. Indicator | Personnel Training | Income |
|---|---|---|---|---|---|---|---|
| Doge’s Palace | 65.64 | 50.80 | 20.22 | 8.59 | 10.23 | 9.96 | 77.88 |
| Correr Museum | 11.73 | 12.45 | 33.71 | 26.73 | 10.23 | 11.48 | 7.88 |
| Glass Museum | 6.61 | 5.39 | 1.12 | 1.44 | 10.23 | 8.78 | 3.89 |
| Ca’ Rezzonico | 4.95 | 5.48 | 12.13 | 23.53 | 10.23 | 9.48 | 2.98 |
| Ca’ Pesaro | 3.03 | 5.89 | 8.31 | 14.72 | 10.23 | 10.45 | 1.89 |
| Natural History M. | 3.11 | 5.62 | 11.24 | 0.59 | 10.23 | 7.44 | 1.64 |
| Mocenigo Palace | 0.41 | 3.52 | 6.97 | 0.00 | 5.68 | 8.44 | 0.84 |
| Carlo Goldoni’s H. | 0.86 | 1.46 | 5.17 | 2.46 | 10.23 | 9.60 | 0.33 |
| Clock Tower | 0.40 | 1.33 | 0.00 | 18.74 | 4.55 | 9.67 | 0.44 |
| Lace Museum | 1.29 | 1.07 | 0.00 | 0.00 | 9.09 | 7.47 | 0.50 |
| Fortuny Palace | 1.96 | 7.00 | 1.12 | 3.21 | 9.09 | 7.24 | 1.74 |
| Total | 100.00 | 100.00 | 100.00 | 100.00 | 100.00 | 100.00 | 100.00 |
Table 6.
Results from the first and second stage of the DEA-BSC model (synthetic form).
| First Stage | Second Stage | ||||
|---|---|---|---|---|---|
| Museums | Customer Persp. | Internal Process Persp. | Innov. Persp. | Financial Persp. | DEA Indicator |
| Doge’s Palace | 1.000 | 1.000 | 1.000 | 1.000 | 1.000 |
| Correr Museum | 1.000 | 1.000 | 1.000 | 0.163 | 1.000 |
| Glass Museum | 1.000 | 0.843 | 1.000 | 0.419 | 1.000 |
| Ca’ Rezzonico | 0.657 | 1.000 | 1.000 | 0.113 | 1.000 |
| Ca’ Pesaro | 0.880 | 0.626 | 1.000 | 0.072 | 0.880 |
| Natural History M. | 0.872 | 0.167 | 1.000 | 0.074 | 0.872 |
| Mocenigo Palace | 1.000 | 0.048 | 0.735 | 0.083 | 1.000 |
| Carlo Goldoni’s H. | 1.000 | 0.167 | 1.000 | 0.054 | 1.000 |
| Clock Tower | 1.000 | 1.000 | 0.843 | 1.000 | 1.000 |
| Lace Museum | 1.000 | 0.451 | 0.889 | 0.151 | 1.000 |
| Fortuny Palace | 1.000 | 0.183 | 0.889 | 0.123 | 1.000 |
Table 7.
Decomposition of the global technical efficiency scores of the first stage DEA models into pure technical and scale efficiency.
Table 7.
Decomposition of the global technical efficiency scores of the first stage DEA models into pure technical and scale efficiency.
| Museums | Customer Perspective | Internal Process Perspective | Innovation Perspective | Financial Perspective | |||||||
|---|---|---|---|---|---|---|---|---|---|---|---|
| Doge’s Palace | 1.000 | 0.859 | 0.859 | 1.000 | 1.000 | 1.000 | 1.000 | 1.000 | 1.000 | 1.000 | 1.000 |
| Correr Museum | 1.000 | 0.818 | 0.818 | 1.000 | 0.311 | 0.311 | 1.000 | 1.000 | 0.163 | 0.993 | 0.162 |
| Glass Museum | 1.000 | 0.967 | 0.967 | 0.843 | 0.924 | 0.779 | 1.000 | 1.000 | 0.419 | 0.918 | 0.385 |
| Ca’ Rezzonico | 0.657 | 0.819 | 0.538 | 1.000 | 0.259 | 0.259 | 1.000 | 1.000 | 0.113 | 0.977 | 0.111 |
| Ca’ Pesaro | 0.880 | 0.708 | 0.623 | 0.626 | 0.255 | 0.159 | 1.000 | 1.000 | 0.072 | 0.977 | 0.070 |
| Nat. Hist. M. | 0.872 | 0.690 | 0.602 | 0.167 | 0.974 | 0.162 | 1.000 | 1.000 | 0.074 | 0.970 | 0.072 |
| Mocenigo P. | 1.000 | 0.846 | 0.846 | 0.048 | 0.928 | 0.044 | 0.735 | 0.735 | 0.083 | 0.925 | 0.077 |
| C. Goldoni’s H. | 1.000 | 1.000 | 1.000 | 0.167 | 0.978 | 0.163 | 1.000 | 1.000 | 0.054 | 0.875 | 0.047 |
| Clock Tower | 1.000 | 1.000 | 1.000 | 1.000 | 1.000 | 1.000 | 0.843 | 0.843 | 1.000 | 0.318 | 0.318 |
| Lace Museum | 1.000 | 1.000 | 1.000 | 0.451 | 0.796 | 0.359 | 0.889 | 0.889 | 0.151 | 0.787 | 0.119 |
| Fortuny Palace | 1.000 | 0.684 | 0.684 | 0.183 | 0.907 | 0.166 | 0.889 | 0.889 | 0.123 | 0.948 | 0.117 |
Table 8.
Reference sets of the MUVE museums obtained by the first stage DEA-BSC models for the four perspectives.
Table 8.
Reference sets of the MUVE museums obtained by the first stage DEA-BSC models for the four perspectives.
| Museums | Customer Persp. | Internal Process Persp. | Innovation Persp. | Financial Persp. |
|---|---|---|---|---|
| Doge’s Palace | {DP} | {DP} | {CM} | {DP} |
| Correr Museum | {CM} | {CM} | {CM} | {DP, CT} |
| Glass Museum | {GM} | {DP, CT} | {CM} | {DP, CT} |
| Ca’ Rezzonico | {CM, GM, CGH, FP} | {CR} | {CM} | {DP, CT} |
| Ca’ Pesaro | {CM, MP, CGH, FP} | {CM, CR} | {CM} | {DP, CT} |
| Nat. Hist. M. | {CM, MP, FP} | {DP, CT} | {CM} | {DP, CT} |
| Mocenigo Palace | {MP} | {DP, CT} | {CM} | {DP, CT} |
| C. Goldoni’s H. | {CGH} | {DP, CT} | {CM} | {DP, CT} |
| Clock Tower | {CT} | {CT} | {CM} | {CT} |
| Lace Museum | {LM} | {DP, CT} | {CM} | {DP, CT} |
| Fortuny Palace | {FP} | {DP, CM, CT} | {CM} | {DP, CT} |
Legend: DP: Doge’s Palace, CM: Correr Museum, GM: Glass Museum, CR: Ca’ Rezzonico, CP: Ca’ Pesaro, NHM: Natural History Museum, MP: Mocenigo Palace, CGH: Carlo Goldoni’s House, CT: Clock Tower, LM: Lace Museum, FP: Fortuny Palace.
Table 9.
Output improvements (percentage) that can be obtained by projecting each museum onto the efficient frontier for the DEA-BSC models of the different four perspectives in the first stage.
Table 9.
Output improvements (percentage) that can be obtained by projecting each museum onto the efficient frontier for the DEA-BSC models of the different four perspectives in the first stage.
| Museums | Customer Persp. | Internal Process Persp. | Innovation Persp. | Financial Persp. | ||||
|---|---|---|---|---|---|---|---|---|
| Visitors | Members | Website Visit. | Visitors | Conservation Cost | Aggr. Sust. Ind. | Pers. Training | Income | |
| Doge’s Palace | 0.0 | 0.0 | 0.0 | 0.0 | 0.0 | 0.0 | 15.3 | 0.0 |
| Correr Museum | 0.0 | 0.0 | 0.0 | 0.0 | 0.0 | 0.0 | 0.0 | 512.2 |
| Glass Museum | 0.0 | 0.0 | 0.0 | 18.7 | ** | 0.0 | 30.8 | 138.5 |
| Ca’ Rezzonico | 52.1 | 52.1 | 52.1 | 0.0 | 0.0 | 0.0 | 21.1 | 782.5 |
| Ca’ Pesaro | 13.6 | 13.6 | 13.6 | 63.3 | 59.8 | 0.0 | 9.9 | ** |
| Nat. Hist. M. | 15.9 | 14.6 | 14.6 | 499.5 | ** | 0.0 | 54.3 | ** |
| Mocenigo P. | 0.0 | 0.0 | 0.0 | ** | * | 80.0 | 36.0 | ** |
| C. Goldoni’s H. | 0.0 | 0.0 | 0.0 | 500.3 | 632.5 | 0.0 | 19.6 | ** |
| Clock Tower | 0.0 | 0.0 | 0.0 | 0.0 | 0.0 | 125.0 | 18.7 | 0.0 |
| Lace Museum | 0.0 | 0.0 | 0.0 | 121.6 | * | 12.5 | 53.8 | 563.8 |
| Fortuny Palace | 0.0 | 0.0 | 0.0 | 446.9 | 446.9 | 12.5 | 58.7 | 713.1 |
Legend: * initial value equal to 0; ** improvement higher than 1000%.
Table 10.
Results of the super-efficiency DEA-BSC model for both the first and second stages.
| First Stage | Second Stage | ||||
|---|---|---|---|---|---|
| Museums | Customer Persp. | Internal Process Persp. | Innov. Persp. | Financial Persp. | DEA Indicator |
| Doge’s Palace | 5.593 | 5.593 | 1.000 | 9.881 | 1.000 |
| Correr Museum | 2.622 | 1.197 | 1.080 | 0.163 | 1.000 |
| Glass Museum | 1.110 | 0.843 | 1.000 | 0.419 | 1.000 |
| Ca’ Rezzonico | 0.657 | 1.020 | 1.000 | 0.113 | 1.000 |
| Ca’ Pesaro | 0.880 | 0.626 | 1.000 | 0.072 | 0.880 |
| Natural History M. | 0.872 | 0.167 | 1.000 | 0.074 | 0.872 |
| Mocenigo Palace | 1.156 | 0.048 | 0.735 | 0.083 | 1.000 |
| Carlo Goldoni’s H. | 3.163 | 0.167 | 1.000 | 0.054 | 1.000 |
| Clock Tower | infeas. | infeas. | 0.843 | infeas. | 1.000 |
| Lace Museum | 1.219 | 0.451 | 0.889 | 0.151 | 1.000 |
| Fortuny Palace | 1.381 | 0.183 | 0.889 | 0.123 | 1.000 |
Table 11.
Efficiency measures computed at the second stage: DEA, super-efficiency, mean, and diamond efficiency scores.
Table 11.
Efficiency measures computed at the second stage: DEA, super-efficiency, mean, and diamond efficiency scores.
| Museums | DEA Efficiency Score | DEA Super- Efficiency Score | Mean Efficiency Score | Diamond Efficiency Score D |
|---|---|---|---|---|
| Doge’s Palace | 1.000 | 1.000 | 1.000 | 1.000 |
| Correr Museum | 1.000 | 1.000 | 0.791 | 0.582 |
| Glass Museum | 1.000 | 1.000 | 0.815 | 0.646 |
| Ca’ Rezzonico | 1.000 | 1.000 | 0.693 | 0.436 |
| Ca’ Pesaro | 0.880 | 0.880 | 0.645 | 0.373 |
| Natural History M. | 0.872 | 0.872 | 0.528 | 0.223 |
| Mocenigo Palace | 1.000 | 1.000 | 0.467 | 0.161 |
| Carlo Goldoni’s H. | 1.000 | 1.000 | 0.555 | 0.242 |
| Clock Tower | 1.000 | 1.000 | 0.961 | 0.921 |
| Lace Museum | 1.000 | 1.000 | 0.623 | 0.349 |
| Fortuny Palace | 1.000 | 1.000 | 0.549 | 0.248 |
© 2020 by the authors. Licensee MDPI, Basel, Switzerland. This article is an open access article distributed under the terms and conditions of the Creative Commons Attribution (CC BY) license (http://creativecommons.org/licenses/by/4.0/).
Share and Cite
MDPI and ACS Style
Basso, A.; Funari, S. DEA-BSC and Diamond Performance to Support Museum Management. Mathematics 2020, 8, 1402. https://doi.org/10.3390/math8091402
AMA Style
Basso A, Funari S. DEA-BSC and Diamond Performance to Support Museum Management. Mathematics. 2020; 8(9):1402. https://doi.org/10.3390/math8091402
Chicago/Turabian StyleBasso, Antonella, and Stefania Funari. 2020. "DEA-BSC and Diamond Performance to Support Museum Management" Mathematics 8, no. 9: 1402. https://doi.org/10.3390/math8091402
Note that from the first issue of 2016, this journal uses article numbers instead of page numbers. See further details here.