1. Introduction
Solar radiation is critical to human life and health, but in recent years, significant progress has been made to also understand the pathological effect of UV radiation from erythema, delayed tanning, photo-immunosuppression, photoaging, and photo-carcinogenesis.
Although life on earth would be impossible without the sun (which helps to give light, heat, and energy), fossil data show that all life on earth originated in the sea and that life on earth became possible only when the ozone layer covered the earth. Life became possible thanks to two different systems of nature protection: The ionosphere, which reflects X-rays into space, and the ozone layer, which absorbs the shortest UV rays. Therefore, from the beginning, life has always been linked to photoprotection [
1].
The idea of sunscreen products was born in 1918 when Norman Paul recommended the use of ZnO as sunscreen in the Australian outback, assuming the first association between sun exposure and skin cancer in a book, published in the same year, but which was largely ignored until the early 1930s when the first sunscreen was developed industrially. Since then, the chemistry of sun filters has evolved into molecules that, if applied in the correct formulation, give an end product with excellent cosmetic properties, photo-stability, and total protection in the UVA/UVB region [
2].
Several skin diseases are linked to excessive exposure to UV rays, among which photo-dermatosis is one of the most important. This disease includes a group of skin diseases exacerbated by solar radiation and can be classified into four groups: Immunologically-mediated photo-dermatosis, drug- and chemical-induced photosensitivity, photodermatosis with deficient DNA repair, and aggravated photodermatosis [
1,
3]. It is common practice to use sunscreen for the management of photodermatosis, and many studies have evaluated its efficacy in polymorphous light eruption (PLE), lupus erythematosus (LE), and sun urticaria (SU), with a real benefit [
1].
Another skin dermatological problem related to UV radiation is photo-carcinogenesis. A 5-year study with an 8-year follow-up showed that the use of sunscreen can have a prolonged preventive effect against the development of squamous cell carcinoma and perhaps even a minimal benefit against the development of basal cell carcinoma [
1,
4].
Finally, UVA radiation plays an important role in photoaging and immunosuppression; in fact, even the sub erythematous dose of UV is sufficient to cause these diseases. Photoaging is triggered by receptor-initiated signaling, mitochondrial DNA mutations, protein oxidation, and telomere-based DNA damage responses. In addition, DNA photolesion, ROS (reactive oxygen species), NO (nitric oxide), uronic acid, PGE2 (prostaglandin E2), IL-10 (interleukin-10), and PAF (platelet aggregation factor) are all involved in immunosuppression [
1,
4].
Minerals such as zinc oxide (ZnO) and titanium dioxide (TiO
2) are usually used as inorganic physical sunscreens in sunscreens. This class of filters is often preferred to organic filters (organic molecules with an aromatic group) due to advantages such as limited skin penetration, absence of skin irritation and sensitization, inertia of ingredients, and broad-spectrum protection [
5]. Cosmetic pleasantness of product containing these filter class depends on the whitening effect which is inversely correlated to their size. Nanoparticles, and generally nano-objects, with dimensions in the nanoscale may be more biologically reactive than materials in microscale because of their higher surface area. These are the reasons why the use of nanosized ZnO and TiO
2 particles increased recently and the safety of cosmetics containing nano-ingredients (in particular sunscreen) are particularly discussed in these years [
6].
ZnO and TiO
2 are well known as semiconductor photocatalysts extensively used in heterogeneous photocatalysis to destroy environmental pollutant. When photoactivated by UV light, these metal oxides generate high oxidizing radicals (·OH and O
2−) and other reactive oxygen species (ROS), H
2O
2 and singlet oxygen (
1O
2) well known as cytotoxic and/or genotoxic agents [
7].
Very recently, the practice of adding a specific additive class called “boosters” in sunscreens has been proposed in order to enhance the UV ray protection, reducing the quantity of physical and organic filter. This substance class can increase the filter’s shielding performance, with a consequent increase of the SPF [
8]. In the meantime, the use of boosters may be used to decrease sun filter molecules, addressing issues related to damages to the marine environment such as coral de-coloration and so on.
From a chemical point of view, the booster effect can be obtained in a different manner; depending on the action mechanism, it is possible to distinguish between optical boosters and photochemical boosters. The first ones are based on variations in the indices of refraction of materials or in improving their dispersion; the latter are based on interactions with the energy states of classic filters [
8].
Thus, there may be different kinds of boosters [
9]: (1) Emollients, which have the ability to disperse the filters in a more effective and stable way; (2) polymers, such as acrylic or polyvinylpyrrolidone copolymers, which improve the thixotropic behavior of the emulsion, giving it better distribution on the skin and maintaining a thin and homogeneous layer on the skin; (3) coating of filtering substances to increase the number of light passages through films with different refractive indexes (multilayer filter effect), bead that increase the particle diameter of the nano-filters contained inside, also reducing their photo-reactivity; (4) hollow spheres that are empty spherical particles with a different refractive index than the polymeric shell and act as a UV scattering center; and finally (5) quencher, that are non-filtering substances that break down the various excited states of the filters, which are essential for stabilizing the filtering system over time.
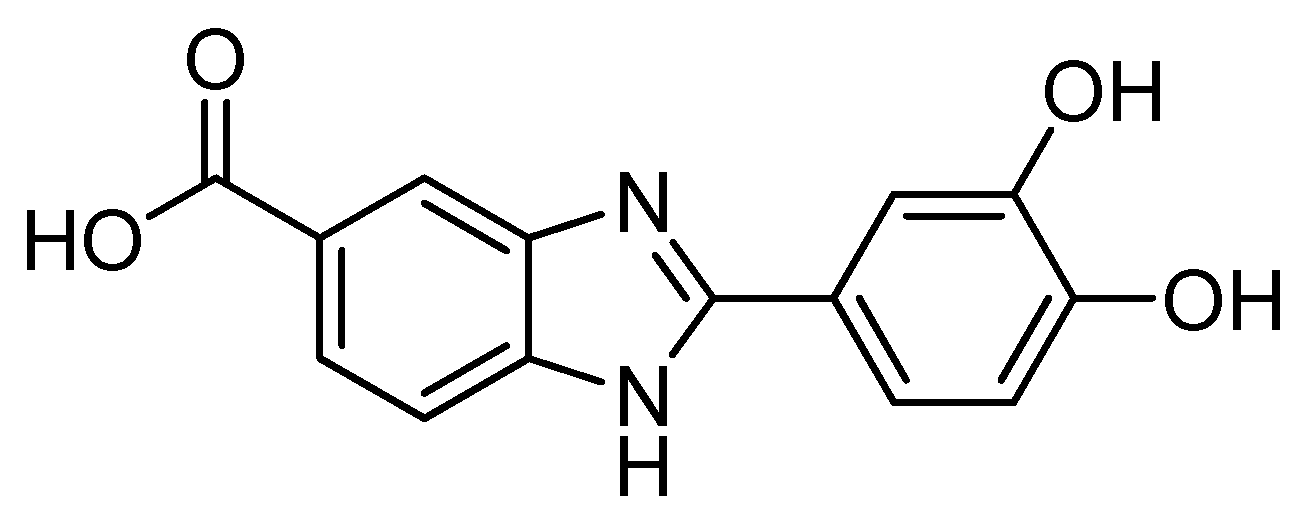
Dihydroxyphenyl benzimidazole carboxylic acid (Oxisol, University of Ferrara European Patent EP2800741) (
Figure 1) is the representative of an interesting new class of UV boosters provided with a powerful radical scavenger profile [
9]. Oxisol is devoid of any significant UV-filtering activity, but has an unattended UV-filtering booster capability on well-known UVB and UVA filters (both organic and inorganic) [
9].
Figure 2 efficiently describes the particularity of the Oxisol molecule. If compared with other booster classes, it results the only molecule with both antioxidant activity and optical properties.
However, during our studies, the association of Oxisol and physical UV filters (p-UVf) (TiO
2 and ZnO) showed some limitations, including a pH range of application that can influence antioxidant activity and color change. As already reported by Nakayama [
10], the functionalization of mineral oxide surface leads to an increased suspension stability, and can also act on the photocatalytic activity by improving the light adsorption mechanisms. Furthermore, zinc anti-acne properties have been well known for a century, but zinc is experiencing a second youth during recent years because of the great attention from people for natural products. It is so considered an emerging alternative acne treatment to reduce possible adverse effects of antibiotics, and in view of
Cutibacterium acnes (
C. acnes) strains developing resistance to conventional antibiotics. The exact mechanism is not clear, but a combination of different effects is supposed. In fact, zinc is considered to act directly on microbial inflammatory equilibrium and facilitate antibiotic absorption when used in combination. Furthermore, topical zinc alone, as well as in combination with other agents, could be effective because of its anti-inflammatory activity and ability to reduce
C. acnes counts by inhibition of
C. acnes lipases and free fatty acid levels. Finally, another proposed mechanism is directly linked to a suppression of sebum production by its antiandrogenic activity [
11].
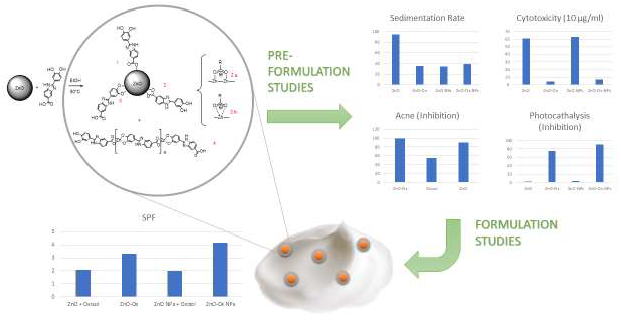
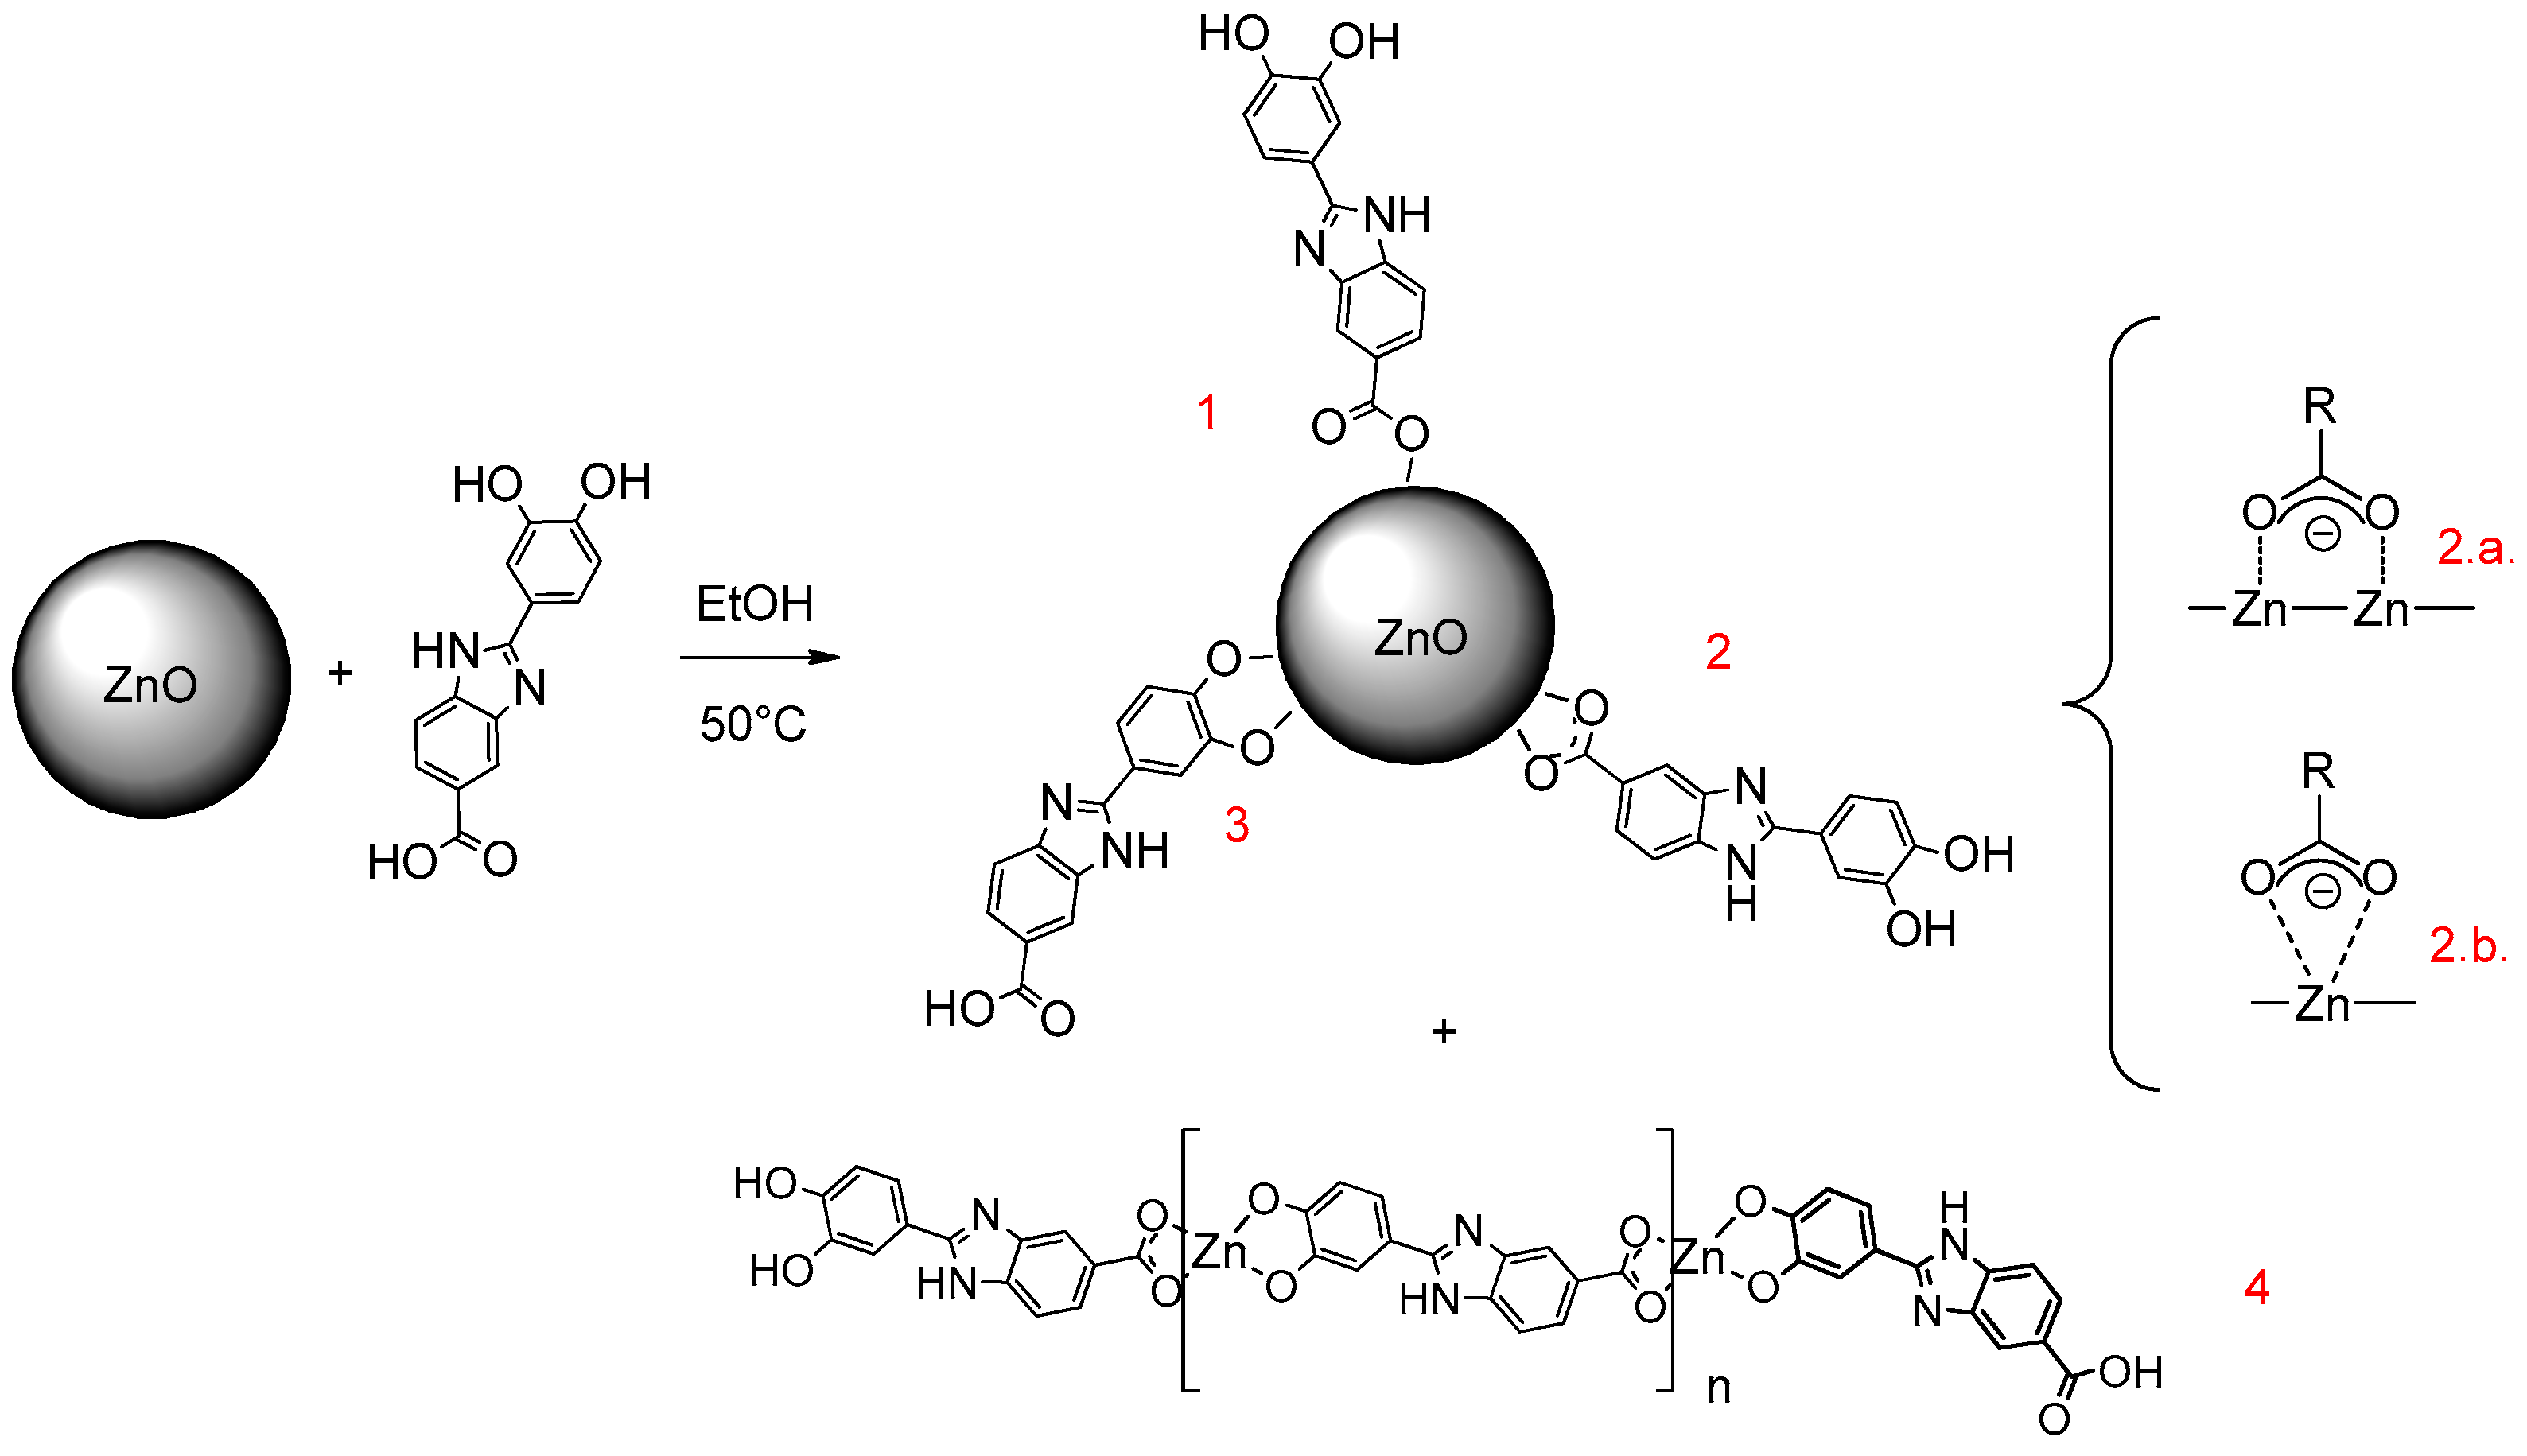
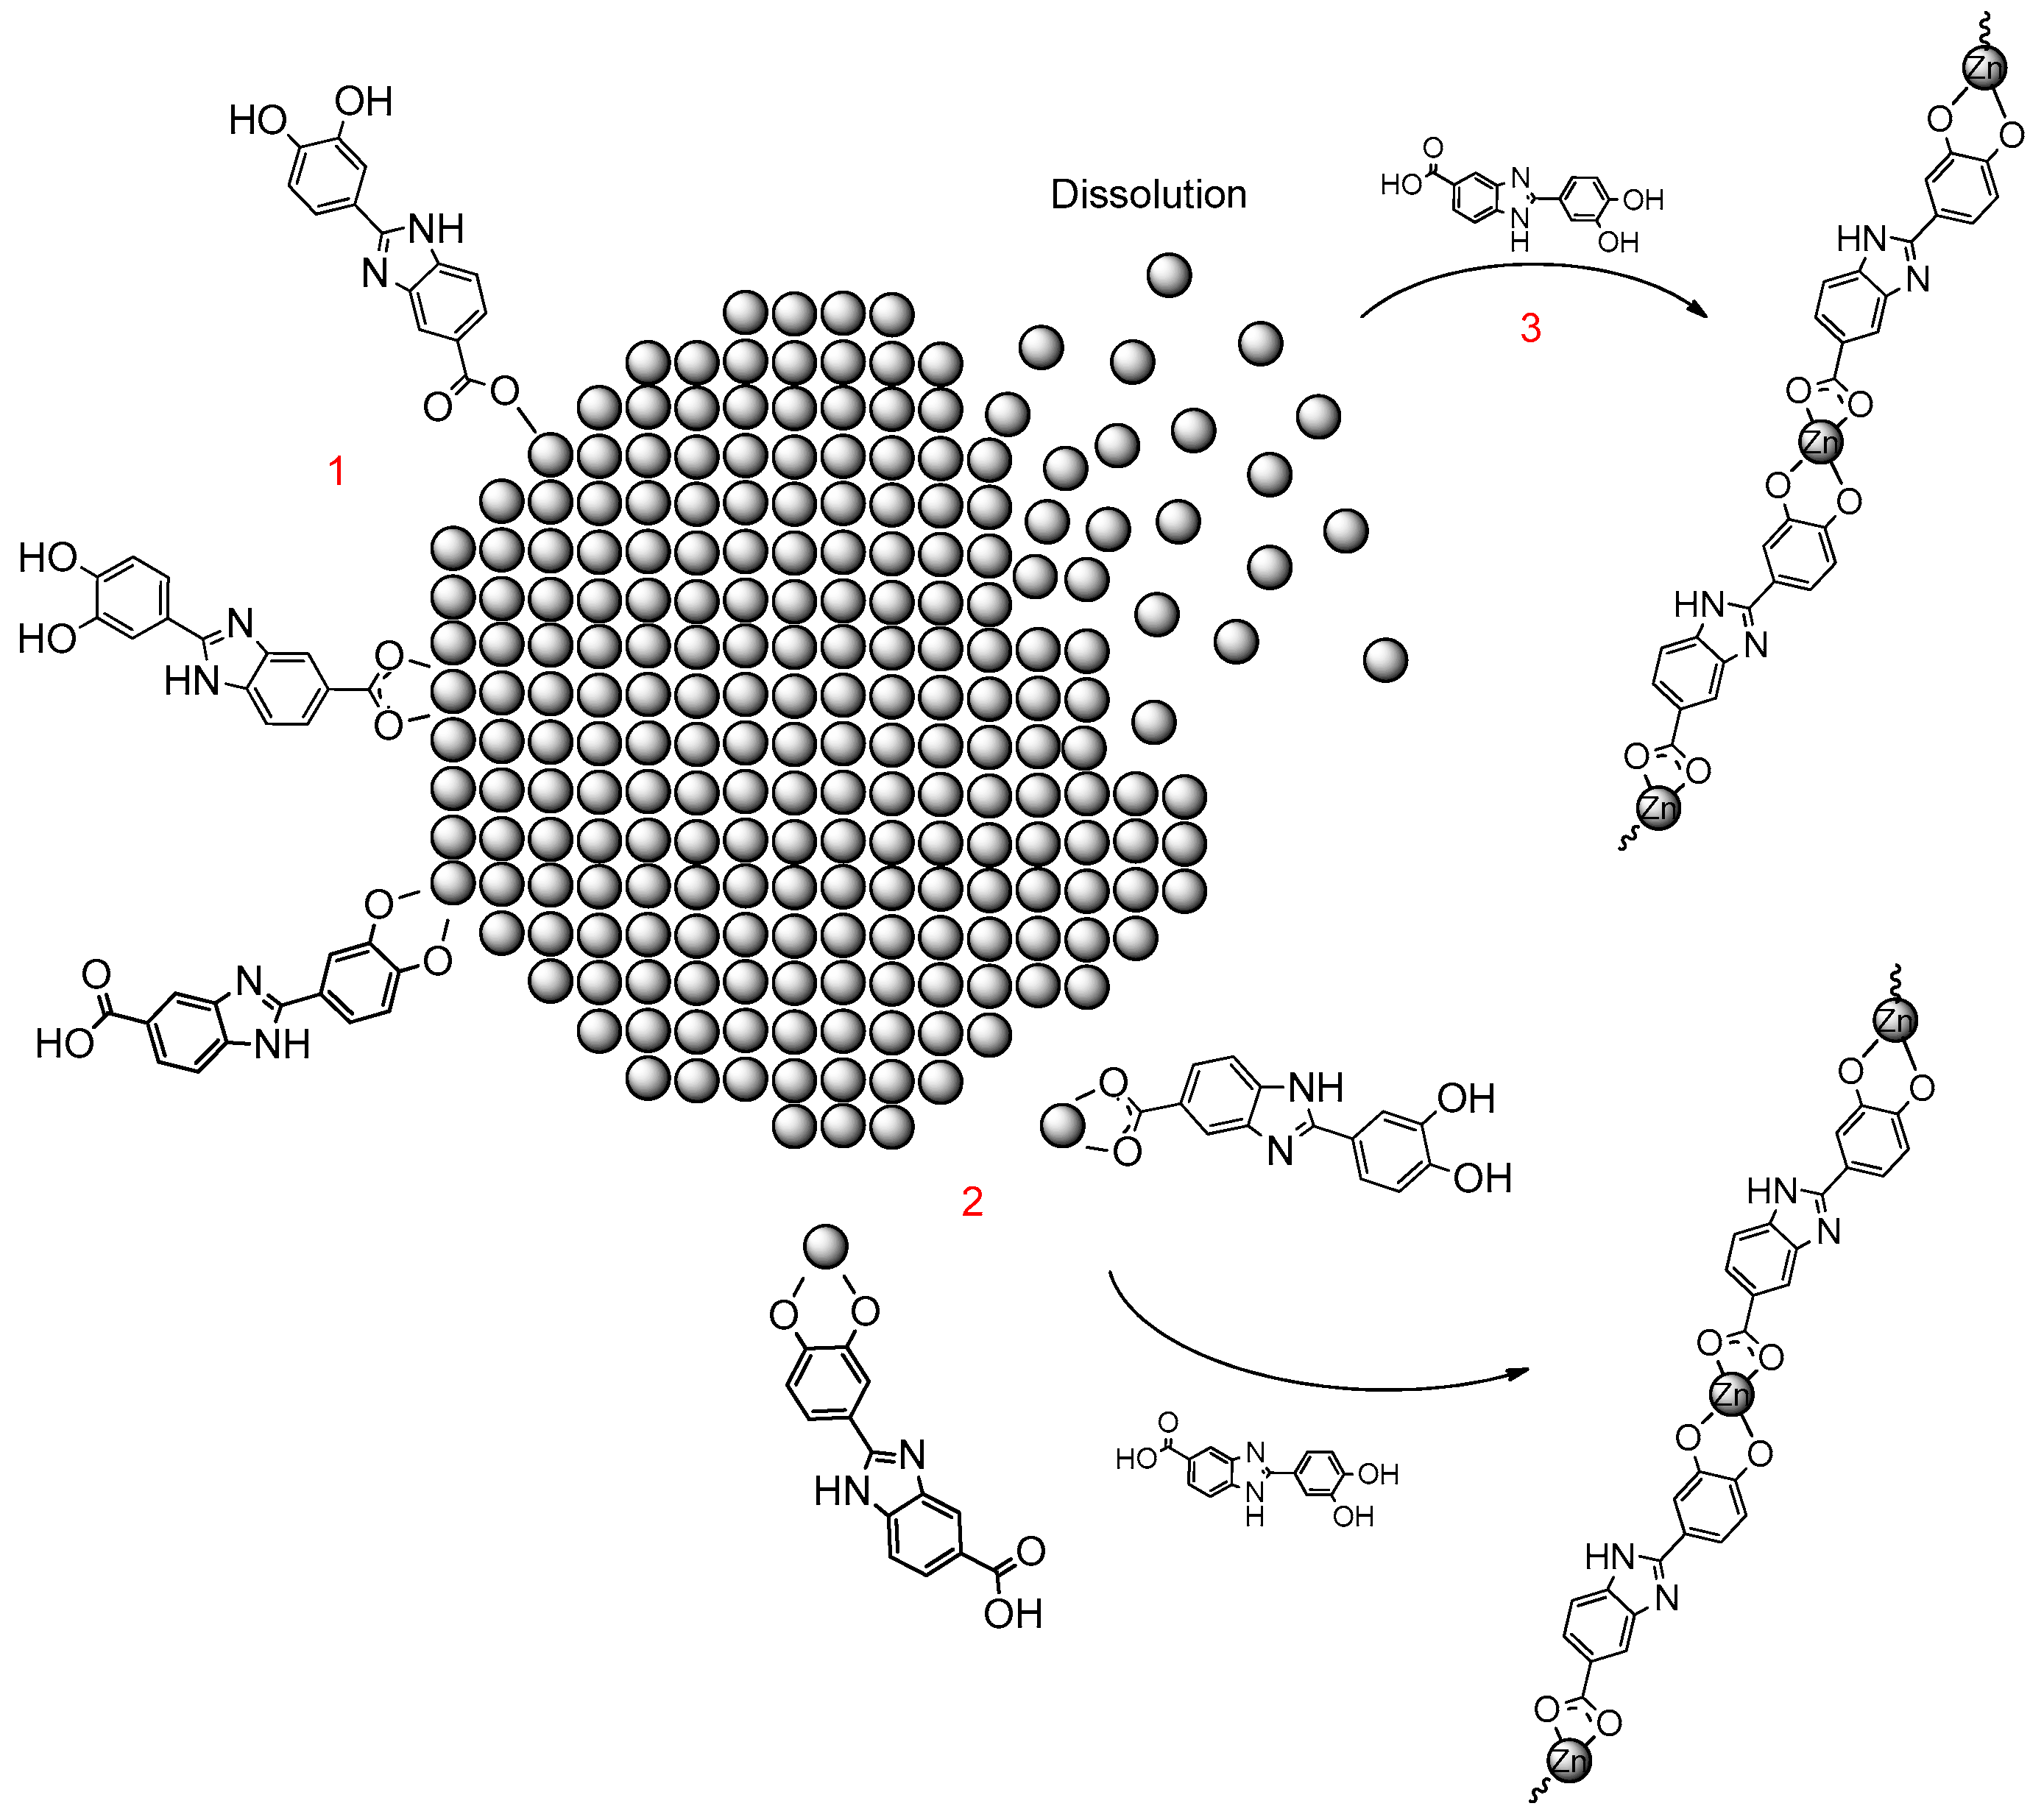
Taking all of this into account, in the present work, we investigated the performance on UV protection and radical scavenging activity of a molecular combination between ZnO and Oxisol (
Figure 3) in order to explore possible advantages of covalently bonded booster and filter over the simple mixture. To this aim, a complete characterization was carried out also exploring the biological properties of the obtained adduct. Furthermore, to compare the unattended cytotoxicity observed, a Zn
2+ complex was also prepared and tested in order to explore possible influences of the biological behavior of this cation.
3. Materials and Methods
3.1. Materials
Zinc oxide (EverZinc, Liège, Belgium), Oxisol (Kalichem, Brescia, Italy), Acid Blue 9 (Farmalabor, Milan, Italy), Ethanol BioUltra, for molecular biology, ≥99.8% (absolute alcohol, without additive) (Sigma-Aldrich, Saint Louis, MO, USA), physiological solution 0.9% NaCl (S.A.L.F. Spa, Bergamo, Italy), UV-Vis spectrophotometer Jasco V-730 (Jasco, Mary’s Court, Easton, MD, USA), FT-IR spectrophotometer ATR FT-IR Jasco 4600, ATR PRO ONE (Jasco, Mary’s Court Easton), Centrifuge RE.MI XS R-8D (REMI, Mumbai, India), Turboemulsifier Silverson® L5M-A (Silverson®, Evry, France), Viscosimeter Brookfield DV2T (Brookfield, Toronto, Canada), Densimeter Mettler Toledo DA-100M (Mettler Toledo, Columbus, OH, USA), Plaster 5 × 5 (Leukofix, Hamburg, Germany), Magnetic stirrer (Heidolph, Schwabach, Germany), SHIMADZU UV-2600 spectrophotometer provided of integrating sphere ISR 2600 60 mm, WW5 PMMA plates (Schonberg GmbH, Munich, Germany), Suntest CPSþ (Atlas, Linsengericht, Germany), LUMiSizer® (L.U.M.GmbH, Berlin, Germany), Nicomp ZLS Z3000 (PSS, Port Richey, FL, USA). Netzsch 409/C (Gebrüder-Netzsch-Straße 1995100 Selb, Germany), Nicomp ZLS Z3000 (8203 Kristel Circle, Port Richey, FL, USA), Zeiss Sigma VP Field Emission SEM (Oberkochen, Germany), ICP–MS NexION 350D (Perkin Elmer, Waltham, MA, USA), Discover SP-D oven (CEM Corporation, Matthews, NC, USA).
3.2. Zinc Oxide (ZnO) Functionalization: ZnO–Ox
This reaction was carried out on both nanometric and non-nanometric ZnO. In a 250 mL two-neck flask, 0.269 g of Oxisol was solubilized in ethanol with a bubble condenser, maintaining the temperature around 50 °C. After having wrapped the flask with tinfoil (to avoid photocatalytic reactions), the physical filter was added, and the mixture left under stirring for at least 1 h. The reaction was monitored via UV-Vis spectroscopy and characterized by IR.
3.3. Synthesis of Zn2+–Oxisol Complex
The synthesis was based on the method of Singh et al. [
25]. In a 250 mL two-necked flask, 0.5 g of Oxisol was solubilized in water with 2 equivalents of NaOH. After complete solubilization, 3 equivalents of ZnCl
2 was added (0.757 g). A pale brown precipitate was observed. After 24 h of reaction, we proceeded with centrifugation and exsiccation.
3.4. Evaluation of Stability of Oxisol–ZnO Particles
To start, 0.01 g of ZnO was placed in a 100 mL flask and brought up to volume with ethanol, ethanol/water (2:3) in a mixture with different pH (2.7, 6.1, 12), and water with pH 2.7, 6.1, and 12. The system was then stirred continuously and spectrophotometrically monitored to perform the leaching test at 30-min intervals for 4 h. At each time, 0.5 mL of solution was taken, centrifuged, filtered with a 0.45 micron filter, and diluted directly in the cuvette to 3 mL with the appropriate solvent.
3.5. Sedimentation Rate
In order to check the stability of the dispersed system, the multi-sample analytical centrifuge LUMiSizer
® (L.U.M. GmbH, Berlin Germany) was used. The different behaviors of the single samples can be compared and analyzed in detail by detecting the transmission variation in any part of the sample or by tracing the movement of any phase limit [
26]. Each sample was analyzed in triplicate, at a concentration of 10 mg/L. The analysis was carried out by placing the sample in a polycarbonate cuvette. The measurement parameters were set at a speed of 2000 rpm at 470 nm of laser wavelength and 600 profile numbers were detected every 10 s.
3.6. Zn Release from the Zinc-Based Materials (ZnO–Ox and Zn@Oxisol)
Stock solution of each Zn-based material was prepared and probe sonicated for 5 min. Aliquots of these suspensions were diluted in five different media (pH 3, 5, 7, 9, 12, and DMEM), obtaining samples with initial concentration of 10 mg L
−1. These suspensions were stirred by a bench shaker at 400 rpm and an aliquot at different timing (0, 6, 24, and 48 h) was collected in PP vials and centrifuged at 18,407 RCF for 40 min following the procedure described by Wang et al. [
27]. Then, the clear supernatants were carefully collected and acidified with 2% nitric acid and analyzed through ICP–MS.
3.7. Digestion Analysis (ICP–MS)
The Zn content of each Zn base material was measured by means of ICP–MS (NexION 350D, Perkin Elmer), after a microwave acidic mineralization using a Discover SP-D oven (CEM Corporation). According to Badetti and co-workers [
28], about 20 mg of dry samples was treated with a mixture of ultrapure H
2O
2 and HNO
3 in a 1:2 ratio. The heating program used for the acid digestion was: T
MAX = 170 °C, ramp time = 5 min, hold time = 2 min, power = 300 W. Afterwards, the samples were cooled down for 30 min at room temperature, properly diluted, and analyzed by ICP–MS.
3.8. Photocatalysis
The photocatalytic activity was performed by monitoring the degradation following UV radiation of Acid Blue 9 mixed with pure metal oxide and coated metal oxide [
17,
18,
19], both in conditions of light and darkness, in order to remove the contribution of dye adsorption and compared with the solution of Acid Blue 9 in the same conditions. Two identical solutions were prepared consisting of 10 mg of photocatalytic material in 100 mL of Acid Blue 9 0.77 mM in EtOH: One mixture was exposed to UV radiation (360–400 nm), the other was placed in conditions of darkness. At the end of this 1-h passage, the sample was left to rest for 3 h, subsequently centrifuged and filtered (0.45 micron), before proceeding with the UV-Vis analysis (628 nm).
3.9. Formulation
The study was carried out on different emulsions. The formulations containing Oxisol had a minimum percentage of 0.5% (to consent a booster effect), when either mixed or functionalized (ZnO–Ox). O/W emulsions were prepared using a turbo emulsifier; for this operation, the Turboemulsifier Silverson® L5M-A (Silverson®, Evry, France) was used.
Each study product used the same base formulation in order to minimize errors. The formulations compositions are as follows:
Phase A: Steareth-21, Steareth-2, glyceryl monostearate, cetearyl alcohol, benzyl alcohol–dehydroacetic acid, coco-caprylate, dihydroxyphenylbenzimidazole carboxylic acid (Oxisol) (when required);
Phase B: Nanometric ZnO or non-nanometric ZnO, or nanometric ZnO–Ox or non-nanometric ZnO–Ox;
Phase C: Panthenol, NaOH, xanthan Gum, aqua.
The base formulation was prepared by mixing the ingredients of phase A, except for the preservation system (benzyl alcohol–dehydroacetic acid), Oxisol (when required), and coco-caprylate, then heating until melting. Phase C was prepared separately with the addition of 90% of water, brought to 80–90 °C, and mixing until complete solvation of the xanthan gum. When 80 °C was reached for each phase, phase C was added to A, stirring continuously. The base thus obtained was maintained at 70 °C before proceeding with functionalization, which was carried out differently depending on the formulation:
(1) Formulations without Oxisol: To the coco-caprylate was added the powder of phase B, then proceeded to mix with force until obtaining a homogeneous dispersion. Under continuous mixing, the obtained dispersion was gradually added to the base formulation, until a homogeneous emulsion was obtained. Finally, the remaining water was added until homogenization.
(2) Formulation containing Oxisol alone or as ZnO–Ox: The powder of phase B was mixed with coco-caprylate, as reported in point (1). Oxisol was solubilized separately in water by quenching with NaOH. The powder dispersion was then added to the base formulation, under continuous mixing, and finally the Oxisol solution was also added.
The pH and viscosity of each preparation were evaluated. The pH of the emulsions was adjusted within a range of 5.5–6.5. If required, the pH was corrected with the addition of citric acid (
Table 13).
3.10. Characterization
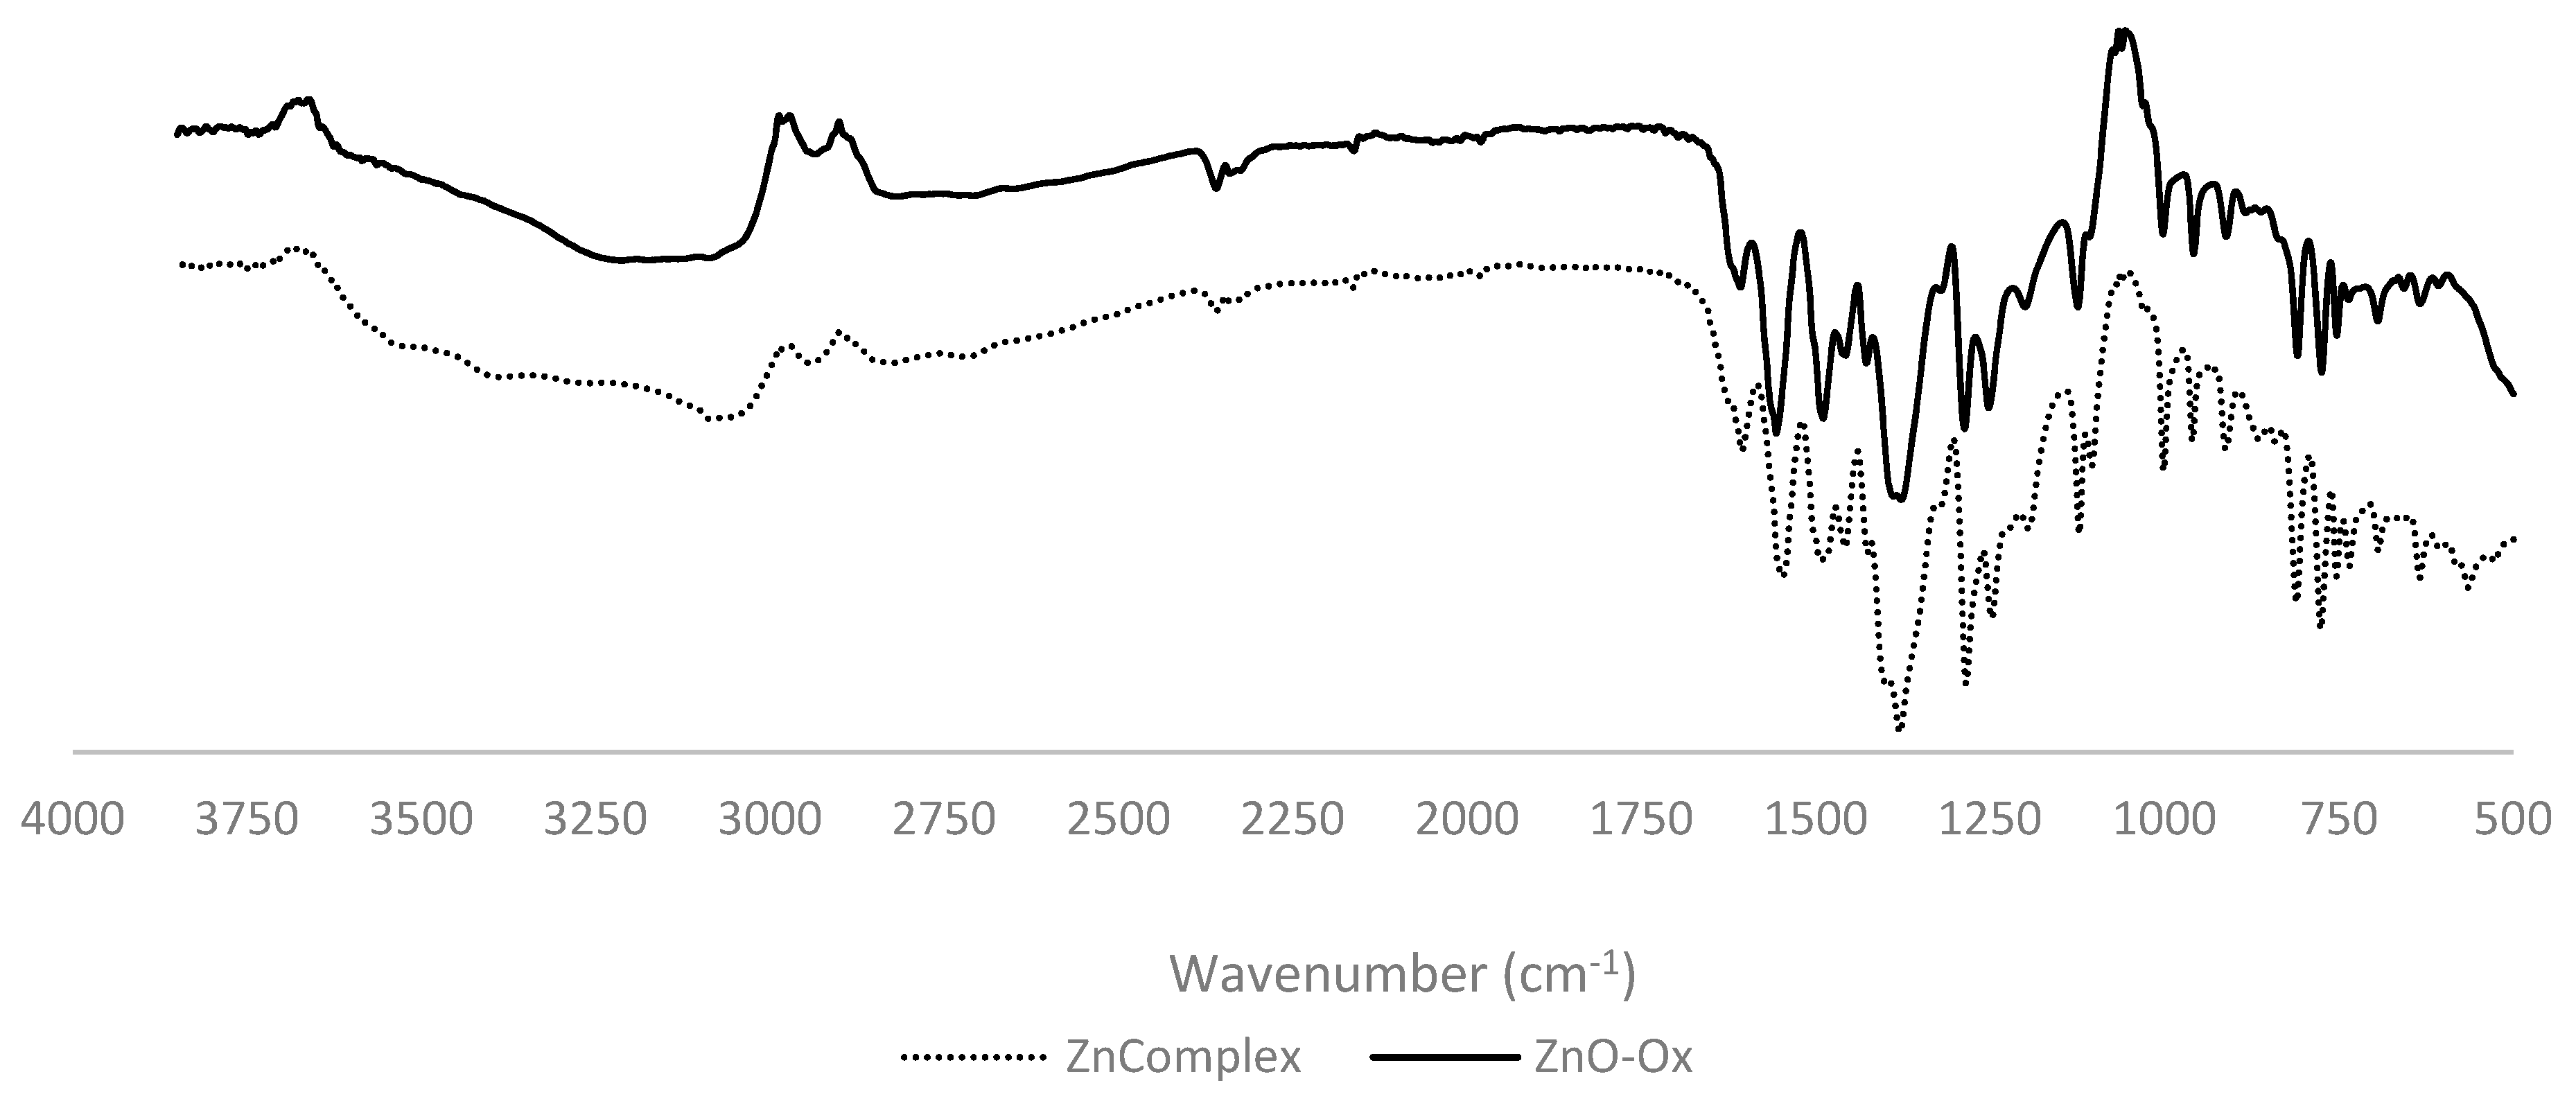
3.10.1. FT-IR Analysis
The FT-IR spectra were collected in the 4000–650 cm−1 range, with a resolution of 5 cm−1 at room temperature by using a Jasco FT/IR-4600 spectrometer provided with single ATR accessory (Jasco ATR PRO ONE). The number of accumulated scans for each recorded spectrum was automatic, with an average exposure around 1.5 min.
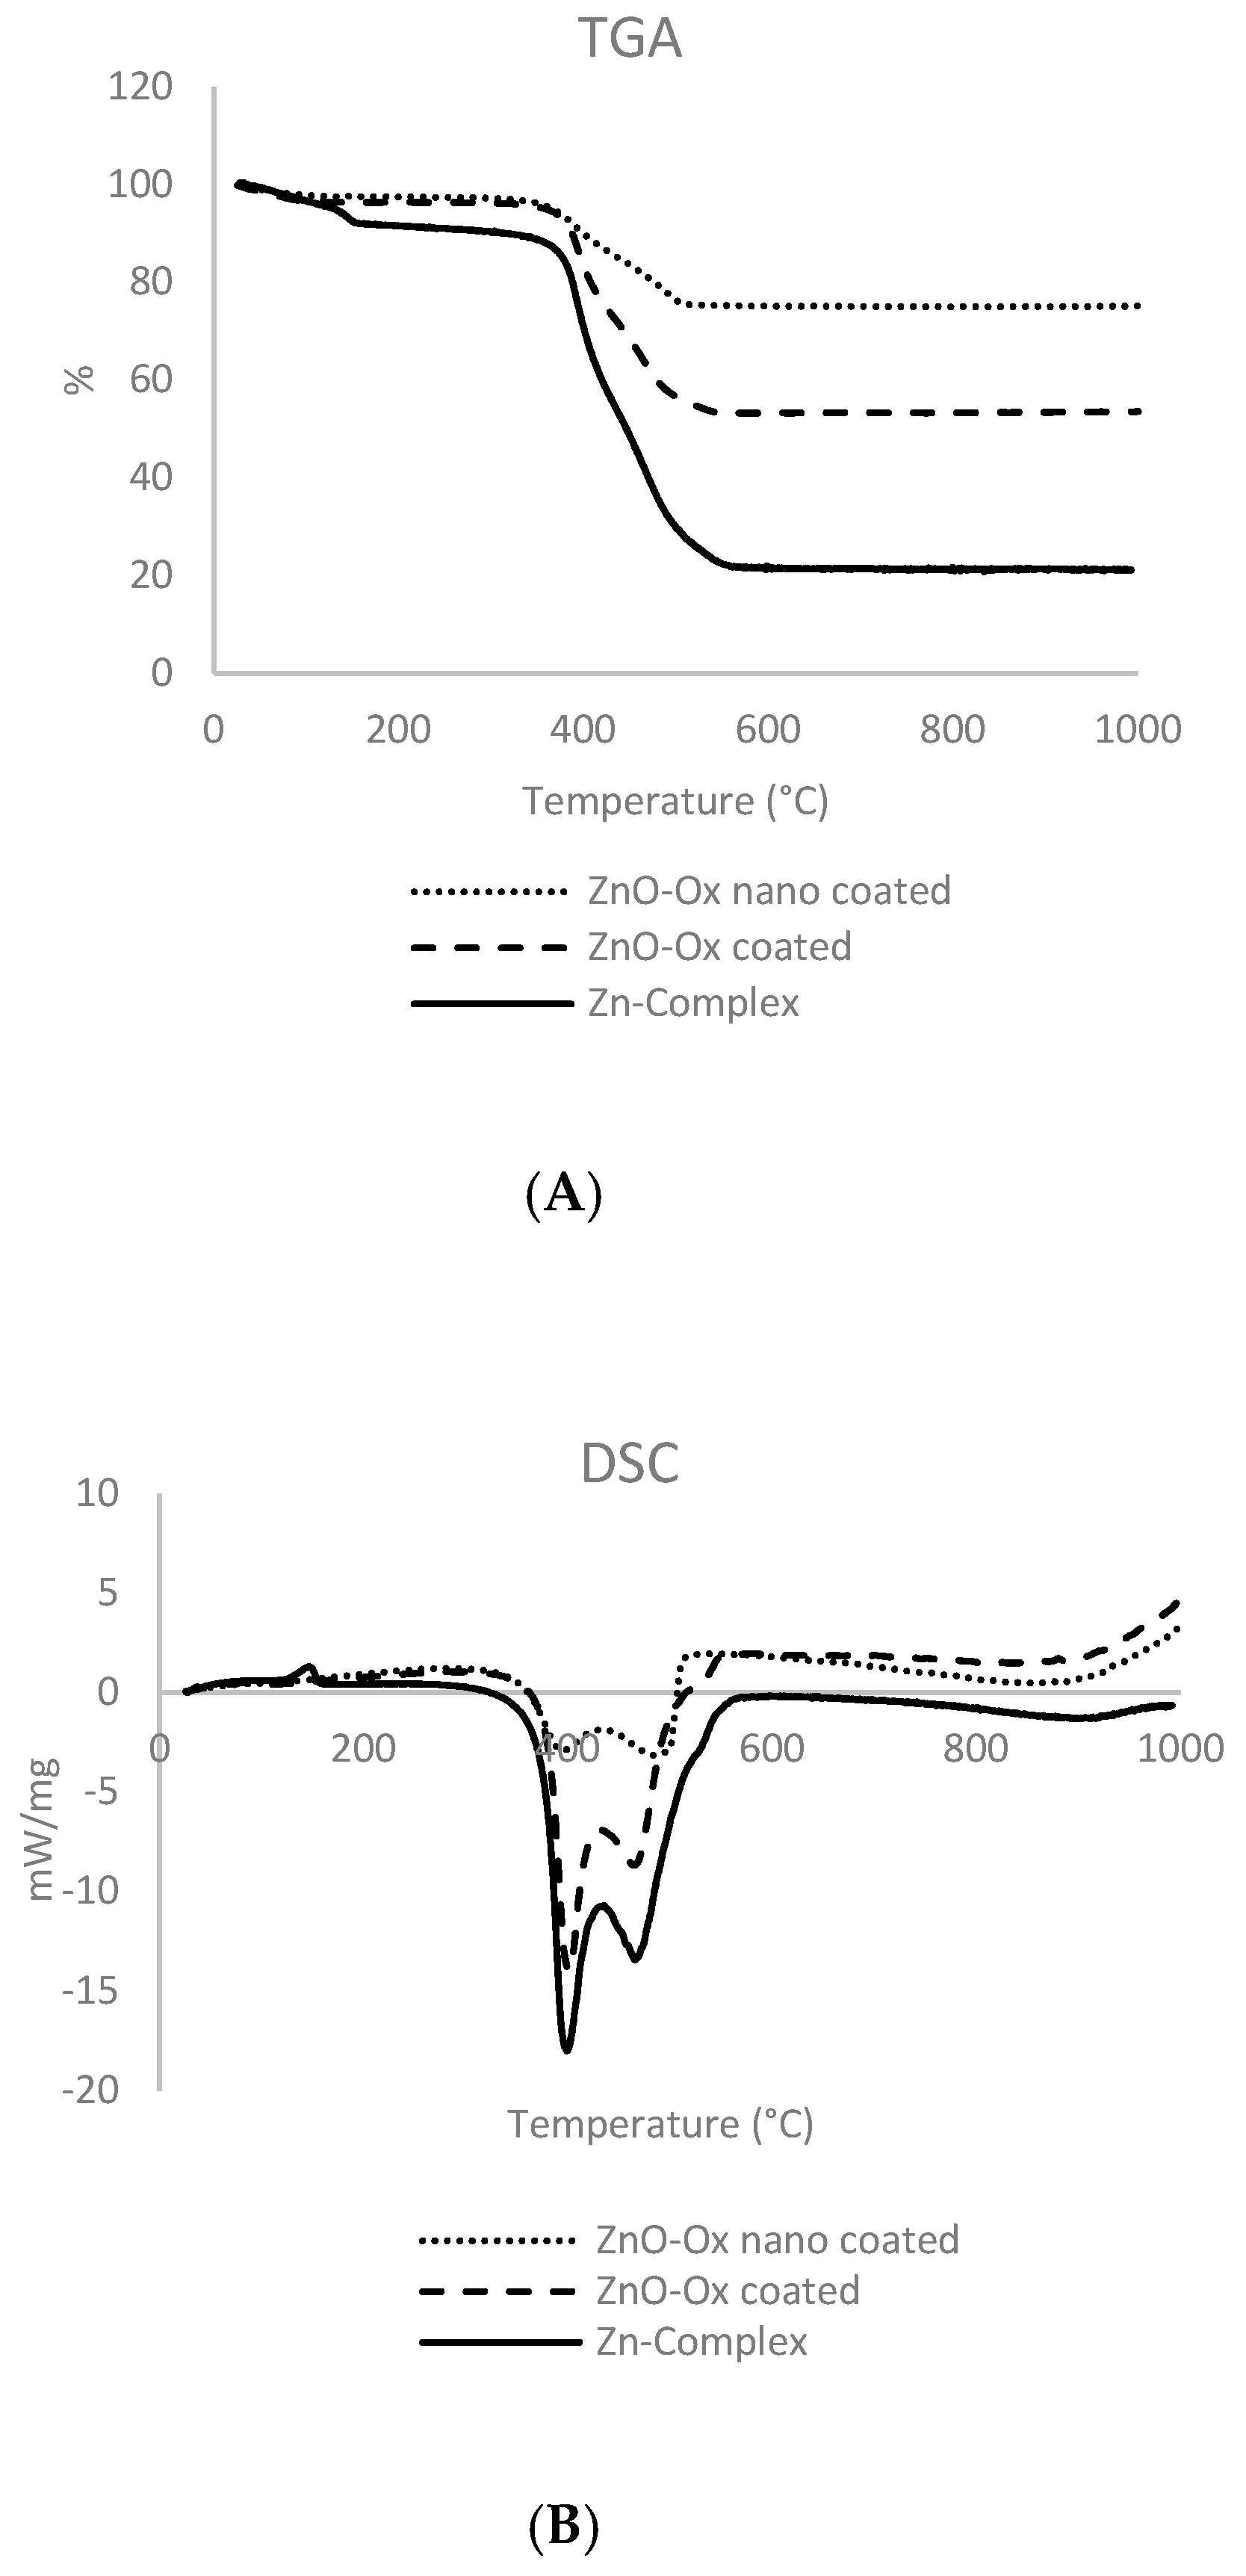
3.10.2. Thermo-Gravimetric Analysis (TGA) and Differential Scanning Calorimetry (DSC)
TGA and DSC were performed simultaneously with Netzsch 409/C. The heating program included an increase from 30 to 1000 °C, with an increase of 5 °C min−1. About 15 mg of each sample was placed in a platinum/rhodium crucible using alumina for internal calibration. Measurements were performed in air/N2 mixture (40/80 mL/min).
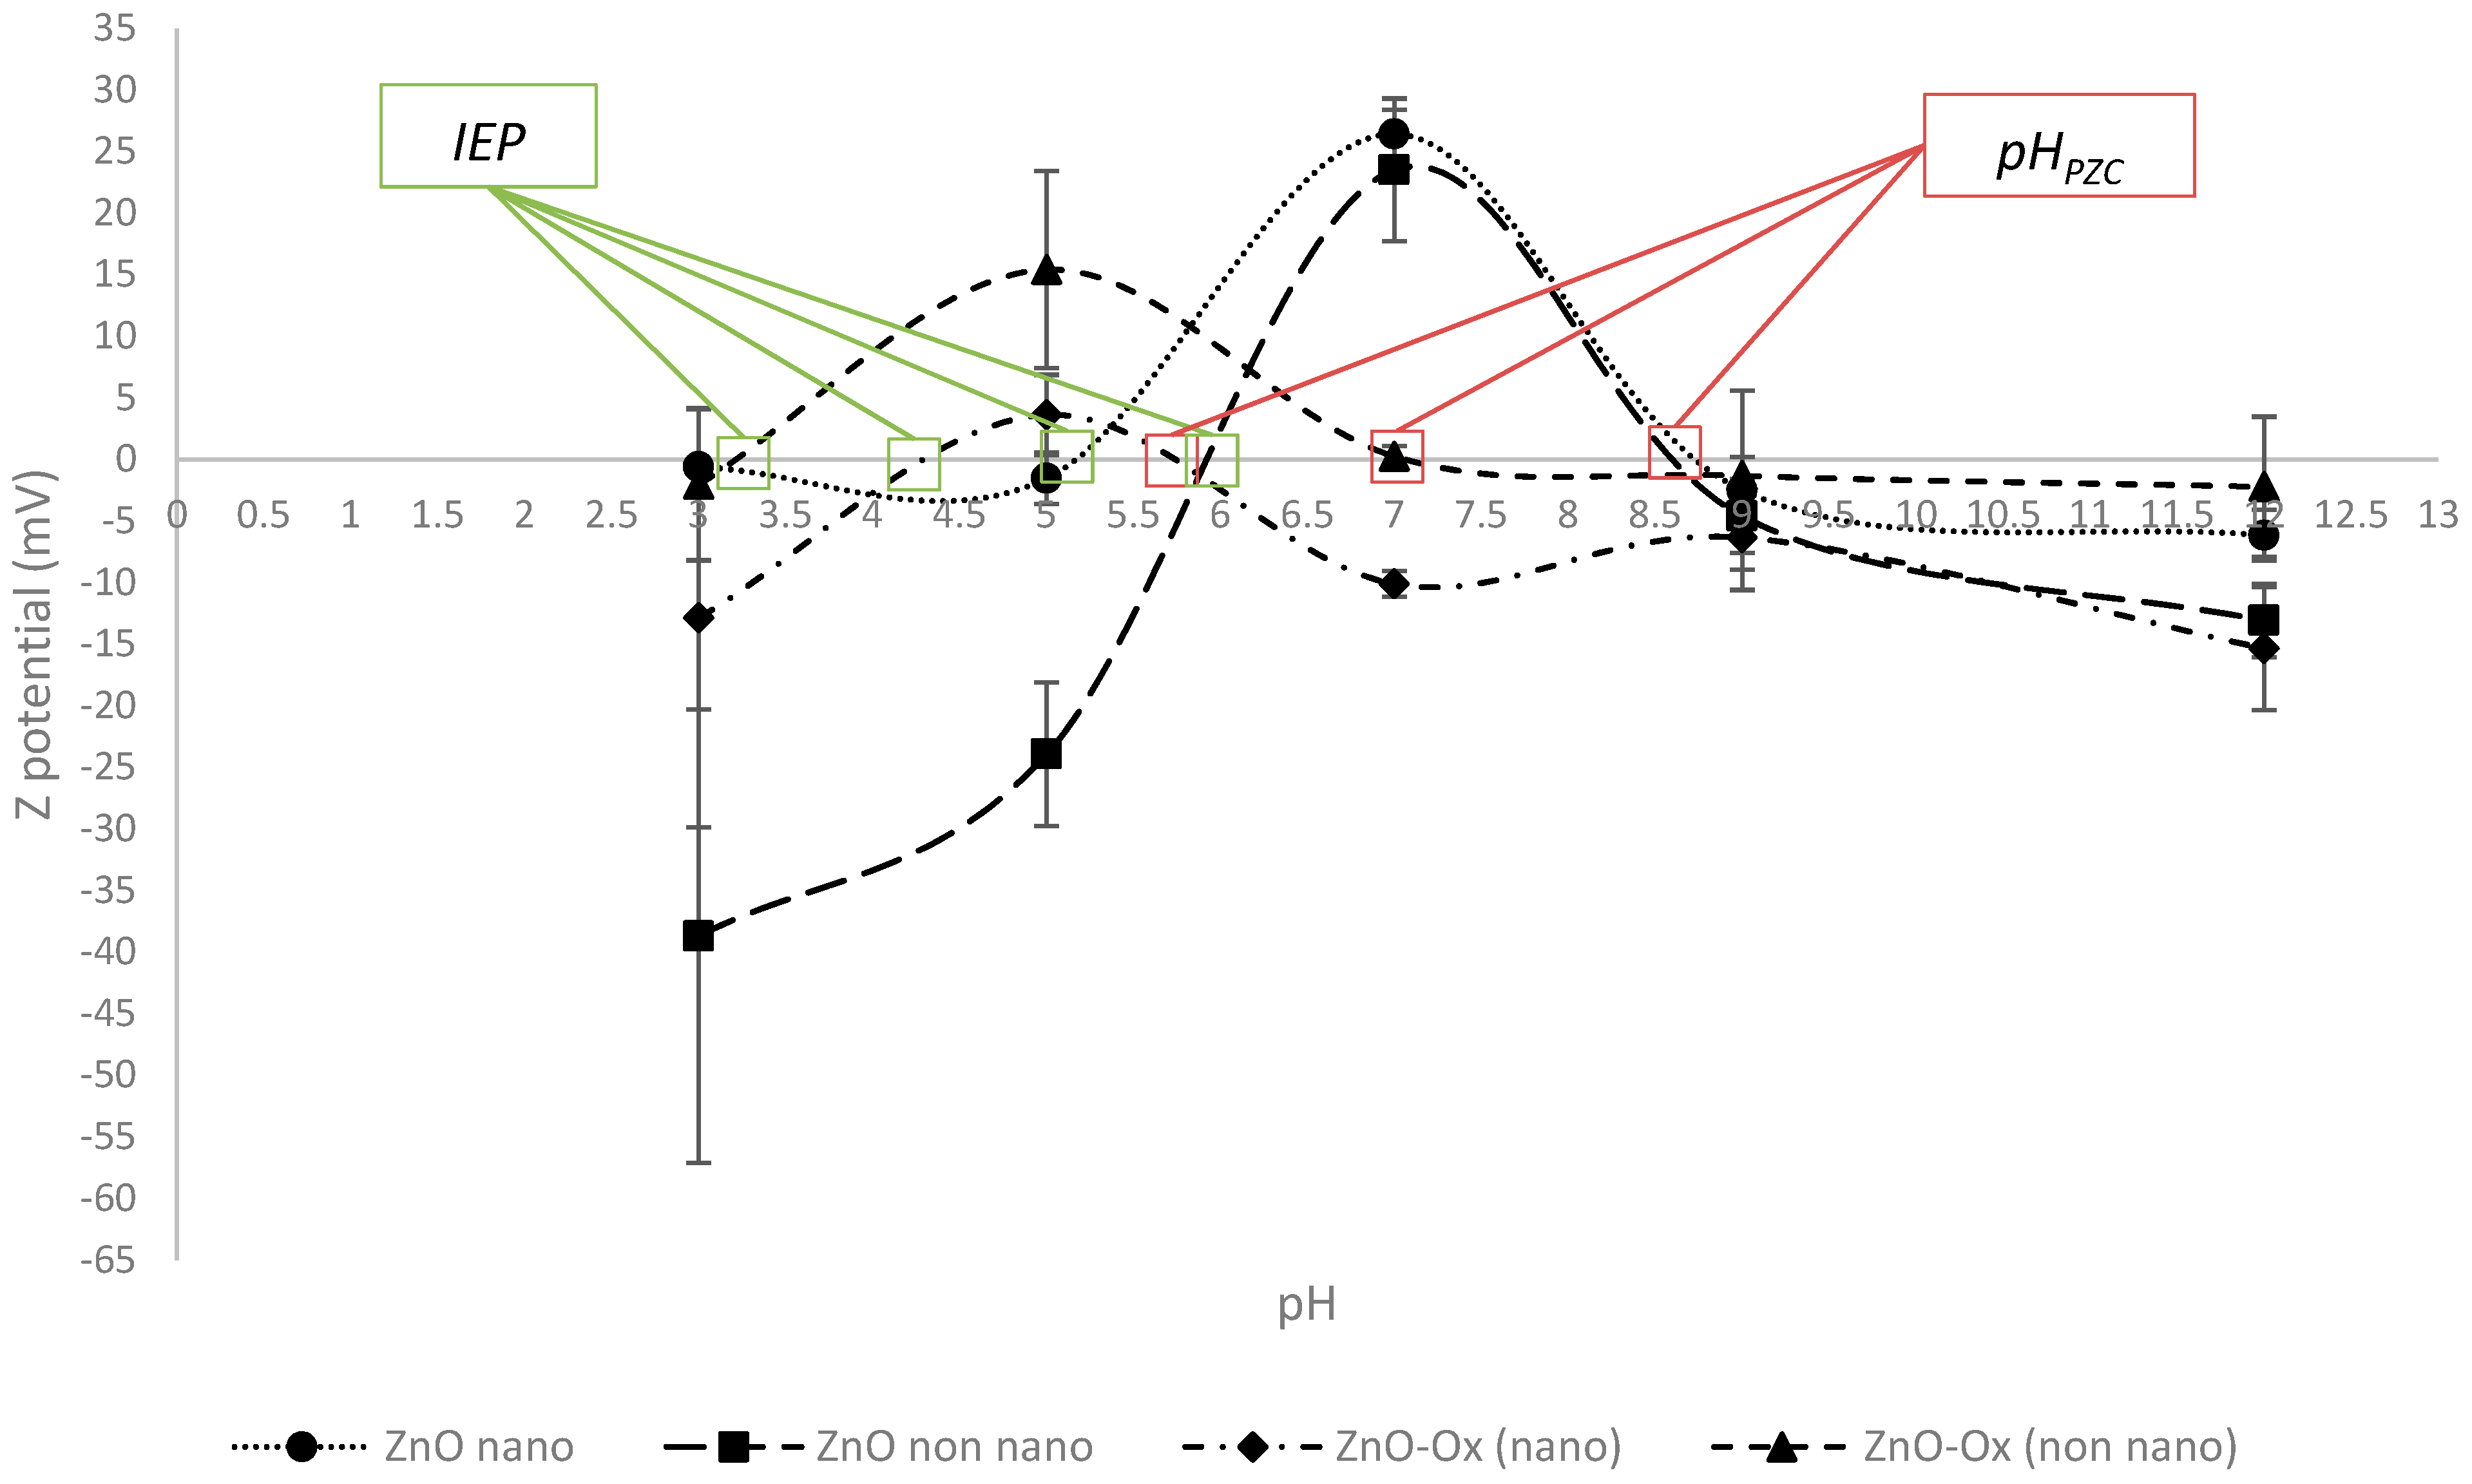
3.10.3. ζ Potential (DLS–ELS)
The hydrodynamic diameter was measured by means of a multi-angle Nicomp ZLS Z3000. The dried powders were dispersed again in ultrapure water (10 mg/L) by probe sonicating in ice bath for 10 min (80% pulsed mode, 200 W). All measurements were taken after a 5-min pre-balance. The dispersion light was collected with an optical fiber set at a dispersion angle of 90° (W = 25 mW and λ = 639 nm) for at least 6 min at room temperature.
The potential zeta characterization by electrophoretic light scattering (ELS) was achieved by Nicomp ZLS Z3000 (PSS, Port Richey, FL, USA). The zeta potential values (Z-pot) of each sample were determined in a range of pH 3–11, using NaCl as electrolyte (10 mM), as reported by Brunelli et al. [
29].
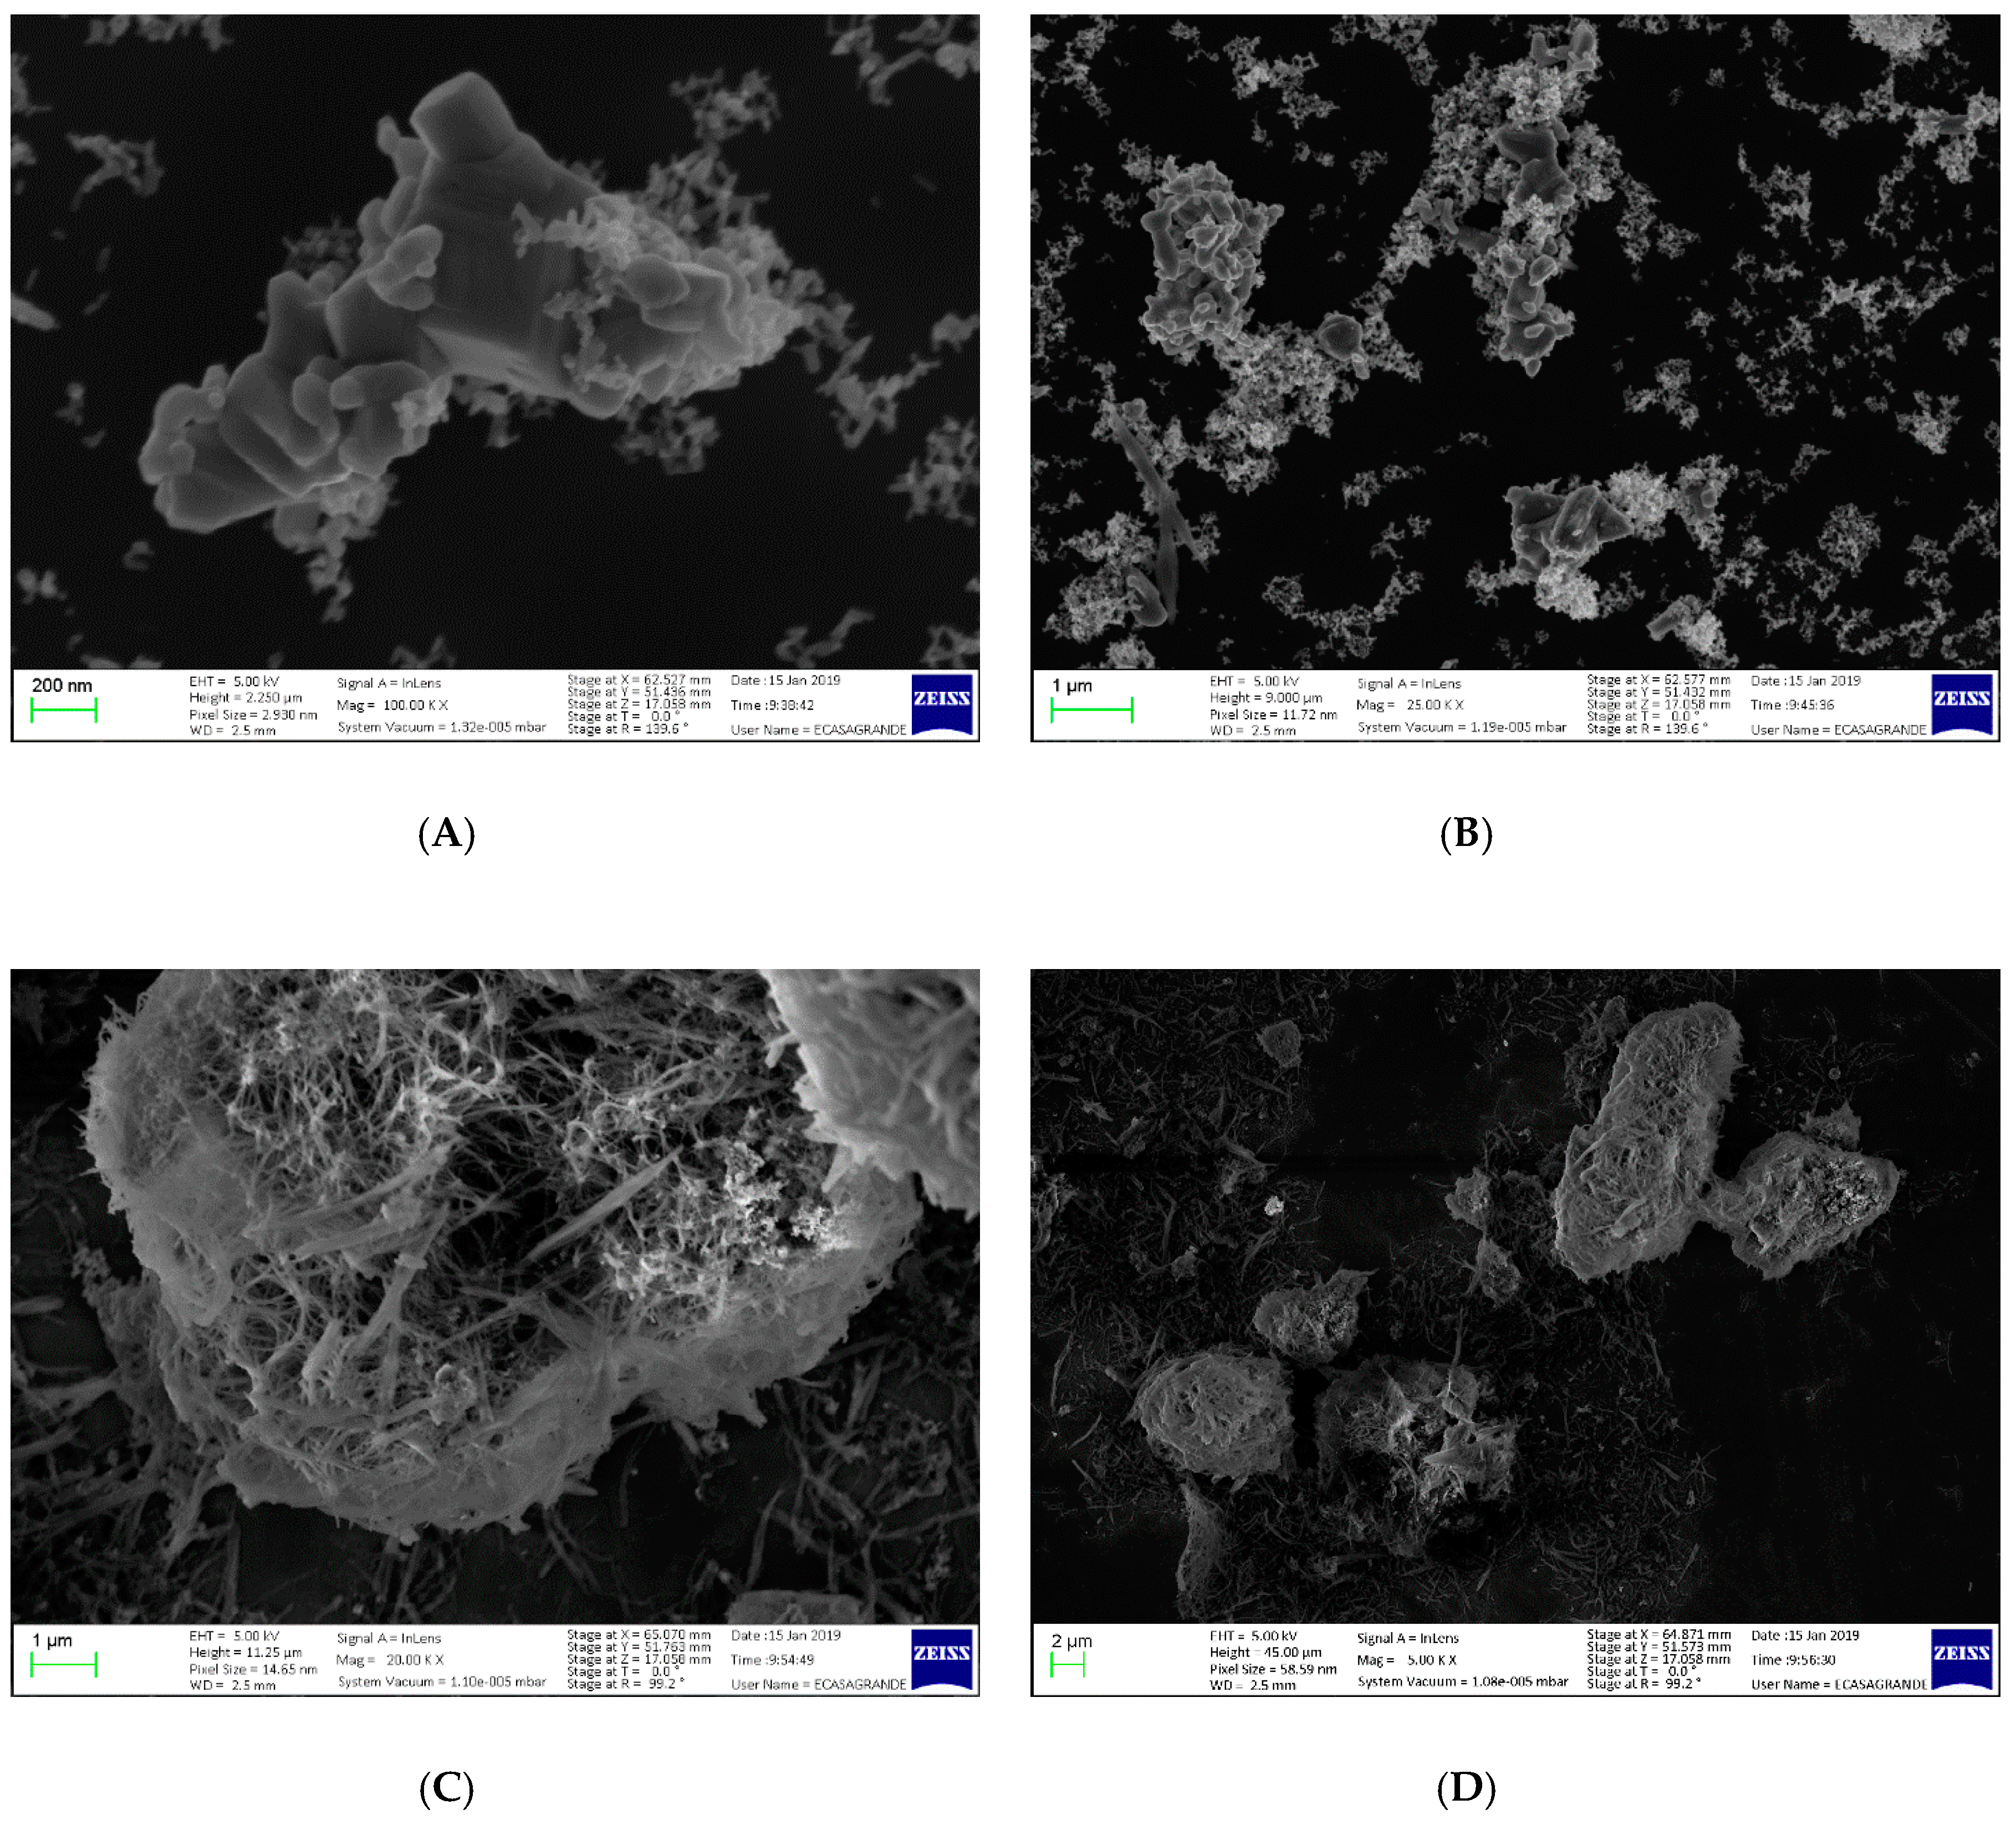
3.10.4. SEM
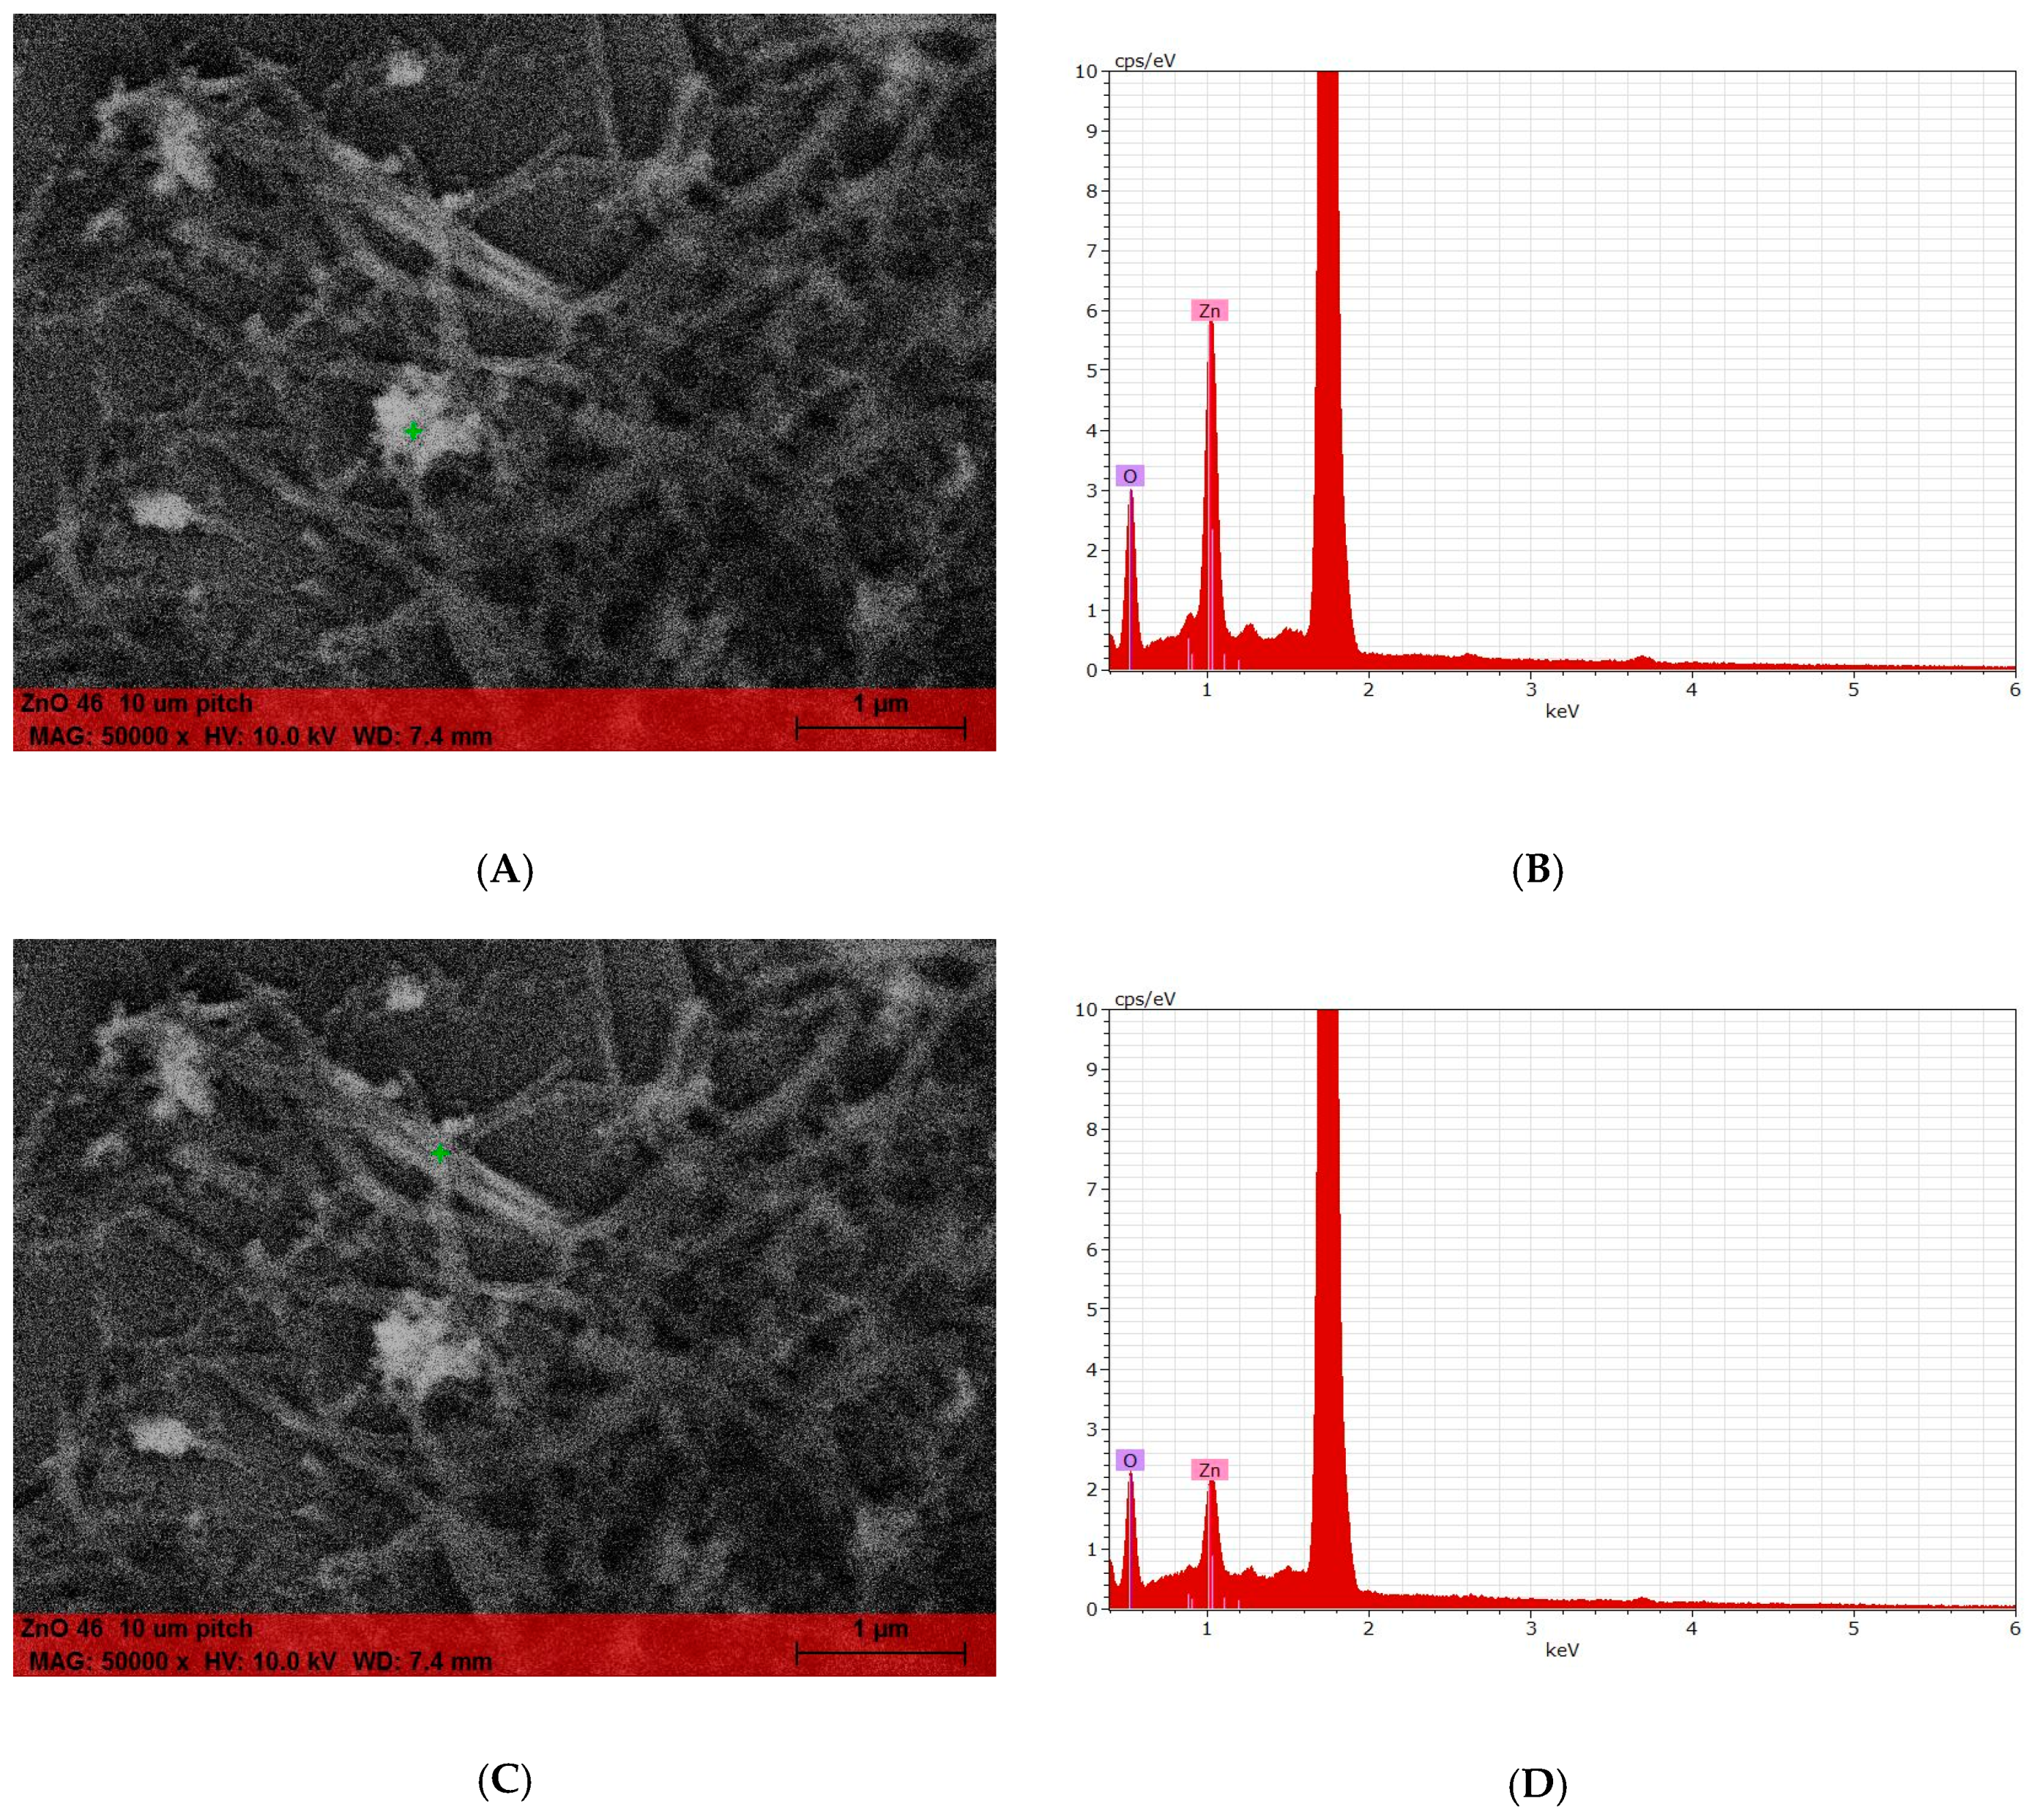
The materials were suspended in EtOH (0.1–0.5 mg/mL final concentration) and probe sonicated. About 3 μL of the suspension was deposited on a silicon wafer substrate and dried at 60 °C for 12 h. Images were collected in high vacuum with a Zeiss Sigma VP Field Emission SEM, using an in-lens detector at 5.0 keV beam energy. The elemental composition of a sample was determined using characteristic X-ray spectrum of the specimen being examined. The EDS analysis was performed in a ‘‘spot mode’’ in which the beam (set at 10 keV) was localized on a single area manually chosen within the field of view. The location was represented on the provided SEM images by a ‘‘+’’. Data was elaborated by means of Bruker Esprit 1.9.
3.11. Cytotoxicity
ZnO cytotoxicity was measured by neutral red dosage (NRU) performed in DMEM (Dulbecco’s Modified Eagle Medium) supplemented with 10% fetal calf serum (FCS), penicillin (100 U/mL), streptomycin (100 μg/mL), and glutamine (2 mM). The cells were seeded in triplicate in 96-well plates with a density of 7–103 cells/well and treated for 48 h with increasing concentrations of the different compounds (1, 10, and 100 μg/mL). Untreated cells were used as a negative control. The cells, after treatment, were washed and added with 250 μL of a solution of 25 μg/mL of NRU. After 2 h, the cells were washed again and 150 μL of NRU-desorb solution (49% water, 50% ethanol 95%, and 1% glacial acetic acid) were added. After another 40 min, the absorbance of the solution at 540 nm was measured by spectrophotometer and converted to % of growth inhibition.
3.12. Anti-Acne Activity: Determination of MIC (Minimum Inhibitory Concentration) and MBC (Minimum Bactericidal Concentration)
Tryptic soy broth (TSBroth) with 5% sheep blood (defibrinated) was used as culture media for the preparation of the bladder suspension and to perform suspension tests. Tryptic soy agar (TSA) with 5% sheep blood (defibrinated) was used to perform surface tests (diffusion agar). The Anaerocult® system was used for 5-da-long anaerobiosis incubation at 37 °C.
The minimum inhibitory concentration of the organism growth, defined as MIC, and the minimum bacterial concentration, defined as MBC, were evaluated in microtiter plates containing a microbial inoculum at a concentration of 106, corresponding to the turbidity of 0.5 Mac Farland, obtained from standard overnight bacteria cultures in TSBroth with 5% sheep blood (defibrinated).
The antimicrobial potency was evaluated by the inhibition of microbial growth (Cutibacterium acnes) on the agarized soil. Acne causing test microorganism Cutibacterium acnes (NCTC 737) was purchased from Public Health England (PHE) Culture collections: Cutibacterium acnes, ATCC 6919.
Nitrocellulose discs (DN) with a diameter of 1.0 cm were placed in contact with each test product for 30 min, dried for 30 s and then placed, sufficiently spaced apart, on plates prepared with agar culture medium previously sown with the microbial suspension test of Cutibacterium acnes.
Finally, the diameter of the inhibition halo of the pathogenic bacteria Cutibacterium acnes was measured, after anaerobic incubation for 5 days at 37 °C.
The suspension method is a quantitative in vitro method for assessing the sensitivity of the microbial strain to a product with antimicrobial activity. The evaluation was carried out via turbidimetry on the microbial suspension. Subsequently, the microbial survival was evaluated via total inclusion microbial count. The product under examination was divided into wells, then contaminated with the known titration of Cutibacterium acnes microbial suspension. The survival of Cutibacterium acnes was evaluated by TSA with 5% sheep blood (defibrinated) plate inclusion method, via incubation, under anaerobic conditions.
In the microtiter plate, each well was prepared with the BROTH enrichment medium with 5% sheep blood (defibrinated), usually 999 μL of soil per well. Then, 1 μL of the antimicrobial activity sample was add into the well. The tests were repeated in triplicate. Once the microtiter plates were prepared, the inoculum with the Cutibacterium acnes was added. The inoculum was prepared using a standard culture developed at +37 °C for 96 h anaerobiosis. The microbial concentration of the inoculum was 1 million per milliliter (corresponding to opacity of 0.5 McFarland, or 1.5 × 10⁶ bacteria).
The seeded microtiter plates were incubated in anaerobiosis for 5 days at +37 °C, in order to evaluate the turbidity of the well as an index of bacterial colony development. Results are defined considering the turbidity of the well, which was used to calculate the MBC value or minimum bactericidal concentration. Each well, corresponding to the dilution test, was subsequently analyzed by the inclusion method in agar and incubated under anaerobiosis conditions for 5 days at +37 °C.
Each test was performed in triplicate and the growth of Cutibacterium acnes bacteria was checked every day of anaerobic incubation until the end of the incubation time.
3.13. Oxisol Release from the Emulsions
Approximately 0.30 g of emulsion weighed exactly was placed in a 50 mL flask, brought to volume with physiological solution and left under stirring for 4 h at 37 °C. Then, 10 mL of solution was then quantitatively transferred into a test tube, centrifuged for 10 min at 6000 rpm, and filtered. Lastly, 0.5 mL of this solution was diluted to 3 mL with distilled water directly in the cuvette and analyzed by spectrophotometer.
3.14. Photochemiluminescence (PCL)
The PCL assay measures the antioxidant activity of a sample against superoxide anion radicals generated from luminol, a photo-sensitizer, when exposed to UV light (Double Bore
® phosphor lamp, output 351 nm, 3 mWatt/cm
2), and is based on Popov and Lewin’s method [
30,
31]. Measurements were carried out with a Photochem
® apparatus (Analytik Jena, Leipzig, Germany). The antioxidant activity was measured using Antioxidant Capacity of Liposoluble (ACL) substance kits provided by the manufacturer [
32]. The Luminol reagent and Trolox work solution were freshly prepared according to the ACL protocol. The kinetic light emission curve was monitored for 180 s and expressed as micromoles of Trolox per gram of dry matter. The areas under the curves were calculated using the PCLsoft control and analysis software. A calibration curve was constructed with scalar Trolox concentrations: The different reduction in signal amplitude was used as a parameter for quantification and correlated to the reduction of the integral of PCL intensities caused by the different concentrations of Trolox. The concentration of the individual samples must be such that the luminescence generated during the 180-s sampling interval is within the limits of the standard curve. The results are expressed in micromoles of Trolox
®, which provide an antioxidant capacity equivalent to 1 g of the sample under examination.
3.15. In Vitro Evaluation of Filtering Parameters
The method used in this work was recently proposed by us, adapting the ISO 24443:2012 standard for the determination of UVA protection in vitro to UVB [
33].
In vitro SPF spectrophotometric evaluation was performed measuring transmittance spectrum by a SHIMADZU UV-2600 spectrophotometer provided of integrating sphere ISR 2600 60 mm and coupled with an SPF determination software (SPF calculator software version 2.1, Shimadzu, Milan, Italy) to obtain the values of SPF, UVA/UVB, UVAPF, and λ critical.
The in vitro approach used consisted of applying a thin film of product on an artificial substrate. The physical characteristics of this substrate must be as similar as possible to human skin. For this reason, the substrate used for this study was PMMA plates (WW5 PMMA plates have been purchased from Schonberg GmbH, Munich, Germany), a substrate easily handled and that can be supplied with a 5 μm reproducible roughness, with an area of 25 cm2. Via spectrophotometric measures, the amount of UV radiation passing through the film can be evaluated. Photostability studies were carried out with a solar simulator device (Suntest CPS; Atlas, Linsengericht, Germany) equipped with a Xenon lamp, an optical filter to cut off wavelengths shorter than 290 nm, and an IR-block filter to avoid thermal effects, as prescribed by the ISO 24443:2012 procedure.
3.16. Statistical Evaluations
The analysis comparison was carried out considering p-values that represent the probability of finding the observed, or more extreme, results when the null hypothesis (H0) of a study question is true. The choice of significance level at which H0 is reject is arbitrary. Conventionally, the 5% (less than 1 in 20 chance of being wrong), 1%, and 0.1% (p < 0.05, 0.01, and 0.001) levels were used. Most authors refer to statistically significant as p < 0.05 and statistically highly significant as p < 0.001 (less than 1 in 1000 chance of being wrong).
4. Conclusions
This study aimed to investigate the possible formation of adducts of dihydroxyphenyl benzimidazole carboxylic acid (Oxisol) to ZnO in order to compare some of our interesting results previously obtained by physical mixtures of the two. To this end, a synthetic approach was developed to obtain ZnO and Oxisol linked by a covalent bond. Theoretically, the two possible types of product obtainable with our approach are coating and complexation; however, simple coating is not sufficient to explain the obtained results. In fact, ATR–FT-IR, SEM, and SEM–EDX analysis showed a complexation of ZnO instead of coating, which means a covalent bond with different properties than a simple coated particle. The addition of Oxisol was favored in the case of ZnO non-nanometric form, instead of nanometric form; this can be explained by a large size population of the sample (
Table 4) from 10 to 1600 nm. However, although what was obtained is reasonably a mixture of complexed and coated material, good efficiency was achieved in improving the UV protection: In fact, the SPF values increased more than 100% for nanometric and around 60% for non-nanometric form.
On the other hand, the involvement of the catechol hydroxyl groups of Oxisol in the binding to ZnO particles almost suppressed its antioxidant activity. Nevertheless, photocatalytic activity of ZnO showed an important inhibition, which can be attributed to the complexation, besides the activity of the ligand on band gap. An expected behavior was shown by Z potential, with a strong decrease at low pH values, because of the solubility of ZnO particles in this pH region. However, sedimentation rate showed a good result for the product obtained from non-nanometric form and worst for the nanometric one. We hypothesized that needle-shape crystal observed in the case of non-nanometric ZnO–Ox could improve dispersion stabilization.
The cytotoxicity study offered a valid interpretation of the behavior of inorganic sunscreens in contact with cells. The most interesting results were observed in the experiment with sample concentration at 10 μg/mL: It is very interesting to note that the non-functionalized zinc oxide showed a toxicity that reached over 50% of the inhibition of cell growth; instead, the complexation reduced inhibition by 10 times to only around 5%. We believe that this cytotoxicity is due to the presence of Zn2+ ion in solution, as proved by the solubility test. The reduced cytotoxicity of ZnO but not the complete annulment suggests an application as an anti-acne agent. The results are very promising, with a significant increase of activity against acne as compared with pure ZnO.
In light of these unprecedented results, we can conclude that the new ZnO adducts described above have several benefits over the simple ZnO behavior: The stabilization in formulation and the booster activity allowed to reduce the quantity of inorganic filter in UV sunscreens; moreover, the reduced photocatalytic activity and cytotoxicity led to an improved toxic profile of ZnO. Finally, the activity against C. acne showed a consistent anti-acne activity, also when compared with pure ZnO. Thus, our investigation leads not only to a new class of mixed inorganic filters, but also to obtain very important information regarding the cytotoxicity of ZnO and the mechanism at the base of this action. In particular, Oxisol showed a high activity of free Zn2+ coordination, strongly decreasing the cytotoxicity of zinc oxide.


 ,
, 


