
An Analytical Toolbox for Fast and Straightforward Structural Characterisation of Commercially Available Tannins


1
Department of Chemical Science and Technologies, University of Rome ‘Tor Vergata’, Via della Ricerca Scientifica, 00133 Rome, Italy
2
CSGI-Center for Colloid and Surface Science, Via della Lastruccia 3, 50019 Sesto Fiorentino, Italy
3
Department of Earth and Environmental Sciences, University of Milano-Bicocca, Piazza della Scienza 1, 20126 Milan, Italy
4
Department of Molecular Sciences and Nanosystems, University of Venice ‘Ca’Foscari’, Via Torino 155, 30170 Venice Mestre, Italy
*
Authors to whom correspondence should be addressed.
†
Affiliated with 1 via NAST—Nanoscience & Nanotechnology & Innovative Instrumentation Center.
Molecules 2021, 26(9), 2532; https://doi.org/10.3390/molecules26092532
Submission received: 19 March 2021
/
Revised: 9 April 2021
/
Accepted: 21 April 2021
/
Published: 26 April 2021
(This article belongs to the Special Issue Analytical Methods for Characterization and Isolation of Natural Products)
Abstract
:Both condensed and hydrolysable tannins represent versatile natural polyphenolic structures exhibiting a broad range of activities that could be exploited in various fields including nutraceutics, cosmesis, consumer care, household and pharmaceutical applications. Various tannins are commercially available nowadays for use in such application fields. We have analysed a representative selection of commercially available condensed and hydrolysable tannins for structural features and purity. Using a combination of quantitative 31P NMR spectroscopy, HSQC measurements, MALDI-ToF analyses, gel permeation chromatography and wet chemical analysis, detailed structural characterisations and descriptions were possible, allowing for verification and falsification of claimed structural features.
1. Introduction
Giovannetti investigated the interactions between iron solutions and substances called ‘astringents’ in the middle of the 17th century, marking as such what is today seen as the onset of tannin research. In 1772, researchers identified the presence of an acid in these compounds. This acid was subsequently isolated by Scheele and shown to be gallic acid. At the end of the 18th and the beginning of the 19th century, the tannins were officially recognised as a discrete group of molecules that differ with respect to the gallic acid content [1,2]. They generally appear in various forms, ranging from white to off-white amorphous powders to shiny, almost colorless pasty substances that exhibit characteristic smells and astringent tastes. Tannins can be found in most of the higher plants around the globe but also in algal biomass [2], produced in almost all parts of the plant; i.e., seeds, roots, bark, wood and leaves; due to their fundamental role in defending against insects, infections, fungi, bacteria or simply predators [3]. One defense mechanism relies on the capability of tannins to irreversibly complex proteins [4]. This feature is also the cause for the massive use of these substances in Asian medicine [4,5,6]. They are also thought to be one of the effective components contributing to the fact that the risk of suffering from cardiovascular diseases and certain forms of cancer can be reduced by choosing diets rich in fruits and vegetables [7,8].
The rather wide range of functions comes together with a wide variety of tannin structures, commonly divided in tannins such as gallotannins and ellagitannins, that are soluble and cleavable into their components in hot water or in the presence of a tannin-specific enzyme, e.g., tannase, and that were thus termed ‘hydrolysable’ tannins, and non-hydrolysable tannins or flavones, a tannin species without carbohydrate moieties, termed proanthocyanidins, polyflavonoid tannins, catechol-type tannins, and pyrocatecholic-type tannins that are stable under these conditions and thus called ‘non-hydrolysable’ or ‘condensed’ tannins [1,2,9]. Aiming at the use of tannins in material sciences [10,11,12,13,14] or biomedical applications [7,15,16,17,18,19,20], the rather precise knowledge of the structure of a given tannin is a key factor. Depending on the application, additional knowledge regarding dominant impurities might be necessary. The archival literature lists an impressive number of research efforts in which such structural characterisation of tannins has been achieved using various analysis techniques and/or combinations thereof [21,22,23,24,25,26,27]. Standard methods for the elucidation of tannin structures include NMR analyses, analyses by MALDI-ToF and classical wet-chemical analyses. Several dedicated articles review achievements and point out the challenges connected to this topic [21,22].
The design of novel products and processes aimed at improving the exploitation of the huge potential of tannins requires their use both in their natural form as well as in the form of chemically altered derivatives. It is therefore necessary, in order to develop targeted selective chemical derivatization protocols, to analyse the tannin structures, as such verifying also the information available for the commercialised samples. To this end, commercially available tannins from different origins have been structurally characterized using the toolbox shown in Figure 1: structural characterization was achieved by {1H-13C}-HSQC measurements, quantitative 31P NMR and 1H NMR spectroscopy, MALDI-ToF analysis and gel permeation chromatography (GPC).
Wet-chemical analysis such as the Scalbert test for the elucidation of cyanidin contents and the Folin–Ciocalteau assay for the determination of the total phenol content concluded the fingerprinting. On the basis of the results of the various analyses, it was possible to unequivocally assign the tannin structures. This is especially relevant for two reasons: (i) commercial tannins might be mixtures or even different from what is declared, and (ii) a detailed knowledge of structural features is key for an eventual chemical derivatisation of tannins.
2. Results and Discussion
As commercially available materials, eleven representative tannins from two different suppliers were selected (Table 1): condensed tannins Omnivin WG, Omnivin R, Omnivin 10R, Omnivin 20R, MIMOSA ATO ME, and QUEBARACHO ATO, as well as hydrolysable tannins Tanal 01, Tanal 02, Tanal 04, VEGETAN CN POLVERE and TARA POLV TIPO A. The tannin extracts were studied without any purification; i.e., as commercial-grade material.
The analysis techniques summarised as the toolbox shown in Figure 1 were applied to all tannins, and detailed data for each type of analysis performed are given in tables in the form of the Supplementary Materials. In the following paragraphs, only the structural outcomes of the combinatorial structural analyses are discussed, together with comments regarding structural peculiarities and eventually identified impurities.
2.1. Characterisation of Commercially Available Condensed Tannins
NMR is a powerful tool for the analysis of natural polyphenols. The main issue in the analysis of tannins is represented by their high heterogeneity and variability. The 1H NMR signals are therefore not very diagnostic. On the contrary, 31P NMR of suitably in situ labelled samples allows direct straightforward identification and quantification of all the different phenolic groups present in the tannin sample. [27,28,29,30] This technique not only allows the study of tannins in complex matrices, but also provides at a glance the assignment of an unknown tannin to a hydrolysable, condensed or complex class. Furthermore, since it is possible to identify and quantify all the different phenolic groups present on the tannin backbone, it allows, in the case of proantocyanidins, assigning the substitution pattern in rings A and B. We started the structural analyses using different NMR spectroscopic techniques; the results of the quantitative 31P NMR analyses, delineated as described before, [27,28,29,30] are listed, together with the data for the other condensed tannins used in this study, in Table 2. The underlying spectra are shown in the Supplementary Materials in Figures S1A, S3A, S5A, S7A, S9A and S11A. Figure 2 shows structural elements identified and used for analysis and throughout the various structural discussions. Molecular mass analyses with the aim of delineating the dominating degree of polymerisation were possible in the form of gel permeation chromatography on non-acetylated samples in DMSO, and the results are listed in Table 2 as well. Although eventually of less structural potential, traditional wet-chemical analyses were performed on the various tannins in the form of Scalbert [31] and Folin–Ciocalteau [32] tests, and these results are also given in Table 2. Figures S1B–S6B in the Supplementary Materials show the HSQC spectra; Table S1 in the Supplementary Materials lists the assigned cross-peaks from the HSQC analyses of the various tannins on the basis of various literature reports [23,24,30,33,34]. A more detailed analysis of the nature and/or composition of monomeric tannins and tannin oligomers was achieved by MALDI-ToF analyses [24,35]; a full list of identified masses is given for each condensed tannin in Table S2 in the Supplementary Materials.
The various single data especially of the NMR analyses, flanked by the MALDI-ToF analyses, were used to cross-verify and deduce more intrinsic information of the sample, such as the ratio of the units found in terms of composition and the sample purity with respect to what could be theoretically expected. Table 3 summarises this information for the analysed condensed tannins.
2.1.1. Characterization of Monomeric and Low Oligomeric Condensed Tannins
Omnivin WG (Vv) is sold as an average-grade wine tannin. According to the available accompanying documentation, this tannin should exhibit a larger polydispersity with respect to the other members of the ‘Omnivin’ family of tannins commercialised by the producer. By and large, structural analysis of Vv confirmed this. The sample is found to be present mainly in the form of procyanidins (62%) and profisetidins (34%). The ratio between phloroglucinol and resorcinol motifs as deduced from 31P NMR analysis seems to be reflected in the semiquantitative HSQC data. HSQC suggests that both catechin and epicatechin stereochemistries are present. On the basis of the HSQC analysis, an indicative cross-peak for a C4-H of a substituted C4 delineated low oligomeric character is confirmed by comparative GPC analysis (Table 2), with an estimated degree of polymerisation of 1–2, determined by the combination of GPC and MALDI-ToF data. Gallocatechin monomers are present only in minor quantities (Table 2). MALDI-ToF data suggest further that some molecules are esterified with gallic acid, which is also found to be present as impurity in free form in the HSQC spectrum, 31P NMR analyses (Table 2) in form of free acidic OH-groups and MALDI-ToF spectra. The overall sample purity, determined as described before comparing the theoretically expectable flavan-3-ol content in 1 g of substance to the 31P NMR-derived amount, was found to be 78%. Both 31P NMR and HSQC spectra correspondingly reveal signals that can be connected to carbohydrate impurities. Figure 3a shows the main structural representation of Vv based on these structural insights, trying to combine the quantitative 31P NMR data with the non-quantitative MALDI-ToF data.
Omnivin R; i.e., Vv-R; shows essentially identical structural features as Vv, as should be expected. A slight increase in fisetinidol over (epi)catechin elements is, however, observed (Table 3), alongside a shift towards higher molecular weights by GPC and MALDI-ToF, which indicates a polymerisation degree up to 3. The sample purity in terms of flavan-3-ol units per gram was found to be significantly reduced to only 39%; correspondingly, 31P NMR and HSQC spectra reveal considerable amounts of carbohydrate impurities. Gallic acid is found once more as impurity. Structural details are given in Figure 3.
Omnivin 10R and Omnivin 20R; i.e., Vv-10 and Vv-20, respectively; are sold as wine tannins of higher refinement grades compared to Vv and Vv-R, with Vv-20 being the highest refined product with respect to polydispersity, structural purity and non-tannin impurities. Accumulative data analysis suggests that the polydispersity for Vv-10 and Vv-20 reduces significantly (Table 2), resulting in Vv-20 being by and large monomeric (epi)catechin: only trace amounts of dimeric species and (epi)catechin gallates are present according to HSQC; i.e., the indicative cross-peak for a C4-H of a substituted C4 is missing; MALDI-ToF analysis confirms this in terms of peak intensities found for dimeric species. Traces of (epi)gallocatechin are found in case of Vv-10, but practically not in Vv-20. In terms of monomer composition, Vv-10 and Vv-20 are mainly catechins, containing only 26% and 21% fisetinidol, respectively. Sample purity is found to significantly higher in Vv-20 with respect to Vv-10; i.e., 88 vs. 46%, respectively. Sample purity for Vv-10 is thus only in the range of the less purified samples. While this is less obvious in the acquired HSQC spectrum, the strong signal intensities observed in the aliphatic region of the 31P NMR spectrum of Vv-10 do support this finding. Figure 3c,d illustrate the structural results obtained for Vv-10 and Vv-20,
2.1.2. Characterisation of Higher Oligomeric Condensed Tannins
MIMOSA ATO ME (Am) is sold as a higher-grade oligomeric condensed tannin. Structural analysis of the batch used in this study confirms this, identifying Am by HSQC analysis and MALDI-ToF as an oligomeric tannin composed of approximately one third prorobinetidins and two thirds profisetidins. HSQC analysis further suggests that the trans-isomers prevail the cis-isomers for the various building blocks. Data also suggest that oligomerisation occurs more preferentially via C6 of the A-ring rather than via C8, given that the C8-H signal appears more intense in direct comparison. The cross-peak for C4-H substituted is stronger than the one for C4-H unsubstituted, underlining the oligimeric nature. Both 31P NMR and MALDI-ToF suggest that approximately 4% Am is esterified in position 3 of the C-ring with gallic acid. It is noteworthy that free gallic acid is only barely detectable in both MALDI-ToF 31P NMR and HSQC analysis; the latter suggests, however, together with the 31P NMR data, that Am contains significant amounts of carbohydrate impurities. The estimated sample purity amounts accordingly to approximately 51%. The structural findings are summarised in Figure 4a.
QUEBRACHO ATO (Sb) is sold as oligomeric condensed tannin. Data analysis suggests that the structure is composed of a rather unbiased mixture of profisetidin- and procyanidin-typical monomers; i.e., catechol and fisetinidol in a ratio of approximately 3/1; with some of the aliphatic OH-groups presumably esterified with gallic acid. NMR data indicate further the presence of very small amounts of epigallocatechin motifs. These would be, according to NMR, the only cis-configured motifs; all others seem to present exclusively as trans isomers. Interestingly, the de facto-absence of the C8-H proton signal in the HSQC suggests that monomers are practically exclusively connected in C4->C8 mode. MALDI-ToF and GPC analyses suggest oligomeric structures of mainly trimeric character, with tetramers being the largest reliably detectable units. Free gallic acid has been detected as impurity by MALDI-ToF, 31P NMR and HSQC. Additionally, in the case of Sb carbohydrate, impurities are delineable by 31P NMR and HSQC analyses. A structural representation of Sb, found to have a purity of 50%, is given in Figure 4b.
The Scalbert test shows interesting results: the lowest cyanidin content was found for the highest refined sample Vv-20, which was proven to be of higher purity by HSQC, 31P NMR and MALDI-ToF analyses. The highest values were found instead for the non-refined Vitis vinifera sample Vv and the quebracho tannin (Sb) (Table 2). Since the test is known to be relatively easy to be compromised by impurities, the overall results indicate that the mere determination of the cyanidin content is eventually inadequate for determining the quality in terms of the structural purity of a sample, or eventually even the successful outcome of a refinement of a sample. The solubility of samples can represent a major source of error in these measurements; however, the test conditions chosen for this study were capable of solubilising all samples adequately.
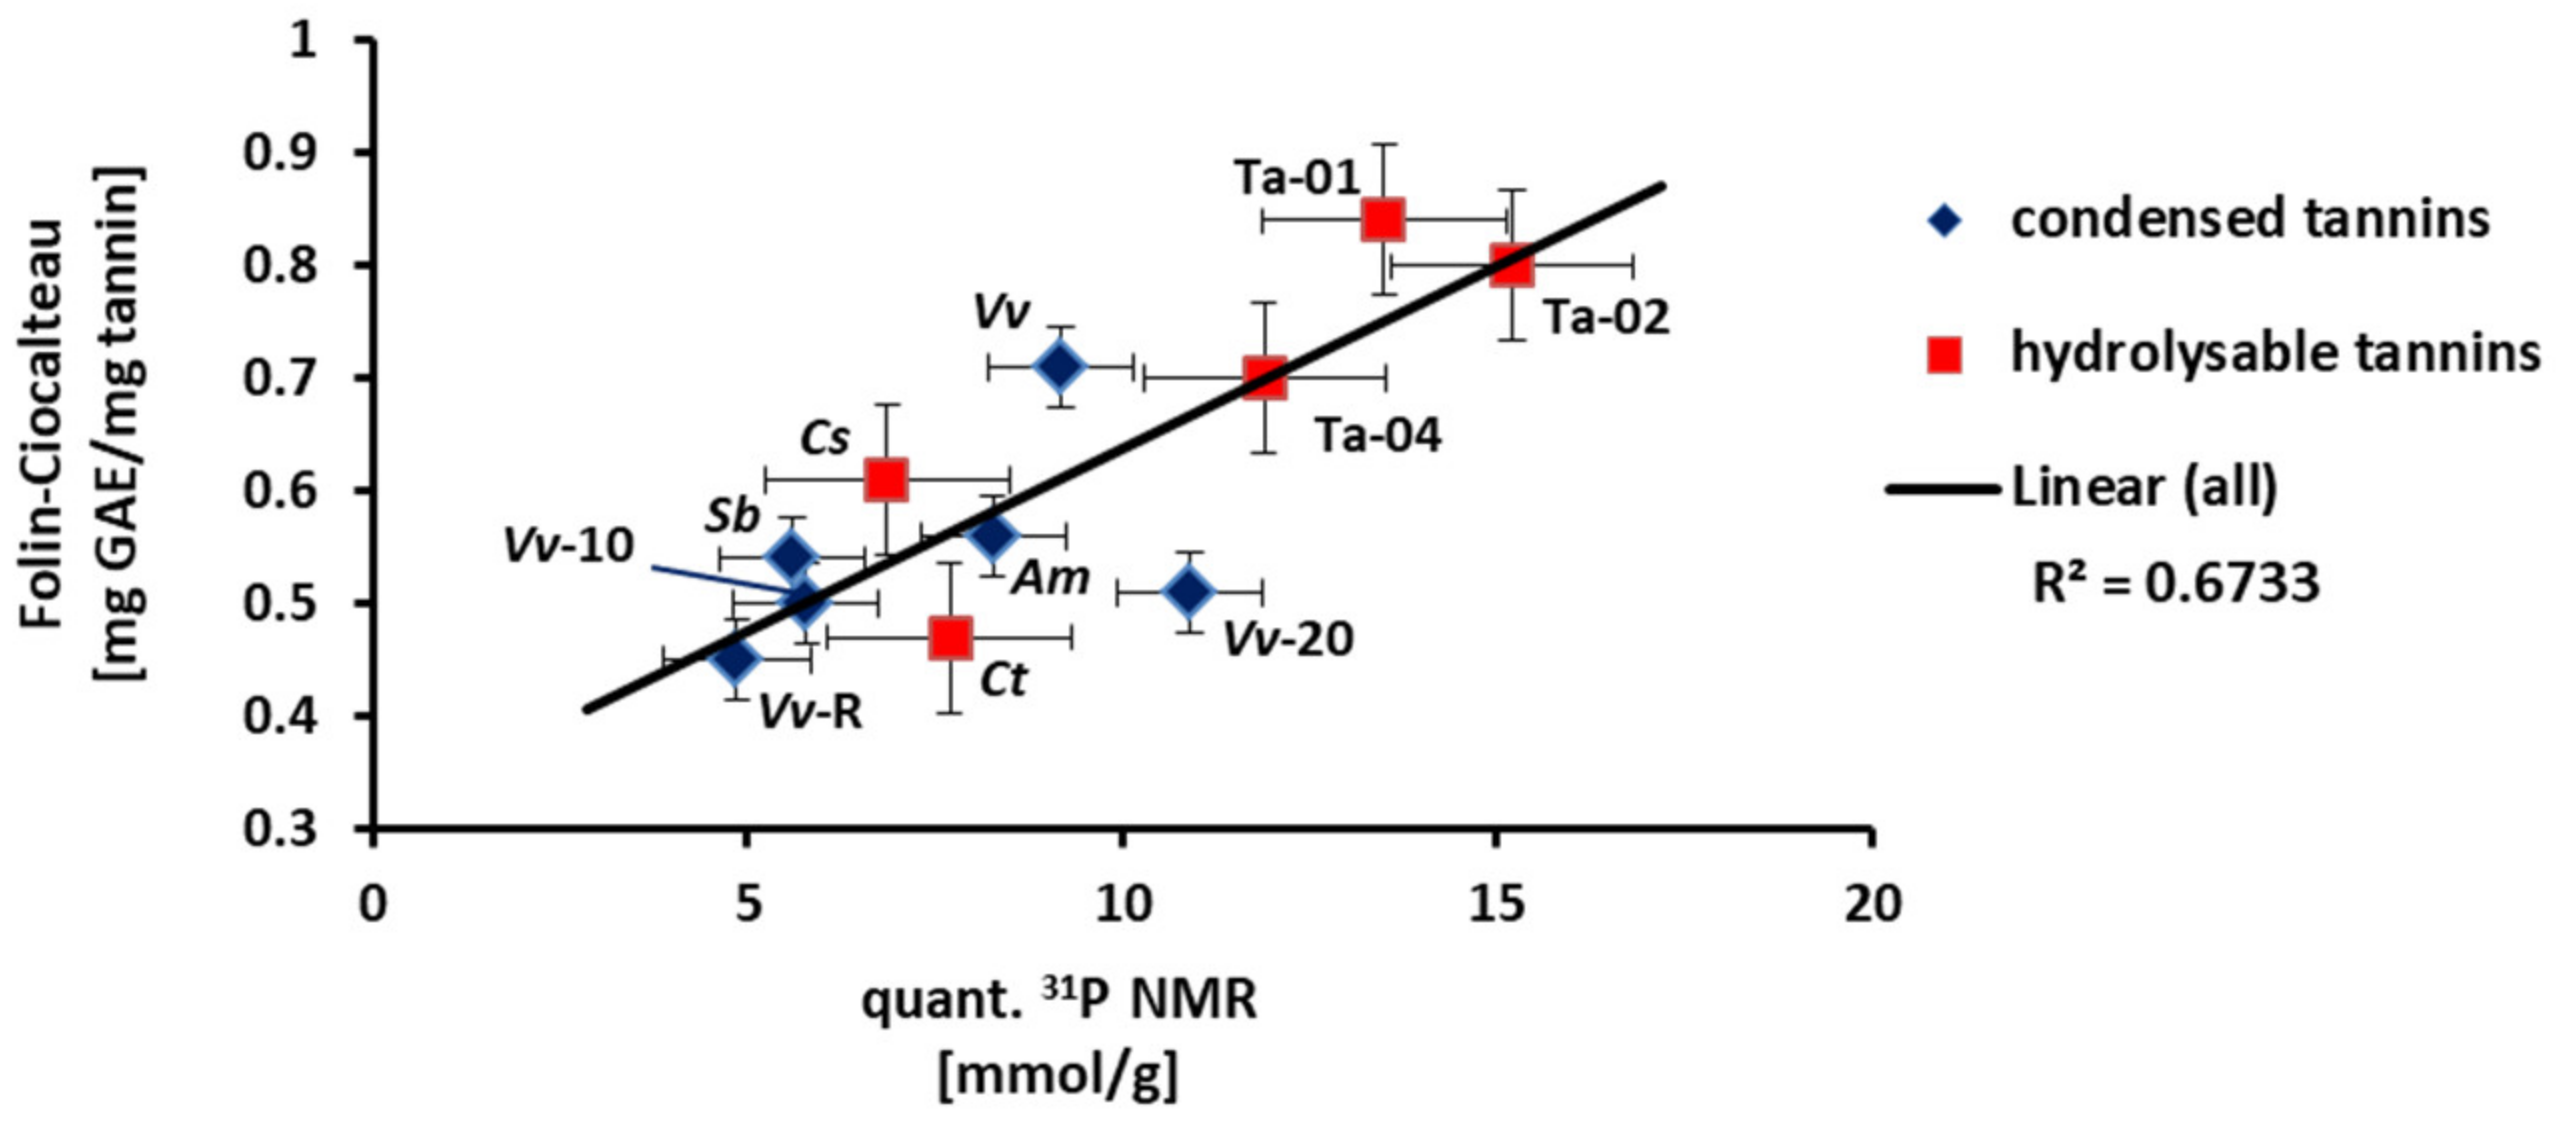
Calling for the overall phenolic OH-group content, the Folin–Ciocalteau test correlates roughly with the total phenolic OH-group content as determined by quantitative 31P NMR (Table 2, Figure 5). Since solubility issues can be excluded as major error source-chosen concentrations allowed for complete dissolution, possible sources for the error might lie in the impurities that were detected in the various samples in various amounts.
The results of the detailed structural analysis of the different commercialised condensed tannins correspond by and large to what could be expected based on knowledge in the archival literature. An interesting question in case of oligomeric tannins is the connectivity between the monomeric units. This question arises on the one hand in the form of the possibility of a 4→6 or a 4→8 linkage. This can eventually be estimated by HSQC, and more generally NMR-based analysis, as discussed above in case of Am and Sb. In case indications for both linkages are found, it is more difficult to judge whether the two linkages connect the very same A ring of a central flava-3-ol to two other terminal units, or whether a chain is formed in which A rings carry only one linkage. Such more refined structural characterisations are principally possible using HSQC; however, given that the tannins come in mixtures of monomers and small oligomers, it is practically unfortunately rather impossible. The structural representation of the various tannin structures therefore lists various possibilities for some of the motifs identified in the MALDI-ToF analyses.
The difference might be reflected in the surface characteristics of the different molecules, and thus also in their biological activities beyond pure structural features such as the molecular weight or total number of OH-groups. Apart from reactivities of A-ring phenolic OH-groups certainly changing as a function of the substitution pattern, the question is additionally complicated by the possibility of a branching as soon as more than three monomeric units are linked. Such branching is reported especially in the case of 5-deoxyflavan-3-ol units being present, as in the case of the investigated Am and Sb [1,25,30,35,36]. Linear or branched structures will have different characteristics. One of the differences should be found in terms of the hydrodynamic volume, and as such, branching might explain why the molecular weight features as determined by GPC, which reflects also hydrodynamic volume characteristics of the analytes, does not show more significant differences compared to the monomeric and dimeric Omnivin tannins.
2.2. Characterisation of Commercially Available Hydrolysable Tannins
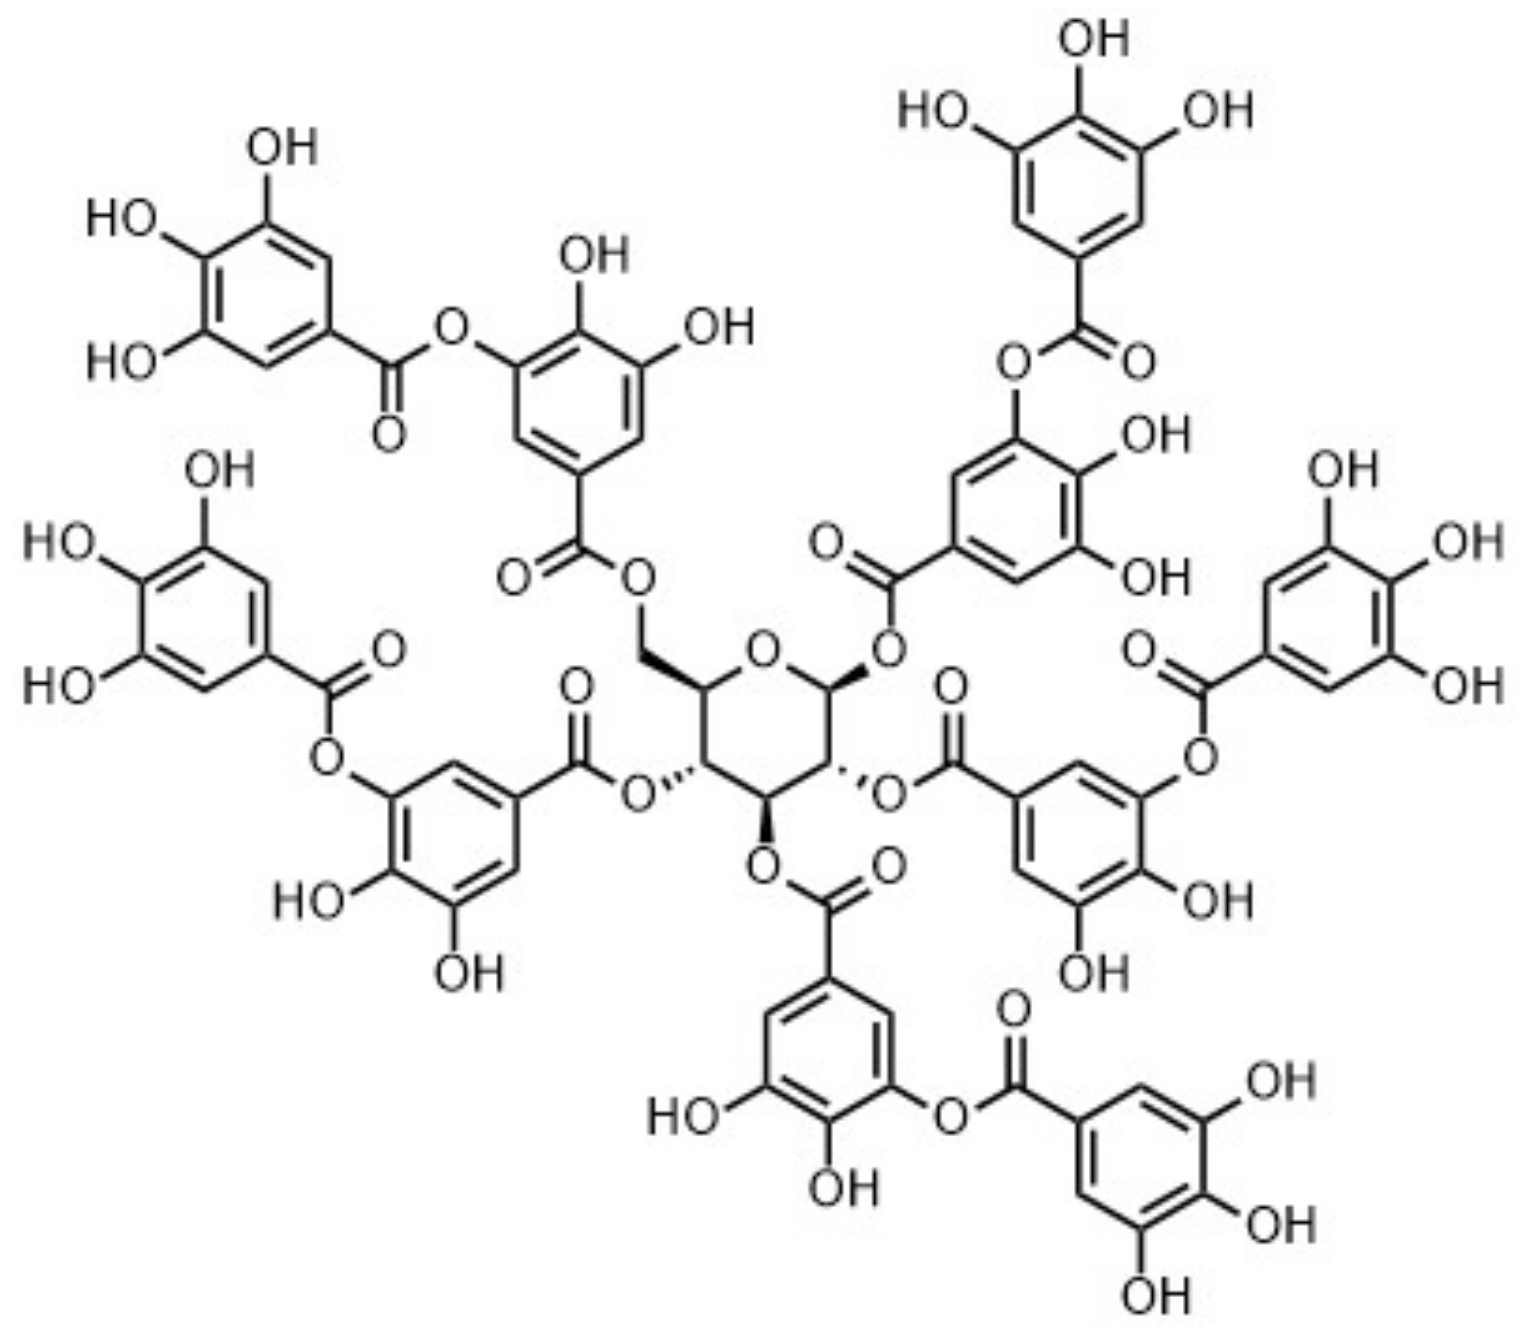
In case of commercially available hydrolysable tannins, it is worthwhile to understand the nature of the tannin, especially also with respect to the core sugar moiety. Tannic acid (TA) is probably the most commonly available hydrolysable gallotannin; however, archival literature indicates that TA exists in the form of various derivatives of 1,2,3,4,6-penta-O-{3,4-dihydroxy-5-[(3,4,5-trihydroxybenzoyl)oxy]-benzoyl}-d-glucopyranose that could be seen as the ‘default’ TA. Several other hydrolysable tannins exist, of course, varying in terms of the core carbohydrate, the repeat number of esterified galloyl units, the form and degree of additional oxidative linkages between the aromatic moieties and eventual oligomeric gallic acid-stemming impurities.
As for the condensed tannins, the combination of analysis techniques listed in Figure 1, with the exception of GPC, was used for delineating the structural peculiarities of five commercialised hydrolysable tannins. Table 4 lists the results obtained for the 31P NMR-based quantitation of hydroxyl groups contents and results of wet-chemical analysis according to the Scalbert and Folin–Ciocalteau tests. In the Supplementary Materials, Table S3 gives an overview of structural motifs identified by HSQC measurements and Table S4 an overview of the results by MALDI-ToF analysis.
Tanal 01 (Ta-01) is commercialised as a typical tannic acid, and so are Tanal 02 and Tanal 04, with the differences lying in molecular size and phenolic content. Such differences are principally compatible with a ‘typical’ tannic acid structure in the sense that such a ‘typical’ tannic acid does not exist, but that the number of galloyl units attached to the centre carbohydrate may vary. It was thus initially expected to confirm within the structural analysis the presence of glucose as common central sugar in all three Tanal samples under study.
Most interestingly, however, only Tanal 01 (Ta-01) and Tanal 02 (Ta-02) turned out to be tannic acids; i.e., displaying a glucopyranose core esterified with 10 galloyl units (Figure 6). Tanal 02 was found to be essentially identical in structure to Tanal 01 (Table S3), with little differences in terms of the detectable presence of flavogallonic acid. Both tannins were found to contain hellinoyl units as a ‘structural impurity’ (Tables S3 and S4).
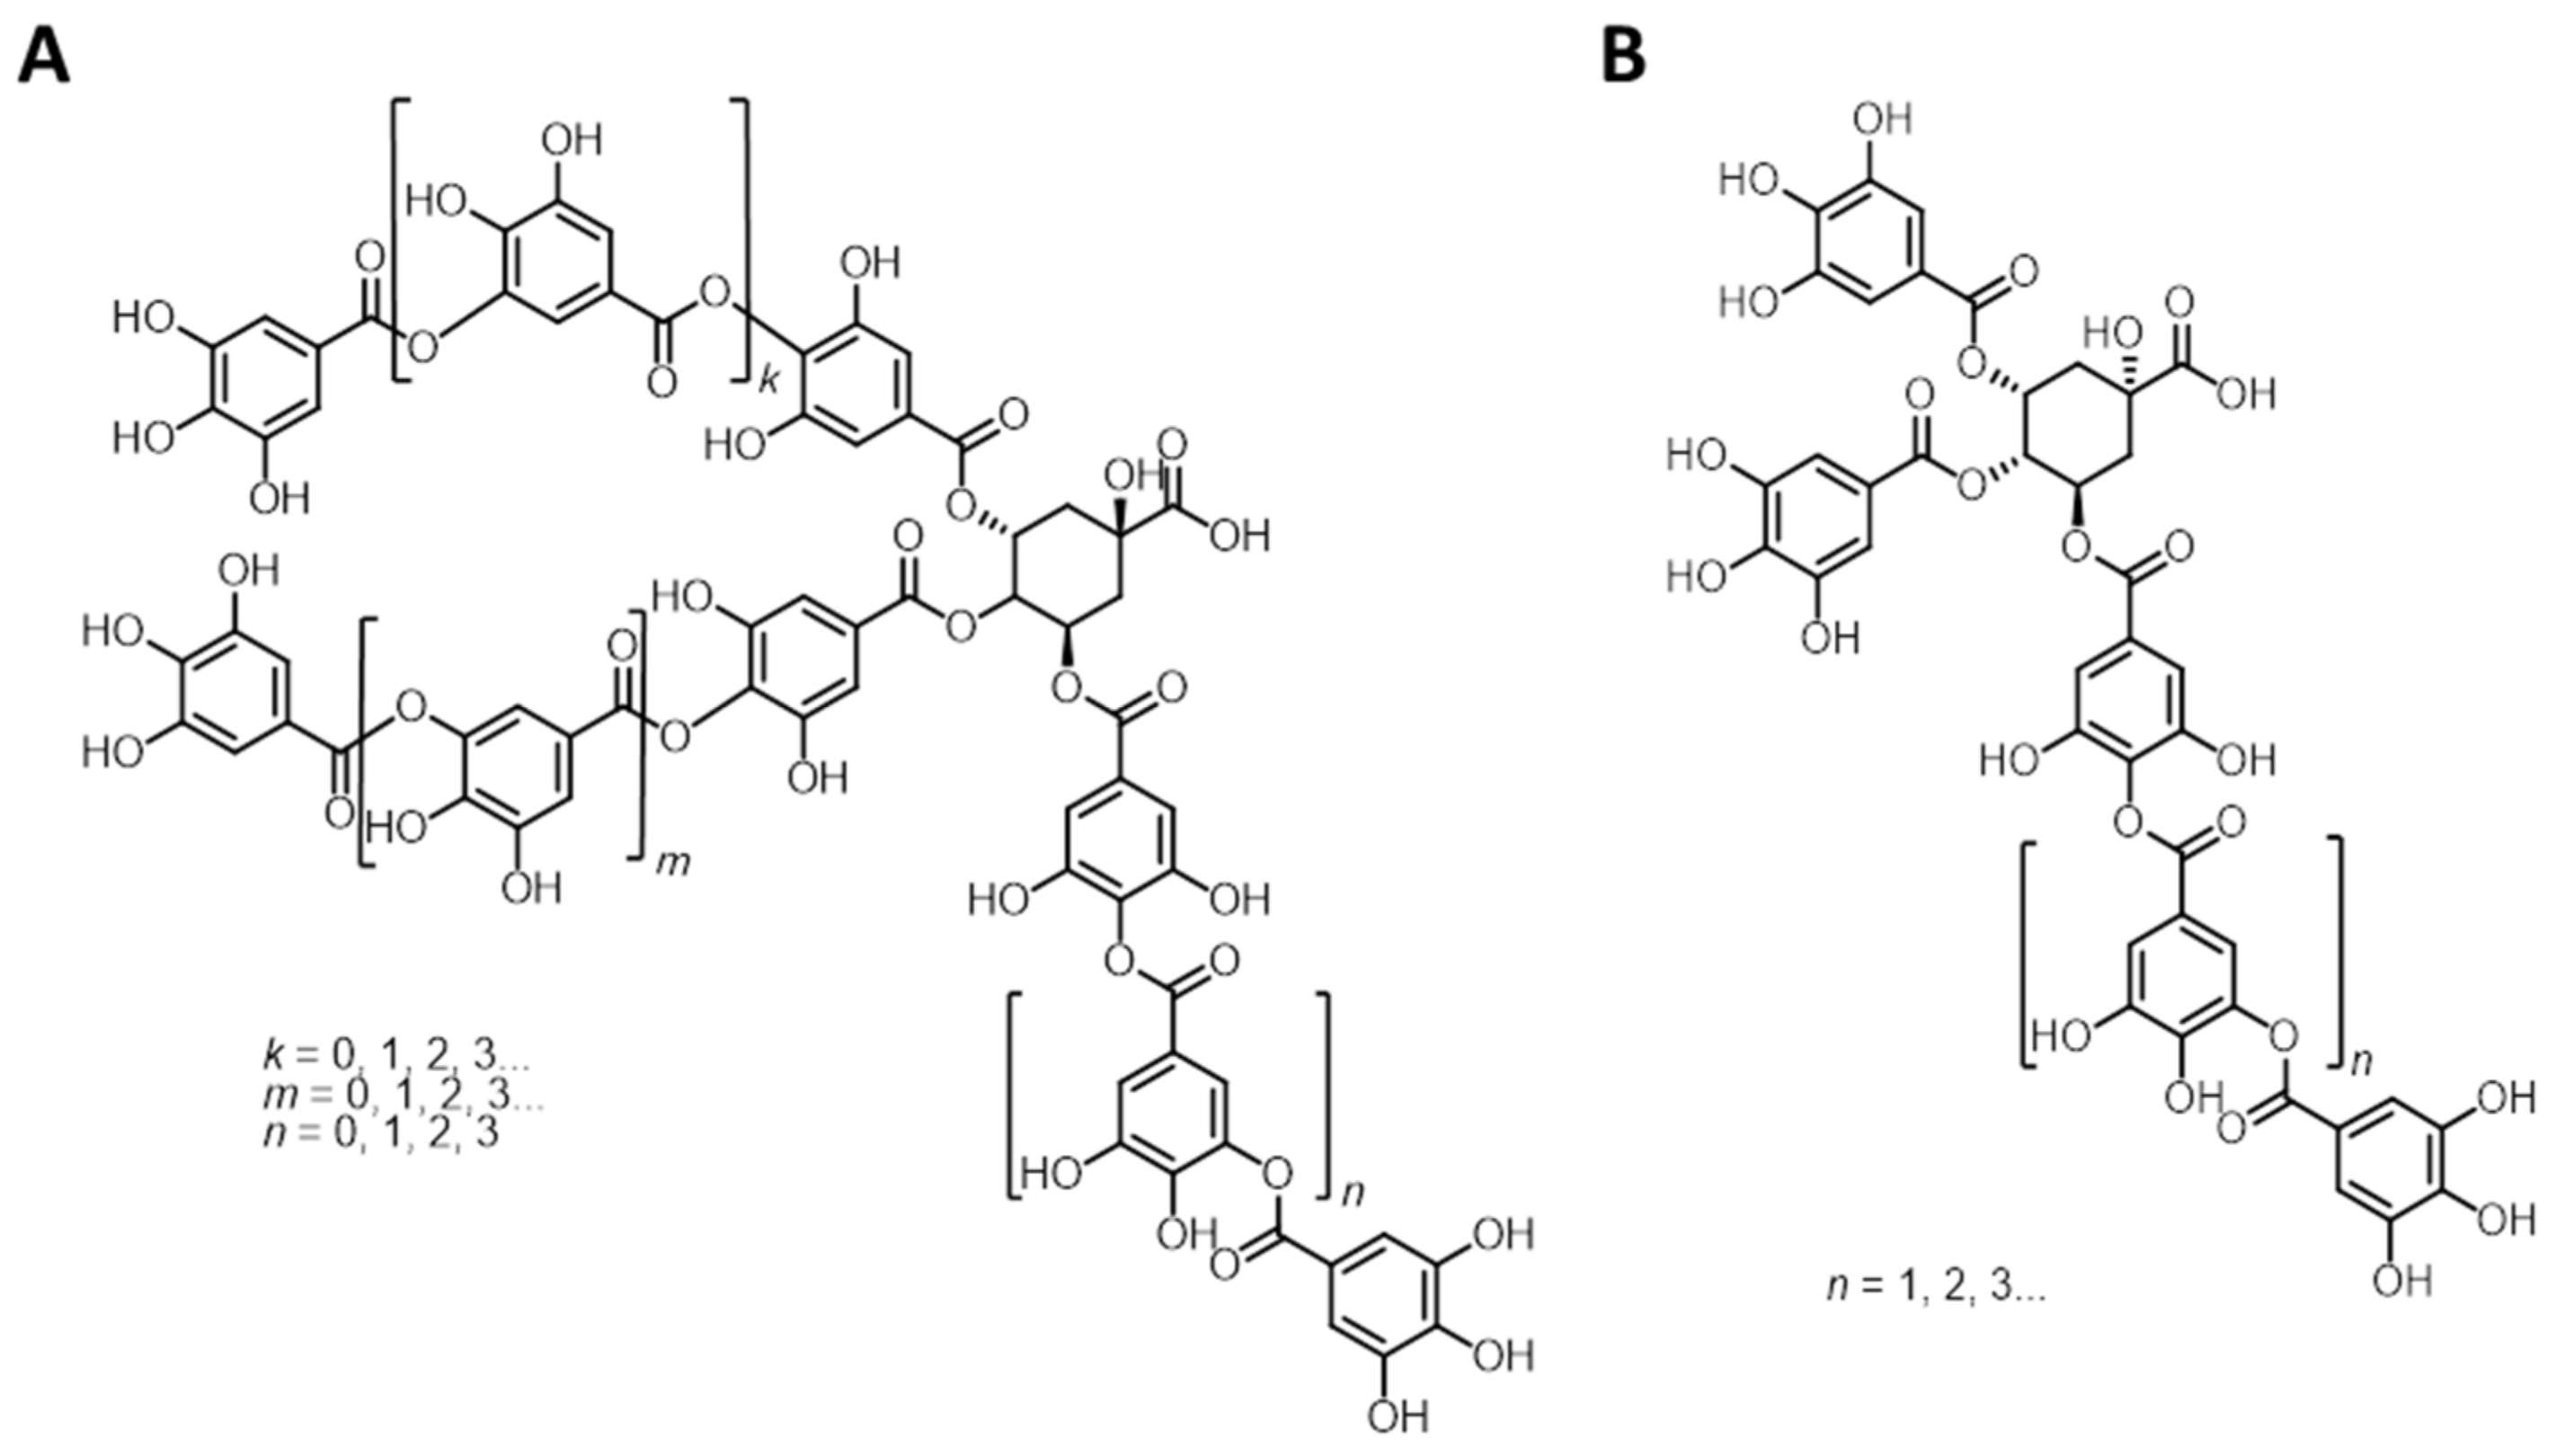
Tanal 04, Ta-04, on the other hand, was found to represent a galloquinic acid. The NMR data are clearly distinctive with respect to Ta-01 and Ta-02. MALDI-ToF analysis, however, was suitable to confirm the quinic acid structure: the analysis suggests a quinic acid core esterified with three to 12 galloyl units in total. Delineable structural features are displayed in Figure 7a.
In terms of molecular weights, the two tannic acids and Ta-04 show similar data, underlining that it is not possible to distinguish between these hydrolysable tannins by rather blunt methods such as GPC. All three Tanal samples were found to contain free gallic acid, ellagic acid and flavogallonic acid as impurities detectable by NMR techniques; i.e., at levels above approximately 5%; MALDI-ToF confirms these findings (Table S4).
Another galloquinic acid was found in the form of TARA POLV TIPO A (Ct), a commercialised tara tannin. HSQC analysis clearly indicates the presence of a quinic acid as the core carbohydrate (Table S3). As indicated in Figure 7b, this tara tannin was found to comprise up to nine galloyl units linked to the quinic acid core in MALDI-ToF analyses (Table S4). 31P NMR analysis revealed higher quantities of carbohydrate impurities, easily identifiable by the high intensity of the signal corresponding to phosphitylated aliphatic OH-groups.
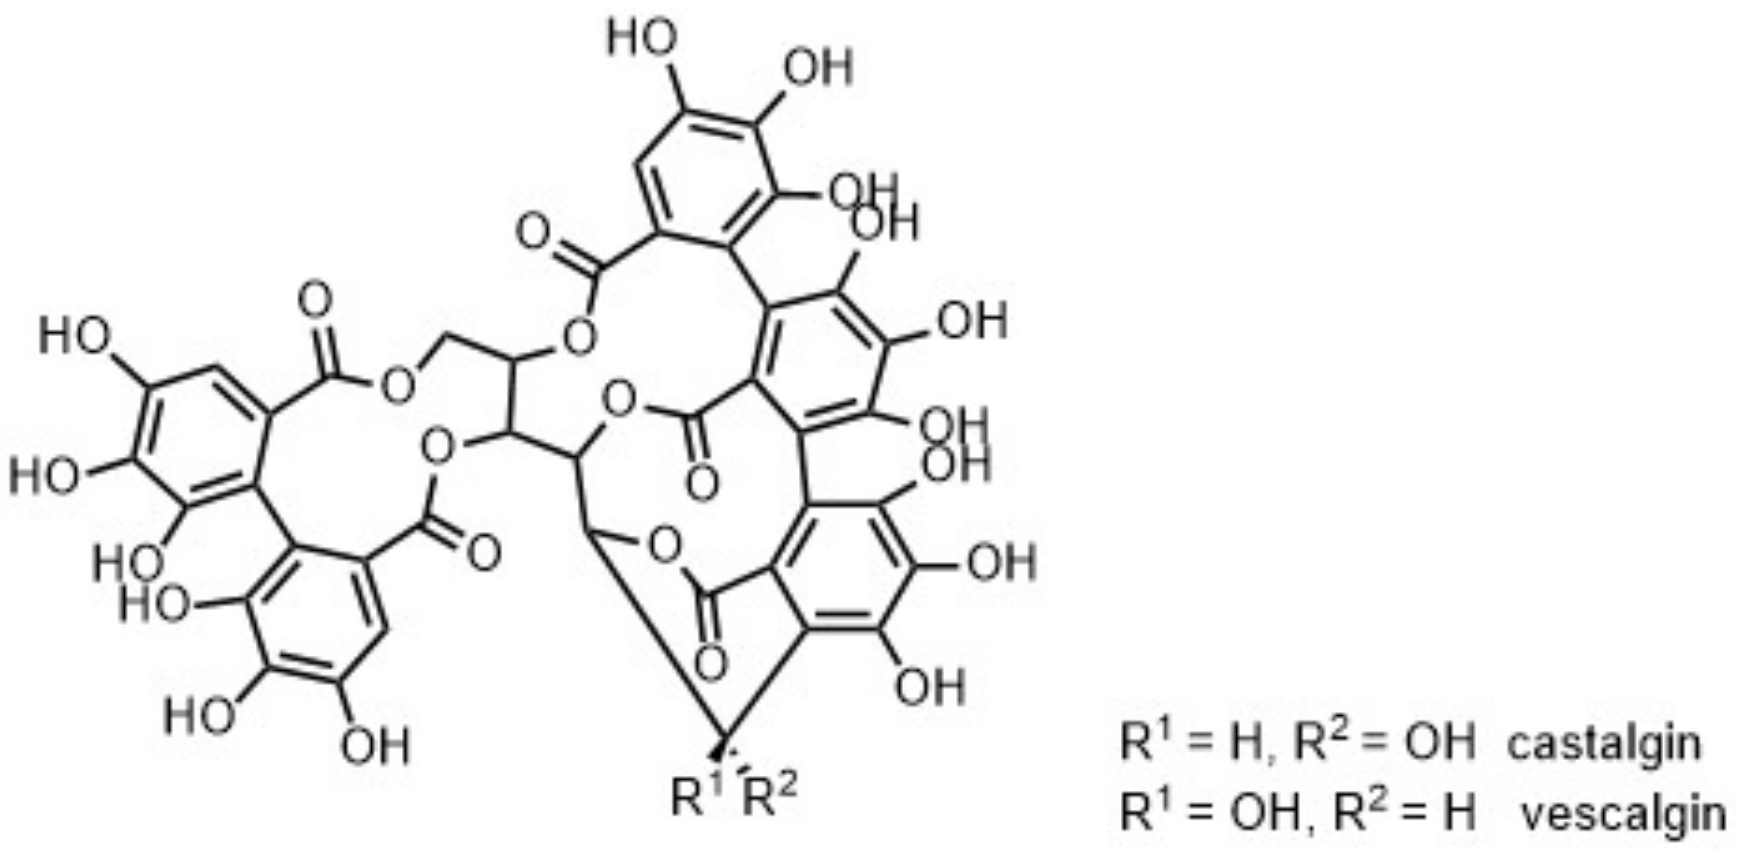
VEGETAN CN POLVERE (Cs) is a commercialised chestnut tannin. The batch analysed in this work turned out to be a mixture of castalgin and vescalgin, as indicated in Figure 1 and Figure 8. Both characteristic cross peaks in the HSQC analysis as well as MALDI-ToF analysis indicate these structures (Tables S3 and S4); quantitative 31P NMR data confirm this interpretation as well. The latter analysis additionally indicates also in this case noteworthy amounts of carbohydrate impurities.
Analysis of the molecular weight features of the bulk material in the form of GPC measurements in DMSO failed under the chosen conditions in the case of the hydrolysable tannins. The number average molecular weights of the two tannic acids under study; i.e., Ta-01 and Ta-02; that were determined using the standard method, yielded numbers that need to be considered an underestimation of the real molecular weight estimable on the basis of elusive NMR and MALDI-ToF results. A reason for this could be the large number of aromatic units present in the structure. Earlier studies on phenolic structures suggested that high amounts of aromatic structures could lead to underestimation of Mn [37].
Wet-chemical analysis in the form of Scalbert and Folin–Ciocalteau assays indicated, as could be expected, insignificant cyanidine contents for tannic acids Ta-01 and Ta-02; for Ta-04, the first quinic acid, cyaniding equivalents are detectable, above noise level, with 2 mg per gram material. Still higher amounts of approximately 10 mg per gram material are found for the other galloquinic acid Ct and the castalgin/vescalgin mixture. In light of the other analyses, the values can be seen as another example of the fact that impurities can impact the outcome of the Scalbert test.
The Folin tests follow the trend from the 31P NMR analyses and indicate the highest total phenol contents for the tannic acids (Table 4); the correlation between the results obtained by quantitative 31P NMR on phosphitylated samples and the values obtained for the Folin–Ciocalteau test was found to be higher than in the case of the condensed tannins (Figure 5). Galloquinic acid Ta-04 shows a slightly reduced phenol content, but much more than galloquinic acid isolated as tara tannin, a fact that reflects the presence of higher amounts of carbohydrate impurities as revealed by 31P NMR. The VEGETAN sample Cs contains the lowest phenolic content in 31P NMR; the Folin test, however, suggests a content similar to that of Ta-04. Most likely, impurities are responsible for this outcome.
3. Materials and Methods
3.1. General Information
Reagents and solvents were purchased and used without further purification, if not stated otherwise, from Sigma Aldrich and Carlo Erba. Tannins were purchased from various vendors, as listed in Table 1, and used without further purification if not stated otherwise.
3.2. Nuclear Magnetic Resonance (NMR) Measurements
31P NMR measurements: The previously described procedure was followed [27,28,29,30]. In brief, approximately 15 mg of tannin were accurately weighed and added to 450 µL of a mixture of pyridine/CDCl3 (1.6:1). One hundred microliters of the standard solution, prepared using N-hydroxy-5-norbornene-2,3-dicarboxylic acid imide (e-HNDI) at a concentration of 0.1 m in the above-mentioned solvent mixture mixed with 50 mg/mL of chromium(III) acetylacetonate as spin-relaxing agent were added, followed by 50 µL of 2-chloro-4,4,5,5-tetramethyl-1,3,2-dioxaphospholane (Cl-TMPD). After 1 h stirring at room temperature, the functionalized mixture was quantitatively transferred to a standard NMR tube for analysis. 31P NMR spectra were recorded on a Bruker 400 MHz spectrometer at 20 °C using an inverse gated decoupling sequence with a delay of 10 s between successive pulses. Chemical shifts were expressed in parts per million from 85% H3PO4 as an external reference. All chemical shifts reported are relative to the peak for the reaction product of water with Cl-TMDP 132.2 ppm in the used conditions. NMR data were processed with MestreNova (Version 8.1.1, Mestrelab Research).
1H-13C HSQC measurements: Samples of around 50 mg were dissolved in 600 μL of DMSO-d6 (providing NMR sample solutions with concentrations of around 83 mg/mL); chromium(III) acetylacetonate was added as a spin-relaxing agent at a final concentration of ca. 1.5–1.75 mg/mL. HSQC spectra were recorded at 27 °C on a Bruker 700 MHz instrument equipped with TopSpin 2.1 software. Spectra were referenced to the residual signals of DMSO-d6 (2.49 ppm for 1H and 39.5 ppm for 13C spectra). 1H-13C HSQC spectra were obtained using 32 scans obtained using the standard Bruker pulse program (hsqcegtpsisp2) with the following parameters for acquisition: TD = 2048 (F2), 512 (F1); SW = 13.0327 ppm (F2), 160 ppm (F1); O1 = 4200.54 Hz; O2 = 14083.02 Hz; D1 = 2 s; CNST2 = 145; acquisition time F2 channel = 112.34 ms; F1 channel = 8.7102 ms. Processing: SI = 1024 (F2, F1), WDW = QSINE, LB = 1.00 Hz(F2), 0.30 Hz (F1); PH_mod = pk; baseline correction ABSG = 5 (F2, F1), BCFW = 1.00 ppm, BC_mod = quad (F2), no (F1); linear prediction = no (F2), LPfr (F1). The integration ranges as previously reported were applied. The NMR data were processed with MestreNova (Version 8.1.1, Mestrelab Research).
3.3. Matrix-Assisted Laser Desorption/Ionization–Time-of-Flight (MALDI-ToF) Mass Spectrometry
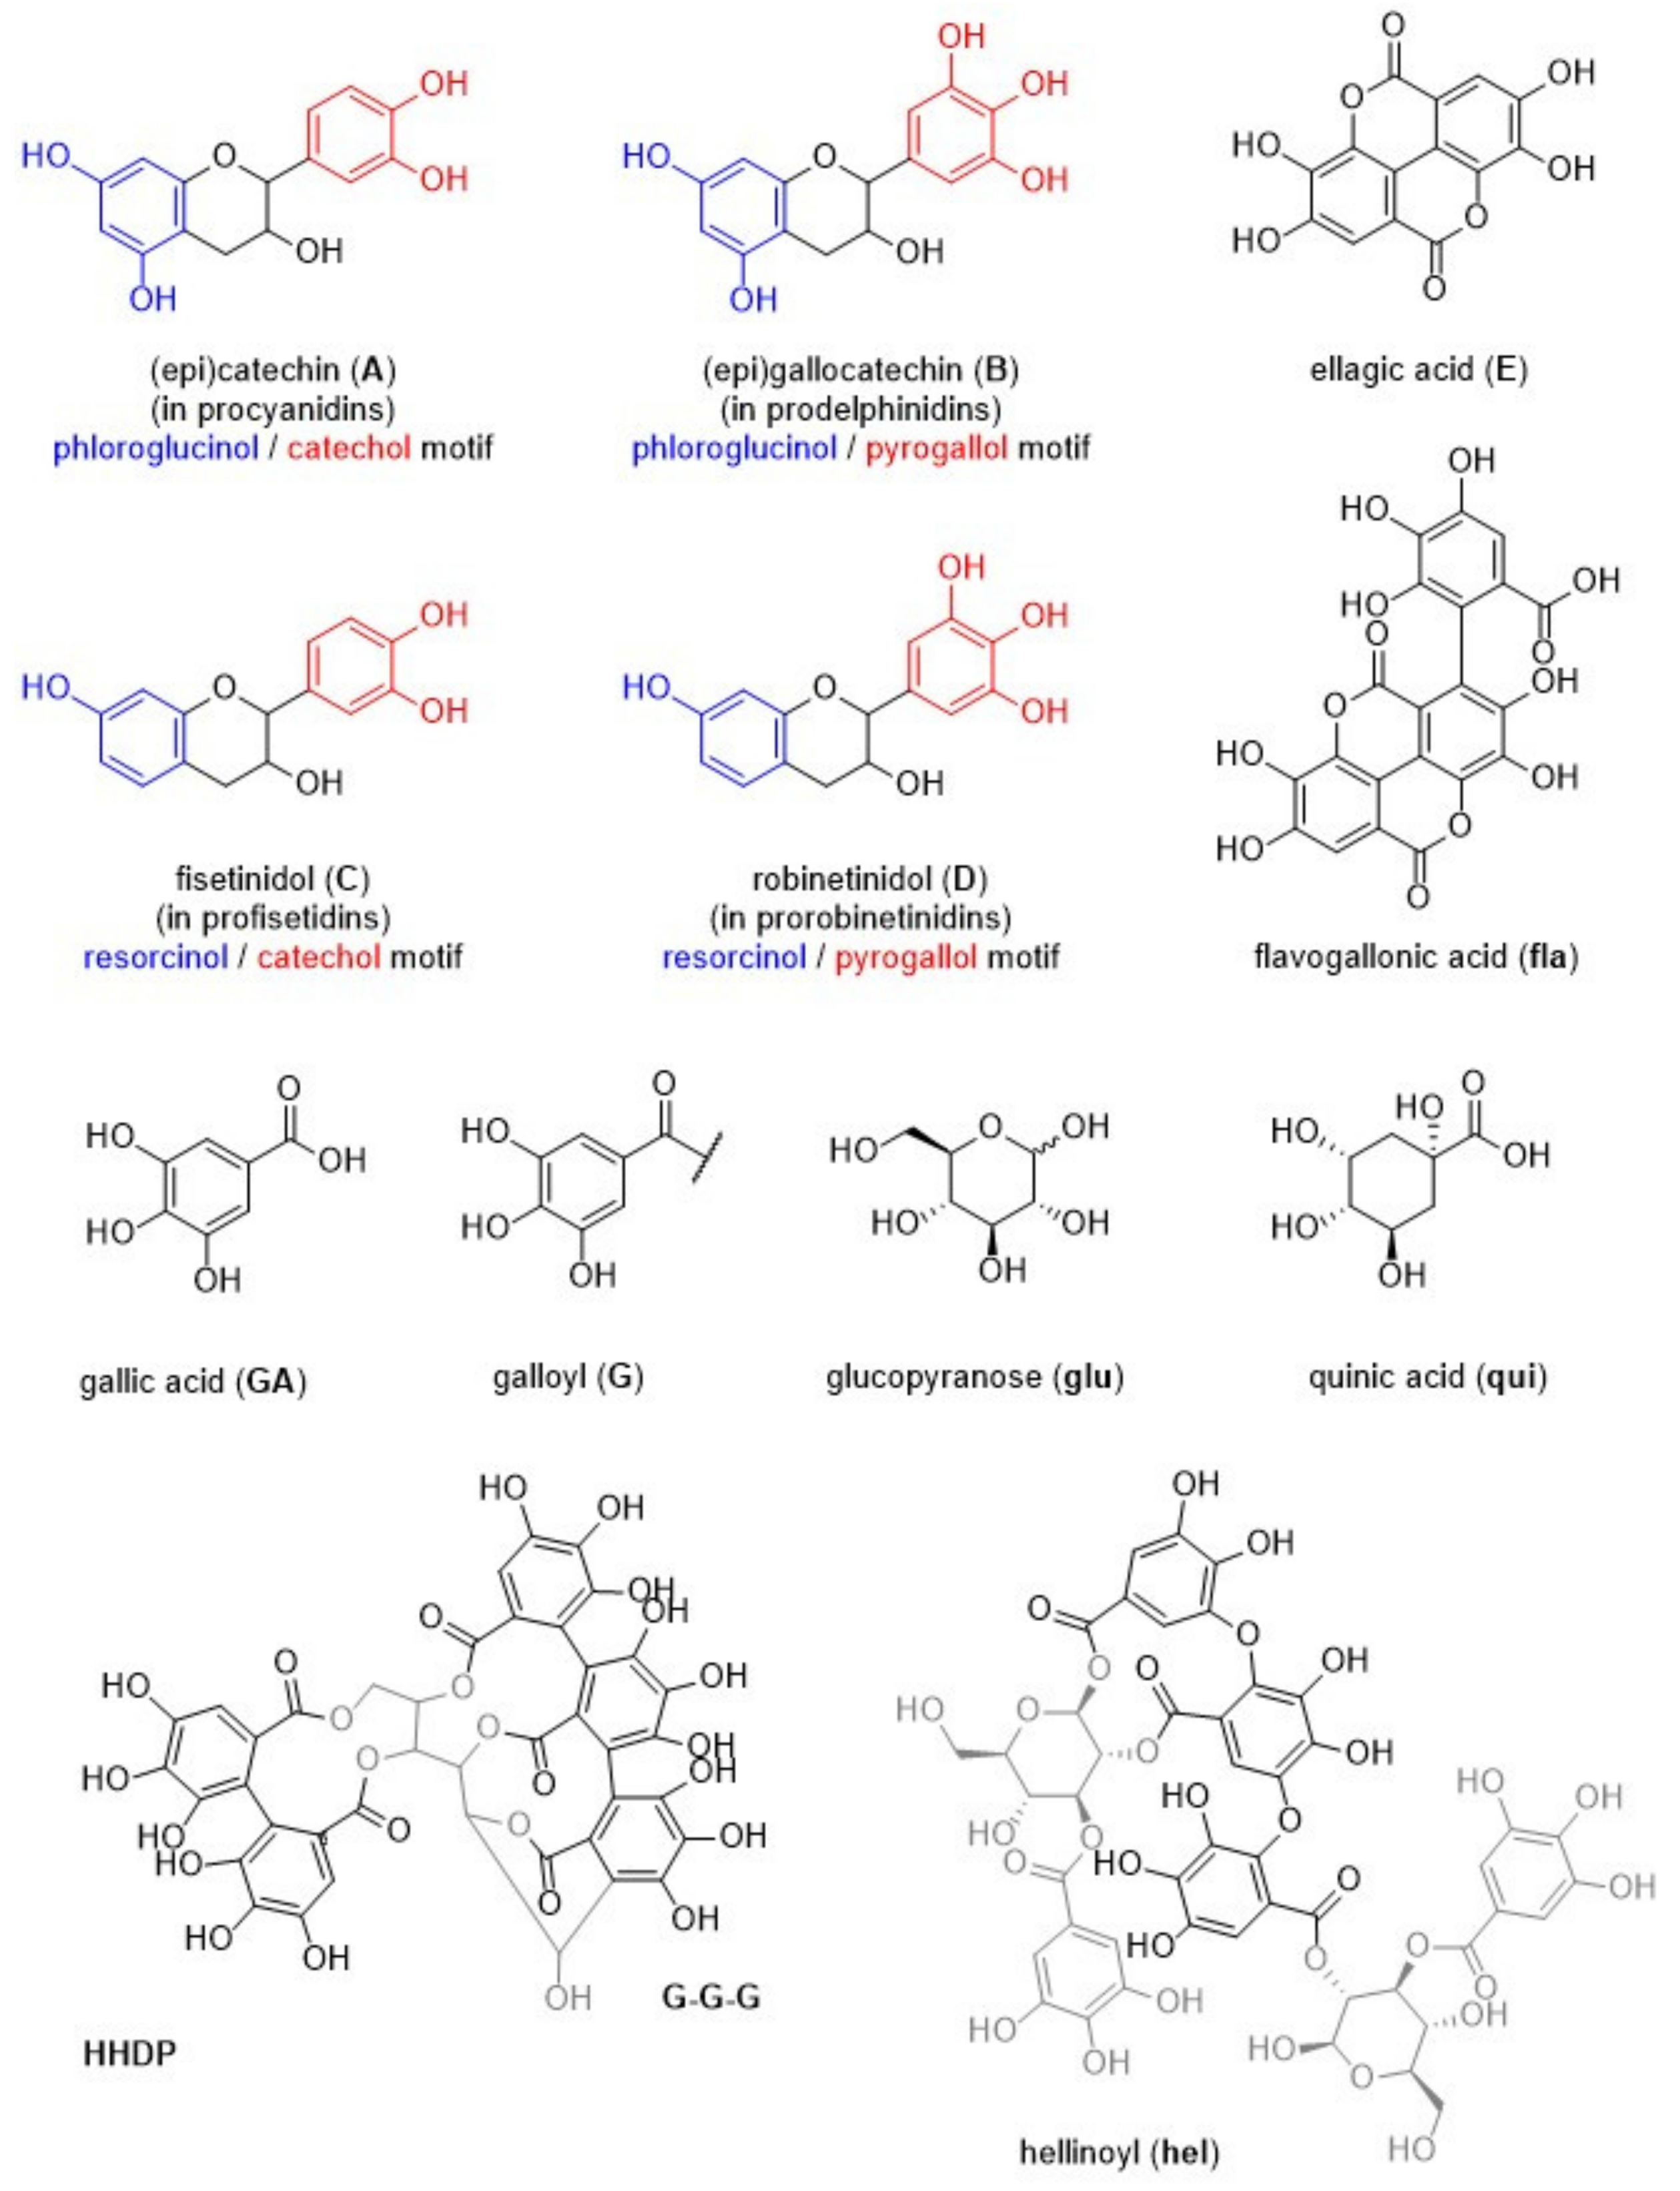
MALDI-ToF analyses were performed using a Voyager-DE™ PRO Biospectrometry™ Workstation operated using the Voyager operating software (version X). Samples were dissolved in water/acetone (4 mg/mL, 50/50 volume), and the solutions were mixed with the 2,6-dihydroxy-benzoic acid (2,6-DHB) matrix solution (10 mg/mL in acetone). For non-ionic analytes, to enhance ion formation, sodium chloride (NaCl) was added to the 2,6-dihydroxy-benzoic acid (2,6-DHB) solution (10 mg/mL in distilled water). The sample and the matrix solutions were mixed as follows: three parts matrix solution, three parts sample solution, one part NaCl solution; approximately 2.5 µL of the resulting mix was placed on the MALDI sample holder. After drying overnight in the dark, the samples were analysed using settings specifically optimised for each sample type. Assignments of mass peaks were achieved using (combinations of) the molecular mass(es) of the structural units shown in Figure 2.
3.4. Gel Permeation Chromatography (GPC)
Approximately 3 mg of tannin sample were dissolved in 1 mL DMSO containing 0.1% lithium chloride. A Shimadzu instrument was used consisting of a controller unit (CBM-20A), a pumping unit (LC 20AT), a degasser (DGU-20A3), a column oven (CTO-20AC), a diode array detector (SPD-M20A) and a refractive index detector (RID-10A); the system was controlled by Shimadzu LabSolutions (Version 5.42 SP3). Three analytical GPC columns (each 7.5 × 30 mm) in series were used for analyses: Agilent PLgel 5 µm 10,000 Å, followed by Agilent PLgel 5 µm 1000 Å, followed by an Agilent PLgel 5 µm 500 Å. HPLC-grade DMSO (Chromasolv®, Sigma-Aldrich) was used as an eluent at 70 °C column temperature. The run time at 0.25 mL min−1 flow rate was 20 min. Molecular weights were calculated from a linear calibration constructed with poly(styrene sulfonic acid) polymers (4300−2.6 × 10⁶ g mol−1); analyses were run in duplicate.
3.5. Determination of Cyanidin Content (Scalbert Test)
The standard procedure as described elsewhere was adapted [31]: 5.0 mL of an acidic ferrous solution (77 mg FeSO4·7 H2O in 500 mL HCl/n-C4H9OH (2/3)) were added to 0.5 mL of the aqueous tannin solution (1 mg/mL). The mixtures were heated at 95 °C during 15 min. The absorbance was read at λ = 530 nm employing a Shimadzu UV-1800 spectrophotometer, operated via UV Probe, Version 2.42. The results are expressed in cyanidin equivalents (CyaE) as mg per g of dry tannin material (mg CyaE/g tannin material) (ε mol (cyanidin) = 34,700 L mol−1cm−1) using Equation (1) with A—absorbance measured, V—volume, D—dilution factor, MW—molecular weight of cyanidin, ε—molar extinction coefficient cyanidin, l—path length, m—mass dry bark.
3.6. Determination of Total Phenolic Content (Folin-Ciocalteau Test)
The total phenolic content of the extracts was determined by the Folin–Ciocalteu method [32]: 2.5 mL of Folin reagent (diluted 10 times) was added to 0.5 mL of a solution of tannin in distilled water (0.1 mg/mL) or 0.5 mL of an aqueous solution of re-dissolved accurately weighed fibrous matrix (0.3 cm2/mL). After 2 min, 2.0 mL of sodium carbonate (7.5% (m/m)) were added. The mixture was heated at 50 °C for 5 min. The absorbance was read at λ = 765 nm employing a Shimadzu UV-1800 spectrophotometer, operated via UV Probe, Version 2.42. Calibration was achieved following this approach using a solution of gallic acid in distilled water (0.5 mg/mL), diluted to eight calibration points covering the range between 0 and 0.01 mg/mL for which a linear calibration curve was obtained. The results are reported as mg of gallic acid equivalent (GAE) per mg of dry tannin (mg GAE/mg tannin).
4. Conclusions
By employing a combination of analysis techniques well established in connection with the structural characterisation of tannins [21,22], such as HSQC and MALDI-ToF analysis, and quantitative 31P NMR [27], it was possible to determine the dominating structures of eleven commercialised tannin samples. By and large, the structural elucidation is in accordance with the structural discussions found in the manifold archival literature regarding the investigated tannins. More importantly, however, the detailed analysis allowed for veryfying the nature of the tannin as proposed by the vendor. The analysis gave an insight into the quality of the various samples in terms of impurities. Carbohydrates and small molecular weight gallic acid-stemming compounds were identified as the main sources of impurity. 31P NMR allows the direct structural assignment of tannins not only as pure compounds but also when present in complex matrices highly polluted by impurities. Based on the structural information obtained, the tannins can be used for chemical derivatisation and biological testing, as will be reported in due course.
Supplementary Materials
Figure S1: NMR analyses of Omnivin WG (Vv): (A) 31P NMR; (B) 1H-13C HSQC, Figure S2: MALDI-ToF analysis of Omnivin WG (Vv). Figure S3: NMR analyses of Omnivin R (Vv-R): (A) 31P NMR; (B) 1H-13C HSQC. Figure S4: MALDI-ToF analysis of Omnivin R (Vv-R). Figure S5: NMR analyses of Omnivin 10R (Vv-10): (A) 31P NMR; (B) 1H-13C HSQC. Figure S6: MALDI-ToF analysis of Omnivin 10R (Vv-10). Figure S7: NMR analyses of Omnivin R20 (Vv-20): (A) 31P NMR; (B) 1H-13C HSQC. Figure S8: MALDI-ToF analysis of Omnivin 20R (Vv-20). Figure S9: NMR analyses of MIMOSA ATO ME (Am): (A) 31P NMR; (B) 1H-13C HSQC. Figure S10: MALDI-ToF analysis of MIMOSA ATO ME (Am). Figure S11: NMR analyses of QUEBRACHO ATO (Sb): (A) 31P NMR; (B) 1H-13C HSQC. Figure S12: MALDI-ToF analyses of QUEBRACHO ATO (Sb). Figure S13: NMR analyses of Tanal 01 (Ta-01): (A) 31P NMR; (B) 1H-13C HSQC. Figure S14: MALDI-ToF analyses of Tanal-01 (Ta-01). Figure S15: NMR analyses of Tanal 02 (Ta-02): (A) 31P NMR; (B) 1H-13C HSQC. Figure S16: MALDI-ToF analyses of Tanal-01 (Ta-02). Figure S17: NMR analyses of Tanal 04 (Ta-04): (A) 31P NMR; (B) 1H-13C HSQC. Figure S18: MALDI-ToF analyses of Tanal-01 (Ta-04). Figure S19: NMR analyses of TARA POLV TIPO A (Ct): (A) 31P NMR; (B) 1H-13C HSQC. Figure S20: MALDI-ToF analyses of TARA POLV TIPO A (Ct). Figure S21: NMR analyses of VEGETAN CN POLVERE (Cs): (A) 31P NMR; (B) 1H-13C HSQC. Figure S22: MALDI-ToF analyses of VEGETAN CN POLVERE (Cs). Table S1: Results of qualitative 1H-13C HSQC analyses of commercialised condensed tannins according to literature reports. Table S2: MALDI-ToF analysis of commercialised condensed tannins. Table S3: Results of qualitative 1H-13C HSQC analyses of commercialised hydrolysable tannins according to literature reports. Table S4: MALDI-ToF analysis of commercialised hydrolysable tannins.
Author Contributions
L.Z.—investigation, data curation; H.L.—supervision, methodology, data curation, writing—original draft preparation, writing—reviewing and editing; C.C.—conceptualization, methodology, funding, data curation, supervision, writing—reviewing and editing. All authors have read and agreed to the published version of the manuscript.
Funding
The H2020-MSCA-ITN-2016–BIO-CLEAN project (grant agreement No. 722871) is highly acknowledged for funding a PhD position for L.Z. and for general financial support.
Institutional Review Board Statement
Not Applicable.
Informed Consent Statement
Not Applicable.
Data Availability Statement
All data is reported in the main article or in the Supplementary Materials.
Acknowledgments
C.C. acknowledges the Ca’Foscari FPI 2019 funding. All the authors would like to thank A.S. Ajinomoto OmniChem N.V. in Belgium as well as Figli di Guido Lapi s.p.a. in Italy for generously providing samples of commercialised tannins.
Conflicts of Interest
The authors declare no conflict of interest.
References
- Pizzi, A. Tannins: Major Sources, Properties and Applications. In Monomers, Polymers and Composites from Renewable Resources; Elsevier: Amsterdam, The Netherlands, 2008; pp. 179–199. ISBN 978-0-08-045316-3. [Google Scholar]
- Khanbabaee, K.; van Ree, T. Tannins: Classification and Definition. Nat. Prod. Rep. 2001, 18, 641–649. [Google Scholar] [CrossRef] [PubMed]
- Peter Constabel, C.; Yoshida, K.; Walker, V. Diverse Ecological Roles of Plant Tannins: Plant Defense and Beyond. In Recent Advances in Polyphenol Research; Romani, A., Lattanzio, V., Quideau, S., Eds.; John Wiley & Sons, Ltd.: Chichester, UK, 2014; pp. 115–142. ISBN 978-1-118-32963-4. [Google Scholar]
- Goldstein, J.L.; Swain, T. The Inhibition of Enzymes by Tannins. Phytochemistry 1965, 4, 185–192. [Google Scholar] [CrossRef]
- Granica, S.; Piwowarski, J.P.; Kiss, A.K. Ellagitannins Modulate the Inflammatory Response of Human Neutrophils Ex Vivo. Phytomedicine 2015, 22, 1215–1222. [Google Scholar] [CrossRef]
- Serrano, J.; Puupponen-Pimiä, R.; Dauer, A.; Aura, A.-M.; Saura-Calixto, F. Tannins: Current Knowledge of Food Sources, Intake, Bioavailability and Biological Effects. Mol. Nutr. Food Res. 2009, 53, S310–S329. [Google Scholar] [CrossRef] [PubMed] [Green Version]
- Chan, E.W.C.; Soh, E.Y.; Tie, P.P.; Law, Y.P. Antioxidant and Antibacterial Properties of Green, Black, and Herbal Teas of Camellia Sinensis. Pharmacogn. Res. 2011, 3, 266–272. [Google Scholar] [CrossRef] [PubMed] [Green Version]
- Rigo, A.; Vianello, F.; Clementi, G.; Rossetto, M.; Scarpa, M.; Vrhovšek, U.; Mattivi, F. Contribution of Proanthocyanidins to the Peroxy Radical Scavenging Capacity of Some Italian Red Wines. J. Agric. Food Chem. 2000, 48, 1996–2002. [Google Scholar] [CrossRef] [PubMed]
- Haslam, E. Plant Polyphenols: Vegetable Tannins Revisited; Chemistry and Pharmacology of Natural Products; Cambridge University Press: Cambridge, UK, 1989. [Google Scholar]
- Pizzi, A. Tannins: Prospectives and Actual Industrial Applications. Biomolecules 2019, 9, 344. [Google Scholar] [CrossRef] [PubMed] [Green Version]
- Trentin, D.S.; Silva, D.B.; Frasson, A.P.; Rzhepishevska, O.; da Silva, M.V.; de Pulcini, E.L.; James, G.; Soares, G.V.; Tasca, T.; Ramstedt, M.; et al. Natural Green Coating Inhibits Adhesion of Clinically Important Bacteria. Sci. Rep. 2015, 5, 1–10. [Google Scholar] [CrossRef] [Green Version]
- Aouf, C.; Benyahya, S.; Esnouf, A.; Caillol, S.; Boutevin, B.; Fulcrand, H. Tara Tannins as Phenolic Precursors of Thermosetting Epoxy Resins. Eur. Polym. J. 2014, 55, 186–198. [Google Scholar] [CrossRef]
- Mongkholrattanasit, R.; Kryštůfek, J.; Wiener, J.; Studničková, J. Properties of Wool and Cotton Fabrics Dyed with Eucalyptus, Tannin and Flavonoids. Fibres Text. East. Eur. 2011, 19, 90–95. [Google Scholar]
- Bianchetti, G.O.; Celliers, J.M.; Crestini, C. Cleaning and/or Treatment Compositions. US Patent 20170088798A1, 12 December 2016. [Google Scholar]
- Shao, D.; Li, J.; Li, J.; Tang, R.; Liu, L.; Shi, J.; Huang, Q.; Yang, H. Inhibition of Gallic Acid on the Growth and Biofilm Formation of Escherichia coli and Streptococcus mutans. J. Food Sci. 2015, 80, M1299–M1305. [Google Scholar] [CrossRef] [PubMed]
- Rendeková, K.; Fialová, S.; Jánošová, L.; Mučaji, P.; Slobodníková, L. The Activity of Cotinus Coggygria Scop. Leaves on Staphylococcus Aureus Strains in Planktonic and Biofilm Growth Forms. Molecules 2016, 21, 50. [Google Scholar] [CrossRef] [PubMed] [Green Version]
- Klug, T.V.; Novello, J.; Laranja, D.C.; Aguirre, T.A.S.; de Oliveira Rios, A.; Tondo, E.C.; dos Santos, R.P.; Bender, R.J. Effect of Tannin Extracts on Biofilms and Attachment of Escherichia Coli on Lettuce Leaves. Food Bioprocess Technol. 2017, 10, 275–283. [Google Scholar] [CrossRef]
- Tomiyama, K.; Mukai, Y.; Saito, M.; Watanabe, K.; Kumada, H.; Nihei, T.; Hamada, N.; Teranaka, T. Antibacterial Action of a Condensed Tannin Extracted from Astringent Persimmon as a Component of Food Addictive Pancil PS-M on Oral Polymicrobial Biofilms. BioMed Res. Int. 2016, 2016, e5730748. [Google Scholar] [CrossRef] [PubMed] [Green Version]
- Trentin, D.S.; Silva, D.B.; Amaral, M.W.; Zimmer, K.R.; Silva, M.V.; Lopes, N.P.; Giordani, R.B.; Macedo, A.J. Tannins Possessing Bacteriostatic Effect Impair Pseudomonas Aeruginosa Adhesion and Biofilm Formation. PLoS ONE 2013, 8, e66257. [Google Scholar] [CrossRef] [PubMed]
- Patra, A.K.; Saxena, J. Exploitation of Dietary Tannins to Improve Rumen Metabolism and Ruminant Nutrition. J. Sci. Food Agric. 2011, 91, 24–37. [Google Scholar] [CrossRef]
- Schofield, P.; Mbugua, D.M.; Pell, A.N. Analysis of Condensed Tannins: A Review. Anim. Feed Sci. Technol. 2001, 91, 21–40. [Google Scholar] [CrossRef]
- Mueller-Harvey, I. Analysis of Hydrolysable Tannins. Anim. Feed Sci. Technol. 2001, 91, 3–20. [Google Scholar] [CrossRef]
- De Souza, L.M.; Cipriani, T.R.; Iacomini, M.; Gorin, P.A.J.; Sassaki, G.L. HPLC/ESI-MS and NMR Analysis of Flavonoids and Tannins in Bioactive Extract from Leaves of Maytenus Ilicifolia. J. Pharm. Biomed. Anal. 2008, 47, 59–67. [Google Scholar] [CrossRef] [PubMed]
- Konai, N.; Raidandi, D.; Pizzi, A.; Meva’a, L. Characterization of Ficus Sycomorus Tannin Using ATR-FT MIR, MALDI-TOF MS and 13C NMR Methods. Eur. J. Wood Wood Prod. 2017, 75, 807–815. [Google Scholar] [CrossRef]
- Noreljaleel, A.E.M.; Kemp, G.; Wilhelm, A.; van der Westhuizen, J.H.; Bonnet, S.L. Analysis of Commercial Proanthocyanidins. Part 5: A High Resolution Mass Spectrometry Investigation of the Chemical Composition of Sulfited Wattle (Acacia Mearnsii De Wild.) Bark Extract. Phytochemistry 2019, 162, 109–120. [Google Scholar] [CrossRef]
- Ricci, A.; Parpinello, G.P.; Palma, A.S.; Teslić, N.; Brilli, C.; Pizzi, A.; Versari, A. Analytical Profiling of Food-Grade Extracts from Grape (Vitis Vinifera Sp.) Seeds and Skins, Green Tea (Camellia Sinensis) Leaves and Limousin Oak (Quercus Robur) Heartwood Using MALDI-TOF-MS, ICP-MS and Spectrophotometric Methods. J. Food Compos. Anal. 2017, 59, 95–104. [Google Scholar] [CrossRef]
- Meng, X.; Crestini, C.; Ben, H.; Hao, N.; Pu, Y.; Ragauskas, A.J.; Argyropoulos, D.S. Determination of Hydroxyl Groups in Biorefinery Resources via Quantitative 31P NMR Spectroscopy. Nat. Protoc. 2019, 14, 2627–2647. [Google Scholar] [CrossRef] [PubMed]
- Melone, F.; Saladino, R.; Lange, H.; Crestini, C. Tannin Structural Elucidation and Quantitative 31P NMR Analysis. Model Compounds. J. Agric. Food Chem. 2013, 61, 9307–9315. [Google Scholar] [CrossRef] [PubMed] [Green Version]
- Melone, F.; Saladino, R.; Lange, H.; Crestini, C. Tannin Structural Elucidation and Quantitative 31P NMR Analysis. Hydrolyzable Tannins and Proanthocyanidins. J. Agric. Food Chem. 2013, 61, 9316–9324. [Google Scholar] [CrossRef]
- Crestini, C.; Lange, H.; Bianchetti, G. Detailed Chemical Composition of Condensed Tannins via Quantitative 31P NMR and HSQC Analyses: Acacia Catechu, Schinopsis Balansae, and Acacia Mearnsii. J. Nat. Prod. 2016, 79, 2287–2295. [Google Scholar] [CrossRef] [PubMed]
- Bahorun, T.; Luximon-Ramma, A.; Crozier, A.; Aruoma, O.I. Total Phenol, Flavonoid, Proanthocyanidin and Vitamin C Levels and Antioxidant Activities of Mauritian Vegetables. J. Sci. Food Agric. 2004, 84, 1553–1561. [Google Scholar] [CrossRef]
- Singleton, V.L.; Rossi, J.A. Colorimetry of Total Phenolics with Phosphomolybdic-Phosphotungstic Acid Reagents. Am. J. Enol. Vitic. 1965, 16, 144–158. [Google Scholar]
- Davis, A.L.; Cai, Y.; Davies, A.P.; Lewis, J.R. 1H and 13C NMR Assignments of Some Green Tea Polyphenols. Magn. Reson. Chem. 1996, 34, 887–890. [Google Scholar] [CrossRef]
- Thompson, D.; Pizzi, A. Simple 13C-NMR Methods for Quantitative Determinations of Polyflavonoid Tannin Characteristics. J. Appl. Polym. Sci. 1995, 55, 107–112. [Google Scholar] [CrossRef]
- Hoong, Y.B.; Pizzi, A.; Tahir, P.M.; Pasch, H. Characterization of Acacia Mangium Polyflavonoid Tannins by MALDI-TOF Mass Spectrometry and CP-MAS 13C NMR. Eur. Polym. J. 2010, 46, 1268–1277. [Google Scholar] [CrossRef]
- Falcão, L.; Araújo, M. Vegetable Tannins Used in the Manufacture of Historic Leathers. Molecules 2018, 23, 1081. [Google Scholar] [CrossRef] [PubMed] [Green Version]
- Lange, H.; Rulli, F.; Crestini, C. Gel Permeation Chromatography in Determining Molecular Weights of Lignins: Critical Aspects Revisited for Improved Utility in the Development of Novel Materials. ACS Sustain. Chem. Eng. 2016, 4, 5167–5180. [Google Scholar] [CrossRef]
Figure 1.
Analytical toolbox and workflow for elucidating structural features of commercially available tannins.
Figure 1.
Analytical toolbox and workflow for elucidating structural features of commercially available tannins.

Figure 2.
Structural elements used for discussing the various analysis data. Structures in grey are not name-giving.
Figure 2.
Structural elements used for discussing the various analysis data. Structures in grey are not name-giving.

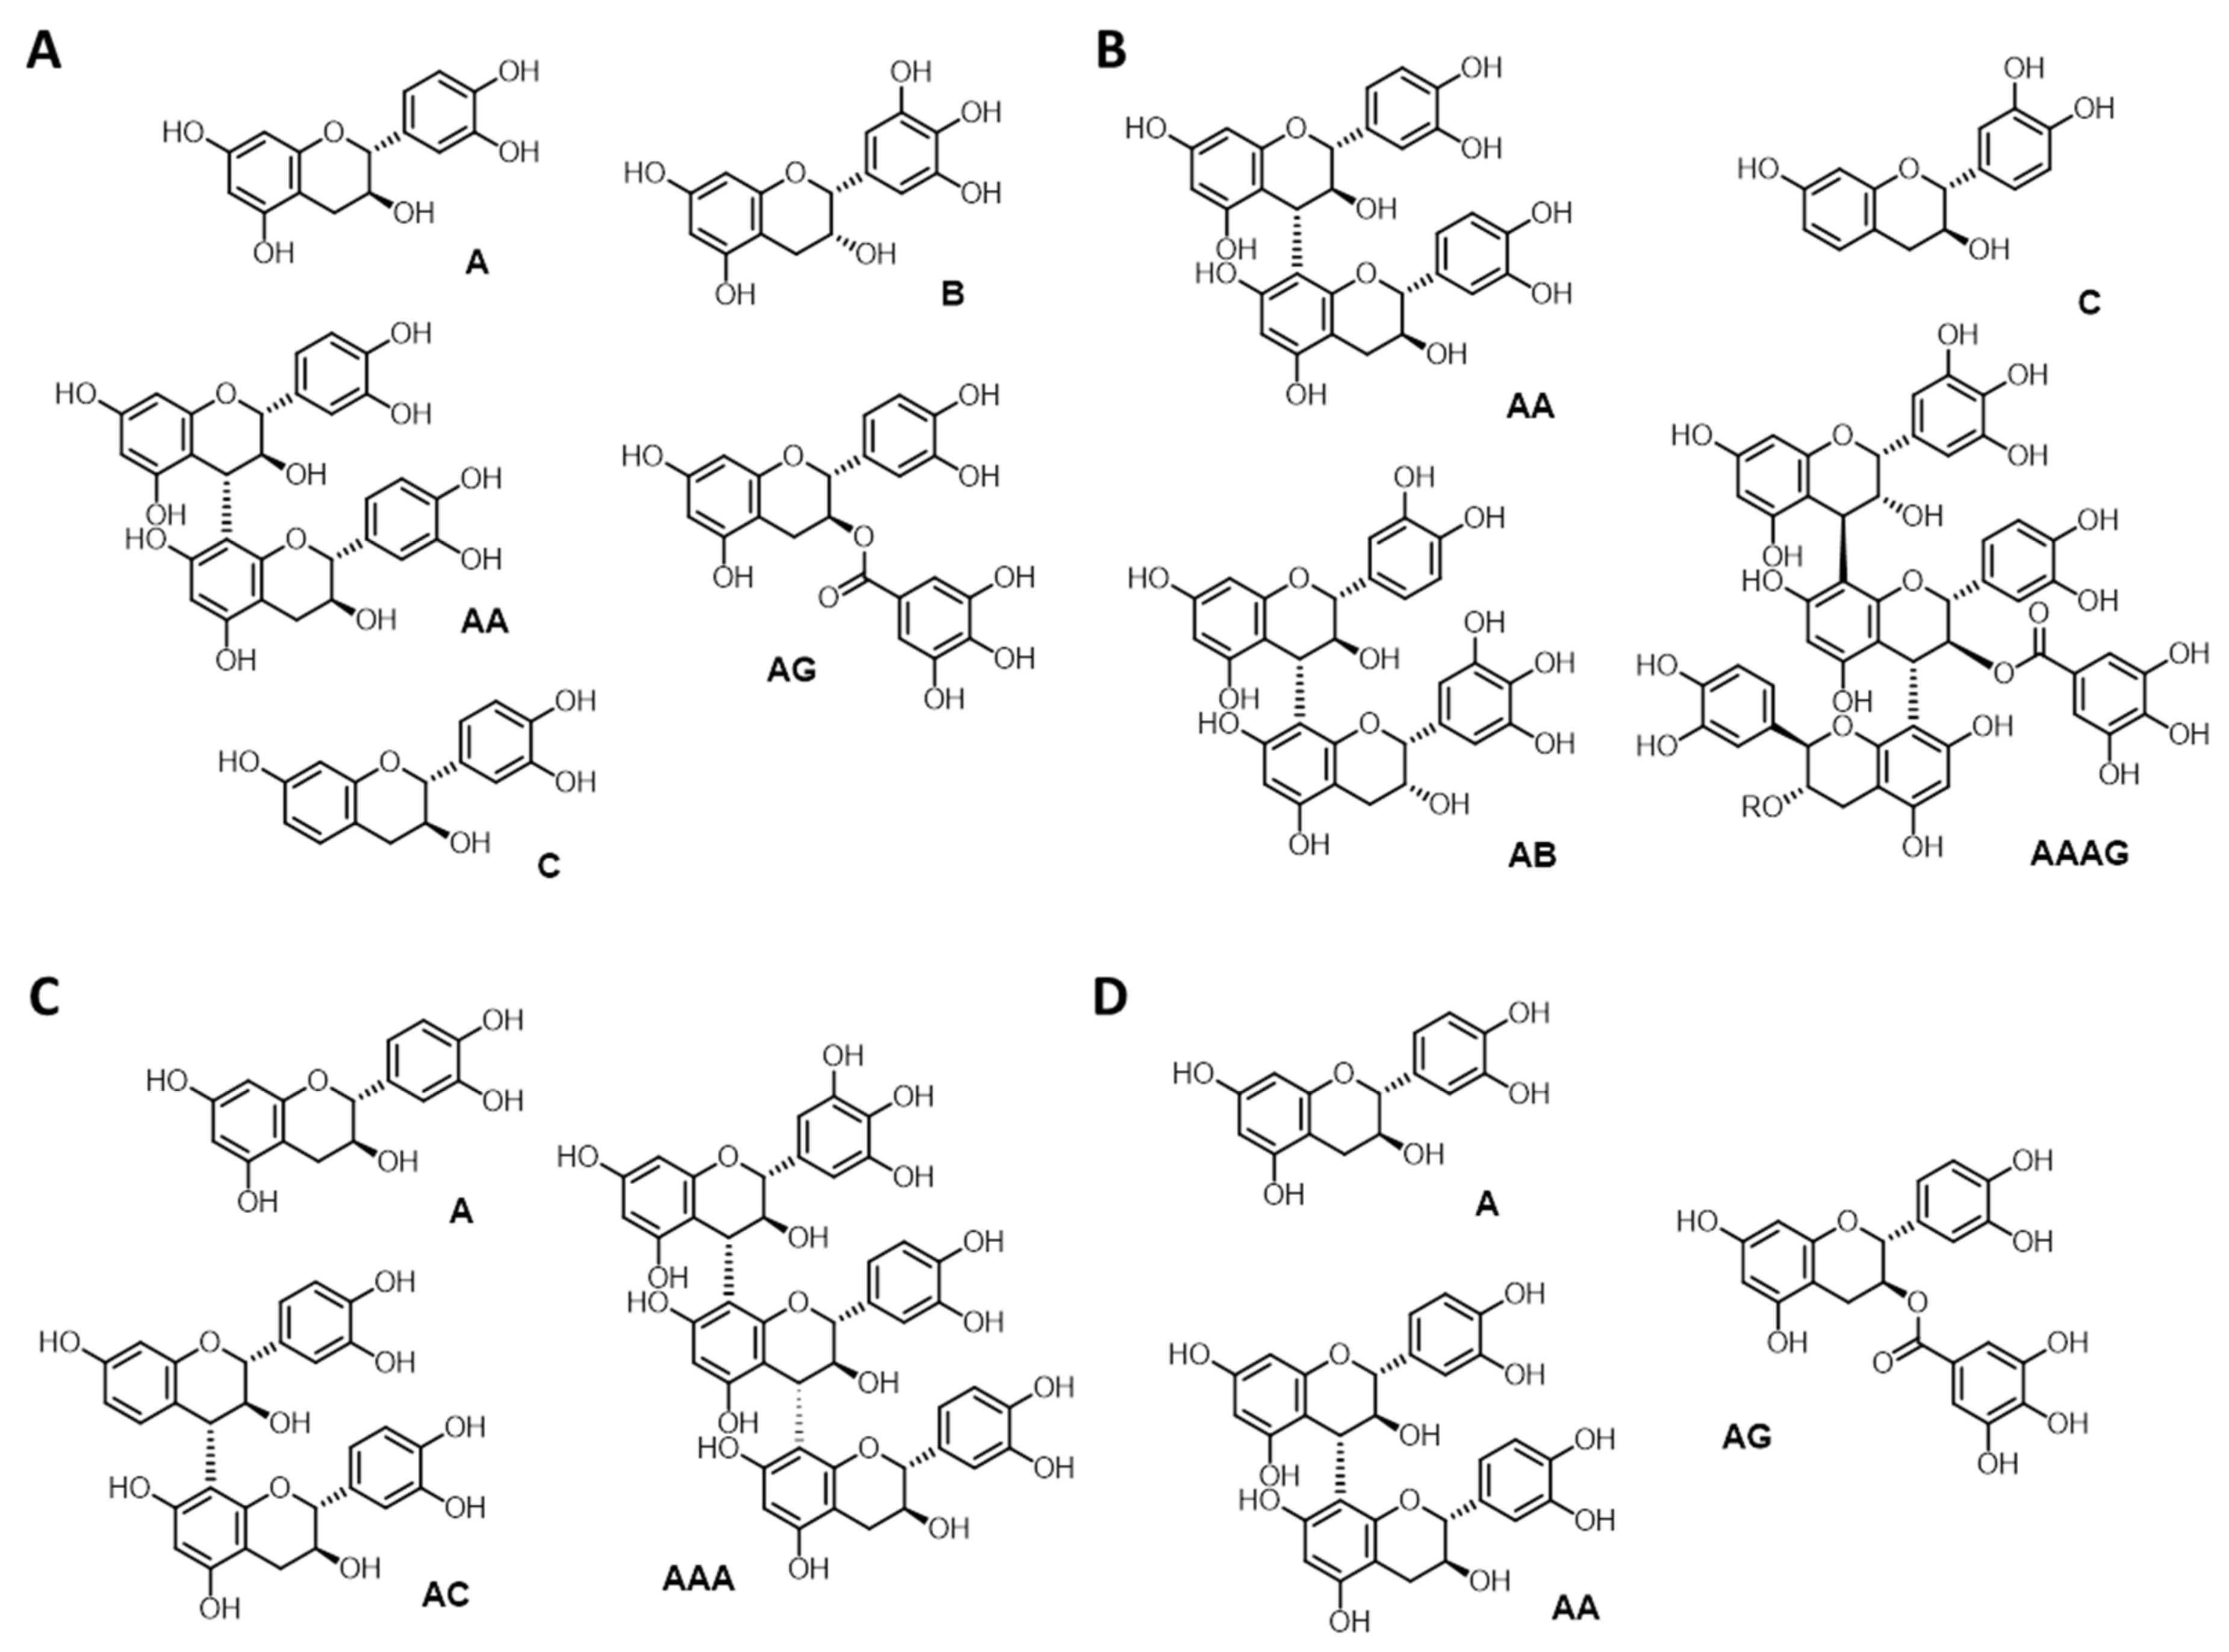
Figure 3.
Representative examples of structural features identified on the basis of NMR and MALDI-ToF data in (A) Omnivin WG (Vv); (B) Omnivin R (Vv-R); (C) Omnivin 10R (Vv-10); and (D) Omnivin 20R (Vv-20).
Figure 3.
Representative examples of structural features identified on the basis of NMR and MALDI-ToF data in (A) Omnivin WG (Vv); (B) Omnivin R (Vv-R); (C) Omnivin 10R (Vv-10); and (D) Omnivin 20R (Vv-20).

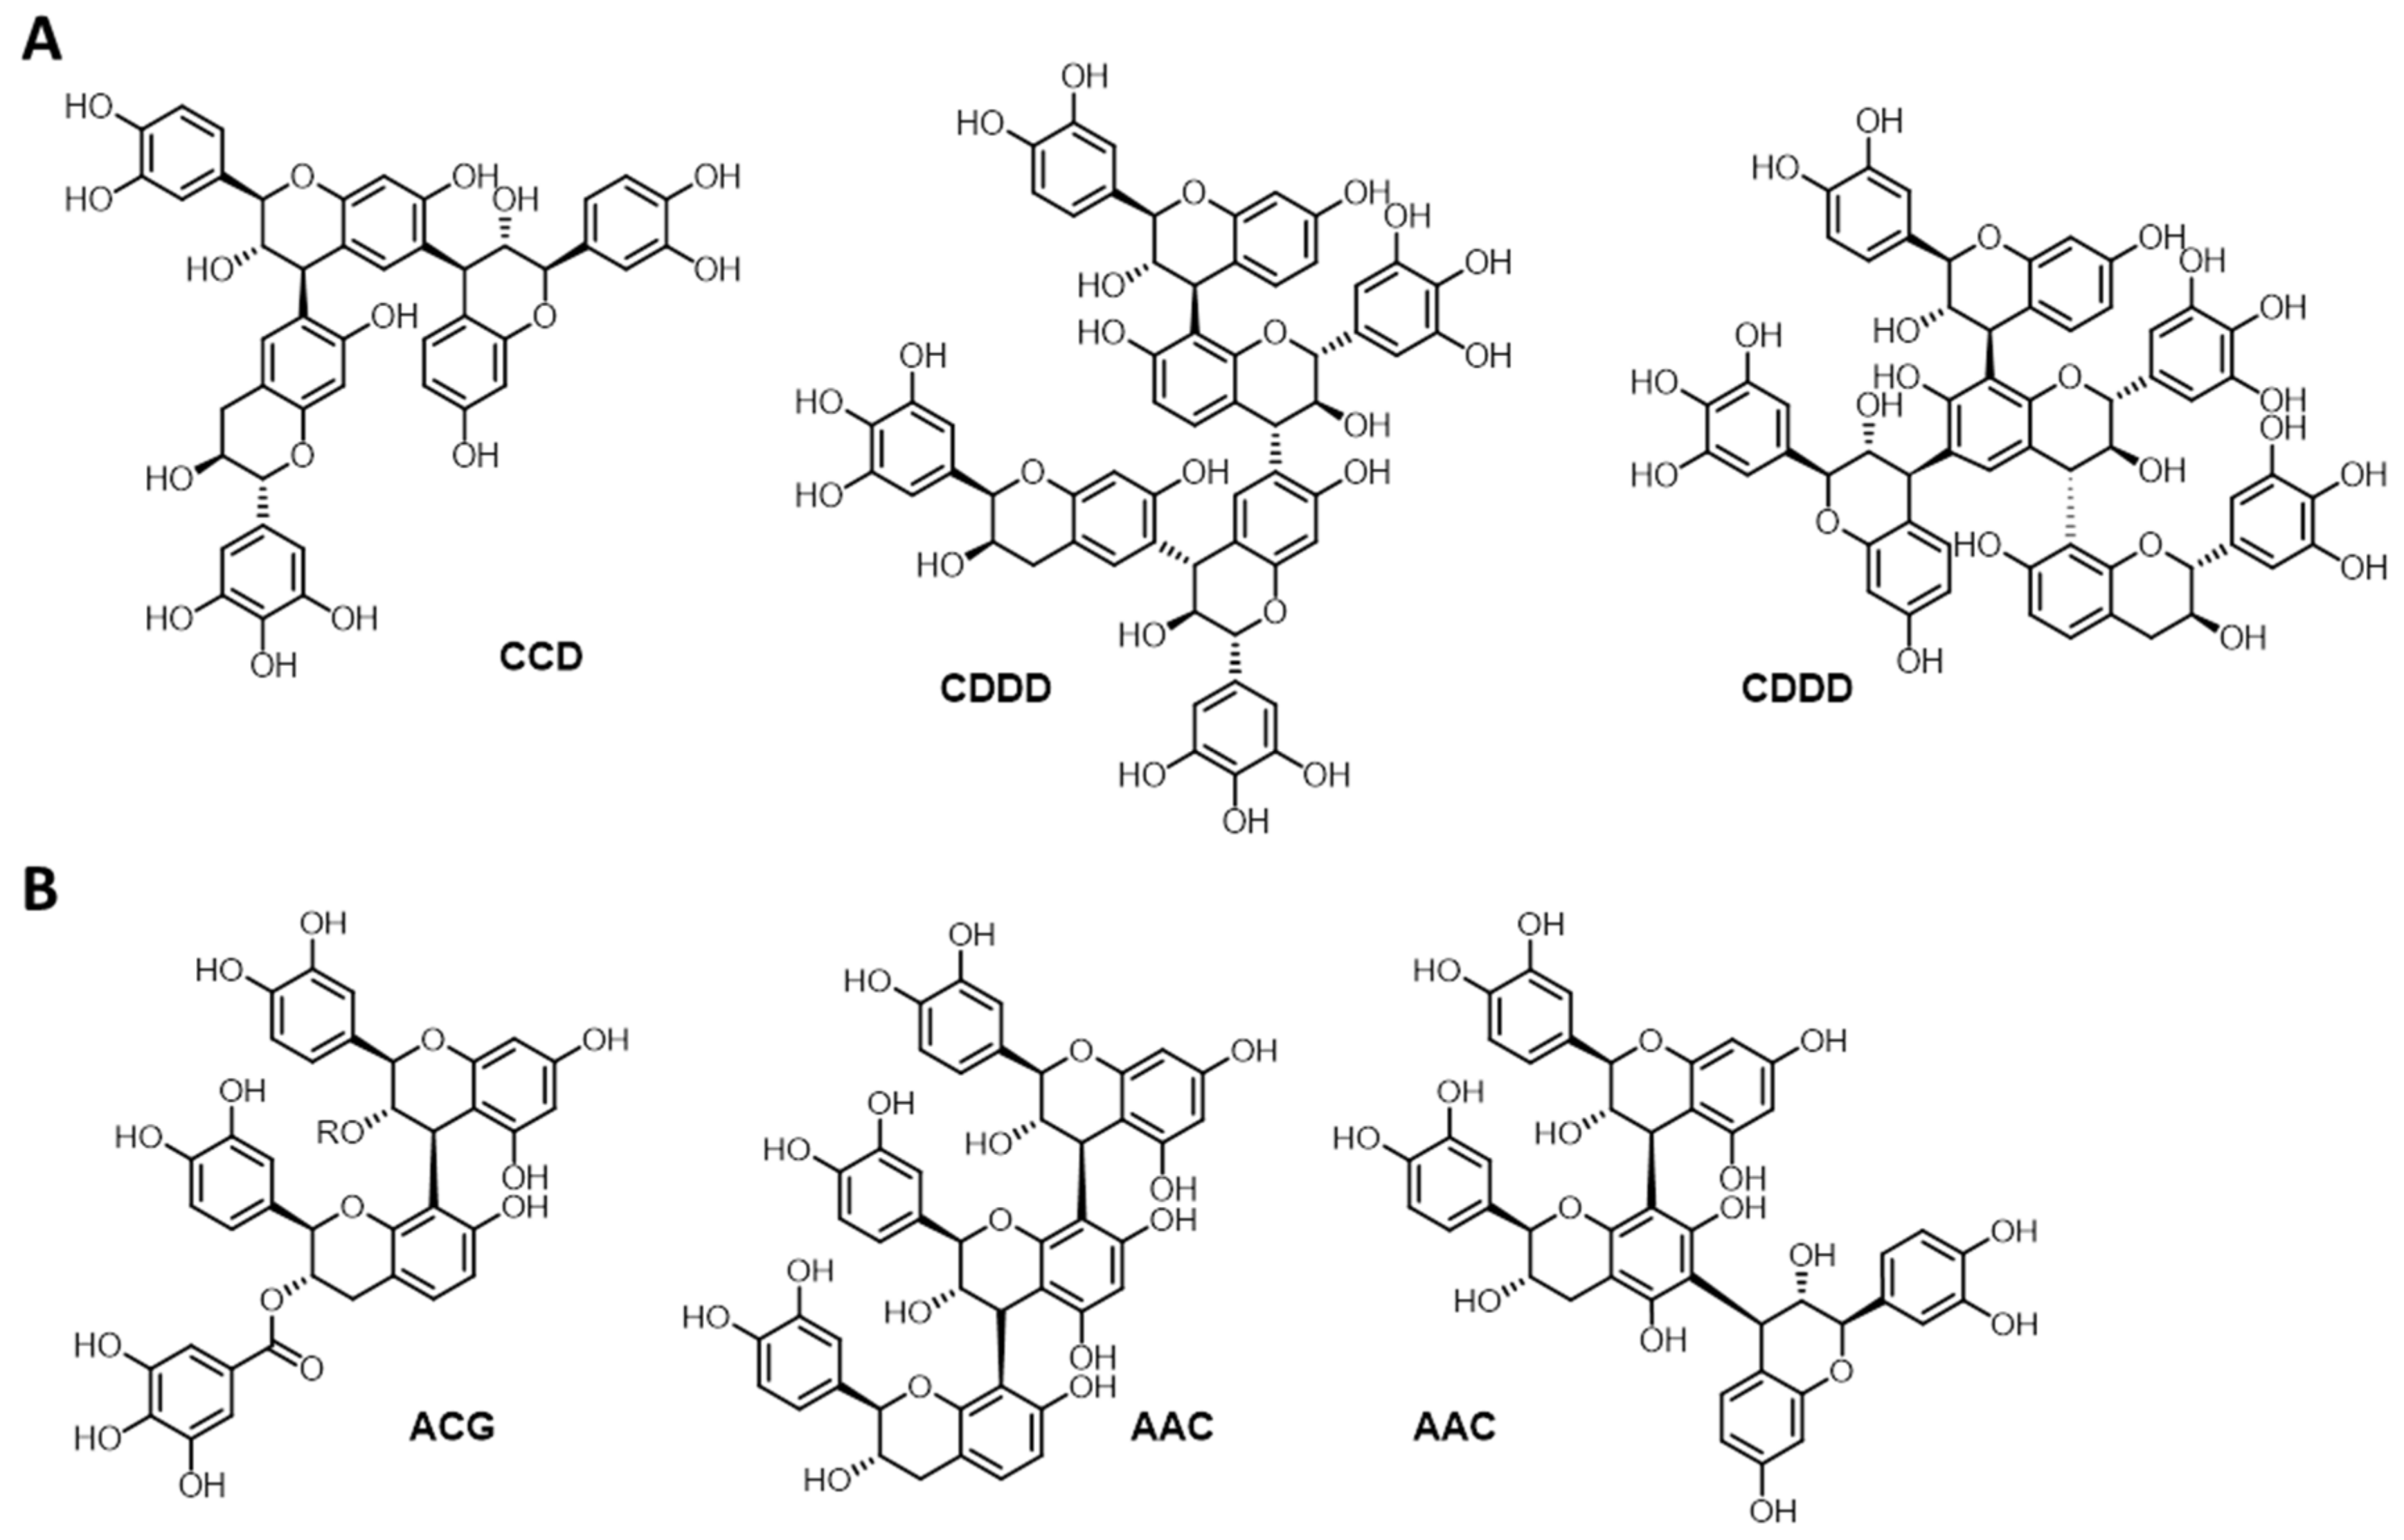
Figure 4.
Structural representations delineated on the basis of NMR and MALDI-ToF data of (A) MIMOSA ATO ME (Am) and (B) QUEBRACHO ATO (Sb).
Figure 4.
Structural representations delineated on the basis of NMR and MALDI-ToF data of (A) MIMOSA ATO ME (Am) and (B) QUEBRACHO ATO (Sb).

Figure 5.
Correlation between the results obtained for the total phenol content by means of quantitative 31P NMR and the Folin–Ciocalteau method.
Figure 5.
Correlation between the results obtained for the total phenol content by means of quantitative 31P NMR and the Folin–Ciocalteau method.

Figure 6.
Structural representation of Tanal 01 (Ta-01) and Tanal 02 (Ta-02). Structural ‘impurities’ such as hellinoyl and flavogallonic acid are not indicated.
Figure 6.
Structural representation of Tanal 01 (Ta-01) and Tanal 02 (Ta-02). Structural ‘impurities’ such as hellinoyl and flavogallonic acid are not indicated.

Figure 7.
Structural representation delineated on the basis of NMR and MALDI-ToF data of (A) Tanal 04 (Ta-04) and (B) TARA POLV TIPO A (Ct).
Figure 7.
Structural representation delineated on the basis of NMR and MALDI-ToF data of (A) Tanal 04 (Ta-04) and (B) TARA POLV TIPO A (Ct).

Figure 8.
Structural representation delineated on the basis of NMR and MALDI-ToF data of VEGETAN CN POLVERE (Cs).
Figure 8.
Structural representation delineated on the basis of NMR and MALDI-ToF data of VEGETAN CN POLVERE (Cs).


Table 1.
Commercially available tannins used for a detailed structural characterisation.
| Samples (Species) | (Presumable) Tannin Type | Supplier | Code |
|---|---|---|---|
| Omnivin WG (Vitis vinifera) | condensed | OmniChem | Vv |
| Omnivin R (Vitis vinifera) | condensed | OmniChem | Vv-R |
| Omnivin 10R (Vitis vinifera) | condensed | OmniChem | Vv-10 |
| Omnivin 20R (Vitis vinifera) | condensed | OmniChem | Vv-20 |
| MIMOSA ATO ME (Acacia mearnsii) | condensed | Figli di Guido Lapi | Am |
| QUEBARACHO ATO (Schinopsis balansae) | condensed | Figli di Guido Lapi | Sb |
| Tanal 01 (unknown) | hydrolysable (gallotannin) | OmniChem | Ta-01 |
| Tanal 02 (unknown) | hydrolysable (gallotannin) | OmniChem | Ta-02 |
| Tanal 04 (unknown) | hydrolysable (gallotannin) | OmniChem | Ta-04 |
| TARA POLV TIPO A (Caesalpina tinctoria) | hydrolysable (gallotannin) | Figli di Guido Lapi | Ct |
| VEGETAN CN POLVERE (Castanea sativa) | hydrolysable (ellagitannin) | Figli di Guido Lapi | Cs |
Table 2.
Results of quantitative 31P NMR analyses of phosphitylated commercially available condensed tannins, number average molecular weights and polydispersities as well as cyanidin contents and total phenolic OH-group content. Errors vary depending on signal overlap (see Supplementary Materials); the average error is 0.5 mmol/g.
| Cond. Tannin | OH-Groups Content [Mmol/g] | MN [Da] (PD) | SCAL-bert c | Folin d | |||||||
|---|---|---|---|---|---|---|---|---|---|---|---|
| Aliphatic | A-ring | B-ring | Total Phenol b | Gallate a | Acidic | ||||||
| Ortho-Phenol | Free Phenol | Pyro-Gallol [a] | Catechol a | ||||||||
| Vv | 4.22 | 0.88 | 0.50 | 0.11 | 2.64 | 9.18 | 0.50 | 0.55 | 300 (7.1) | 176 | 0.71 |
| Vv-R | 7.61 | 0.23 | 0.28 | 0.08 | 1.38 | 4.86 | 0.32 | 0.59 | 500 (6.6) | 145 | 0.45 |
| Vv-10 | 7.49 | 0.69 | 0.31 | 0.07 | 1.62 | 5.79 | 0.31 | 0.59 | 400 (7.0) | 156 | 0.50 |
| Vv-20 | 2.57 | 3.04 | 0.47 | 0.00 | 3.06 | 10.9 | 0.25 | 0.47 | 300 (3.2) | 113 | 0.51 |
| Am | 5.97 | 0.00 | 0.61 | 1.54 | 1.85 | 8.28 | 0.27 | 0.12 | 400 (2.4) | 135 | 0.56 |
| Sb | 3.40 | 0.84 | 0.35 | 0.12 | 1.78 | 5.60 | 0.23 | 0.30 | 500 (3.9) | 189 | 0.54 |
a: Abundance of motif as a whole; i.e., pyrogallol with 3 OH-groups, catechol with 2 OH-groups. b: Value over complete phenolic shift range (144.00 to 137.00 ppm). c: Cyanidin content according to Scalbert’s test in [CyaE mg/g] [31]. d: Total phenol content according to the Folin–Ciocalteau assay in [mg GAE/mg tannin] [32].
Table 3.
Structural features of the A and B Rings, as well as flavan-3-ol content in commercially available condensed tannins as delineable by 31P NMR spectroscopy and GPC analyses. Structural purity has been determined as described before [30]; gallate ester content is estimated based on the same molecular weight.
| Sample | A Ring Structure Ratio Phloroglucinol/ Resorcinol | B Ring Structure Ratio Pyrogallol/ Catechol | Deduced Tannin Structural Features (%) (Procyanidin, Profisetidin, Prorobinetinidin, Prodelphinidin and/or Corresponding Monomers) | DP | Sample Purity (% Flavanol Content) |
|---|---|---|---|---|---|
| Vv | 1.76/1 | 0.04/1 | 62% (epi)catechin/procyanidin (A), 34% fisetinidol/profisetidin (C), 4% gallocatechin (B) motifs, traces of 3-O-gallates | 1–2 | 78 |
| Vv-R | 0.81/1 | 0.05/1 | 43% (epi)catechin/procyanidin (A), 52% fisetinidol/profisetidin (C), 5% gallocatechin (B) motifs, traces of 3-O-gallates | 1–3 | 39 |
| Vv-10 | 2.23/1 | 0.04/1 | 70% catechin/procyanidin (A), 26% fisetinidol/profisetidin (C), 4% gallocatechin (B) motifs, traces of 3-O-gallates | 1–3 | 46 |
| Vv-20 | 6.49/1 | 0.00/1 | 87% catechin/procyanidin (A), 13% fisetinidol/profisetidin (C), practically no gallocatechin (B) traces of 3-O-gallates | 1–2 | 88 |
| Am | 0.01/1 | 0.54/1 | 65% fisetinidol/profisetidin (C), 35% robinetinidol/prorobinetinidin (D), approx. 4% 3-O-gallates | 2–4 | 51 |
| Sb | 0.39/1 | 0.07/1 | 25% catechin/procyanidin (A), 69% fisetinidol/profisetidin (C), 6% epigallocatechin (B/robinetinidol (D) motifs, traces of 3-O-gallates | 2–3 | 50 |
Table 4.
Results of quantitative 31P NMR analyses of phosphitylated commercially available hydrolysable tannins, number average molecular weights and polydispersities as well as proanthocyanidin contents and total phenolic OH-group content.
Table 4.
Results of quantitative 31P NMR analyses of phosphitylated commercially available hydrolysable tannins, number average molecular weights and polydispersities as well as proanthocyanidin contents and total phenolic OH-group content.
| Hydrolysable Tannins | OH-Groups Content [mmol/g] | Scalbert [c] | Folin [d] | ||||||
|---|---|---|---|---|---|---|---|---|---|
| Aliphatic | Internal Gallate | Terminal Gallate | Catechol [a] | Ortho- Substituted Phenol | Total Phenol [b] | Acidic | |||
| Ta-01 | 0.59 | 2.20 | 2.51 | 3.27 | 4.58 | 13.5 | 0.22 | 0.55 | 0.84 |
| Ta-02 | 1.03 | 2.68 | 2.61 | 2.93 | 5.60 | 15.2 | 0.15 | 0.27 | 0.80 |
| Ta-04 | 0.92 | 2.21 | 1.84 | 3.38 | 3.06 | 11.9 | 0.15 | 1.91 | 0.70 |
| Ct | 3.01 | 2.64 | 0.28 | 3.37 | 1.34 | 7.70 | 0.18 | 9.01 | 0.47 |
| Cs | 4.77 | 2.90 | 1.14 | 2.21 | 0.74 | 6.87 | 0.32 | 10.6 | 0.61 |
a: Abundance of motifs as a whole; i.e., pyrogallol with 3 OH-groups, catechol with 2 OH-groups. b: Value over complete phenolic shift range (144.00 to 137.00 ppm). c: Cyanidin content according to Scalbert’s test in [CyaE (mg/g] [31]. d: Total phenol content according to the Folin–Ciocalteau assay in [mg GAE/mg tannin] [32].
Publisher’s Note: MDPI stays neutral with regard to jurisdictional claims in published maps and institutional affiliations. |
© 2021 by the authors. Licensee MDPI, Basel, Switzerland. This article is an open access article distributed under the terms and conditions of the Creative Commons Attribution (CC BY) license (https://creativecommons.org/licenses/by/4.0/).
Share and Cite
MDPI and ACS Style
Zhen, L.; Lange, H.; Crestini, C. An Analytical Toolbox for Fast and Straightforward Structural Characterisation of Commercially Available Tannins. Molecules 2021, 26, 2532. https://doi.org/10.3390/molecules26092532
AMA Style
Zhen L, Lange H, Crestini C. An Analytical Toolbox for Fast and Straightforward Structural Characterisation of Commercially Available Tannins. Molecules. 2021; 26(9):2532. https://doi.org/10.3390/molecules26092532
Chicago/Turabian StyleZhen, Lili, Heiko Lange, and Claudia Crestini. 2021. "An Analytical Toolbox for Fast and Straightforward Structural Characterisation of Commercially Available Tannins" Molecules 26, no. 9: 2532. https://doi.org/10.3390/molecules26092532