
Light Conversion upon Photoexcitation of NaBiF4:Yb3+/Ho3+/Ce3+ Nanocrystalline Particles
by
 , , and
Enrico Trave
1,*,
Michele Back
1,*,
Davide Pollon
1,
Emmanuele Ambrosi
1 and
Leonardo Puppulin
1,2 1
Department of Molecular Sciences and Nanosystems, Università Ca’ Foscari Venezia, Via Torino 155, 30172 Venice, Italy
2
WPI Nano Life Science Institute (WPI-NanoLSI), Kanazawa University, Kanazawa 920-1192, Ishikawa, Japan
*
Authors to whom correspondence should be addressed.
Nanomaterials 2023, 13(4), 672; https://doi.org/10.3390/nano13040672
Submission received: 29 December 2022
/
Revised: 1 February 2023
/
Accepted: 5 February 2023
/
Published: 9 February 2023
(This article belongs to the Special Issue Laser-Matter Interaction for Nanostructuration and Characterization: From Fundamentals to Sensing and Energy Applications)
Abstract
:NaBiF4 nanocrystalline particles were synthesized by means of a facile precipitation synthesis route to explore upconversion emission properties when doped with lanthanide ions. In particular, the incorporation of the Yb3+-Ho3+-Ce3+ triad with controlled ion concentration facilitates near-IR pumping conversion into visible light, with the possibility of color emission tuning depending on Ce3+ doping amount. We observed that introducing a Ce3+ content up to 20 at.% in NaBiF4:Yb3+/Ho3+, the chromaticity progressively turns from green for the Ce3+ undoped system to red. This is due to cross-relaxation mechanisms between Ho3+ and Ce3+ ions that influence the relative efficiency of the overall upconversion pathways, as discussed on the basis of a theoretical rate equation model. Furthermore, experimental results suggest that the photoexcitation of intra-4f Ho3+ transitions with light near the UV-visible edge can promote downconverted Yb3+ near-IR emission through quantum cutting triggered by Ho3+-Yb3+ energy transfer mechanisms. The present study evidences the potentiality of the developed NaBiF4 particles for applications that exploit lanthanide-based light frequency conversion and multicolor emission tuning.
1. Introduction
Light conversion includes a series of photon management procedures for modifying light energy and frequency in a selected spectral range, which find wide application in diverse technologies such as solar and photovoltaic, photosynthetic biomass production, bioimaging and lighting [1,2,3,4,5]. Trivalent lanthanide ions (Ln3+)-doped materials historically represent an interesting class of luminescent light converters since, under appropriate photoexcitation, they give rise to photophysical mechanisms which can lead to wavelength shift and multicolor emission, with careful control of the chromaticity output [6,7,8,9,10,11].
Upconversion (UC), where two or more absorbed low-energy photons are converted into a higher-energy one, and downconversion (DC) via quantum cutting (QC), where the absorption of a single high-energy photon originates two or more photons emitted at lower energies, are widely mentioned as nonlinear processes that bring to light frequency modification [12]. These mechanisms are highly fostered in lanthanide-doped phosphors due to the unique optical properties exhibited by lanthanide ions, deriving from a characteristic ladder-like arrangement of energy levels from ultraviolet to near-infrared and parity-forbidden intra-4f transitions with long-lived intermediate states. Among the most studied types of lanthanide-based UC systems, phosphors based on Yb3+-Ln3+ (Ln3+ = Er3+, Ho3+, Tm3+) pairs still receive great attention due to the incomparable near IR-to-visible UC emission efficiency [8,13,14,15]. This is due to an overall photophysical process based on a sequence of sensitizer–activator energy transfer mechanisms, which exploits the large absorption cross section of Yb3+, the sensitizer ion, under 980 nm photoexcitation, and the resonant level matching with the activator ion (Er3+, Ho3+, Tm3+), which is promptly promoted to high-energy states by the conversion of several absorbed near-infrared (NIR) photons and then relaxes radiatively, producing an emission spectrum characteristic of the Ln3+ energy levels scheme. In particular, both Yb3+-Er3+ and Yb3+-Ho3+ pairs show UC photoluminescence in the visible range dominated by a green and a red emission, both originating from two-photon UC processes. The relative intensity of the two bands determines the chromaticity output and can be controlled by concentration of the doping Ln3+ species.
Strategies for UC efficiency enhancement as well as for color output tuning include the incorporation of a further doping species for manipulating the Yb3+-Ln3+ UC pathways and then sensitize and/or foster specific emission outputs. Relevant results in Yb3+-Er3+ UC efficiency increase was achieved by embedding alkali or transition metal ions, such as Li+, Fe3+, Cd2+, into Ln3+-doped matrix, while pure single red band resulted by means of Mn2+ codoping of NaYF4:Yb3+/Er3+ NPs [16,17,18,19,20]. Redshift tuning of UC emission is particularly appealing in the field of bioimaging and biolabeling, since it achieves emission in the first biological window and simultaneous suppression of visible light noise. In this regard, Ce3+ incorporation has been reported as a valid method for green-to-red conversion in Yb3+/Ho3+ codoped fluoride hosts [21,22,23,24,25]. Photophysical mechanisms underlying the sensitizer–activator process are influenced by the presence of Ce3+ since it can enhance the population of the activator intermediate states involved in the red band UC emission process by virtue of its peculiar 4f energy level structure.
To develop efficient lanthanide-based UC phosphors, the choice of the host matrix is crucial. It is well known that fluoride materials offer several advantages, such as the extremely low phonon energy. Mainly for this reason, they are widely considered for the preparation of both bulk and nanostructured lanthanide-doped UC systems used in several fields, such as theranostics, nanothermometry, color displays, optical encoding, to name a few [26,27,28,29,30,31]. Bismuth-based compounds are characterized by a high refractive index, which induces a reduction in multiphonon relaxation rates and enhancement of spontaneous emission probability; namely, they are a popular choice as a host for optical dopants suitable for the realization of UC phosphors and optical thermometers [32,33,34,35,36]. Recently, Yb3+/Ln3+ (Ln3+ = Er3+, Ho3+, Tm3+) codoped NaBiF4 nanoparticles have been prepared by means of a room-temperature, one-pot synthesis procedure, representing a valuable alternative with respect to conventional methods based on high-temperature solvothermal and hydrothermal route employed for the preparation of fluoride-based particles [37]. Later, the issue of thermal and chemical stability of the bismuth based fluoride materials has been addressed to exploit their potential in possible photonic applications [38].
Within the scope of a research activity related to the development of a specific class of Bi-based fluoride compounds with tailored optical properties, this study was conceived to elucidate the properties of light conversion of Yb3+/Ho3+/Ce3+ tridoped NaBiF4 nanocrystalline particles (NPs). The investigation of UC emission chromaticity control as a function of Ce3+ content is aimed at establishing the condition for green-to-red conversion tuning. A theoretical model based on a steady-state rate equations scheme for Ho3+ energy level population is adopted to account for the different photophysical mechanisms taking place in the Yb3+-Ho3+ UC pathways, and to define the role of Ce3+ in the emission chromaticity shift, finding a real agreement with the observed experimental trend. Furthermore, spectroscopic results show that UV-visible excitation promotes Yb3+ NIR emission, which is particularly efficient through photoexcitation of Ho3+ energy levels around the UV-visible edge. This may represent a possible fingerprint of a DC process triggered by a Ho3+-Yb3+ QC mechanism. The point is discussed on the basis of a proper photophysical scheme, considering that the observed visible-to-NIR QC-mediated DC expands the potentiality of the investigated NaBiF4:Yb3+/Ho3+/Ce3+ NPs for applications as a spectral converter.
2. Materials and Methods
2.1. Chemicals
Bi(NO3)3·5H2O (99.99%), NH4F (99.9%), Yb(NO3)3·5H2O (99.9%), Ho(NO3)3·5H2O (99.9%), Ce(NO3)3·5H2O (99.9%), NaNO3 (99.9%), ethylene glycol (EG, 99.8%), ethanol (EtOH, 99.8%), Milli-Q water. All reagents were purchased from Sigma Aldrich, Italy.
2.2. Synthesis
The preparation route of the investigated Ln3+-doped NPs is a modification of the procedure reported by Lei et al. in [37]. In a typical synthesis, 1 mmol of Bi, 1 mmol of Ln3+ nitrates and 2 mmol of NaNO3 were dissolved into 10 mL of EG. In another beaker, 6 mmol of NH4F was dissolved in 25 mL of EG, and then added to the above solution under stirring; on the basis of the results of our previous work [38], the NH4F amount was chosen to stabilize the hexagonal NaBiF4 phase. The obtained solution was stirred, at room temperature, for one minute, and the product was collected by centrifugation and washed with anhydrous ethanol three times before natural drying. The synthesized NaBiF4 NPs incorporate Yb3+ and Ho3+ ions with doping level set to 10 and 2 at.%, respectively, as optimal condition to maximize the UC emission, with different amounts of Ce3+ up to 20 at.% for controlled chromaticity output tuning.
2.3. Characterization
X-ray powder diffraction (XRPD) measurements were performed by means of a Philips diffractometer with a PW 1319 goniometer with Bragg–Brentano geometry, connected to a highly stabilized generator, a focusing graphite monochromator and a proportional counter with a pulse-height discriminator. Nickel-filtered Cu Ka radiation and a step-by-step technique were employed (steps of 0.05° in 2θ), with collection times of 30 s per step.
Size and morphology determination of the nanoparticles and EDX analysis were carried out with a Carl Zeiss Sigma VP Field Emission Scanning Electron Microscope (FE-SEM) equipped with a Bruker Quantax 200 microanalysis detector.
Room-temperature photoluminescence (PL) and PL excitation (PLE) measurements, as well as time-resolved PL analysis, were carried out by means of a FluoroLog 3–21 system (Horiba Jobin-Yvon) equipped with a 450 W xenon arc lamp as excitation source, whose wavelength was selected by a double Czerny–Turner monochromator and signal detection stage including an iHR300 single grating monochromator coupled to a Hamamtsu photomultiplier tube (model R928P for visible range; model R5509-73 N2-cooled for NIR range). Alternatively, PL spectra were acquired by means of a QE65 Pro Ocean Optics spectrometer. Upconversion measurements were performed by using a CNI MDL-III-980 diode laser as 980 nm photon pumping source, with output power of 2 W over a spot of 5 × 8 mm2 (power density of 5 W/cm2). For time-resolved PL investigation, the Fluorolog system operated in TCSPC/MCS mode, and the sample excitation was achieved through a pulsed laser source (Horiba SpectraLED) featuring 460 nm peak wavelength and 30 nm spectral FWHM.
3. Results and Discussion
The following results represent a comprehensive characterization of a Ce3+-free Yb3+/Ho3+ codoped sample (Ce_0) as compared to tridoped samples embedding a Ce3+ content of 2 (Ce_2), 5 (Ce_5), 10 (Ce_10) and 20 at.% (Ce_20).
3.1. Structural and Morphological Characterization
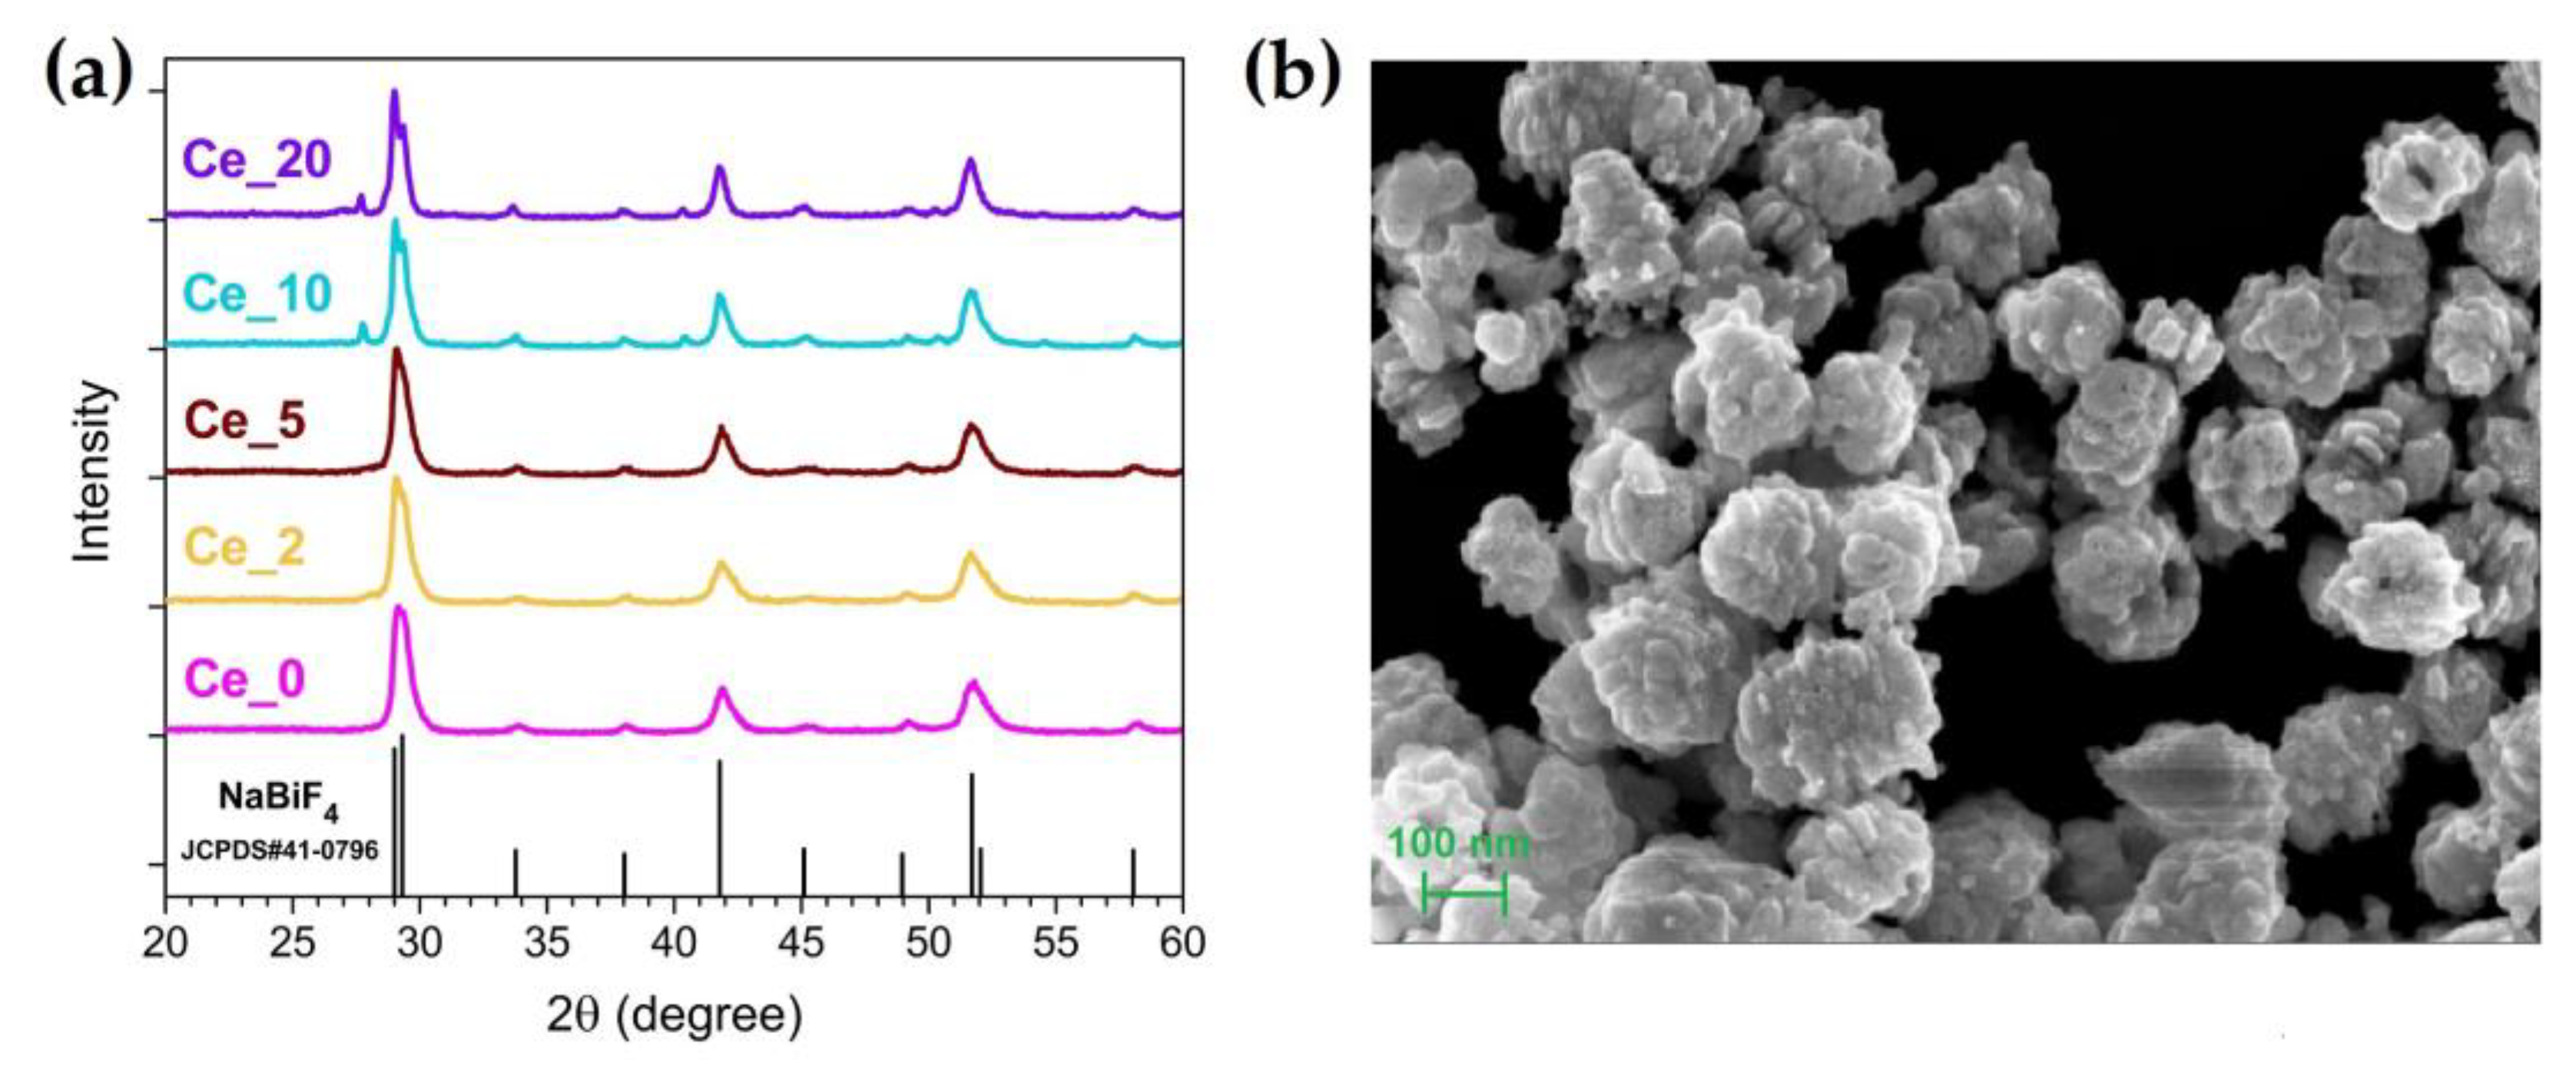
Figure 1a reports the XRD measurements of the investigated samples. All the diffractograms match well with the crystallographic pattern of the hexagonal NaBiF4 phase (chart JCPDS#41-0796), regardless of Ln3+ doping content. At the highest Ce3+ amount it is noticed the appearance of some faint peaks, which could be attributed to the formation of secondary fluoride phases. From the XRD pattern fitting, we estimated the trend of the cell volume parameter as a function of the Ce3+ content. In this regard, Figure S1 shows that the cell volume progressively shrinks by increasing the Ce3+ doping level, tending to a plateau for large concentration, in agreement with the fact that Ce3+ has a smaller ionic radius with respect to Bi3+ (1.14 Å vs. 1.17 Å, respectively).
Morphological properties of the studied NPs can be characterized by the representative SEM image of the tridoped sample with 10 at.% of Ce3+ (Ce_10), which is shown in Figure 1b. The synthesized NaBiF4 NPs appear as nm-sized spheroidal aggregates, resulting from the assembly of smaller primary nanocrystals [38]. Further SEM images relating to the other investigated samples are included in Figure S2. EDX spectrum together with related elemental maps for Ce_10 sample are reported in Figures S3 and S4, respectively.
3.2. UC Properties and Color Tuning Effect
The analysis of the fluorescence properties characterizing the investigated Ln3+-doped NPs firstly focuses on UC emission due to Yb3+-Ho3+ sensitizer–activator coupling and on the chromaticity tuning driven by Ce3+ incorporation.
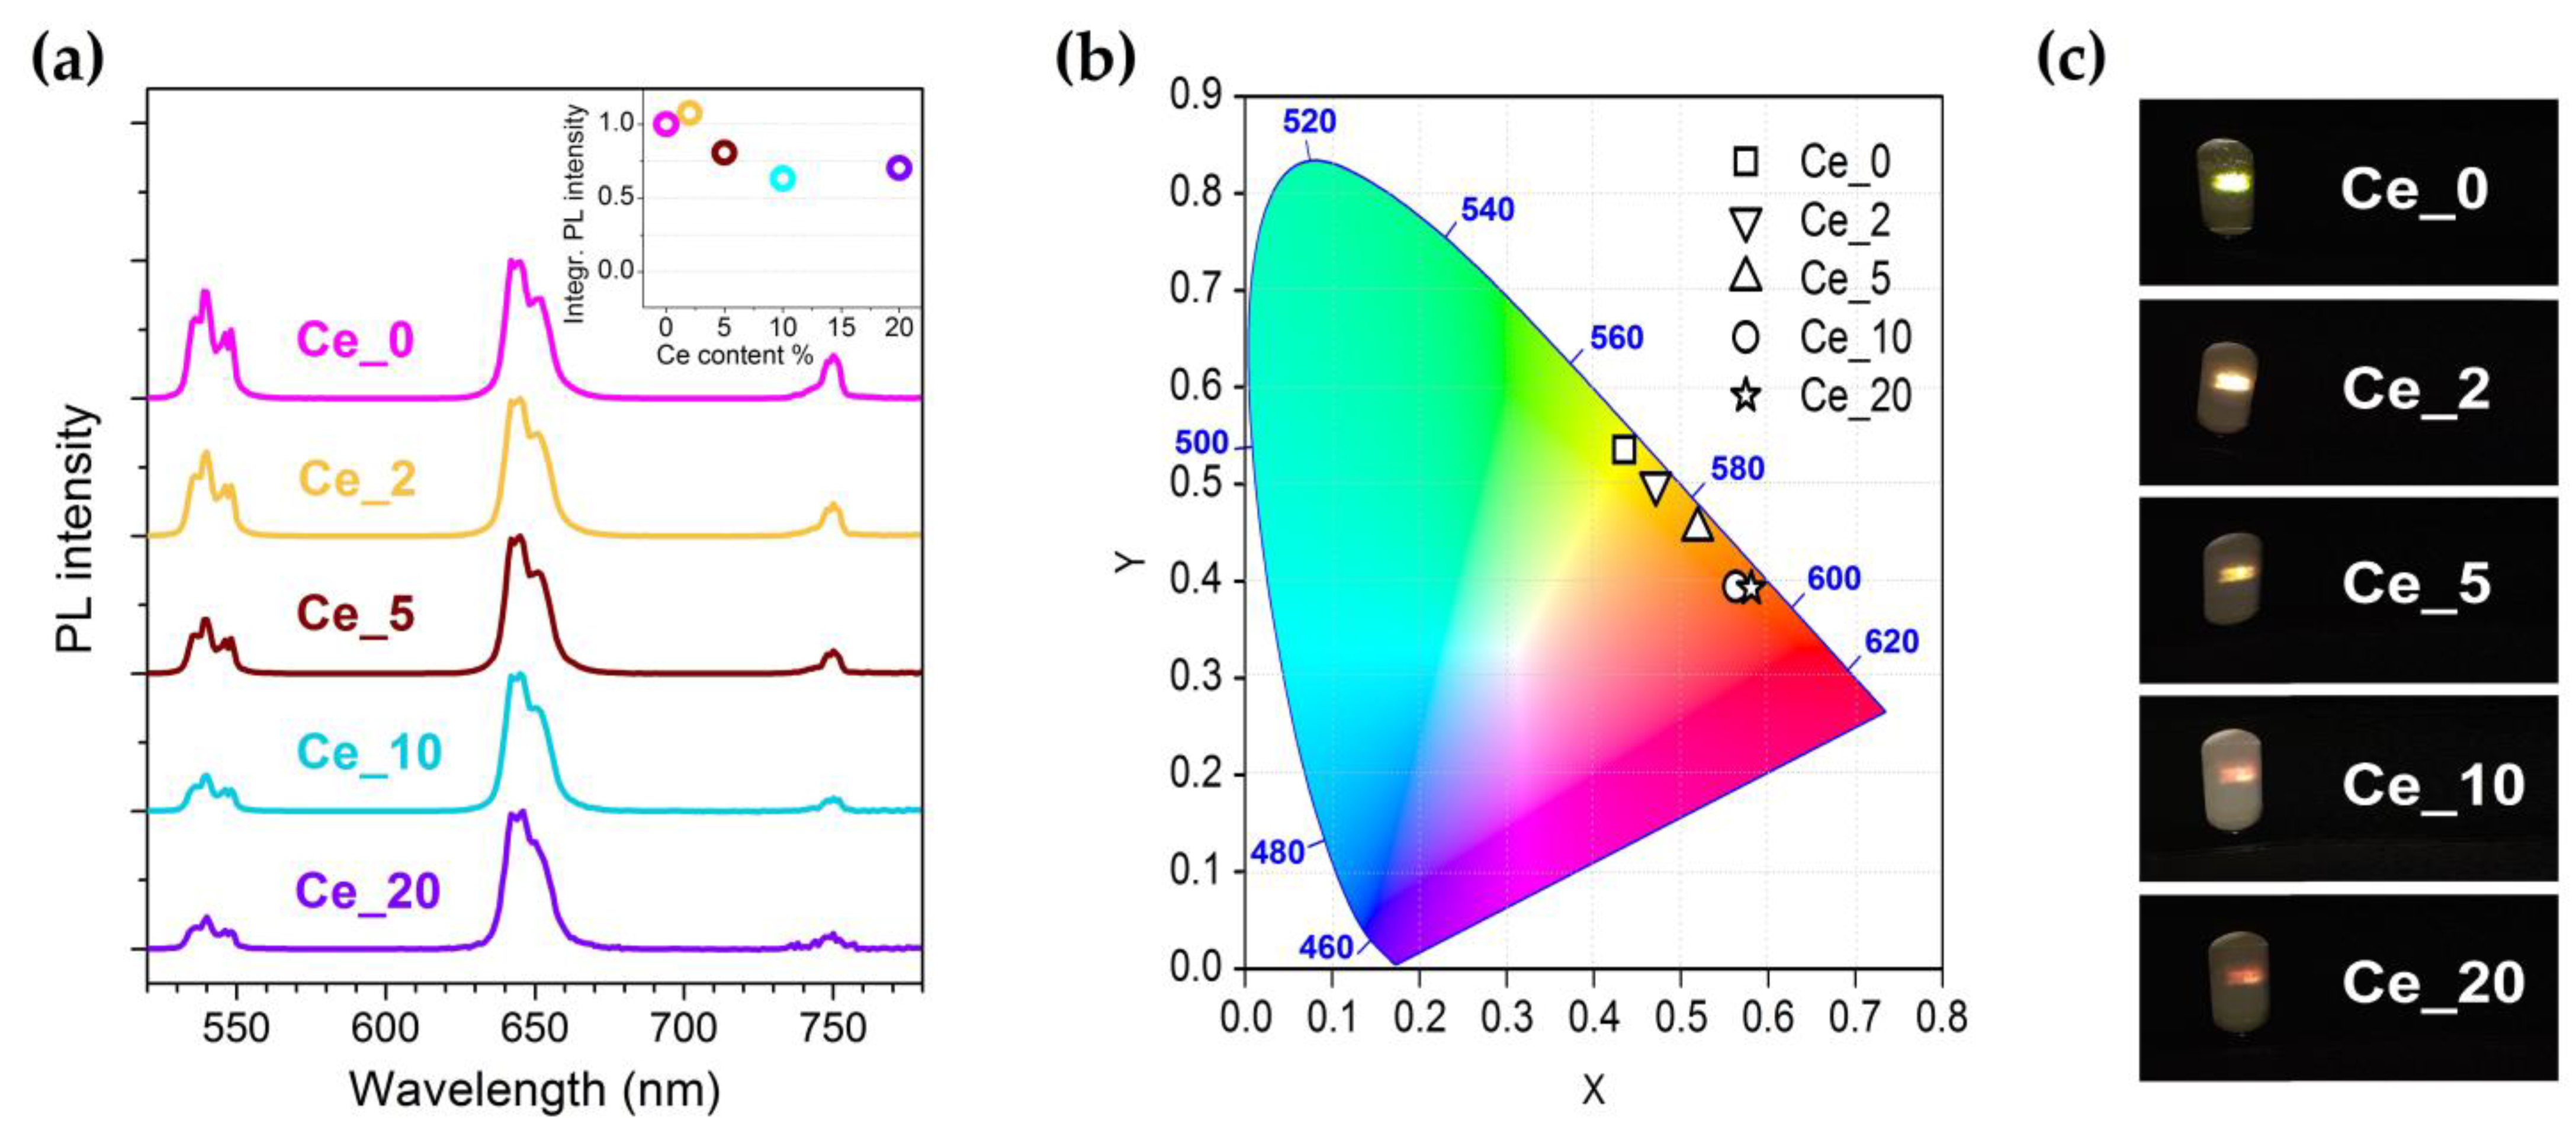
Figure 2a presents upconversion photoluminescence (UCPL) spectra measured in the visible range under 980 nm light pumping and representative NPs with different Ce3+ content. The spectra are dominated by three main emission features with maximum at around 540 nm (named as GRN band, being peaked in the green range), 645 nm (named as RED band, being peaked in the red range) and 750 nm, attributed to Ho3+ 5S2/5F4 → 5I8, 5F5 → 5I8 and 5S2/5F4 → 5I7 transitions, respectively. It can be observed that the progressive increase in Ce3+ content determines a decrease in intensity for the GRN band compared to the RED one. In addition, for Ce3+ content higher than 5%, the overall luminescence emission signal settles down at about 70% of the intensity of the Ce3+ undoped sample (Ce_0), as shown in the inset of Figure 2a. This evidence suggests that the impact of any detrimental effects, such as fluorescence quenching due to high lanthanide ions concentration, is rather limited for the system under investigation.
The CIE chromaticity diagram and the photographs of the observed luminescence spots are reported in Figure 2b,c, respectively. The Ce3+-induced color rendering index modification is clearly appreciable, going from a pale green emitted spot for the Ce3+ undoped sample to dark orange, reaching 20 at.% of Ce3+ doping.
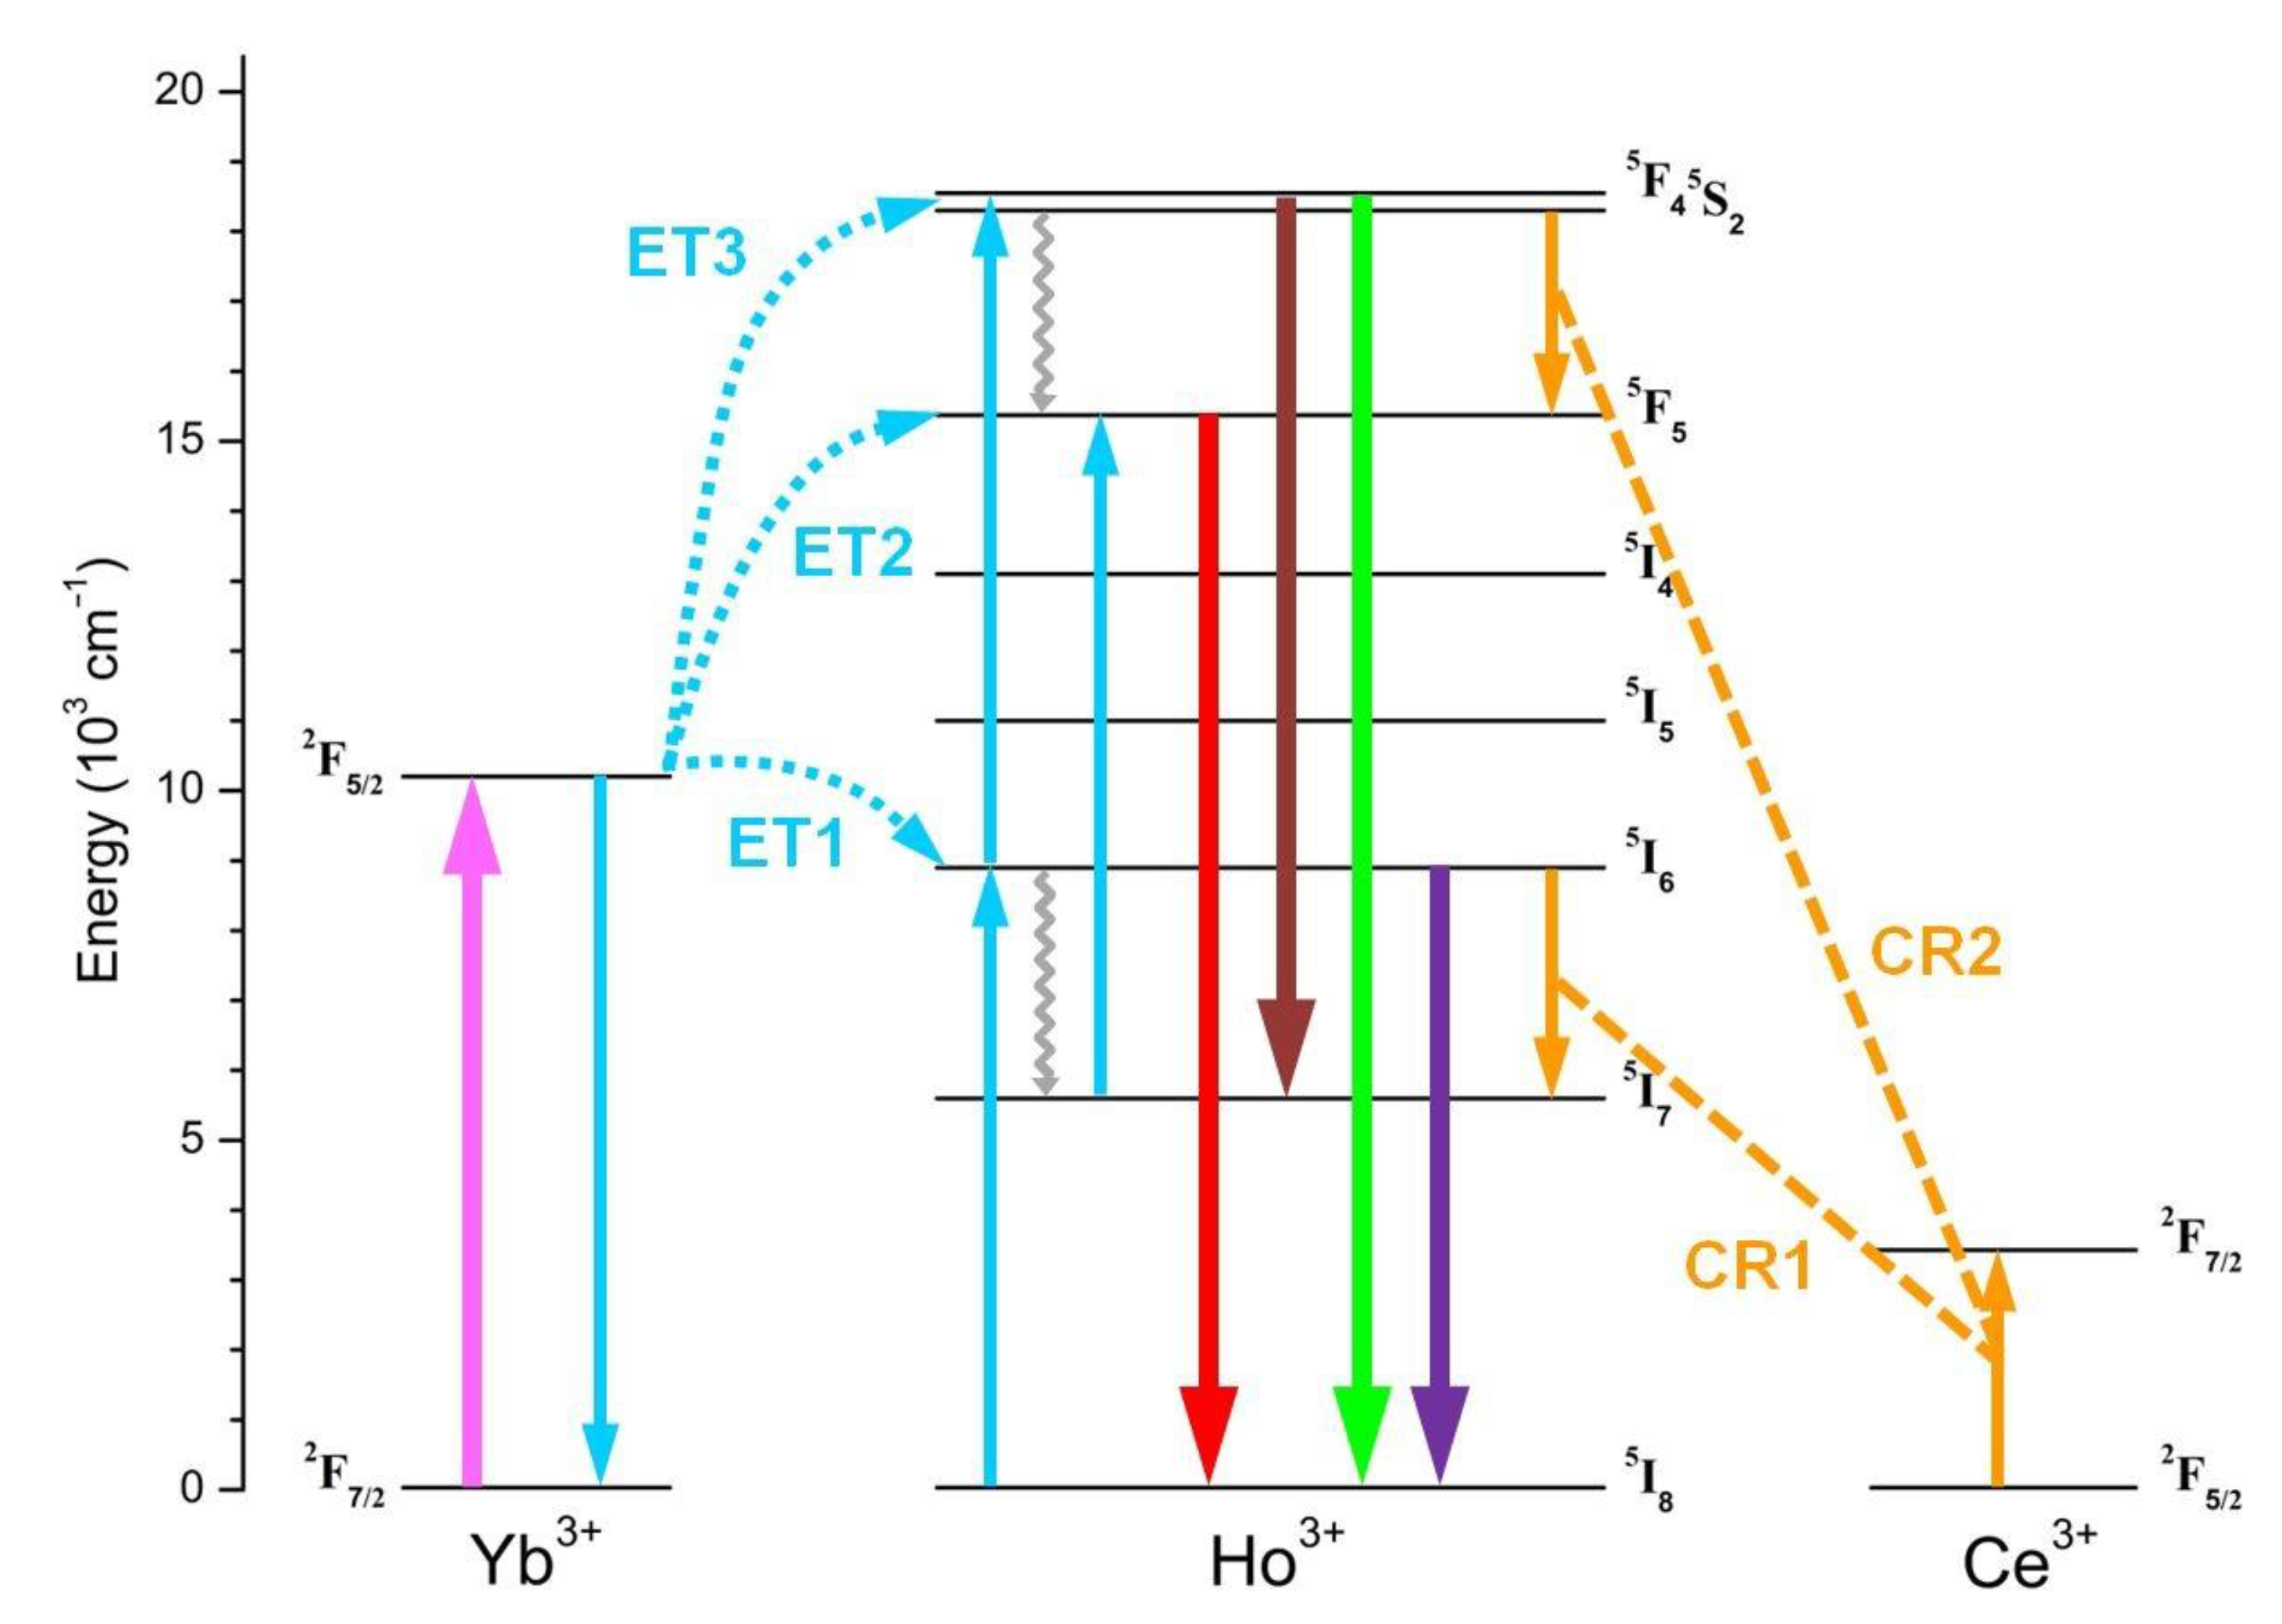
In the context of the photophysical mechanisms underlying the UCPL activity observed for the Ln3+-doped NPs, the diagram of Figure 3 depicts the main relaxation and transition processes that involve 4f energy levels for the Yb3+-Ho3+-Ce3+ triad. The trigger of the overall mechanism is the intra-4f Yb3+ 2F7/2 → 2F5/2 ground-to-excited-state transition under 980 nm light, whose absorption by Yb3+ ions is characterized by a very large cross-section. Due to the long Yb3+ 2F5/2 lifetime, the Ho3+ upper excited states can be populated through a very effective Yb3+-Ho3+ energy transfer (ET) interaction. The diagram highlights the three main mechanisms, labeled as ET1, ET2, and ET3, that lead to the excitation of the Ho3+ 5I6, 5F5 and 5S2/5F4 levels, respectively, and thus activate the UC emission pathways for the generation of the observed emissions in the visible range.
As previously reported, the GNR band, as well as the emission peaked at 750 nm, is a consequence of the relaxation process from the Ho3+ 5S2/5F4 excited state, which is populated through a sequence of ET1 and ET3 mechanisms involving Ho3+ 5I6 state as the intermediate level. On the other hand, the RED band originates from the relaxation of the Ho3+ 5F5 state, whose excitation can occur through two possible UC paths. One ends with the direct Ho3+ 5F5 population through non-radiative relaxation of Ho3+ 5S2/5F4 level after a combined sequence of ET1 and ET3 mechanisms. The other is instead based on a sequence of ET1 and ET2 processes, interspersed by Ho3+ 5I6 non-radiative relaxation to the Ho3+ 5I7 level. Therefore, both paths include a multiphonon relaxation step which is supposed to strongly affect the overall efficiency for the RED band emission process. In fact, it is worth considering that both 5S2/5F4 → 5F5 and 5I6 → 5I7 transitions span an energy gap of about 3000 cm−1. Since the typical phonon energy for fluoride-based hosts is relatively low (i.e., in the order of 500 cm−1), the upper excited level depopulation must involve a substantial number of phonons, limiting the occupancy of the lower excited level and then the resulting RED band intensity.
In this scenario, Ce3+ incorporation becomes effective. As shown in the diagram of Figure 3, Ce3+ ion admits a unique intra 4f transition involving the 2F5/2 ground and the 2F7/2 excited states. The separation between these energy levels matches the gap that characterizes both the Ho3+ 5S2/5F4 → 5F5 and 5I6 → 5I7 transitions. This implies that cross-relaxation (CR) mechanisms take place, involving the transitions Ho3+ 5I6 + Ce3+ 2F5/2 → Ho3+ 5I7 + Ce3+ 2F7/2 (labeled as CR1) and Ho3+ 5S2/5F4 + Ce3+ 2F5/2 → Ho3+ 5F5 + Ce3+ 2F7/2 (labeled as CR2), which flank the multiphonon relaxation steps in the overall upconverting process that leads to the population of the Ho3+ 5F5 excited state. UCPL measurements reported in Figure 2a demonstrate that the efficiency of the CR1 and CR2 processes is such as to lead to a manifest RED band enhancement with respect to GRN one as the Ce3+ content increases.
3.3. Rate Equation Modeling of UC Mechanisms
In order to account for the impact of Yb3+-Ho3+ ET and Ce3+-mediated CR processes on the resulting UCPL activity, we have revisited the model proposed by Chen et al. in [21] to formalize a system of rate equations describing the time evolution of the population of Ho3+ excited energy levels involved in the observed emission processes:
The symbols used in the equations have the following meaning: (with ) refers to the population density of Ho3+ 5I8 ground and 5I7, 5I6, 5F5, 5S2/5F4 excited levels, respectively; (with ) refers to the population density of Yb3+ 2F7/2 ground and 2F5/2 excited levels, respectively; (with ) refers to the population density of Ce3+ 2F5/2 ground and 2F7/2 excited levels, respectively; (with ) refers to the overall transition rate from Ho3+ level to the lower ones, while and are the multiphonon-assisted relaxation rates for Ho3+ 5I6 → 5I7 and 5S2/5F4 → 5F5 transitions, respectively; (with ) refers to the coupling constant for the Yb3+-mediated ET processes involving Ho3+ 5I8 → 5I6, 5I7 → 5F5 and 5I6 → 5S2/5F4 transitions, respectively; (with ) refers to the coupling constant for the Ce3+-mediated CR processes involving Ho3+ 5I6 → 5I7 and 5S2/5F4 → 5F5 transitions, respectively.
In steady-state conditions under cw pumping excitation, from Equations (1)–(4) we obtain the following expressions for the Ho3+ excited levels:
Assuming that the transition rates for the Ho3+ 5I7 and 5I6 levels are much larger than the corresponding upconversion rates, the latter terms can be relaxed in Equations (5)–(8), leading to the following reformulation of the previous expressions:
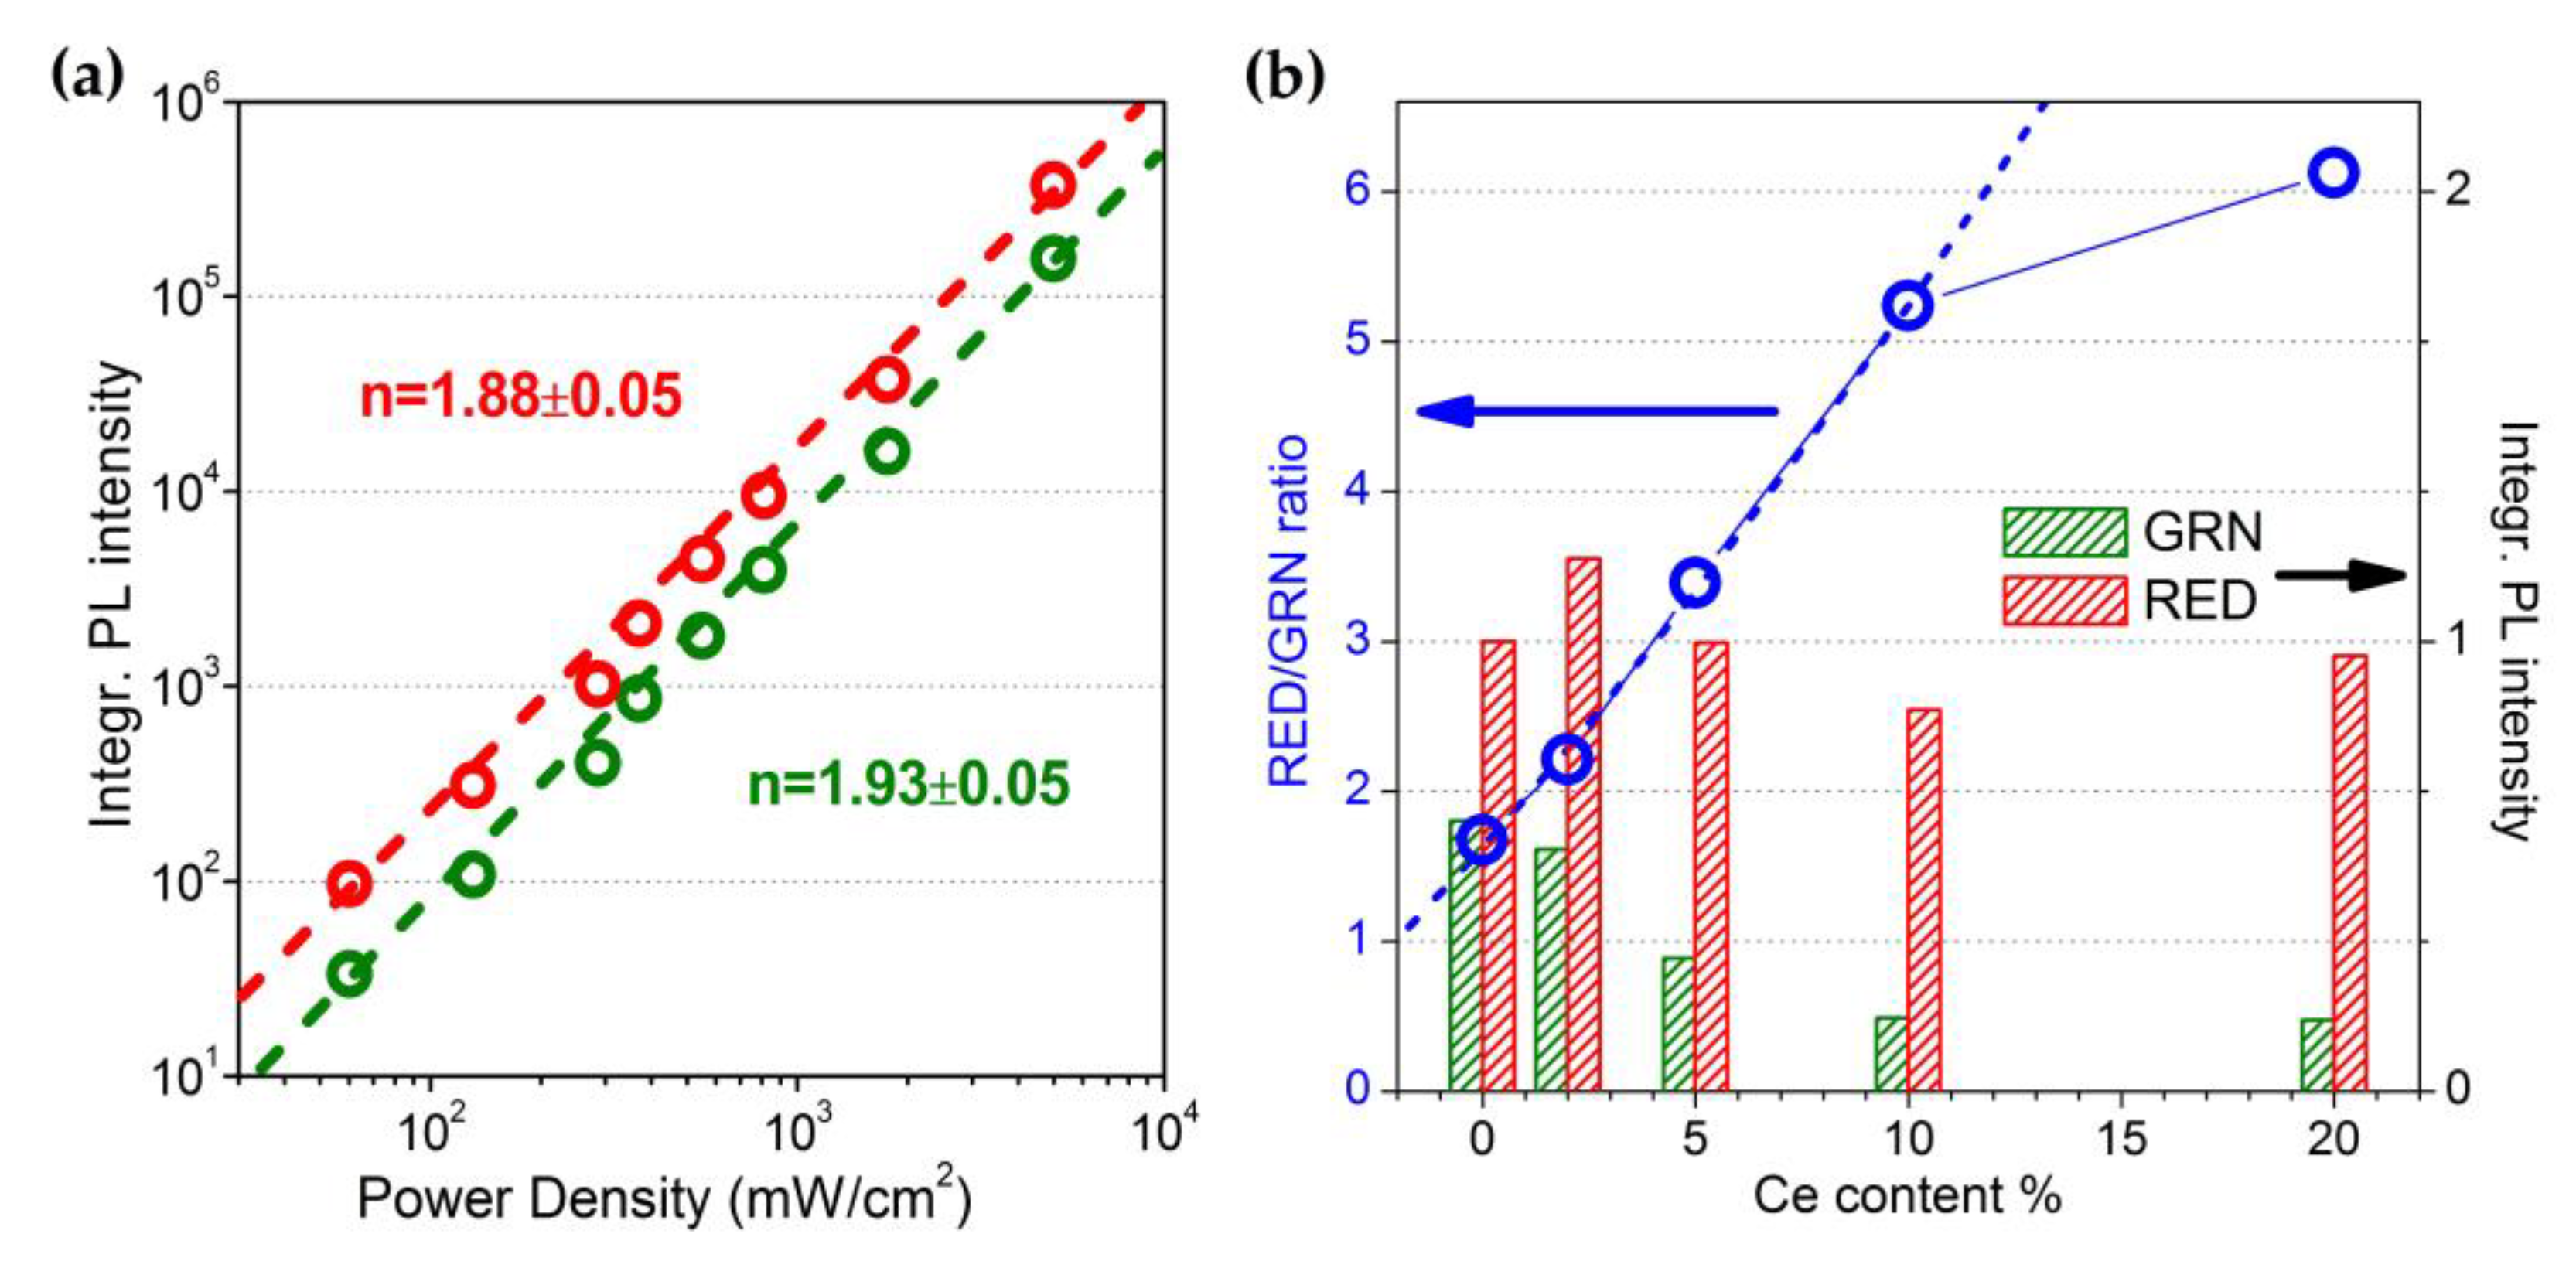
Considering that Yb3+ light absorption occurs linearly in the adopted pump power regime, it can be stated that the parameter describing the population density of the Yb3+ 2F5/2 excited level is proportional to the intensity of the excitation source. Therefore, Equations (11) and (12) would imply a quadratic pump power dependence for the and population density parameters, and then for the emission intensitiy of GRN and RED bands, since they originate from Ho3+ 5F5 and 5S2/5F4 excited level relaxations, respectively. As a matter of fact, this behaviour finely agrees with the trends shown in the log–log plot of Figure 4a, where the linear fit of the experimental data related to the power density dependence of UCPL emission for Ce_10 sample resulted in a slope close to 2 for both GRN and RED emissions, thus confirming the occurrence of a two-photon UC process.
For a qualitative assessment of the observed chromaticity tuning effect, the bar graphs in Figure 4b evidence the Ce3+ content dependence for the intensity of the GRN and RED bands, as extracted from PL bands shown in the spectra of Figure 2a. Moreover, Figure 4b also reports the trend of the RED-to-GRN intensity ratio as a function of Ce3+ content, evidencing a progressive growth of this parameter up to 10 at.% of Ce3+, whereas with a Ce3+ content of 20 at.%, a sort of saturation effect takes place, leading to a less pronounced increase in the ratio.
From Equations (11) and (12), we can formalize an expression of the Ce3+ content dependence for the RED-to-GRN intensity ratio parameter:
This equation accounts for the observed increase in the intensity ratio with the Ce3+ doping level. This behaviour is predictable by observing the structure of Equation (12), where the parameter, namely, the GRN emission intensity, is forced to decrease as the Ce3+ content rises.
Given the parabolic trend of the expressions in Equation (13), Figure 4b also includes a fit of the ratio values with a parabolic function, which results in a real agreement with the trend of the experimental values up to 10 at.% of Ce3+.
Furthermore, to generalize the proposed scenario and to validate the adequacy of the proposed rate-equation model, it is worth pointing out that similar experimental results are reported for Yb3+/Ho3+/Ce3+ tridoped fluoride systems investigated in the works of Gao et al. [22,39,40], Chen et al. [21], and Pilch-Wróbel et al. [41], where the trend of the resulting GRN intensity ratio recalls a parabolic dependence on Ce3+ doping level, in some cases reaching possible saturation effects at large Ce3+ content.
3.4. Efficiency of Ce3+-Mediated CR Processes
The observed color tuning effect is closely linked to the Ce3+ doping level adopted for the investigated samples. From the rate equations previously reported, it can be inferred that the CR processes impact on the occupancy of the Ho3+ levels involved in the overall UCPL mechanism. In particular, the CR1 and CR2 processes (identified by the coupling constants and , respectively) constitute a depletion channel for the Ho3+ 5I6 and 5S2/5F4 levels, respectively, leading to the loss of efficiency of the GRN emission (and also of the PL signal at around 750 nm) and to the corresponding increase in the population of the levels involved in the photophysical mechanism responsible for the RED emission.
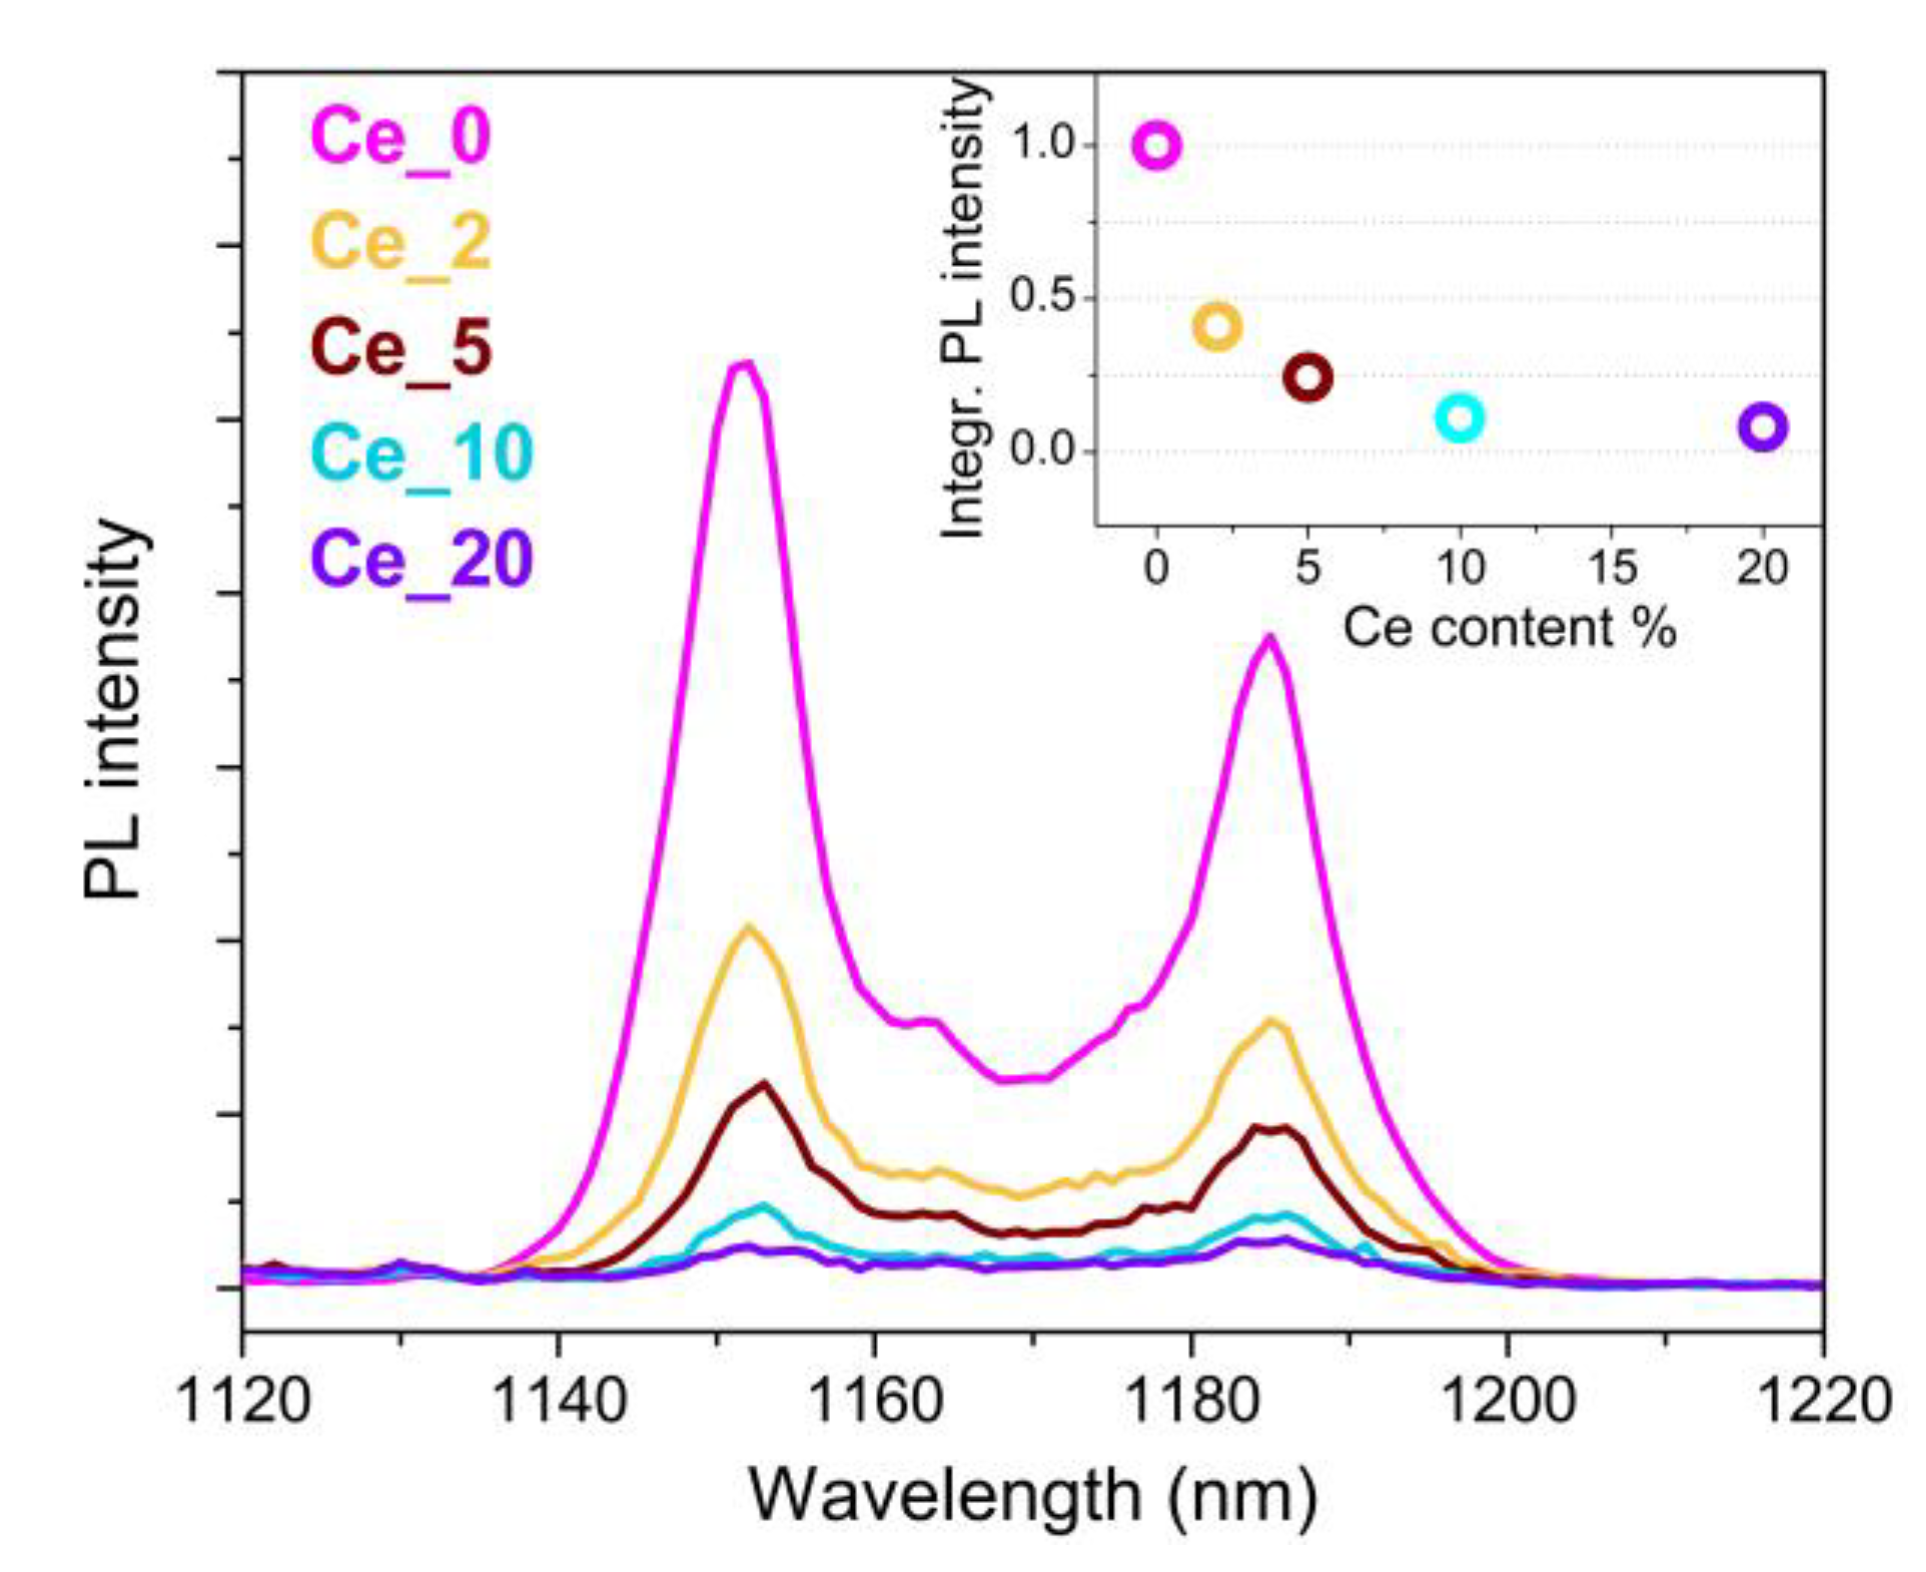
To account for the evolution of the Ho3+ 5I6 level occupancy, which is related to the parameter, Figure 5 shows the NIR emission deriving from Ho3+ 5I6 radiative relaxation to the ground state, as a function of the Ce3+ content. The fact that the luminescence signal promptly drops down as the Ce3+ content increases is a clear evidence of the Ho3+ 5I6 level depletion driven by the occurrence of the CR1 process.
For a quantitative assessment of the efficiency of the CR1 process, from Equation (10) we define the ratio of the NIR emission intensity due to Ho3+ 5I6 relaxation between a Ce3+-doped sample and the undoped reference as:
The Ce3+ content dependence of this parameter can be evaluated from the trend of the experimental data shown in the inset of Figure 5.
The efficiency of the CR1 mechanism can be expressed as the ratio between the rate of the Ce3+-mediated process and the overall rate of the mechanisms that drive Ho3+ 5I6 depletion. Therefore, considering Equation (14), we obtain:
The results of the calculation for the different Ce3+-doped samples are reported in Table 1. It is worth noting that already with 2 at.% of Ce3+, the estimate is around 60% for parameter, which then grows to over 90% by increasing the Ce3+ content.
At this point, a comparison with the assessment of the efficiency for the CR2 process is proposed. In this case, the data for efficiency assessment have been extracted by considering the results of PL measurements by direct photoexcitation of Ho3+ ions under visible light exposure.
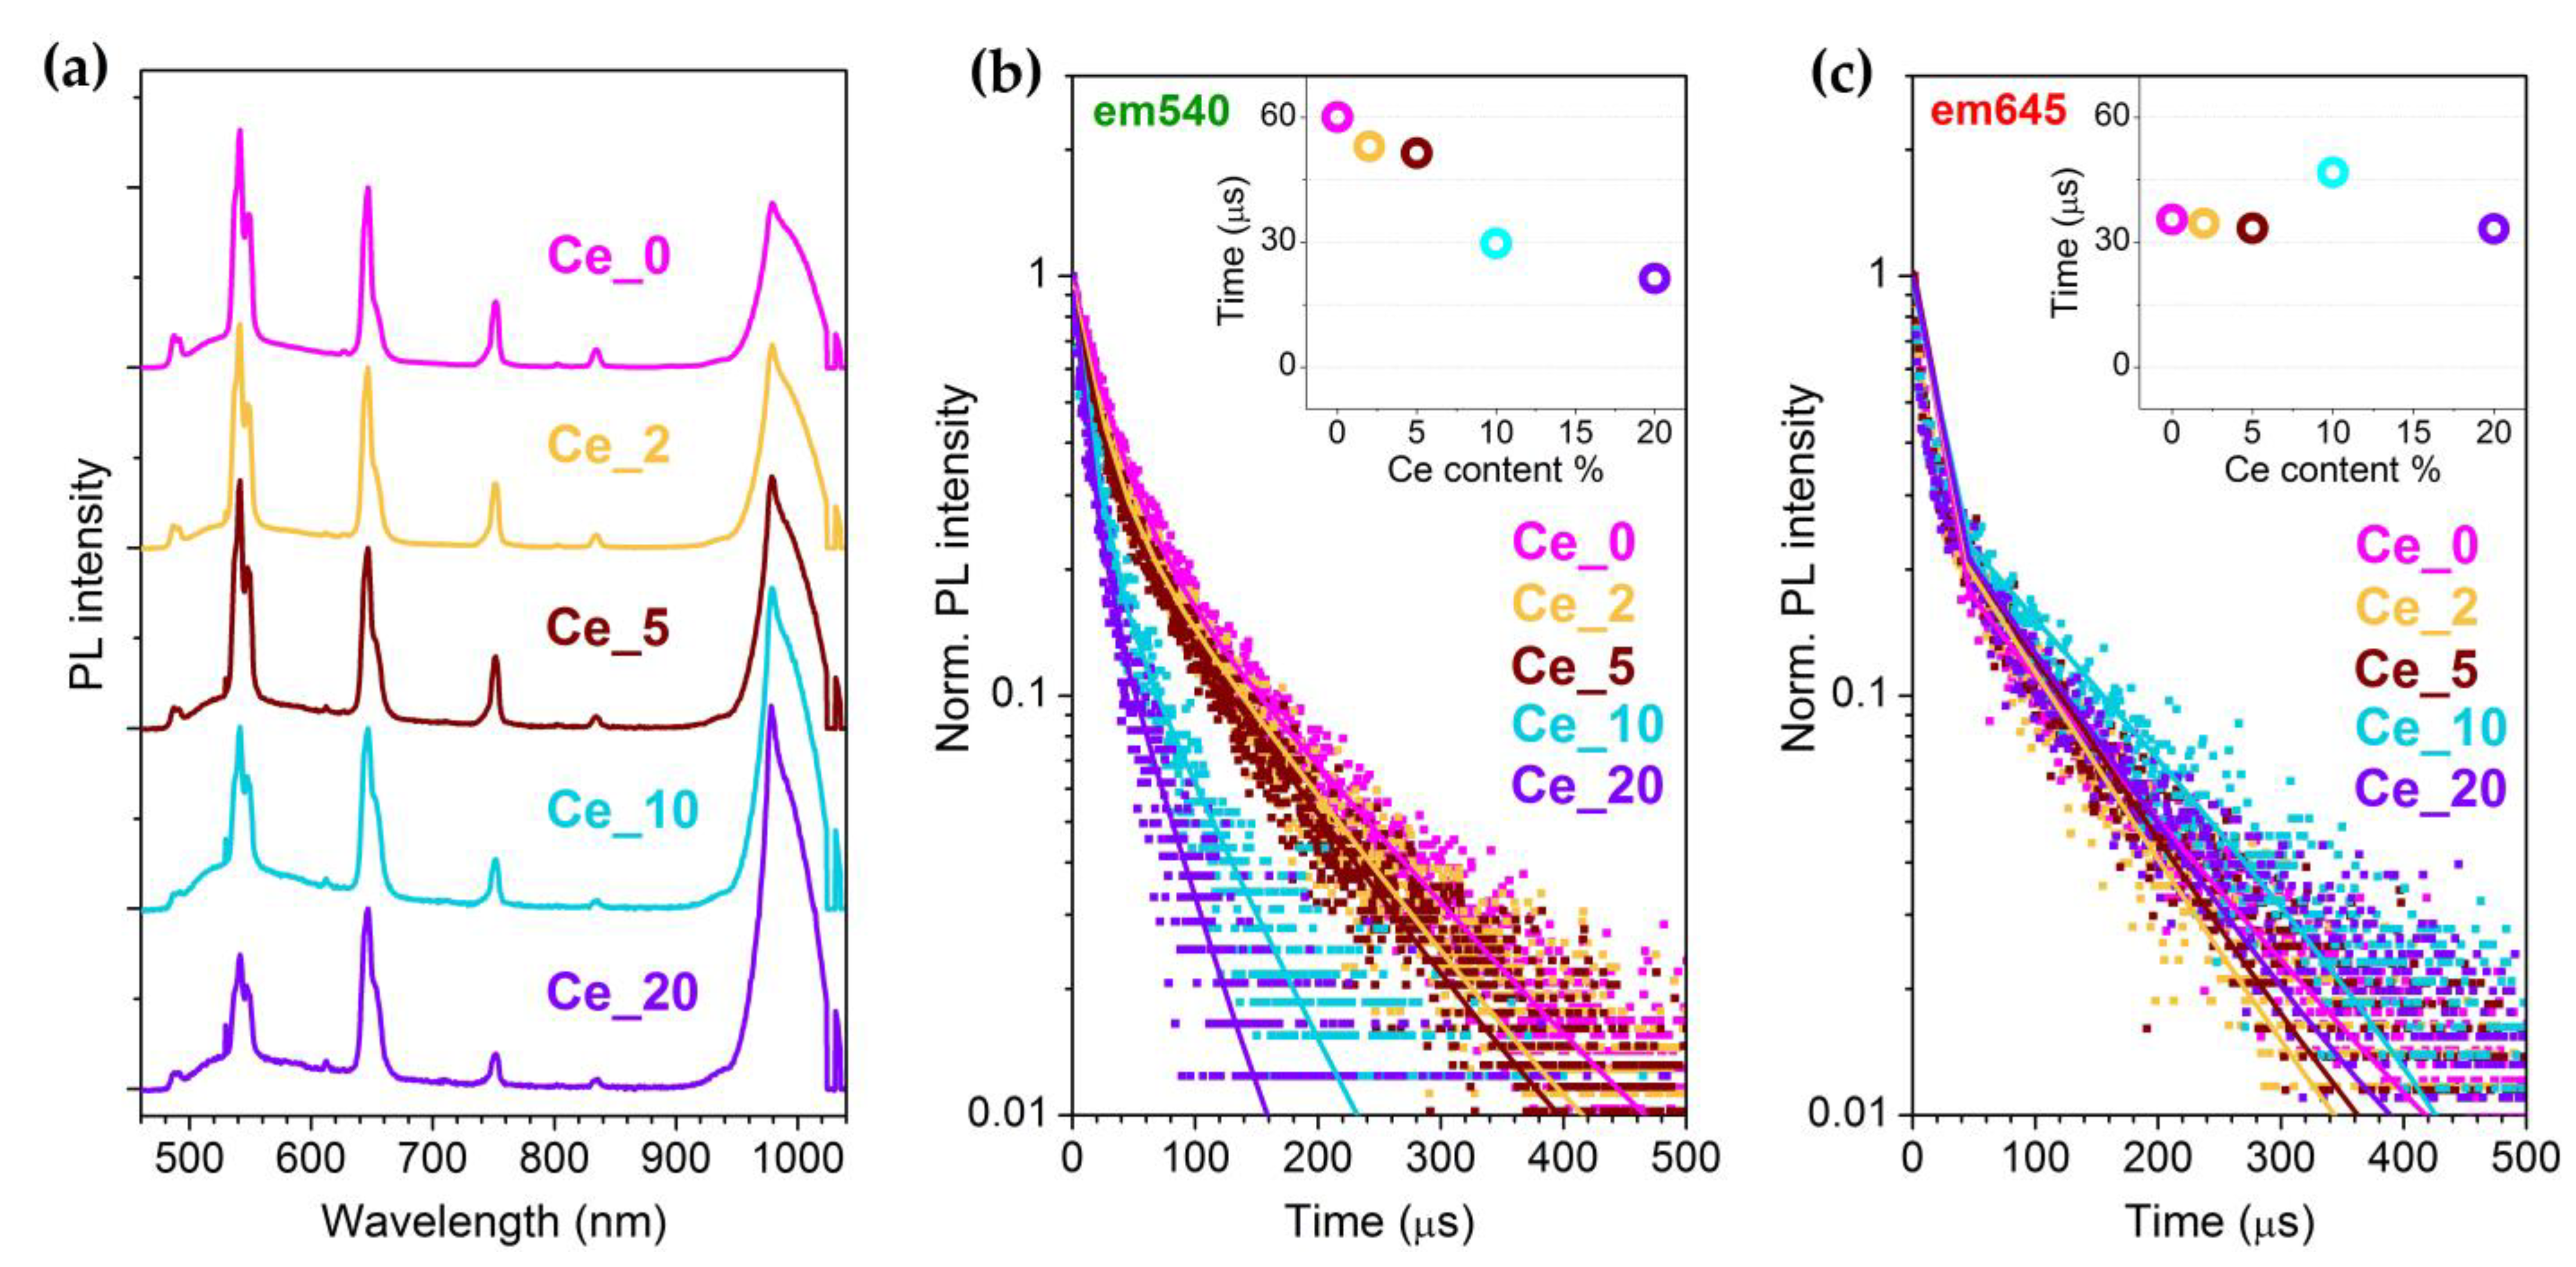
The spectra of Figure 6a show the typical Ho3+ emission signals in the visible range, together with a band at around 980 nm referable to the excited-to-ground-state relaxation originating from Yb3+ 2F5/2 level. This aspect is addressed in the next section. Figure 6b,c report the time-resolved PL decay curves for the Ho3+ GRN and RED emissions. As can be inferred from the trend of the lifetime estimates reported in the two insets, the GRN values progressively decrease as the Ce3+ content increases, while the RED one remains substantially unchanged. The different behaviour is strictly linked to the role played by the CR2 mechanism, through which the presence of Ce3+ ions involves the activation of a further non-radiative de-excitation channel of Ho3+ 5S2/5F4, with consequent GRN emission weakening.
The CR2 conversion efficiency can be calculated according to the following equation, based on the lifetime ratio between a Ce3+-doped and the undoped sample:
The values obtained for the investigated samples are reported in Table 1 for a final comparison among the efficiencies of the two Ce3+-mediated CR processes. What emerges is that the parameter is always greater than in the whole explored Ce3+ doping range, and therefore, it can be stated that CR1 process plays a primary role in the observed GRN-to-RED conversion effect induced by Ce3+ incorporation in the NaBiF4:Yb3+/Ho3+ system.
3.5. Visible-to-NIR DC Effect
Here, we return to discuss the PL spectra in Figure 6a, obtained by direct Ho3+ excitation into 5F1/5G6 level through 448 nm pumping source. In addition to the typical visible emissions attributable to Ho3+ radiative transitions, a fluorescence band around 980 nm was also observed, which is linked to the Yb3+ 2F5/2 → 2F7/2 relaxation. As these are the only Yb3+ intra-4f transitions, it is reasonable to hypothesize that the activation of the 980 nm band originates from a mechanism of indirect Yb3+ excitation mediated by Ho3+ ions. Several studies have already investigated the peculiarities of this phenomenology, highlighting its potentiality for the conversion of high-energy radiation into NIR photons in view of applications in the field of photovoltaics and solar cells technology [42,43,44,45].
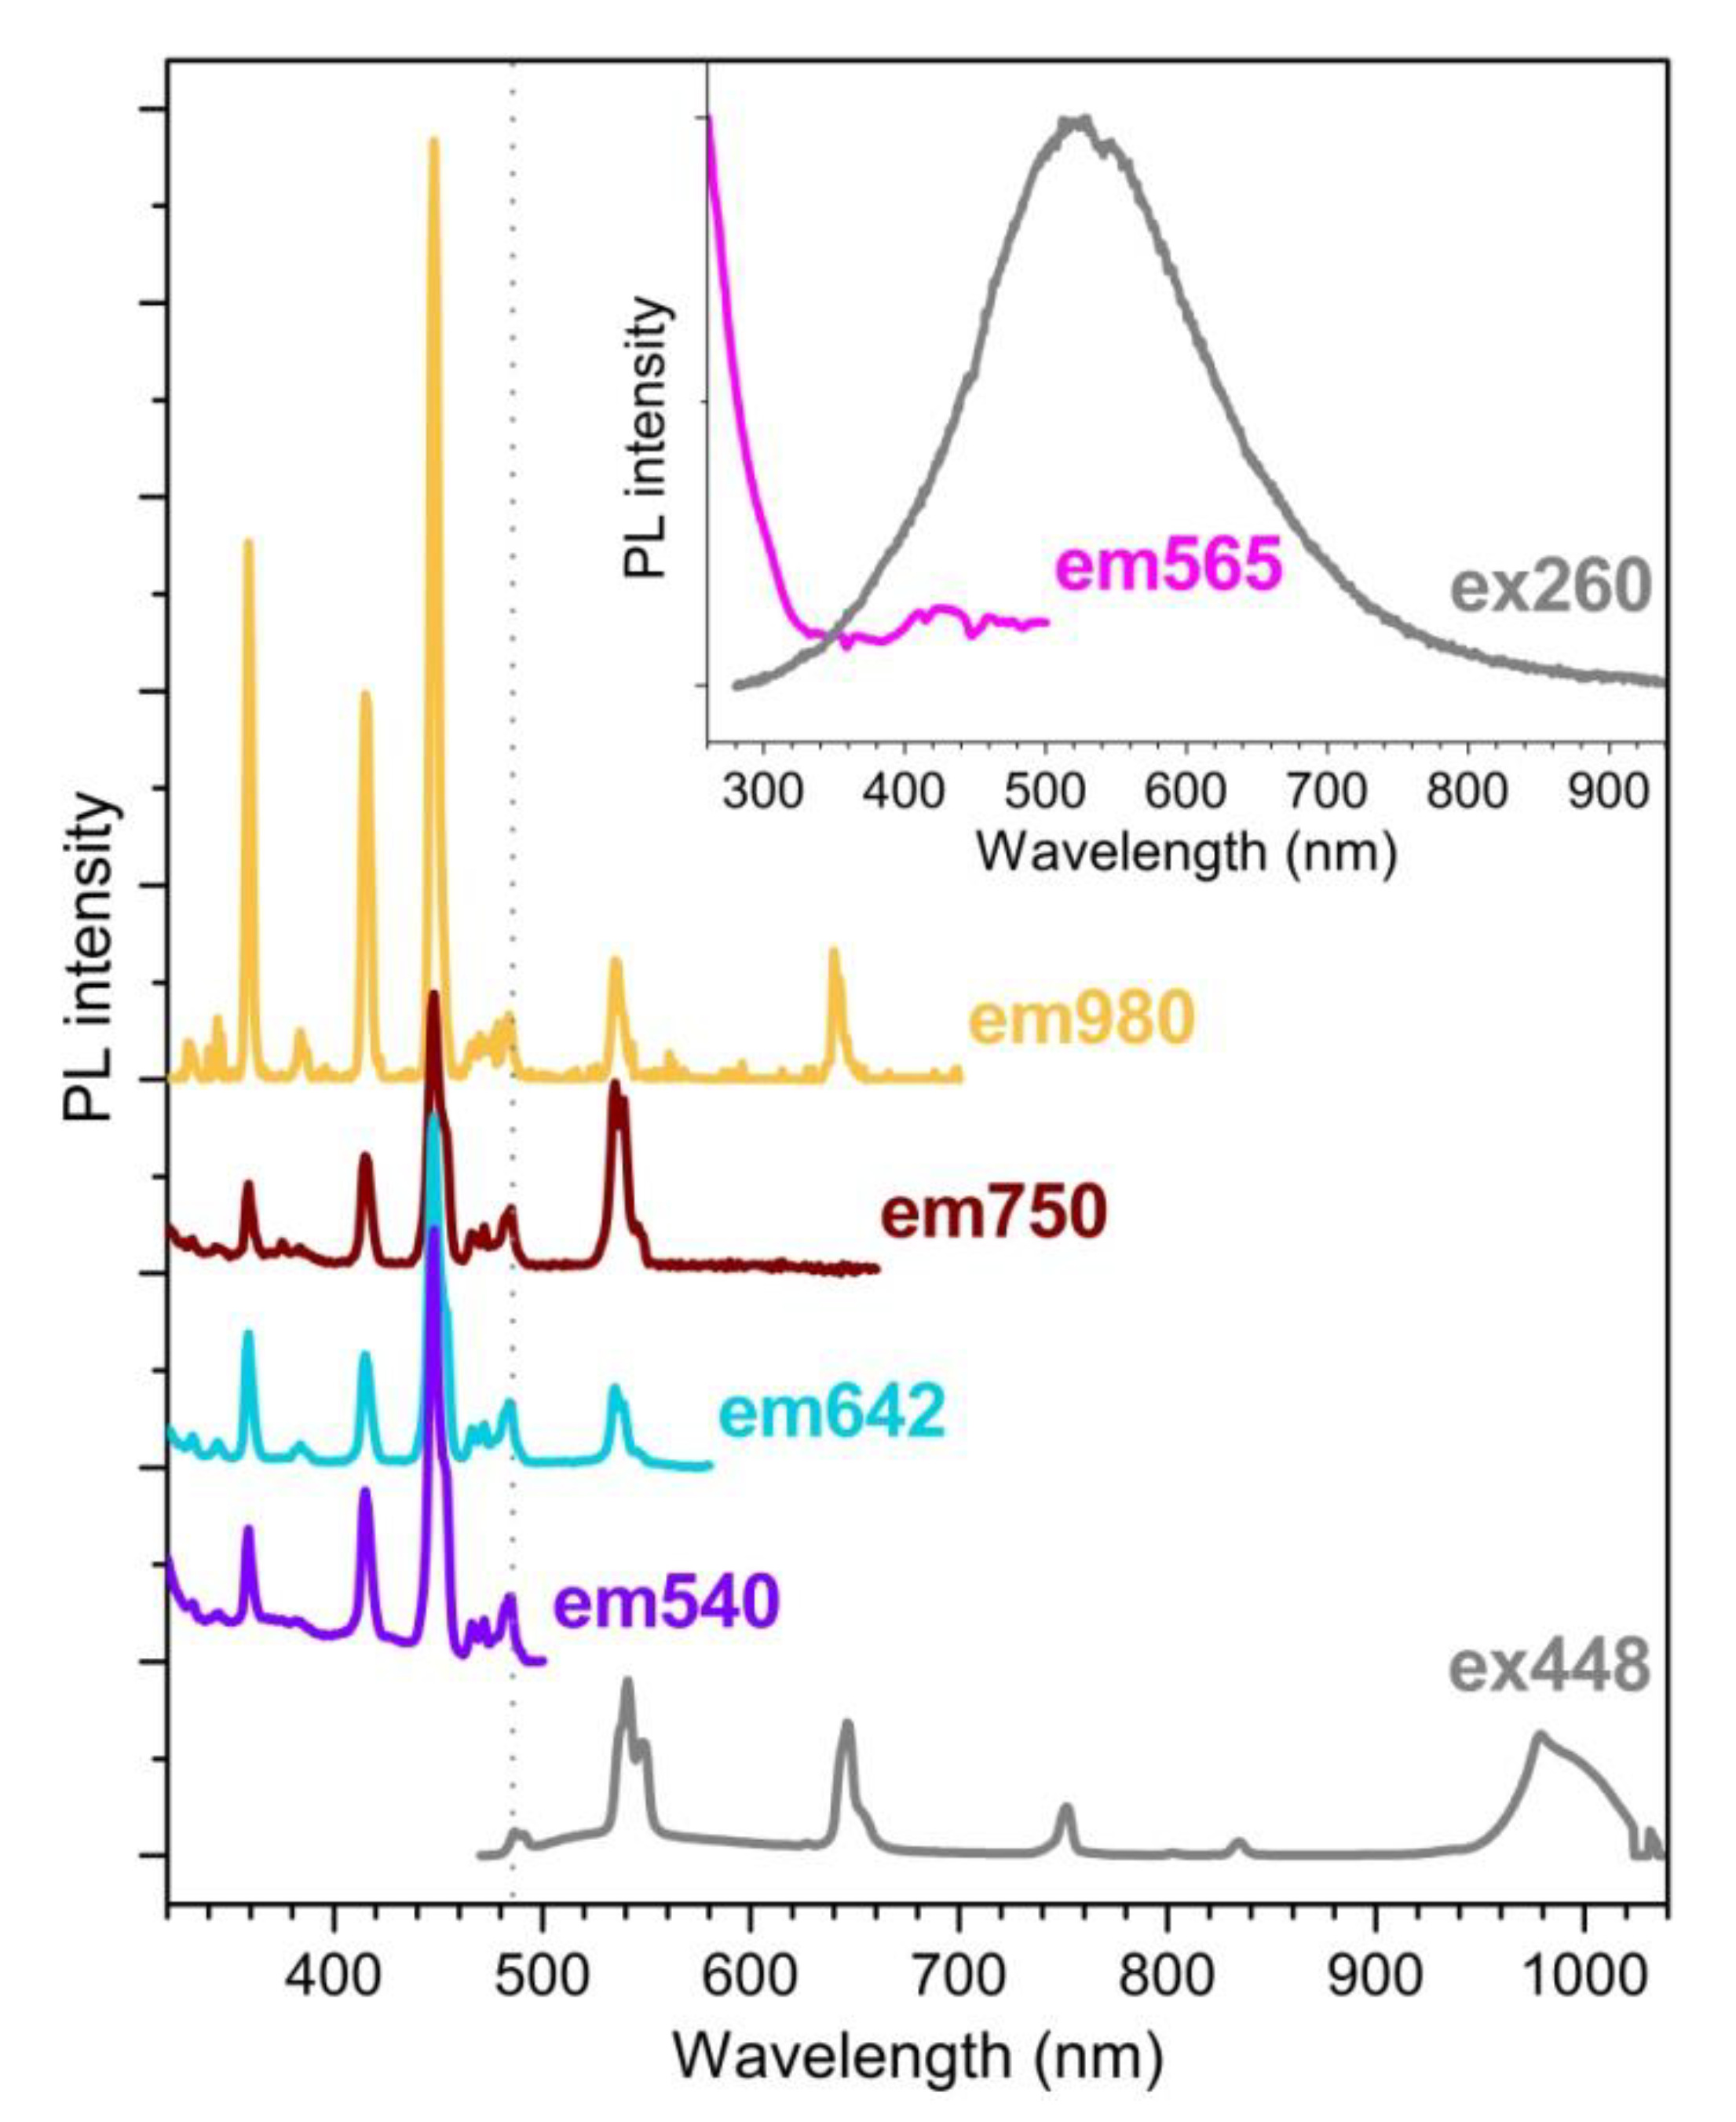
Figure 7 reports a series of PLE spectra for the Yb3+/Ho3+ codoped sample (Ce_0), obtained by monitoring the intensity for the three main Ho3+ emissions in the visible range and the Yb3+ emission at 980 nm. To facilitate the comparison, the spectra were normalized with respect to the emission signal resulting under 483 nm excitation, corresponding to the Ho3+ 5I8 → 5F3 ground-to-excited-state absorption. This gives the possibility to ascertain that, while the PLE spectra for Ho3+ emissions are characterized by almost the same intensity ratio between the different peaks in resonance with Ho3+ absorptions, for the Yb3+ emission the feature at 483 nm marks a sort of threshold beyond which the higher-energy peaks show enhanced relative intensity. This suggests a larger efficiency of the visible-to-NIR DC for the Yb3+/Ho3+ codoped system when operating with excitation light towards the UV-visible edge.
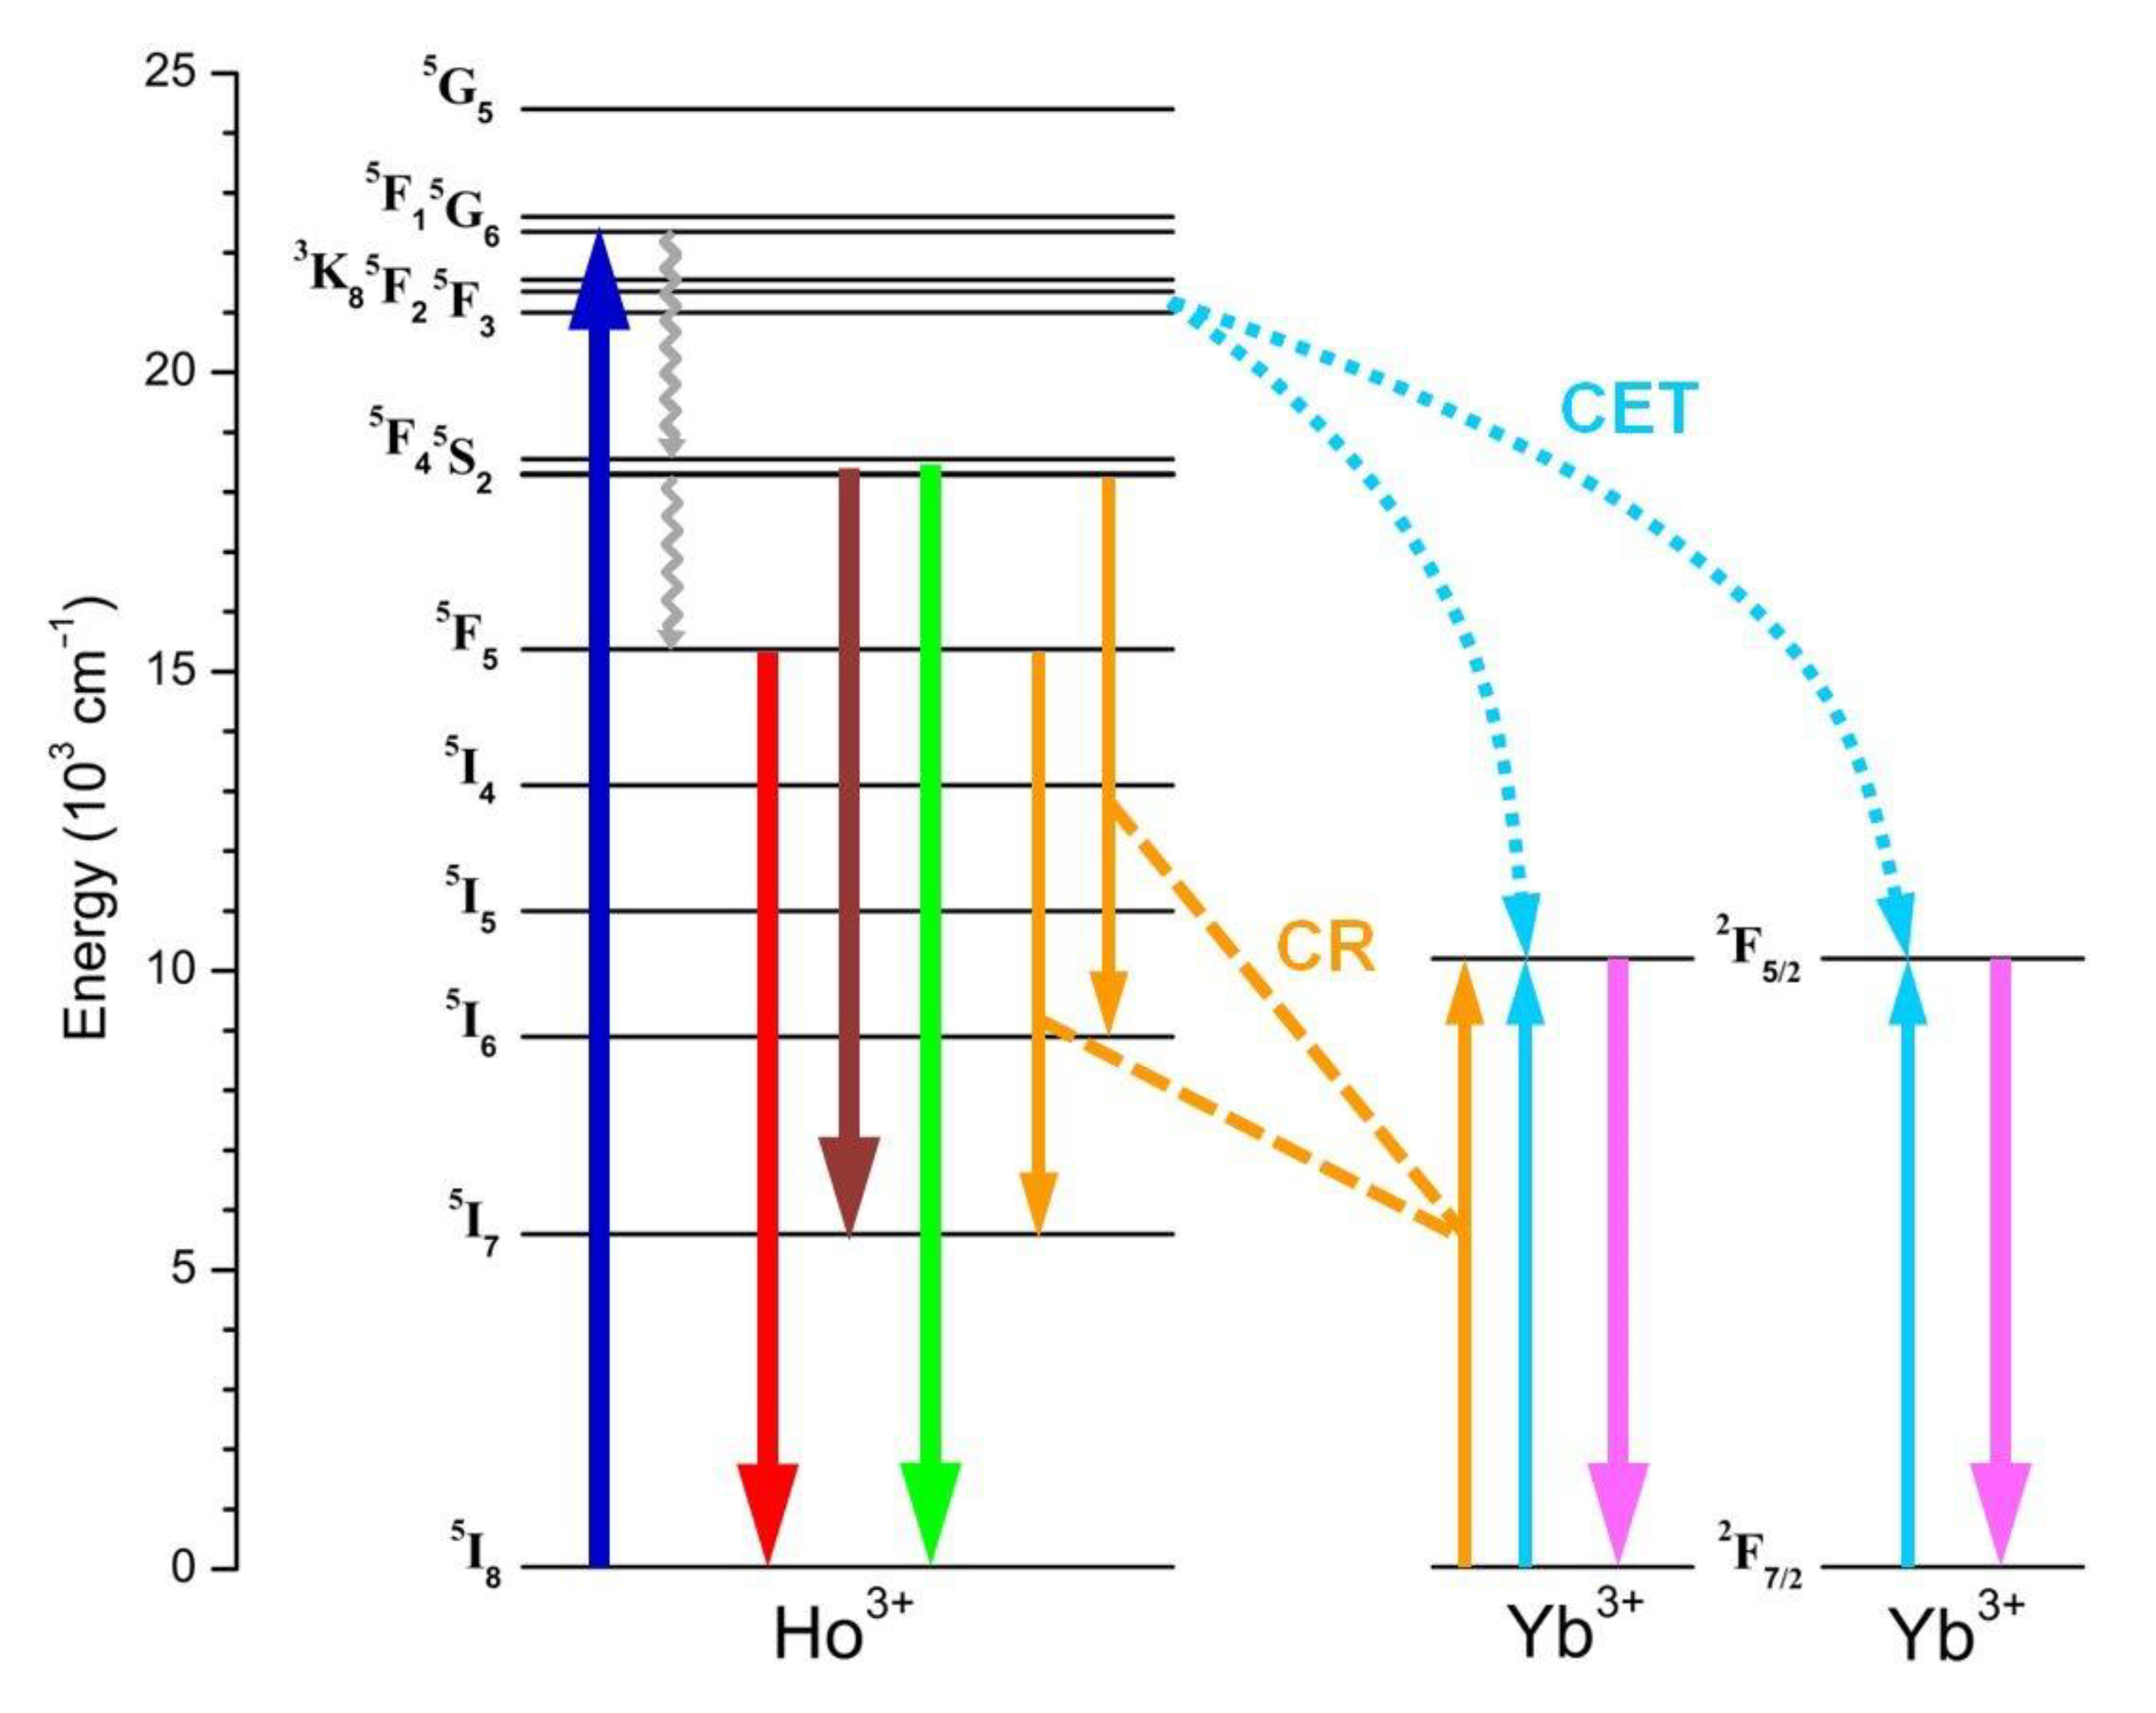
To get deeper inside the mechanism underlying the observed DC process, the scheme in Figure 8 depicts two of the major energy transfer processes proposed as responsible of the Ho3+-mediated Yb3+ ion photoexcitation [43]. On the one hand, upon Ho3+ excitation into high-energy 4f levels, which is followed by quick phonon-assisted relaxation to lower-lying ones responsible of Ho3+ visible emissions, resonant CR processes can take place, involving the transitions (i) Ho3+ 5S2/5F4 + Yb3+ 2F7/2 → Ho3+ 5I6 + Yb3+ 2F5/2 and (ii) Ho3+ 5F5 + Yb3+ 2F7/2 → Ho3+ 5I7 + Yb3+ 2F5/2. The observation in the 980 nm PLE spectrum of Figure 7 of specific features at the wavelengths of Ho3+ direct pumping into 5S2/5F4 and 5I6 levels could reflect the activation of these CR processes.
On the other hand, it has been proposed that, at high Yb3+ doping level, Ho3+-Yb3+ pairs can effectively interact through a cooperative energy transfer (CET) mechanism that originates from the Ho3+ levels involved in non-radiative relaxation processes, in particular, Ho3+ 5F3 with transition scheme Ho3+ 5F3 → 2Yb3+ 2F5/2, as it nearly falls at twice the energy for Yb3+ ground-state relaxation [43]. As this CET mechanism is configurable as a two-photon NIR QC and supposing an intrinsic larger efficiency with respect to the mentioned CR processes, this would explain the enhanced relative intensity of the PLE peaks in the 980 nm spectrum when pumping with photons in the UV-blue range.
A further aspect to note is linked to a possible role of Ce3+ in the observed visible-to-NIR DC process. The PL spectra of Figure 6a show that the increase in Ce3+ content determines an enhancement of the Yb3+ 980 nm band with respect to the different Ho3+ emissions in the visible range. This cannot be solely attributed to a Ce3+-induced loss in efficiency for the Ho3+ radiative processes, otherwise we would expect at least a lifetime decrease for the Ho3+ PL emission at 650 nm. Rather, the idea is that the presence of Ce3+ can foster the Ho3+-Yb3+ ET coupling. In this regard, in the literature, a role of the Ce3+ 5d states is invoked, suggesting a first ET process from Ho3+ high-energy 4f levels to Ce3+ 5d ones upon UV-blue light pumping, followed by a Ce3+-Yb3+ cooperative DC involving Ce3+ 5d non-radiative relaxation and ET to a pair of Yb3+ ions, with final 980 nm photon emission [46].
As a final suggestion, it is worth considering a peculiar aspect that emerges in the PL spectra of Figure 6a. These show that the Ho3+ emission bands in the visible range seem to float above a background luminescence signal. The inset of Figure 7 highlights that, under UV photoexcitation, this PL signal is strongly enhanced, resulting in a wide band with peak located at around 565 nm and characterized by a large Stoke shift with respect to the 300 nm absorption threshold which appears in the PLE spectrum. Luminescence emissions in the visible spectral range, also active at room temperature, have been observed for the NaBiF4 system [38]. In general, RT luminescence activity observed for bismuth-based compounds is typically attributed to Bi3+ s-p transitions.
4. Conclusions
This work has focused on the investigation of the luminescence properties exhibited by NaBiF4 NPs embedding specific amount of Yb3+, Ho3+ and Ce3+ ions. Operating in UC mode, which determines NIR-to-visible conversion through Yb3+-Ho3+ ET mechanisms, we observed that the variation of the Ce3+ content induces a modification of the PL chromaticity output as determined from the relative intensity of the two main visible Ho3+ emission features (GRN and RED bands). The effect is attributed to a pair of efficient CR mechanisms, by which a color tuning effect takes place with progressive green-to-red conversion with increasing Ce3+ content. On the basis of a rate equations model, we established a hierarchy between the two Ce3+-mediated CR processes from the experimental data, and a parabolic dependence on the Ce3+ content of the intensity ratio between the Ho3+ RED and GRN emissions in a specific Ce3+ doping range, beyond which a saturation effect is observed.
Furthermore, direct photoexcitation of Ho3+ ions into high-energy levels originates luminescence spectra featuring an intense 980 nm Yb3+ band as the result of a visible-to-NIR DC mechanism. The Yb3+ emission process is particularly efficient with UV-visible pumping above the energy threshold corresponding to the Ho3+ 5I8 → 5F3 transition, then suggesting the occurrence of a QC process driven by Ho3+-Yb3+ CET that enhances the overall DC mechanism. Moreover, we observed that the presence of Ce3+ ions can contribute to this process by further fostering the visible-to-NIR DC effect.
All these evidences make Yb3+/Ho3+/Ce3+ doping of the developed NaBiF4 NPs as a promising way to prepare phosphors with controlled UC and DC emission performance for possible applications in several fields such as photonics, bioimaging and anticounterfeiting.
Supplementary Materials
The following supporting information can be downloaded at: https://www.mdpi.com/article/10.3390/nano13040672/s1, Figure S1: Trend of cell volume vs. Ce3+ content; Figure S2: FE-SEM images of Ce_0, Ce_2, Ce_5 and Ce_20 samples; Figure S3: EDS spectrum of Ce_10 sample; Figure S4: FE-SEM image and elemental maps of Ce_10 sample.
Author Contributions
Conceptualization, E.T. and M.B.; methodology, E.T.; validation, E.T., M.B., D.P., E.A. and L.P.; formal analysis, E.T. and M.B.; investigation, E.T., M.B., D.P., E.A. and L.P.; writing—original draft preparation, E.T.; writing—review and editing, E.T. and M.B. All authors have read and agreed to the published version of the manuscript.
Funding
This research received no external funding.
Data Availability Statement
The data presented in this study are available on request from the corresponding author.
Conflicts of Interest
The authors declare no conflict of interest.
References
- Stanley, C.; Mojiri, A.; Rosengarten, G. Spectral light management for solar energy conversion systems. Nanophotonics 2016, 5, 161–179. [Google Scholar]
- Day, J.; Senthilarasu, S.; Mallick, T.K. Improving spectral modification for applications in solar cells: A review. Renew. Energy 2019, 132, 186–205. [Google Scholar] [CrossRef]
- Yi, Z.; Luo, Z.; Qin, X.; Chen, Q.; Liu, X. Lanthanide-activated nanoparticles: A toolbox for bioimaging, therapeutics, and neuromodulation. Acc. Chem. Res. 2020, 53, 2692–2704. [Google Scholar]
- Du, Y.; Ai, X.; Li, Z.; Sun, T.; Huang, Y.; Zeng, X.; Chen, X.; Rao, F.; Wang, F. Visible-to-ultraviolet light conversion: Materials and applications. Adv. Photonics Res. 2021, 2, 2000213. [Google Scholar]
- Khan, Y.; Hwang, S.; Braveenth, R.; Jung, Y.H.; Walker, B.; Kwon, J.H. Synthesis of fluorescent organic nano-dots and their application as efficient color conversion layers. Nat. Commun. 2022, 13, 1801. [Google Scholar] [PubMed]
- Bünzli, J.-C.G.; Piguet, G. Taking advantage of luminescent lanthanide ions. Chem. Soc. Rev. 2005, 34, 1048–1077. [Google Scholar]
- Cattaruzza, E.; Battaglin, G.; Visentin, F.; Trave, E.; Aquilanti, G.; Mariotto, G. Enhanced photoluminescence at λ = 1.54 μm in the Cu-doped Er:SiO2 system. J. Phys. Chem. C 2012, 116, 21001–21011. [Google Scholar] [CrossRef]
- Dong, H.; Sun, L.-D.; Yan, C.-H. Energy transfer in lanthanide upconversion studies for extended optical applications. Chem. Soc. Rev. 2015, 44, 1608–1634. [Google Scholar] [CrossRef]
- Trave, E.; Back, M.; Cattaruzza, E.; Gonella, F.; Enrichi, F.; Cesca, T.; Kalinic, B.; Scian, C.; Bello, V.; Maurizio, C.; et al. Control of silver clustering for broadband Er3+ luminescence sensitization in Er and Ag co-implanted silica. J. Lumin. 2018, 197, 104–111. [Google Scholar]
- Zur, L.; Armellini, C.; Belmokhtar, S.; Bouajaj, A.; Cattaruzza, E.; Chiappini, A.; Coccetti, F.; Ferrari, M.; Gonella, F.; Righini, G.C.; et al. Comparison between glass and glass-ceramic silica-hafnia matrices on the down-conversion efficiency of Tb3+/Yb3+ rare earth ions. Opt. Mater. 2019, 87, 102–106. [Google Scholar]
- Zheng, K.; Loh, K.Y.; Wang, Y.; Chen, Q.; Fan, J.; Jung, T.; Nam, S.H.; Suh, Y.D.; Liu, X. Recent advances in upconversion nanocrystals: Expanding the kaleidoscopic toolbox for emerging applications. Nano Today 2019, 29, 100797. [Google Scholar] [CrossRef]
- Auzel, F. Upconversion and anti-Stokes processes with f and d ions in solids. Chem. Rev. 2004, 104, 139–173. [Google Scholar] [PubMed]
- Zhou, J.; Leaño, J.L.; Liu, Z.; Jin, D.; Wong, K.-L.; Liu, R.-S.; Bünzli, J.-C.G. Impact of lanthanide nanomaterials on photonic devices and smart applications. Small 2018, 14, 1801882. [Google Scholar]
- Nsubuga, A.; Zarschler, K.; Sgarzi, M.; Graham, B.; Stephan, H.; Joshi, T. Towards utilising photocrosslinking of polydiacetylenes for the preparation of “stealth” upconverting nanoparticles. Angew. Chem. Int. Ed. 2018, 57, 16036–16040. [Google Scholar]
- Zhu, X.; Zhang, J.; Liu, J.; Zhang, Y. Recent progress of rare-earth doped upconversion nanoparticles: Synthesis, optimization, and applications. Adv. Sci. 2019, 6, 1901358. [Google Scholar]
- Cheng, Q.; Sui, J.; Cai, W. Enhanced upconversion emission in Yb3+ and Er3+ codoped NaGdF4 nanocrystals by introducing Li+ ions. Nanoscale 2012, 4, 779–784. [Google Scholar]
- Tian, G.; Gu, Z.; Zhou, L.; Yin, W.; Liu, X.; Yan, L.; Jin, S.; Ren, W.; Xing, G.; Li, S.; et al. Mn2+ dopant-controlled synthesis of NaYF4:Yb/Er upconversion nanoparticles for in vivo imaging and drug delivery. Adv. Mater. 2012, 24, 1226–1231. [Google Scholar] [CrossRef]
- Ramasamy, P.; Chandra, P.; Rhee, S.W.; Kim, J. Enhanced upconversion luminescence in NaGdF4:Yb,Er nanocrystals by Fe3+ doping and their application in bioimaging. Nanoscale 2013, 5, 8711–8717. [Google Scholar] [CrossRef]
- Cong, T.; Yadan, D.; Yu, X.; Mu, Y.; Hong, X.; Liu, Y. Upconversion improvement by the reduction of Na+-vacancies in Mn2+ doped hexagonal NaYbF4:Er3+ nanoparticles. Dalton Trans. 2015, 44, 4133–4140. [Google Scholar]
- Mohanty, S.; Kaczmarek, A.M. Unravelling the benefits of transition-metal-co-doping in lanthanide upconversion nanoparticles. Chem. Soc. Rev. 2022, 51, 6893–6908. [Google Scholar]
- Chen, G.; Liu, H.; Somesfalean, G.; Liang, H.; Zhang, Z. Upconversion emission tuning from green to red in Yb3+/Ho3+-codoped NaYF4 nanocrystals by tridoping with Ce3+ ions. Nanotechnology 2009, 20, 385704. [Google Scholar] [PubMed]
- Gao, W.; Zheng, H.; Han, Q.; He, E.; Gao, F.; Wang, R. Enhanced red upconversion luminescence by codoping Ce3+ in β-NaY(Gd0.4)F4:Yb3+/Ho3+ nanocrystals. J. Mater. Chem. C 2014, 2, 5327–5334. [Google Scholar]
- Hu, F.; Zhang, J.; Giraldo, O.; Song, W.; Wei, R.; Yin, M.; Guo, H. Spectral conversion from green to red in Yb3+/Ho3+:Sr2GdF7 glass ceramics via Ce3+ doping. J. Lumin. 2018, 201, 493–499. [Google Scholar]
- An, N.; Zhou, H.; Zhu, K.; Ye, L.; Qiu, J.; Wang, L.G. Improved temperature sensing performance of YAG: Ho3+/Yb3+ by doping Ce3+ ions based on up-conversion luminescence. J. Alloys Compd. 2020, 843, 156057. [Google Scholar]
- Giordano, L.; Du, H.; Castaing, V.; Luan, F.; Guo, D.; Viana, B. Enhanced red-UC luminescence through Ce3+ co-doping in NaBiF4:Yb3+/Ho3+(Er3+)/Ce3+ phosphors prepared by ultrafast coprecipitation approach. Opt. Mater.: X 2022, 16, 100199. [Google Scholar] [CrossRef]
- Lin, H.; Chen, D.; Yu, Y.; Shan, Z.; Huang, P.; Wang, Y.; Yuan, J. Nd3+-sensitized upconversion white light emission of Tm3+/Ho3+ bridged by Yb3+ in β-YF3 nanocrystals embedded transparent glass ceramics. J. Appl. Phys. 2010, 107, 103511. [Google Scholar]
- Jaque, D.; Vetrone, F. Luminescence nanothermometry. Nanoscale 2012, 4, 4301–4326. [Google Scholar]
- Chen, G.; Qiu, H.; Prasad, P.; Chen, X. Upconversion nanoparticles: Design, nanochemistry, and applications in theranostics. Chem. Rev. 2014, 114, 5161–5214. [Google Scholar]
- Lee, J.; Bisso, P.W.; Srinivas, R.L.; Kim, J.J.; Swiston, A.J.; Doyle, P.S. Universal process-inert encoding architecture for polymer microparticles. Nat. Mater. 2014, 13, 524–529. [Google Scholar] [CrossRef]
- Zhou, J.; Liu, Q.; Feng, W.; Sun, Y.; Li, F. Upconversion luminescent materials: Advances and applications. Chem. Rev. 2015, 115, 395–465. [Google Scholar] [CrossRef]
- Hesse, J.; Klier, D.T.; Sgarzi, M.; Nsubuga, A.; Bauer, C.; Grenzer, J.; Hübner, R.; Wislicenus, M.; Joshi, T.; Kumke, M.U.; et al. Rapid synthesis of sub-10 nm hexagonal NaYF4-based upconverting nanoparticles using Therminol® 66. ChemistryOpen 2018, 7, 159–168. [Google Scholar] [CrossRef] [PubMed]
- Back, M.; Trave, E.; Mazzucco, N.; Riello, P.; Benedetti, A. Tuning the upconversion light emission by bandgap engineering in bismuth oxide-based upconverting nanoparticles. Nanoscale 2017, 9, 6353–6361. [Google Scholar] [CrossRef] [PubMed]
- Back, M.; Trave, E.; Riello, P.; Joos, J.J. Insight into the upconversion luminescence of highly efficient lanthanide-doped Bi2O3 nanoparticles. J. Phys. Chem. C 2018, 122, 7389–7398. [Google Scholar] [CrossRef]
- Back, M.; Trave, E.; Zaccariello, G.; Cristofori, D.; Canton, P.; Benedetti, A.; Riello, P. Bi2SiO5@g-SiO2 upconverting nanoparticles: A bismuth-driven core-shell self-assembly mechanism. Nanoscale 2019, 11, 675–687. [Google Scholar] [PubMed]
- Back, M.; Casagrande, E.; Trave, E.; Cristofori, D.; Ambrosi, E.; Dallo, F.; Roman, M.; Ueda, J.; Xu, J.; Tanabe, S.; et al. Confined-melting-assisted synthesis of bismuth silicate glass-ceramic nanoparticles: Formation and optical thermometry investigation. ACS Appl. Mater. Interfaces 2020, 12, 55195–55204. [Google Scholar] [CrossRef]
- Back, M.; Xu, J.; Ueda, J.; Benedetti, A.; Tanabe, S. Thermochromic narrow band gap phosphors for multimodal optical thermometry: The case of Y3+-stabilized β-Bi2O3:Nd3+. Chem. Mater. 2022, 34, 8198–8206. [Google Scholar] [CrossRef]
- Lei, P.; An, R.; Yao, S.; Wang, Q.; Dong, L.; Xu, X.; Du, K.; Feng, J.; Zhang, H. Ultrafast synthesis of novel hexagonal phase NaBiF4 upconversion nanoparticles at room temperature. Adv. Mater. 2017, 29, 1700505. [Google Scholar]
- Back, M.; Ueda, J.; Ambrosi, E.; Cassandro, L.; Cristofori, D.; Ottini, R.; Riello, P.; Sponchia, G.; Asami, K.; Tanabe, S.; et al. Lanthanide-doped bismuth-based fluoride nanocrystalline particles: Formation, spectroscopic investigation, and chemical stability. Chem. Mater. 2019, 31, 8504–8514. [Google Scholar] [CrossRef]
- Gao, W.; Wang, R.; Han, Q.; Dong, J.; Yan, L.; Zheng, H. Tuning red upconversion emission in single LiYF4:Yb3+/Ho3+ microparticle. J. Phys. Chem. C 2015, 119, 2349–2355. [Google Scholar]
- Gao, W.; Dong, J.; Liu, J.; Yan, X. Effective tuning of the ratio of red to green emission of Ho3+ ions in single LiLuF4 microparticle via codoping Ce3+ ions. J. Alloys Compd. 2016, 679, 1–8. [Google Scholar]
- Pilch-Wróbel, A.; Zasada, J.; Berdnarkiewicz, A. The influence of Ce3+ codoping and excitation scheme on spectroscopic properties of NaYF4:Yb3+, Ho3+. J. Lumin. 2020, 226, 117494. [Google Scholar] [CrossRef]
- Lin, H.; Chen, D.; Yu, Y.; Yang, A.; Wang, Y. Near-infrared quantum cutting in Ho3+/Yb3+ codoped nanostructured glass ceramic. Opt. Lett. 2011, 36, 876–878. [Google Scholar] [CrossRef] [PubMed]
- Yu, D.C.; Huang, X.Y.; Ye, S.; Zhang, Q.Y. Efficient first-order resonant near-infrared quantum cutting in β-NaYF4:Ho3+,Yb3+. J. Alloys Compd. 2011, 509, 9919–9923. [Google Scholar] [CrossRef]
- Deng, K.; Gong, T.; Hu, L.; Wei, X.; Chen, Y.; Yin, M. Efficient near-infrared quantum cutting in NaYF4:Ho3+,Yb3+ for solar photovoltaics. Opt. Express 2011, 19, 1749–1754. [Google Scholar] [CrossRef] [PubMed]
- Babu, P.; Martín, I.R.; Lavín, V.; Rodríguez-Mendoza, U.R.; Seo, H.J.; Krishanaiah, K.V.; Venkatramu, V. Quantum cutting and near-infrared emissions in Ho3+/Yb3+ codoped transparent glass-ceramics. J. Lumin. 2020, 226, 117424. [Google Scholar] [CrossRef]
- Tao, L.; Tsang, Y.H.; Zhou, B.; Richards, B.; Jha, A. Enhanced 2.0 μm emission and energy transfer in Yb3+/Ho3+/Ce3+ triply doped tellurite. J. Non-Cryst. Solids 2012, 358, 1644–1648. [Google Scholar] [CrossRef]
Figure 1.
(a) XRPD patterns of the Ln3+-doped NaBiF4 samples with different Ce3+ content. (b) FE-SEM image of Ce_10 sample.
Figure 1.
(a) XRPD patterns of the Ln3+-doped NaBiF4 samples with different Ce3+ content. (b) FE-SEM image of Ce_10 sample.

Figure 2.
(a) UCPL spectra under 980 nm excitation of the Ln3+-doped NaBiF4 samples with different Ce3+ content; each spectrum is normalized to the RED band signal. In the inset, trend of integrated PL intensity of the whole visible UC emission vs. Ce3+ content, with signals normalized to Ce_0 sample. (b) Chromaticity diagram showing color coordinates tuning for the Ln3+-doped NaBiF4 samples. (c) Digital camera images of the powder samples under 980 nm light exposure.

Figure 3.
Scheme of the energy level diagram representing UC and transition mechanisms originating the PL emissions observed for the Ln3+-doped NaBiF4 samples. The pink upward arrow refers to Yb3+ ground-state absorption process (GSA); thick downward arrows refer to Ho3+ radiative relaxations, where the attributed colors refer to emissions in the red, green and NIR spectral ranges; cyan and orange arrows refer to Yb3+-Ho3+ energy transfer (ET1, ET2, ET3) and Ce3+-mediated cross-relaxation (CR1, CR2) processes; grey wavelike arrows refer to multiphonon relaxations.

Figure 4.
(a) Log–log plot of the integrated UCPL intensity of GRN and RED emissions vs. 980 nm pumping power density; the order n of the UC processes corresponds to the slope of the linear fit (dashed lines) of the experimental data; the measurements were performed on Ce_10 sample. (b) Bar graphs of GRN and RED emission intensity and scatter + line plot (hollow blue dots and solid blue line) of RED-to-GRN intensity ratio vs. Ce3+ content; the dashed line corresponds to a parabolic fit of the intensity ratio, considering the data in Ce3+ content range of 0–10 at.%.

Figure 5.
Ho3+ 5I6 → 5I8 PL spectra under 980 nm excitation of the Ln3+-doped NaBiF4 samples with different Ce3+ content. In the inset, trend of integrated PL intensity vs. Ce3+ content, with signals normalized to Ce_0 sample.
Figure 5.
Ho3+ 5I6 → 5I8 PL spectra under 980 nm excitation of the Ln3+-doped NaBiF4 samples with different Ce3+ content. In the inset, trend of integrated PL intensity vs. Ce3+ content, with signals normalized to Ce_0 sample.

Figure 6.
(a) PL spectra under 448 nm excitation of the Ln3+-doped NaBiF4 samples with different Ce3+ content; each spectrum is normalized to the RED band signal. (b,c) GRN and RED PL decay curves under 460 nm excitation of the Ln3+-doped NaBiF4 samples with different Ce3+ content; solid lines are the result of the double-exponential fit of the decay curves by using the function , where and represent the fast and the slow components of the overall decay process, respectively. In the inset, trend of GRN and RED lifetime parameters vs. Ce3+ content, where is determined through the weighted average calculation .

Figure 7.
PLE spectra of emission signals at 540, 642, 750 and 980 nm and PL spectrum (grey line) under 448 excitation of Ce_0 sample; each PLE spectrum is normalized to the signal at 483 nm, corresponding to the Ho3+ 5I8 → 5F3 transition, which is marked by the vertical dotted line. In the inset, PLE spectrum of emission signal at 565 nm and PL spectrum under 260 nm excitation of Ce_0 sample.

Figure 8.
Scheme of the energy level diagram representing the photophysical mechanisms involved in the downconverted PL emissions observed for the Ln3+-doped NaBiF4 samples. The blue upward arrow refers to Ho3+ excitation into high-energy 4f levels; thick downward arrows refer to Ho3+ radiative relaxations in the visible range, and Yb3+ excited-state relaxation (purple arrow); cyan and orange arrows refer to Ho3+-Yb3+ cooperative energy transfer (CET) and cross-relaxation (CR) processes, respectively; grey wavelike arrows refer to multiphonon relaxations.


Table 1.
Results of the intensity measurements of Ho3+ NIR emission, and of the calculations related to Ho3+ GRN emission lifetime and Ce3+-mediated CR efficiency for the investigated Ln3+-doped NaBiF4 samples.
Table 1.
Results of the intensity measurements of Ho3+ NIR emission, and of the calculations related to Ho3+ GRN emission lifetime and Ce3+-mediated CR efficiency for the investigated Ln3+-doped NaBiF4 samples.
| Sample | ||||
|---|---|---|---|---|
| normalized to Ce_0 | [%] | [ms] | [%] | |
| Ce_0 | 1.000 | - | 60.1 | - |
| Ce_2 | 0.410 | 59.0 | 53.1 | 11.7 |
| Ce_5 | 0.300 | 75.8 | 51.5 | 14.3 |
| Ce_10 | 0.137 | 88.9 | 29.7 | 50.5 |
| Ce_20 | 0.101 | 91.8 | 21.3 | 64.6 |
Disclaimer/Publisher’s Note: The statements, opinions and data contained in all publications are solely those of the individual author(s) and contributor(s) and not of MDPI and/or the editor(s). MDPI and/or the editor(s) disclaim responsibility for any injury to people or property resulting from any ideas, methods, instructions or products referred to in the content. |
© 2023 by the authors. Licensee MDPI, Basel, Switzerland. This article is an open access article distributed under the terms and conditions of the Creative Commons Attribution (CC BY) license (https://creativecommons.org/licenses/by/4.0/).
Share and Cite
MDPI and ACS Style
Trave, E.; Back, M.; Pollon, D.; Ambrosi, E.; Puppulin, L. Light Conversion upon Photoexcitation of NaBiF4:Yb3+/Ho3+/Ce3+ Nanocrystalline Particles. Nanomaterials 2023, 13, 672. https://doi.org/10.3390/nano13040672
AMA Style
Trave E, Back M, Pollon D, Ambrosi E, Puppulin L. Light Conversion upon Photoexcitation of NaBiF4:Yb3+/Ho3+/Ce3+ Nanocrystalline Particles. Nanomaterials. 2023; 13(4):672. https://doi.org/10.3390/nano13040672
Chicago/Turabian StyleTrave, Enrico, Michele Back, Davide Pollon, Emmanuele Ambrosi, and Leonardo Puppulin. 2023. "Light Conversion upon Photoexcitation of NaBiF4:Yb3+/Ho3+/Ce3+ Nanocrystalline Particles" Nanomaterials 13, no. 4: 672. https://doi.org/10.3390/nano13040672
Note that from the first issue of 2016, this journal uses article numbers instead of page numbers. See further details here.