
What about Phenol Formaldehyde (PF) Foam in Modern-Contemporary Art? Insights into the Unaged and Naturally Aged Material by a Multi-Analytical Approach

 ,
,  ,
,
Abstract
:
1. Introduction
1.1. Phenol Formaldehyde (PF) Foams as a Complex Chemical Formulation
1.2. Open- and Closed-Cell PF Foams and Their Applications
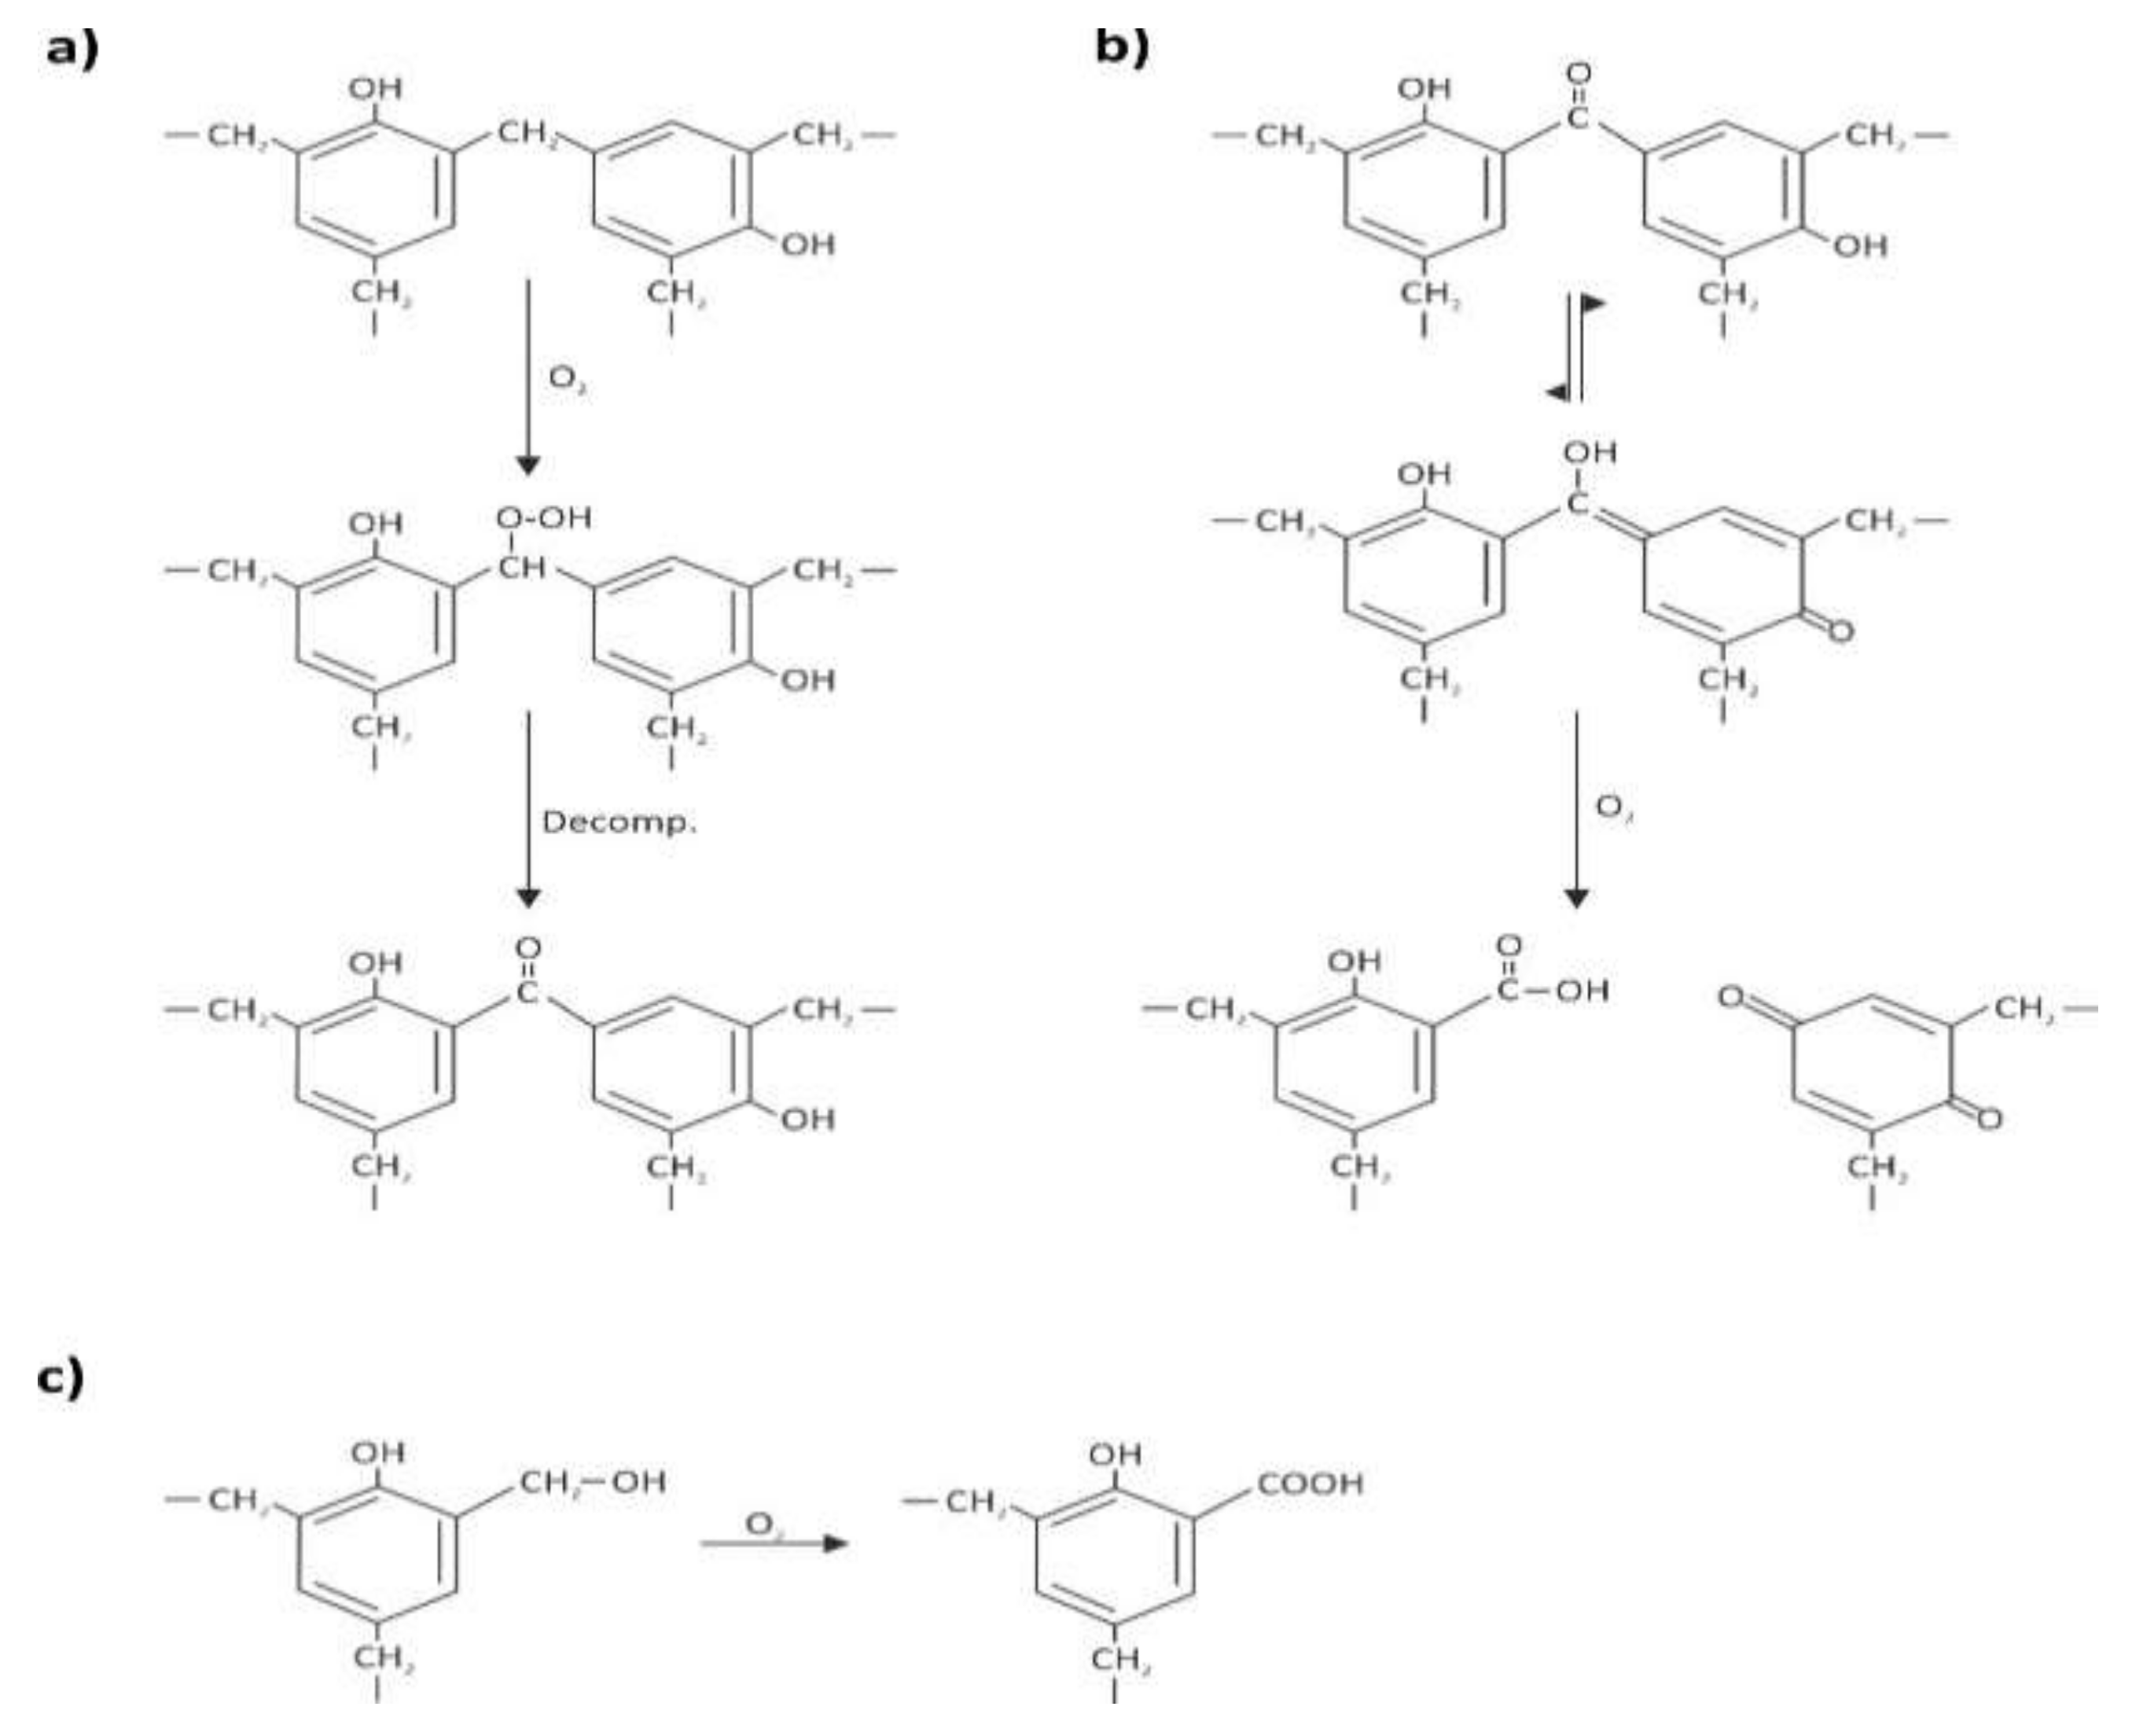
1.3. Stability of PF Foams
1.4. Aim of This Research
2. Materials and Methods
2.1. Materials
“Unaged” and Naturally Indoor-Aged Materials
- -
- Balsa Foam Soft Density: Naturally Aged 1 is the brighter zone under the label (not glued on the surface), and Naturally Aged 2 is the one outside the covered area, which resulted in a darker shade.
- -
- Balsa Foam 5 PCF: Naturally Aged 1 is the portion covered by the label (not glued on the surface), while Naturally Aged 2 refers to the area surrounding it on the same surface, and Naturally Aged 3 is the upper lateral part of the block, which was more exposed to the surrounding environment.
- -
- Austrotherm: Naturally Aged 1 is the surface cut in 2018, and Naturally Aged 2 is the external one.
2.2. Optical Microscopy (OM)
2.3. Fiber Optics Reflectance Spectroscopy (FORS)
2.4. Micro-Fourier Transform Infrared (μ-FTIR) Spectroscopy
2.5. pH Measurements
3. Results and Discussion
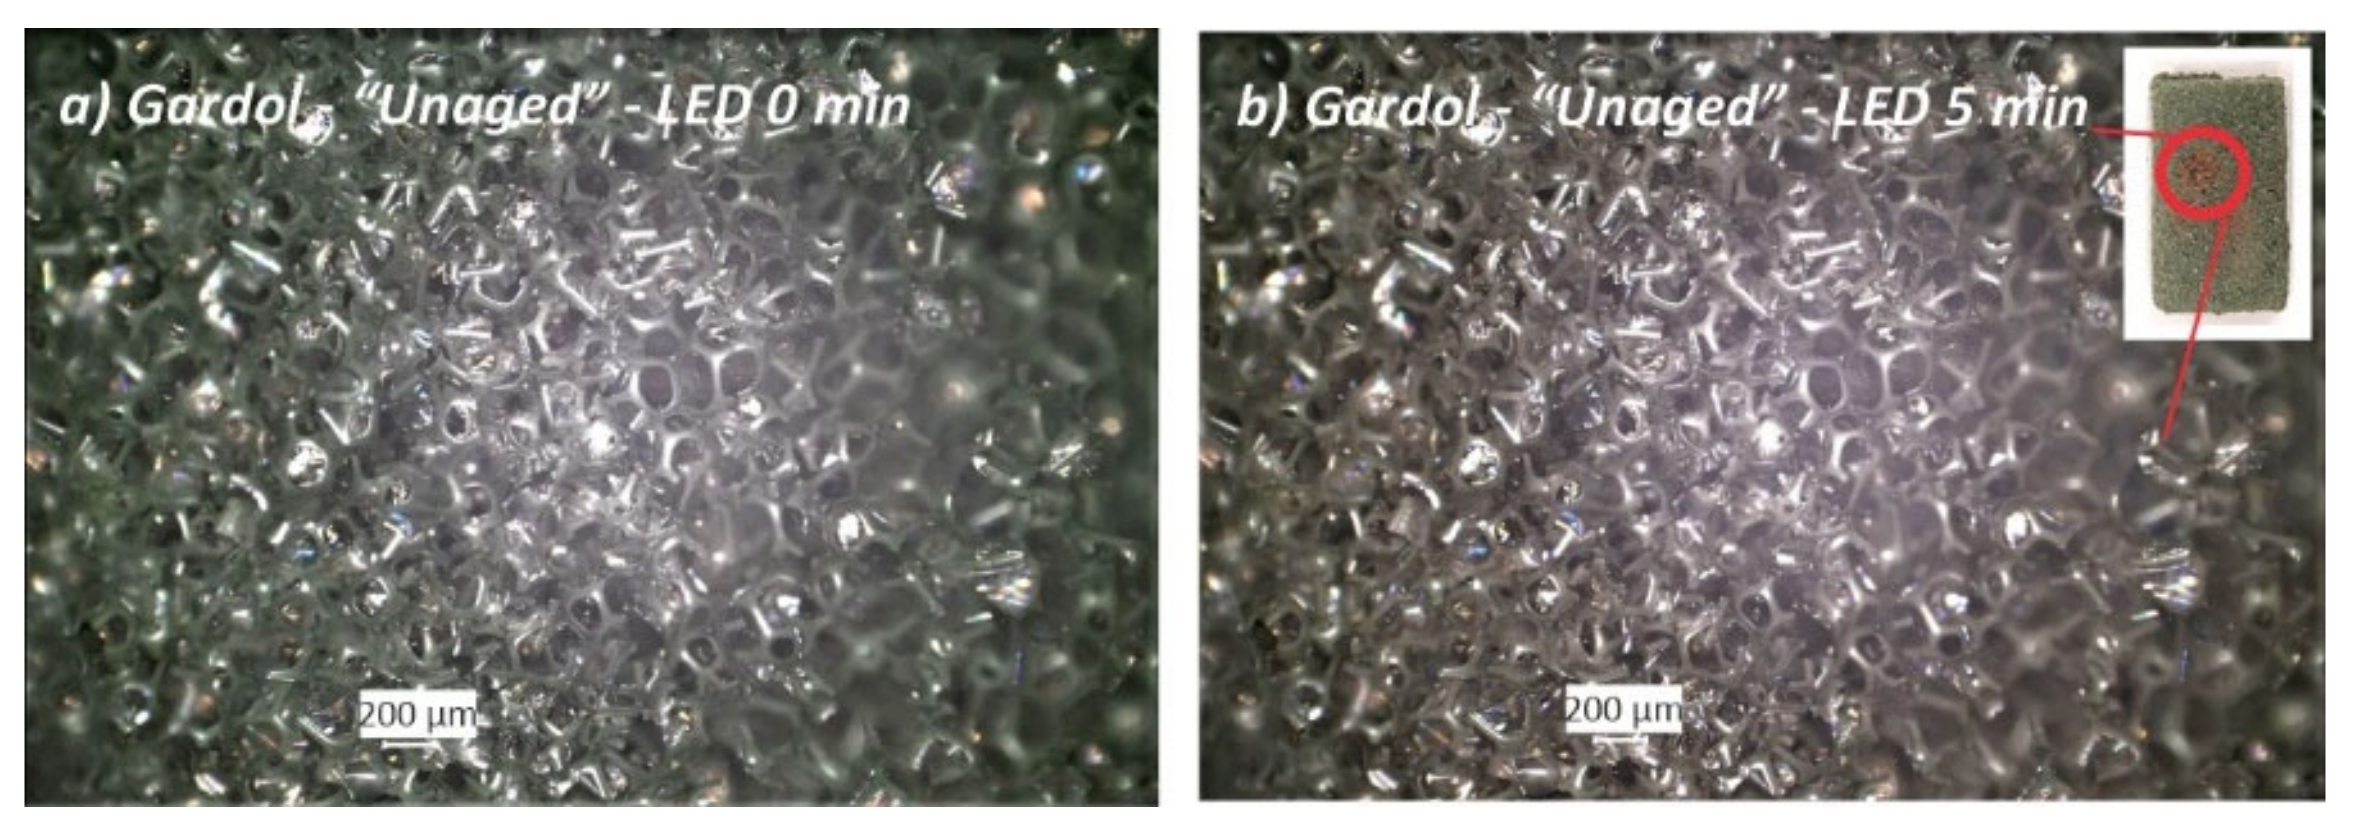
3.1. Optical Microscopy (OM)
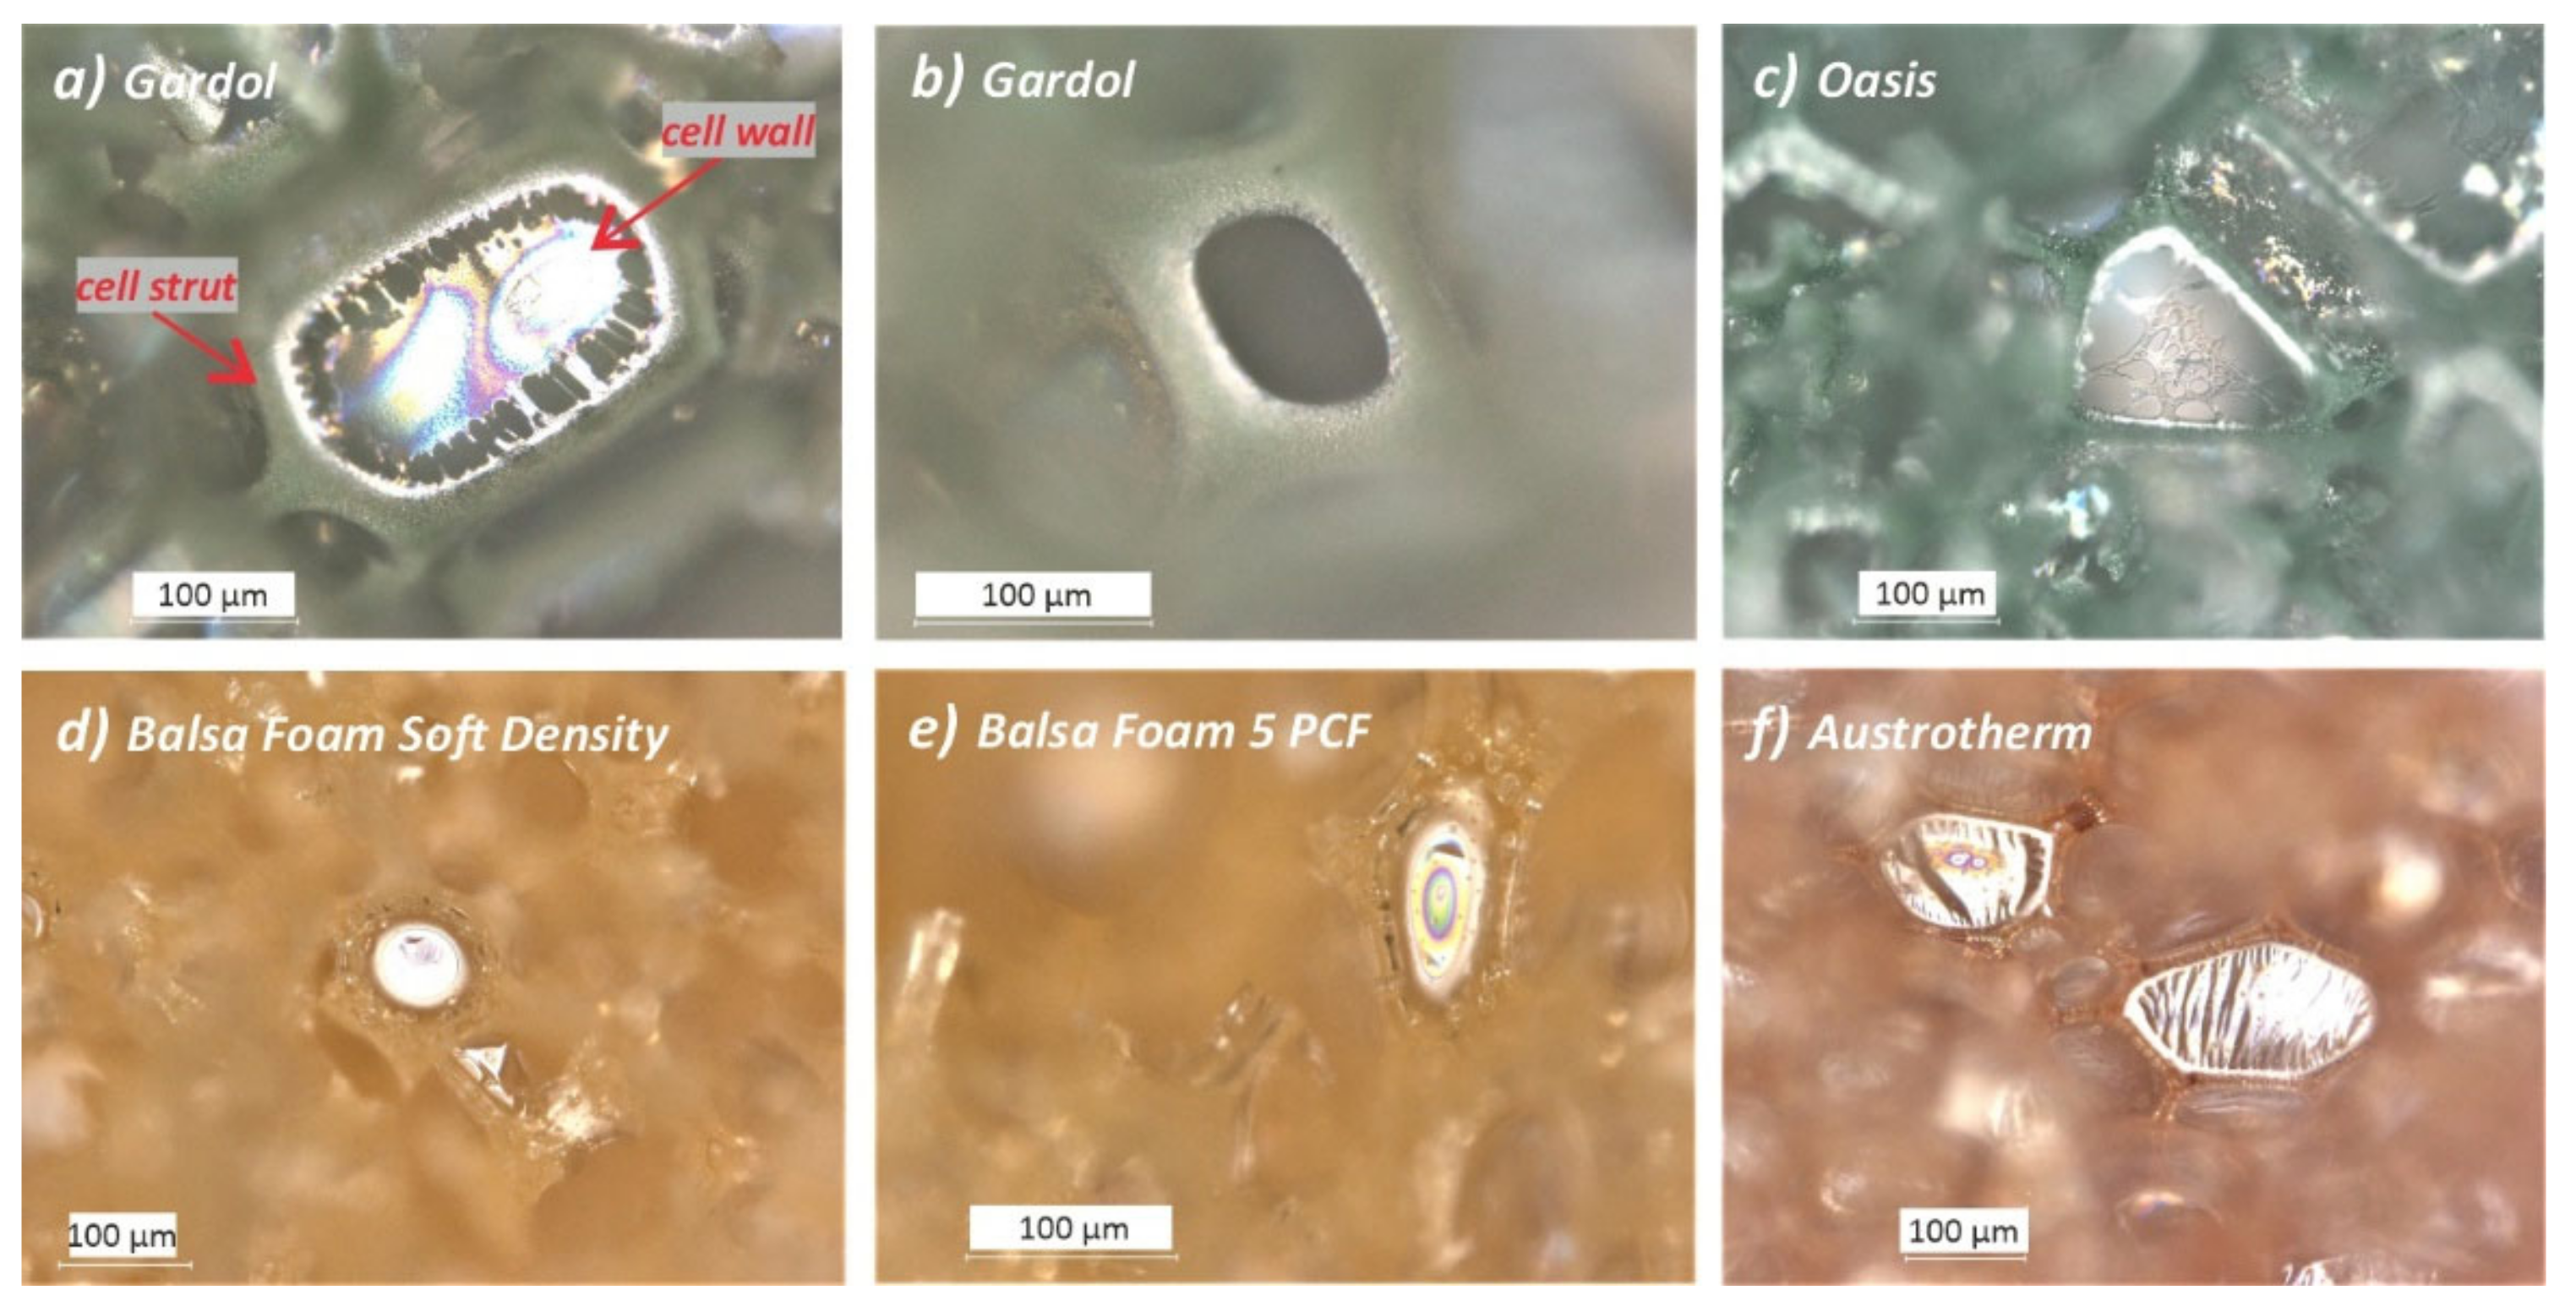
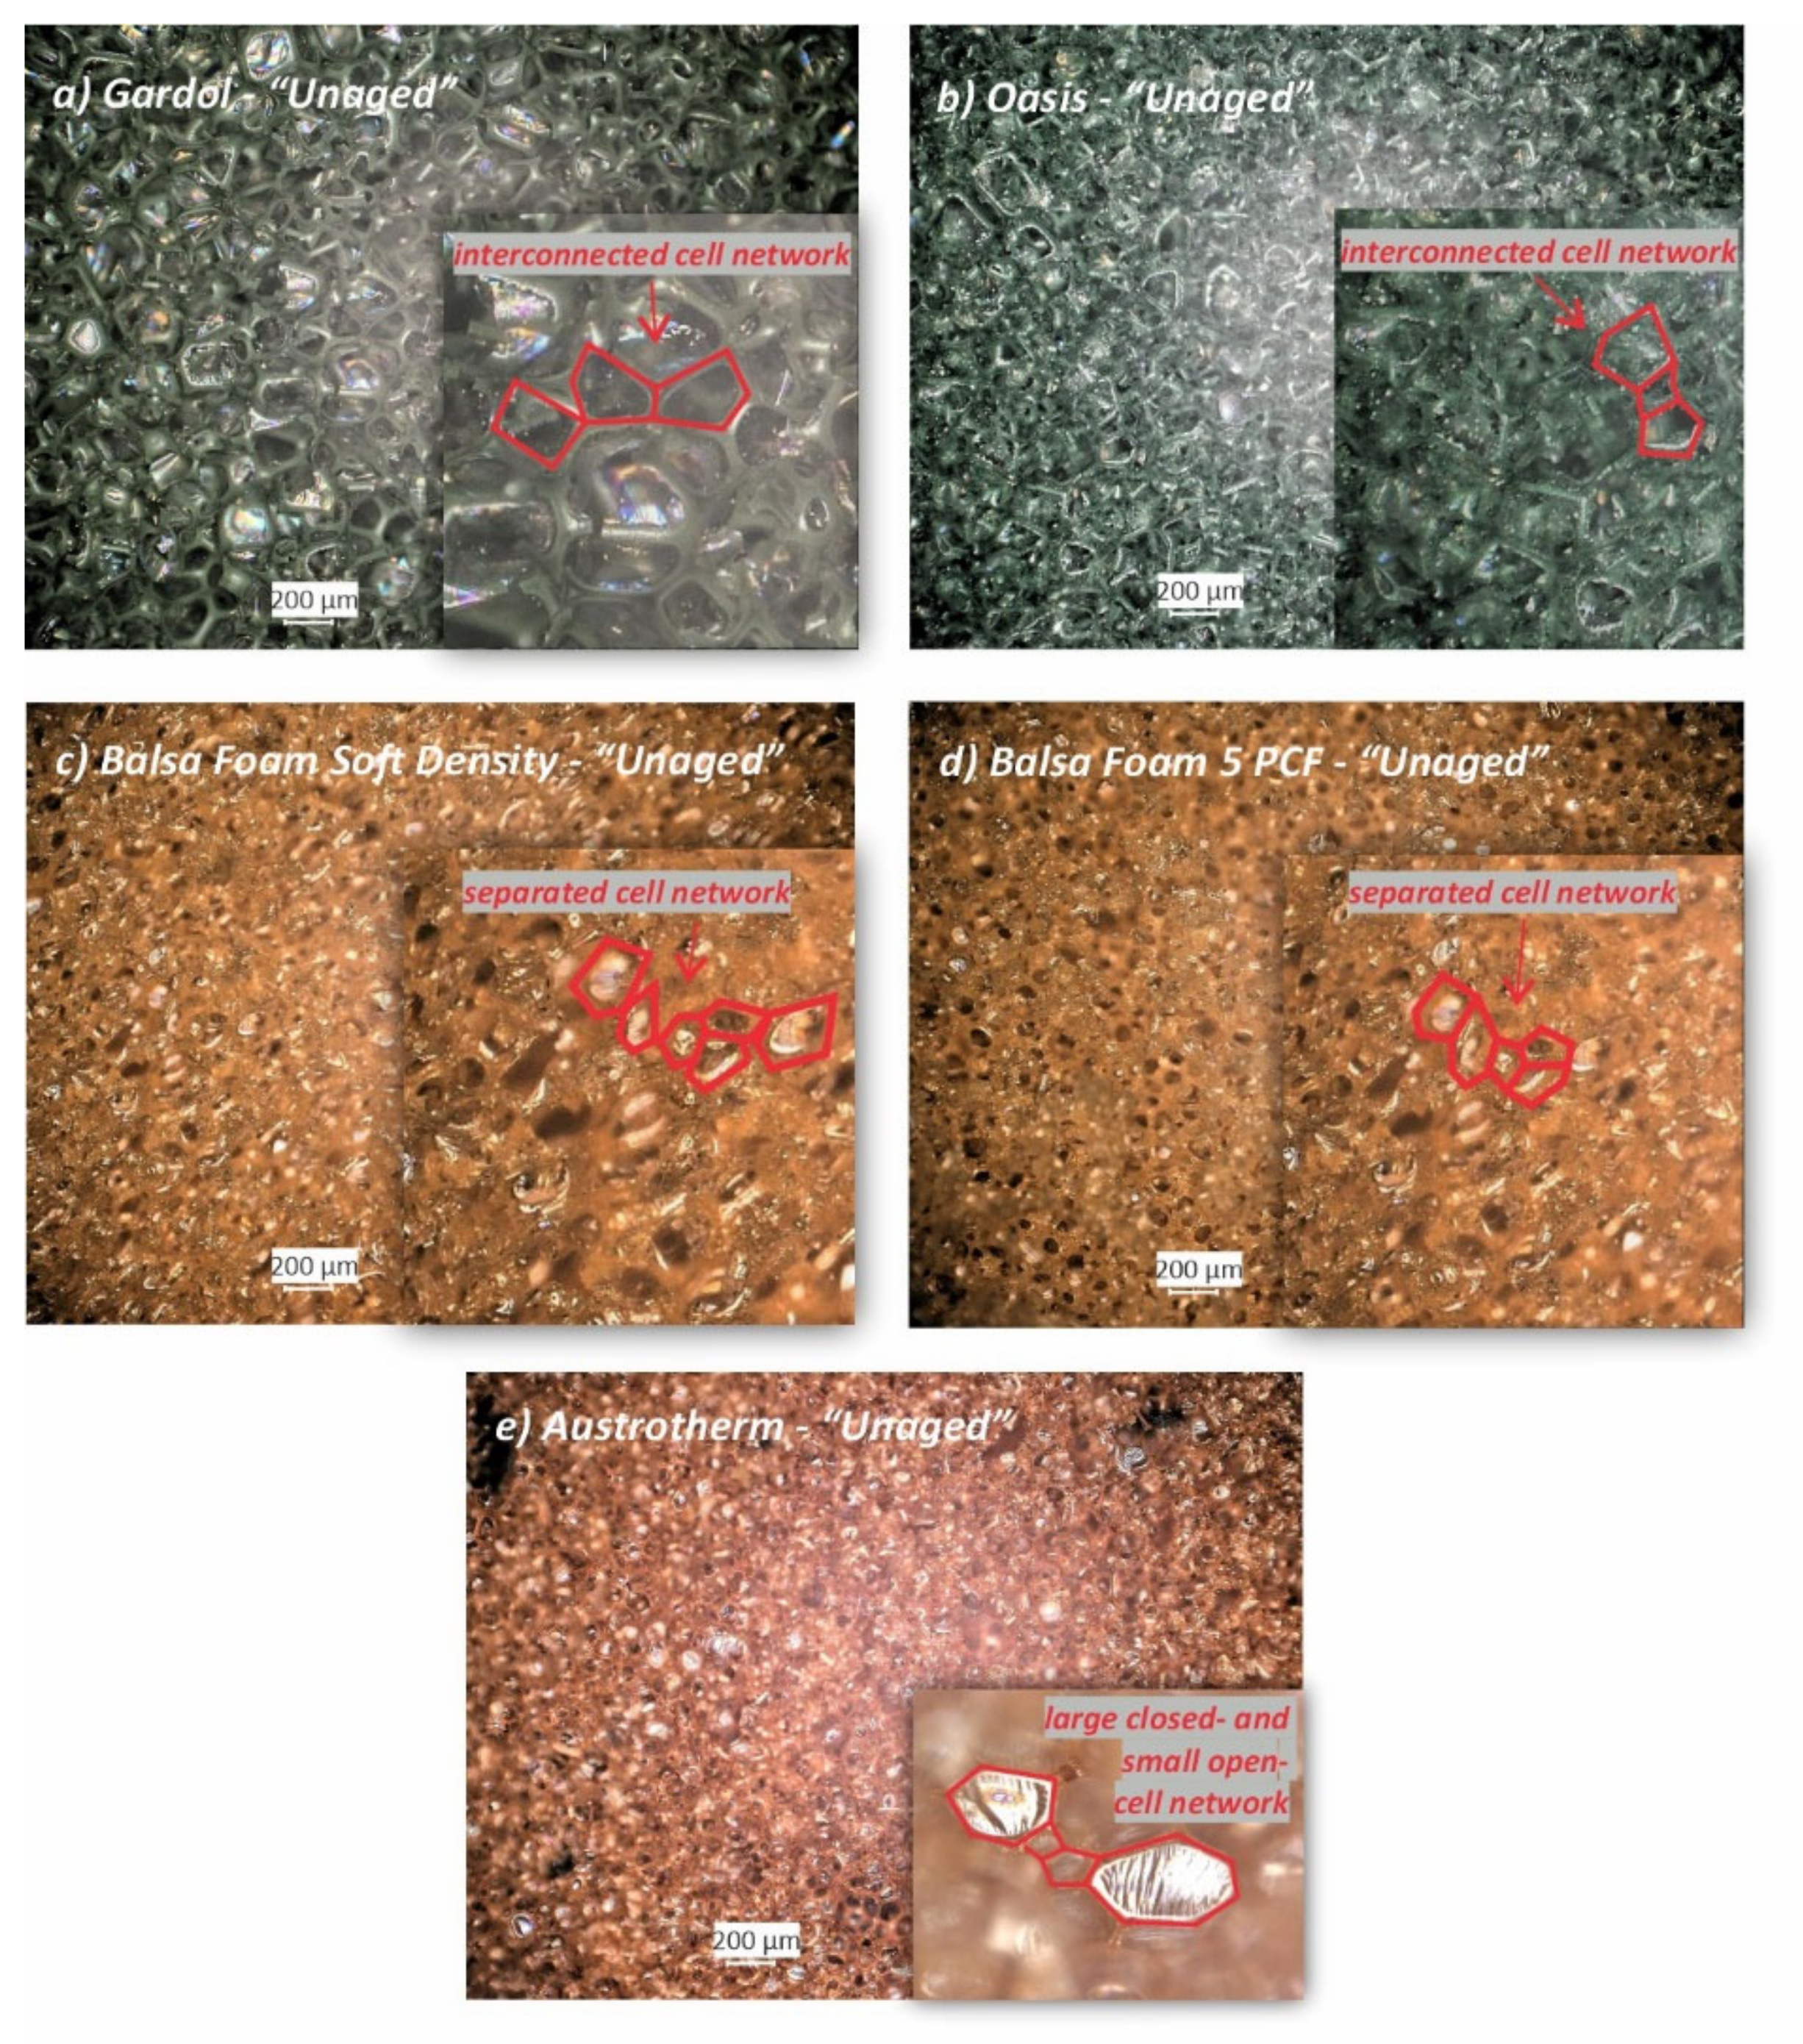
3.1.1. “Unaged” Open- and Closed-Cell PF Foams
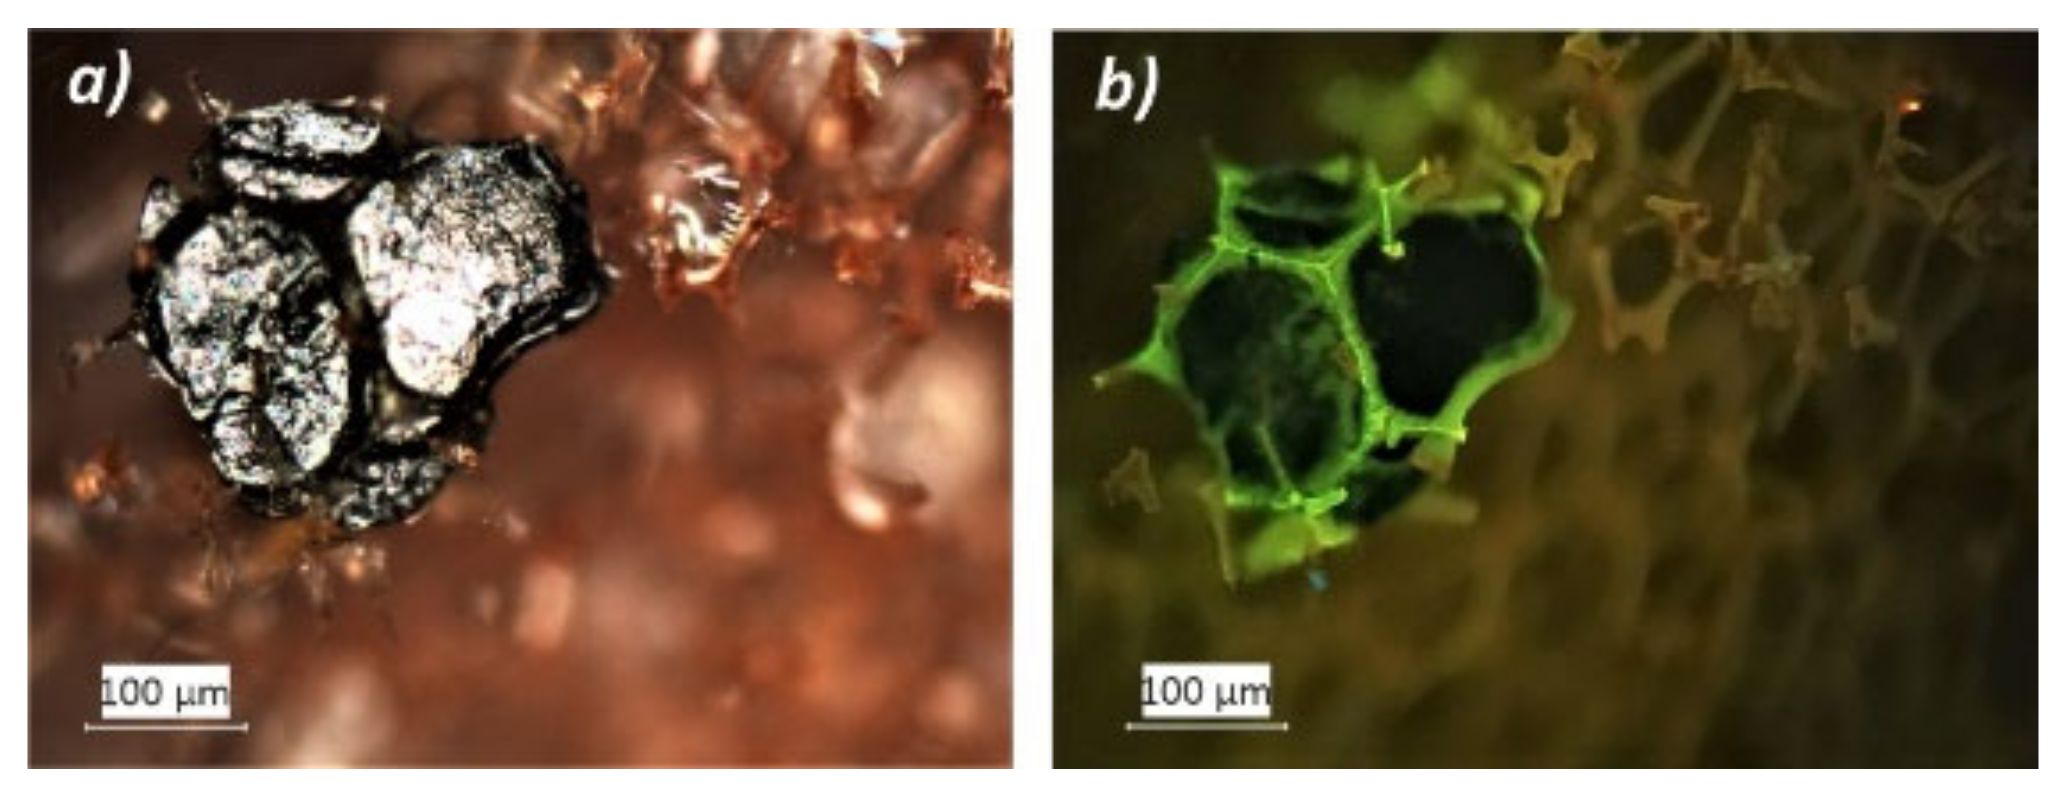
3.1.2. Naturally Aged Open- and Closed-Cell PF Foams
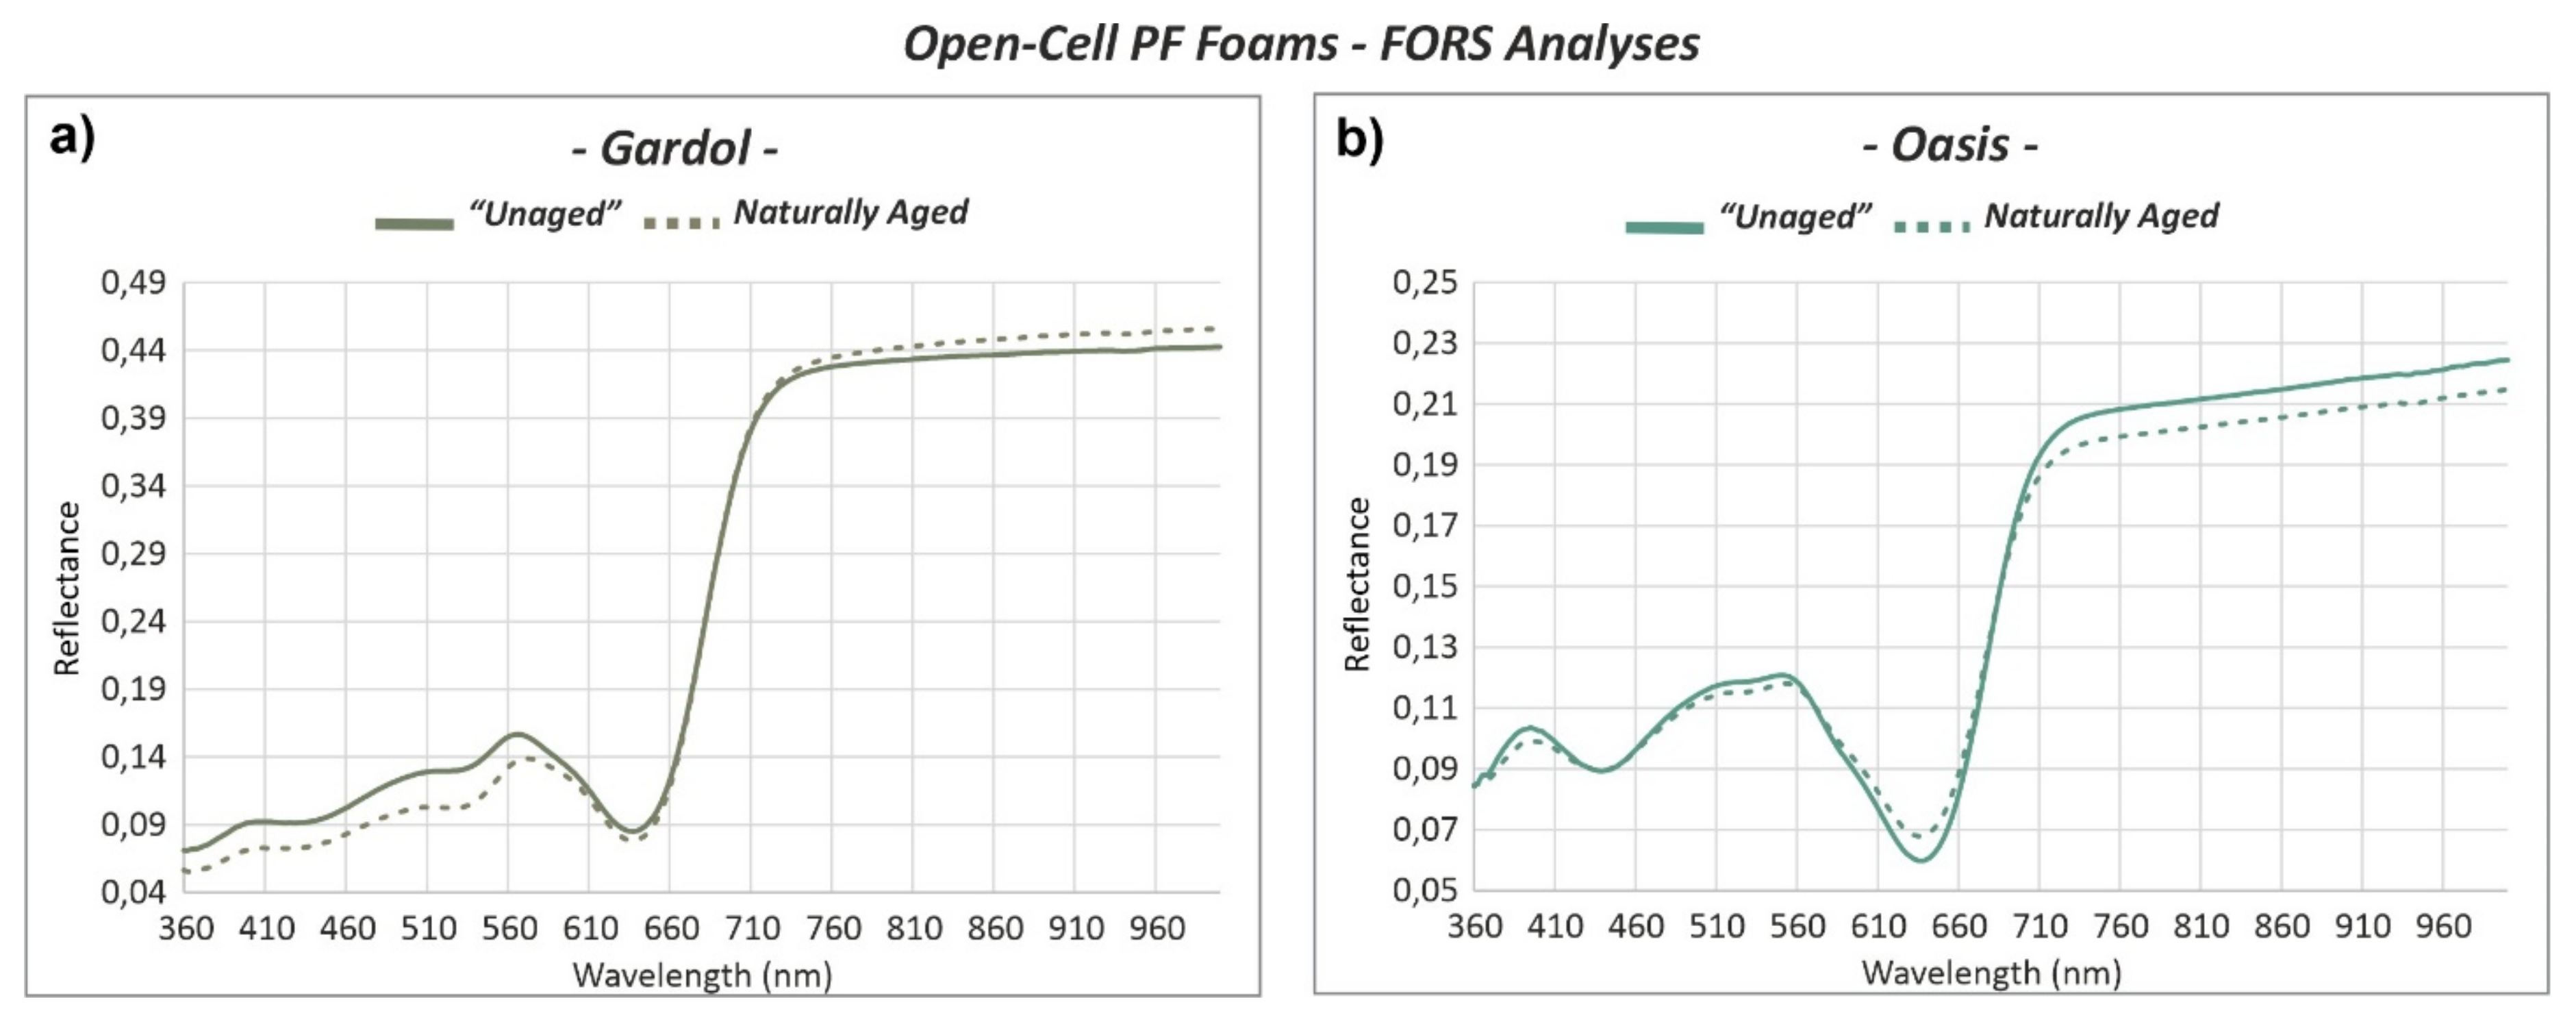
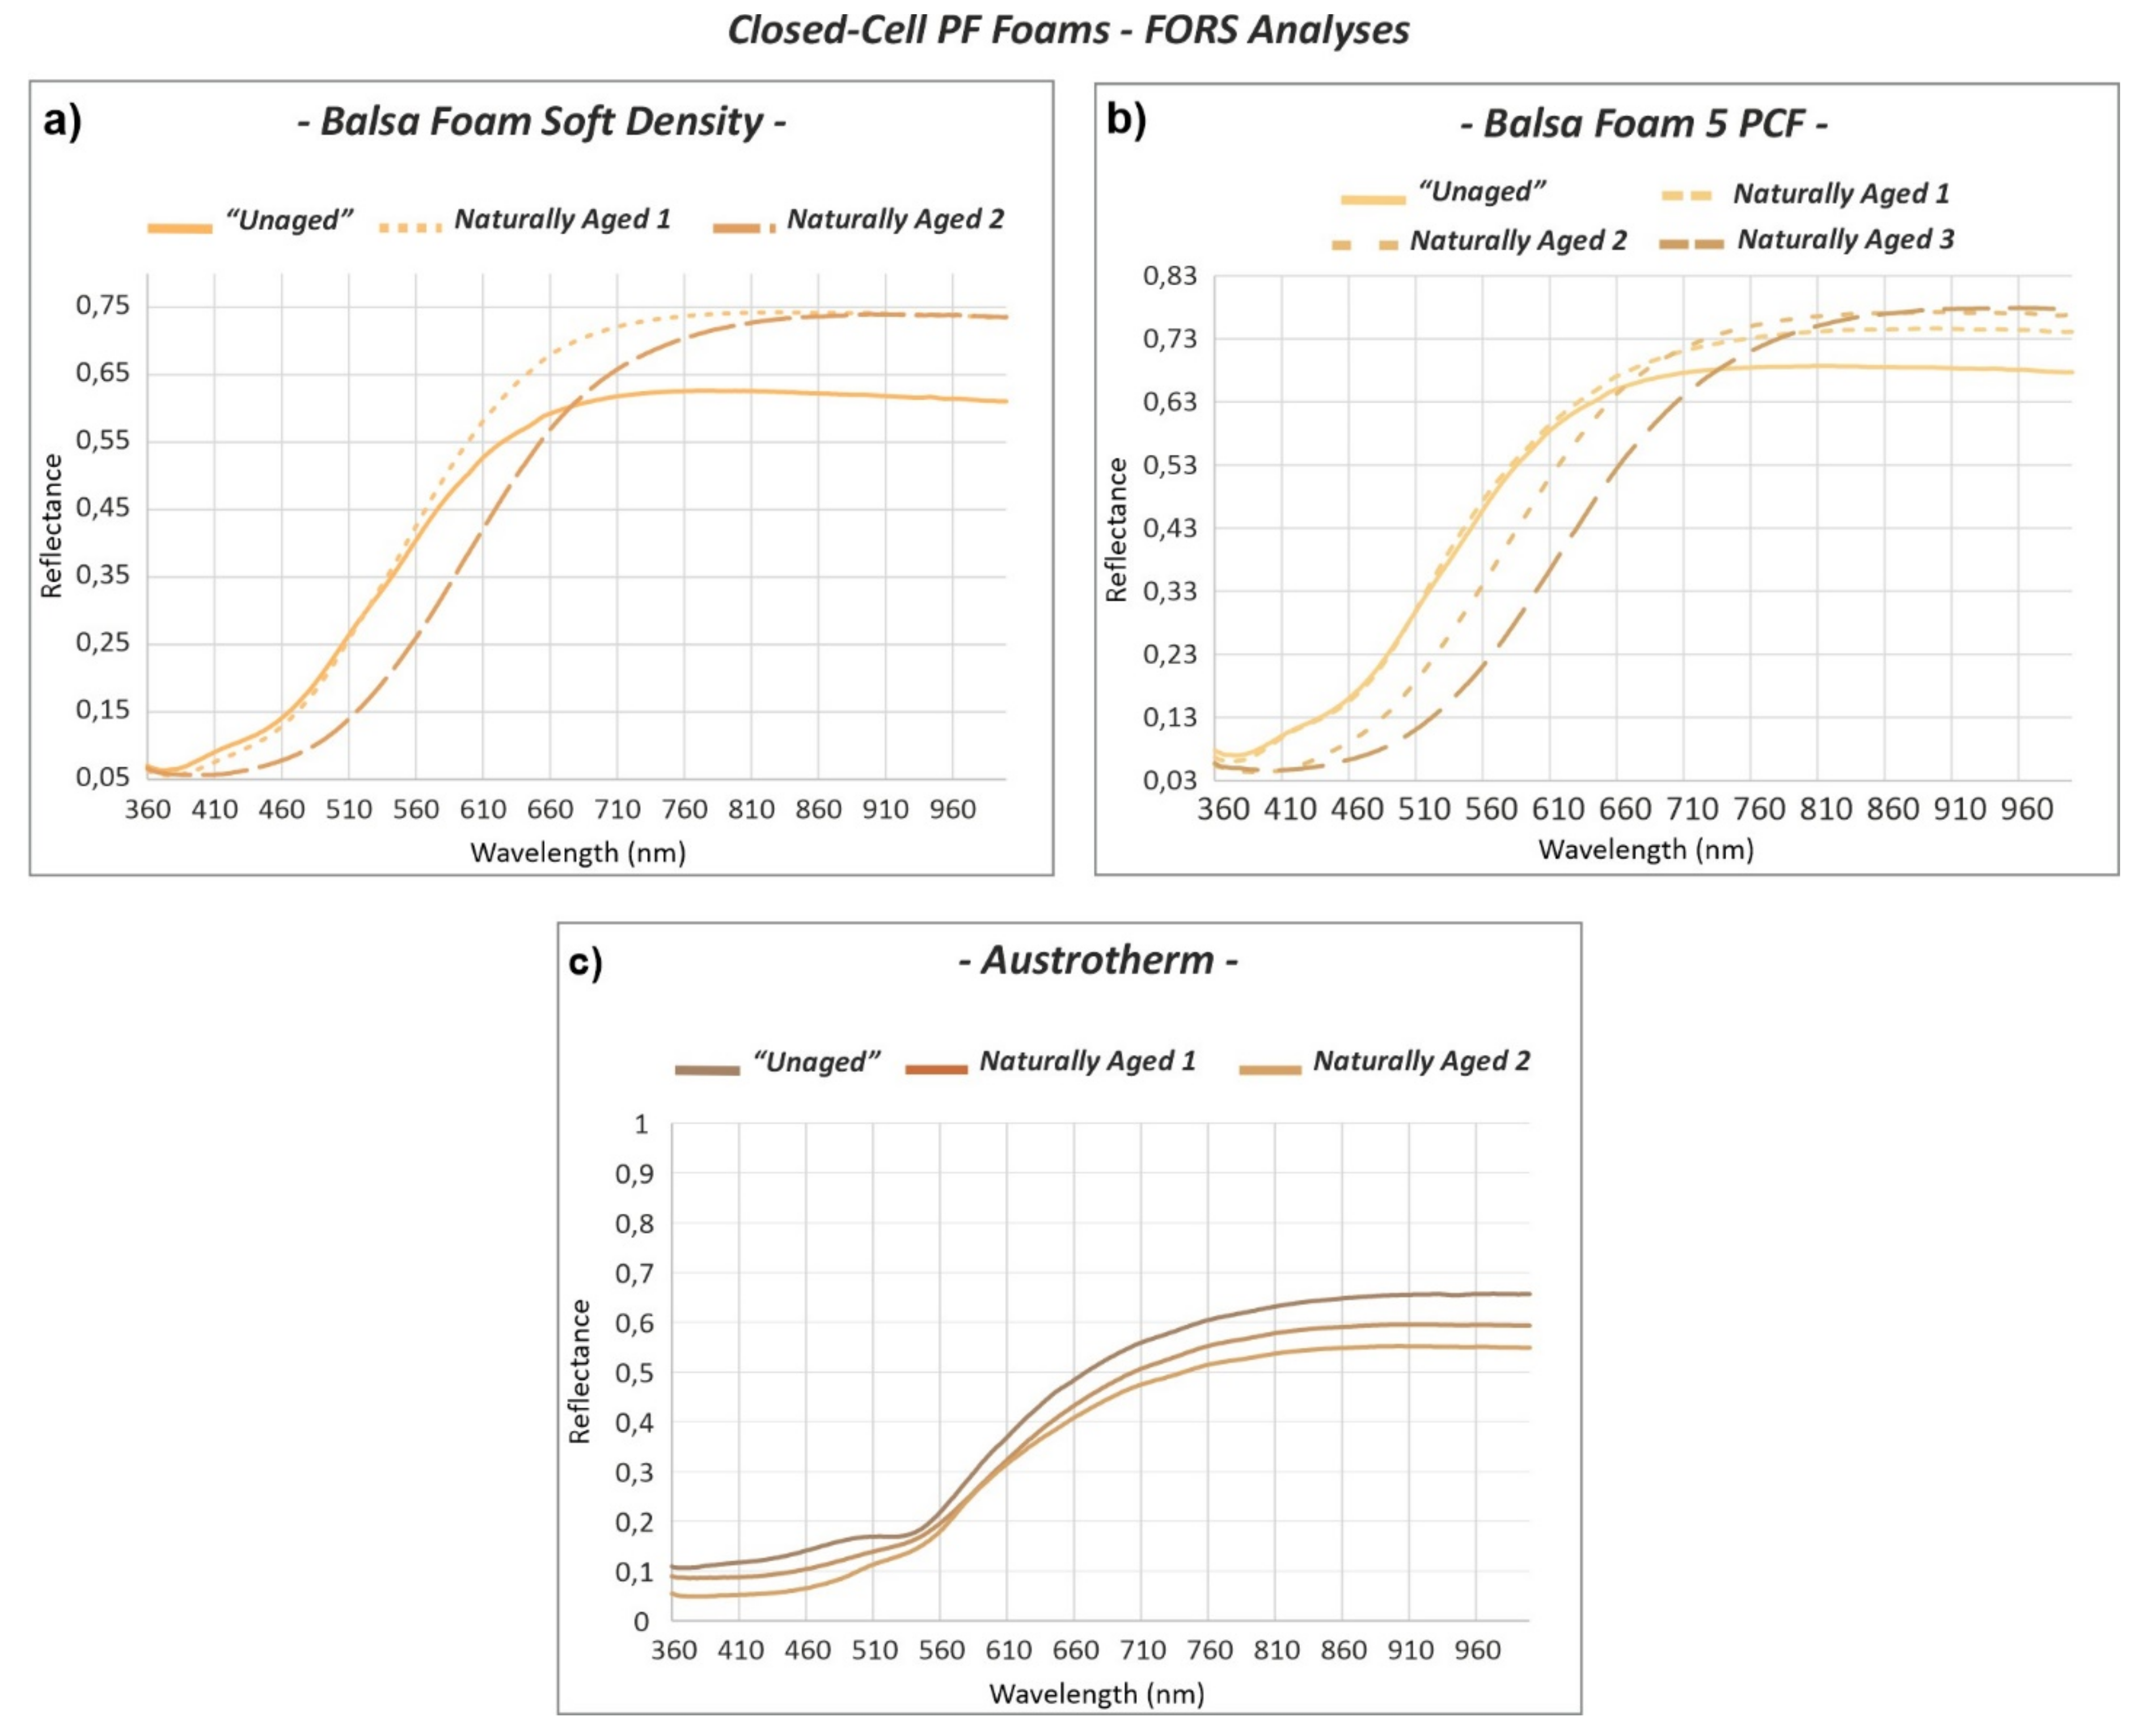
3.2. Fiber Optics Reflectance Spectroscopy (FORS)
3.2.1. “Unaged” Open- and Closed-Cell PF Foams
3.2.2. Naturally Aged Open- and Closed-Cell PF Foams
3.3. Micro-Fourier Transform Infrared (μ-FTIR) Spectroscopy
3.3.1. “Unaged” Open- and Closed-Cell PF Foams
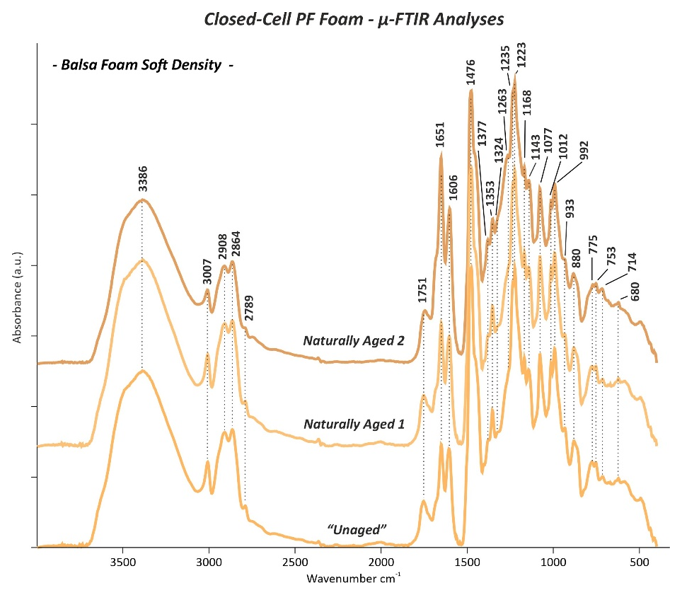
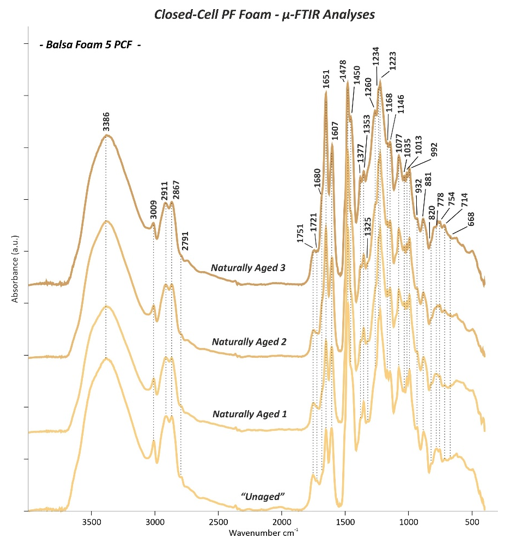
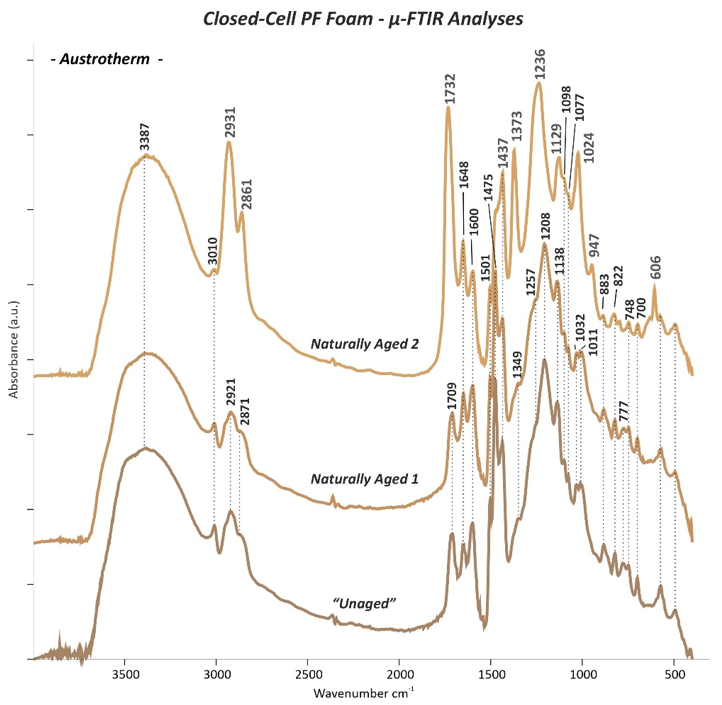
3.3.2. Naturally Aged Open- and Closed-Cell PF Foams
3.4. pH Measurements
4. Conclusions
Author Contributions
Funding
Institutional Review Board Statement
Informed Consent Statement
Data Availability Statement
Acknowledgments
Conflicts of Interest
References
- Lei, S.; Guo, Q.; Zhang, D.; Shi, J.; Liu, L.; Wei, X. Preparation and properties of the phenolic foams with controllable nanometer pore structure. J. Appl. Polym. Sci. 2010, 117, 3545–3550. [Google Scholar] [CrossRef]
- Li, W.; Lin, Q.; Yan, M.; Zou, Y. Reducing the contents of free phenol and formaldehyde in phenolic foam. J. Appl. Polym. Sci. 2003, 90, 2333–2336. [Google Scholar] [CrossRef]
- Landrock, A.H. Handbook of Plastic Foams: Types, Properties, Manufacture, and Applications, 1st ed.; Noyes Publications: Park Ridge, NJ, USA, 1995; ISBN 978-0-8155-1357-5. [Google Scholar]
- Tiroux, J.; Weisselfels, F. Color-Stabilized Phenolic Foams. U.S. Patent 4,369,259, 18 January 1983. [Google Scholar]
- Pilato, L. Phenolic Resins: A Century of Progress, 1st ed.; Springer: Berlin/Heidelberg, Germany, 2010. [Google Scholar]
- Mougel, C.; Garnier, T.; Cassagnau, P.; Sintes-Zydowicz, N. Phenolic foams: A review of mechanical properties, fire resistance and new trends in phenol substitution. Polymer 2019, 164, 86–117. [Google Scholar] [CrossRef]
- Rude, T. Testing phenol formaldehyde composite insulation material for conservation purposes. CeROArt 2017. [Google Scholar] [CrossRef]
- Bobrowski, A.; Grabowska, B. Ftir method in studies of the resol type phenol resin structure in the air atmosphere in some time intervals. Met. Foundry Eng. 2015, 41, 107. [Google Scholar] [CrossRef] [Green Version]
- Radler, S.L. Method for Making a Closed-Cell Phenolic Resin Foam, Foamable Composition, and Closed-Cell Phenolic Resin Foam. U.S. Patent 6,013,689, 11 January 2000. [Google Scholar]
- Coppock, V.; Zeggelaar, R.; Takahashi, H.; Kato, T. Phenolic Foam. U.S. Patent 8765829B2, 8 July 2014. [Google Scholar]
- ICOM Committee of Conservation. Modern Materials Conservation; ICOM Committee of Conservation: Paris, France, 2001; Available online: http://www.icom-cc.org/54/document/newsletter-number-4-august-2001/?id=279#.YMW3hbQzbOQ (accessed on 1 June 2021).
- Conley, R.T. Oxidative degradation of phenol–formaldehyde polycondensation initial degradation reactions. J. Appl. Polym. Sci. 1965, 9, 1117–1126. [Google Scholar] [CrossRef]
- Conley, R.T.; Bieron, J.F. A study of the oxidative degradation of phenol-formaldehyde polycondensates using infrared spectroscopy. J. Appl. Polym. Sci. 1963, 7, 103–117. [Google Scholar] [CrossRef]
- Jackson, W.M.; Conley, R.T. High temperature oxidative degradation of phenol–formaldehyde polycondensates. J. Appl. Polym. Sci. 1964, 8, 2163–2193. [Google Scholar] [CrossRef]
- Conley, R.T.; Bieron, J.F. A kinetic study of the oxidative degradation of phenol-formaldehyde polycondensates using infrared spectroscopy. J. Appl. Polym. Sci. 1963, 7, 171–180. [Google Scholar] [CrossRef]
- Lochte, H.W.; Strauss, E.L.; Conley, R.T. The thermo-oxidative degradation of phenol–formaldehyde polycondensates: Thermogravimetric and elemental composition studies of char formation. J. Appl. Polym. Sci. 1965, 9, 2799–2810. [Google Scholar] [CrossRef]
- Chen, G.; Liu, J.; Zhang, W.; Han, Y.; Zhang, D.; Li, J.; Zhang, S. Lignin-Based Phenolic Foam Reinforced by Poplar Fiber and Isocyanate-Terminated Polyurethane Prepolymer. Polymers 2021, 13, 1068. [Google Scholar] [CrossRef] [PubMed]
- Sandhya, P.K.; Sreekala, M.S.; Boudenne, A.; Garnier, B.; Rouxel, D.; Padmanabhan, M.; Kalarikkal, N.; Thomas, S. Thermal and electrical properties of phenol formaldehyde foams reinforcing with reduced graphene oxide. Polym. Compos. 2020, 1–11. [Google Scholar] [CrossRef]
- McKeen, L.W. Introduction to the Effect of Heat Aging on Plastics. In The Effect of Long Term Thermal Exposure on Plastics and Elastomers; Elsevier BV: Amsterdam, The Netherlands, 2014; pp. 17–24. [Google Scholar] [CrossRef]
- Aeshi, S. Siliconkautschuk und Blumensteckschaum als Werkstoff: Entwicklung einer Erhaltungsstrategie zu Modell: Zwischendeck (1995) von Dorothee Golz. Diploma Thesis, Academy of Fine Arts Vienna, Vienna, Austria, 2019. [Google Scholar]
- Herold, L. Unbeachtetes Material? Phenol-Formaldehydharz-Hartschaum Konsolidierung und Ergänzung an dem Kunstwerk ohne Titel (1971) von Loys Egg. Diploma Thesis, Academy of Fine Arts Vienna, Vienna, Austria, 2019. [Google Scholar]
- Pintus, V.; Pfenninger-Lepage, M.; Herold, L.; Aeschi, S.; Jansen, L.; Kaltenbruner, G. What about phenolic-foam based artworks in modern and contemporary art? Challenges in the conservation-restoration and towards the un-derstanding of the stability. In Proceedings of the FUTURE TALKS 019—Surfaces, Munich, Germany, 11–13 November 2019. [Google Scholar]
- Mahy, M.; Van Eycken, L.; Oosterlinck, A. Evaluation of uniform color spaces developed after the adoption of CIELAB and CIELUV. Color Res. Appl. 1994, 19, 105–121. [Google Scholar] [CrossRef]
- Holopainen, T.; Alvila, L.; Rainio, J.; Pakkanen, T.T. IR spectroscopy as a quantitative and predictive analysis method of phenol-formaldehyde resol resins. J. Appl. Polym. Sci. 1998, 69, 2175–2185. [Google Scholar] [CrossRef]
- Poljanšek, I.; Šebenik, U.; Krajnc, M. Characterization of phenol-urea-formaldehyde resin by inline FTIR spectroscopy. J. Appl. Polym. Sci. 2005, 99, 2016–2028. [Google Scholar] [CrossRef]
- Erä, V.A.; Salo, H.; Kaps, T.; Lindberg, J.J. Determination of Phenol/Formaldehyde Molar Ratio of Resol Resins by Infrared Spectroscopy. Angew. Makromol. Chem. 1975, 48, 185–187. [Google Scholar] [CrossRef]
- Chen, Y.; Chen, Z.; Xiao, S.; Liu, H. A novel thermal degradation mechanism of phenol–formaldehyde type resins. Thermochim. Acta 2008, 476, 39–43. [Google Scholar] [CrossRef]
- Ebewele, R.O.; River, B.H.; Koutsky, J.A. Relationship between phenolic adhesive chemistry and adhesive joint performance: Effect of filler type on fraction energy. J. Appl. Polym. Sci. 1986, 31, 2275–2302. [Google Scholar] [CrossRef]
- Liu, J.; Chen, R.-Q.; Xu, Y.-Z.; Wang, C.-P.; Chu, F.-X. Resorcinol in high solid phenol−formaldehyde resins for foams production. J. Appl. Polym. Sci. 2017, 134, 1–11. [Google Scholar] [CrossRef]
- Costa, L.; di Montelera, L.; Camino, G.; Weil, E.; Pearce, E. Structure-charring relationship in phenol-formaldehyde type resins. Polym. Degrad. Stab. 1997, 56, 23–35. [Google Scholar] [CrossRef]
- Manfredi, L.; de la Osa, O.; Fernández, N.G.; Vázquez, A. Structure–properties relationship for resols with different formaldehyde/phenol molar ratio. Polymer 1999, 40, 3867–3875. [Google Scholar] [CrossRef]
- Asaro, L.; Manfredi, L.; Pellice, S.; Procaccini, R.; Rodriguez, E. Innovative ablative fire resistant composites based on phenolic resins modified with mesoporous silica particles. Polym. Degrad. Stab. 2017, 144, 7–16. [Google Scholar] [CrossRef] [Green Version]
- Roczniak, K.; Biernacka, T.; Skarżyński, M. Some properties and chemical structure of phenolic resins and their derivatives. J. Appl. Polym. Sci. 1983, 28, 531–542. [Google Scholar] [CrossRef]
- Yu, Y.; Wang, Y.; Xu, P.; Chang, J. Preparation and Characterization of Phenolic Foam Modified with Bio-Oil. Materials 2018, 11, 2228. [Google Scholar] [CrossRef] [PubMed] [Green Version]
- Olga, G.; Styliani, C.; Ioannis, R.G. Coencapsulation of Ferulic and Gallic acid in hp-b-cyclodextrin. Food Chem. 2015, 185, 33–40. [Google Scholar] [CrossRef]
- Trick, K.A.; Saliba, T.E. Mechanisms of the pyrolysis of phenolic resin in a carbon/phenolic composite. Carbon 1995, 33, 1509–1515. [Google Scholar] [CrossRef]
- Gottwald, W.; Wachter, G. IR-Spektroskopie für Anwender; Wiley-VCH Verlag GmbH: Weinheim, Germany, 1997. [Google Scholar]
- Abbas, O.; Compère, G.; Larondelle, Y.; Pompeu, D.; Rogez, H.; Baeten, V. Phenolic compound explorer: A mid-infrared spectroscopy database. Vib. Spectrosc. 2017, 92, 111–118. [Google Scholar] [CrossRef]
- The infra-red absorption bands associated with the COOH and COOD groups in dimeric carboxylic acids. I. The region from 1500 to 500 cm−1. Math. Phys. Sci. 1953, 216, 247–266.
- Wei, S.; Pintus, V.; Schreiner, M. Photochemical degradation study of polyvinyl acetate paints used in artworks by Py–GC/MS. J. Anal. Appl. Pyrolysis 2012, 97, 158–163. [Google Scholar] [CrossRef] [PubMed] [Green Version]
- Rajendran, S.; Bama, V.S.; Prabhu, M.R. Effect of lithium salt concentration in PVAc/PMMA-based gel polymer electrolytes. Ionics 2009, 16, 27–32. [Google Scholar] [CrossRef]
- D’Amelia, R.P.; Gentile, S.; Nirode, W.F.; Huang, L. Quantitative Analysis of Copolymers and Blends of Polyvinyl Acetate (PVAc) Using Fourier Transform Infrared Spectroscopy (FTIR) and Elemental Analysis (EA). World J. Chem. Educ. 2016, 4, 25–31. [Google Scholar] [CrossRef]
- Ahmed, R.M. Study on Different Solution-Cast Films of PMMA and PVAc. Int. J. Polym. Mater. 2008, 57, 969–978. [Google Scholar] [CrossRef]
- Doménech-Carbó, M.T.; Silva, M.F.; Aura-Castro, E.; Fuster-López, L.; Kröner, S.; Martínez-Bazán, M.L.; Más-Barberá, X.; Mecklenburg, M.F.; Osete-Cortina, L.; Doménech, A.; et al. Study of behaviour on simulated daylight ageing of artists’ acrylic and poly(vinyl acetate) paint films. Anal. Bioanal. Chem. 2010, 399, 2921–2937. [Google Scholar] [CrossRef] [PubMed]


| Structure Cell Type | Commercial Name | Application | Color | Cell Diameter (µm) | Cell Struts Thickness (µm) | Cell Shape | General Observations after Natural Ageing | ||||
|---|---|---|---|---|---|---|---|---|---|---|---|
| Min | Max | Average | Min | Max | Average | ||||||
| Open-cell | Gardol | floral arrangments | 86 | 272 | 181 | 16 | 39 | 28 | polygonal from 4 to 6 sides (mainly 5) | cell walls rupture | |
| Oasis | 109 | 224 | 180 | 13 | 22 | 18 | pentagonal (few with 2 sides shorter) | elongations of cells | |||
| Closed-cell | Balsa Foam Soft Density | sculpting | 100 | 158 | 129 | 16 | 27 | 23 | hexagonal | browning/elongation of two sides cells/cell walls rupture/brittle cell struts | |
| Balsa Foam 5 PCF | 78 | 130 | 97 | 14 | 30 | 21 | hexagonal | browning/cell walls rupture/brittle cell struts | |||
| Austrotherm | thermal insulation | 61 | 122 | 88 | 7 | 16 | 11 | polygonal from 4 to 7 sides | Browning/brittle cell struts | ||
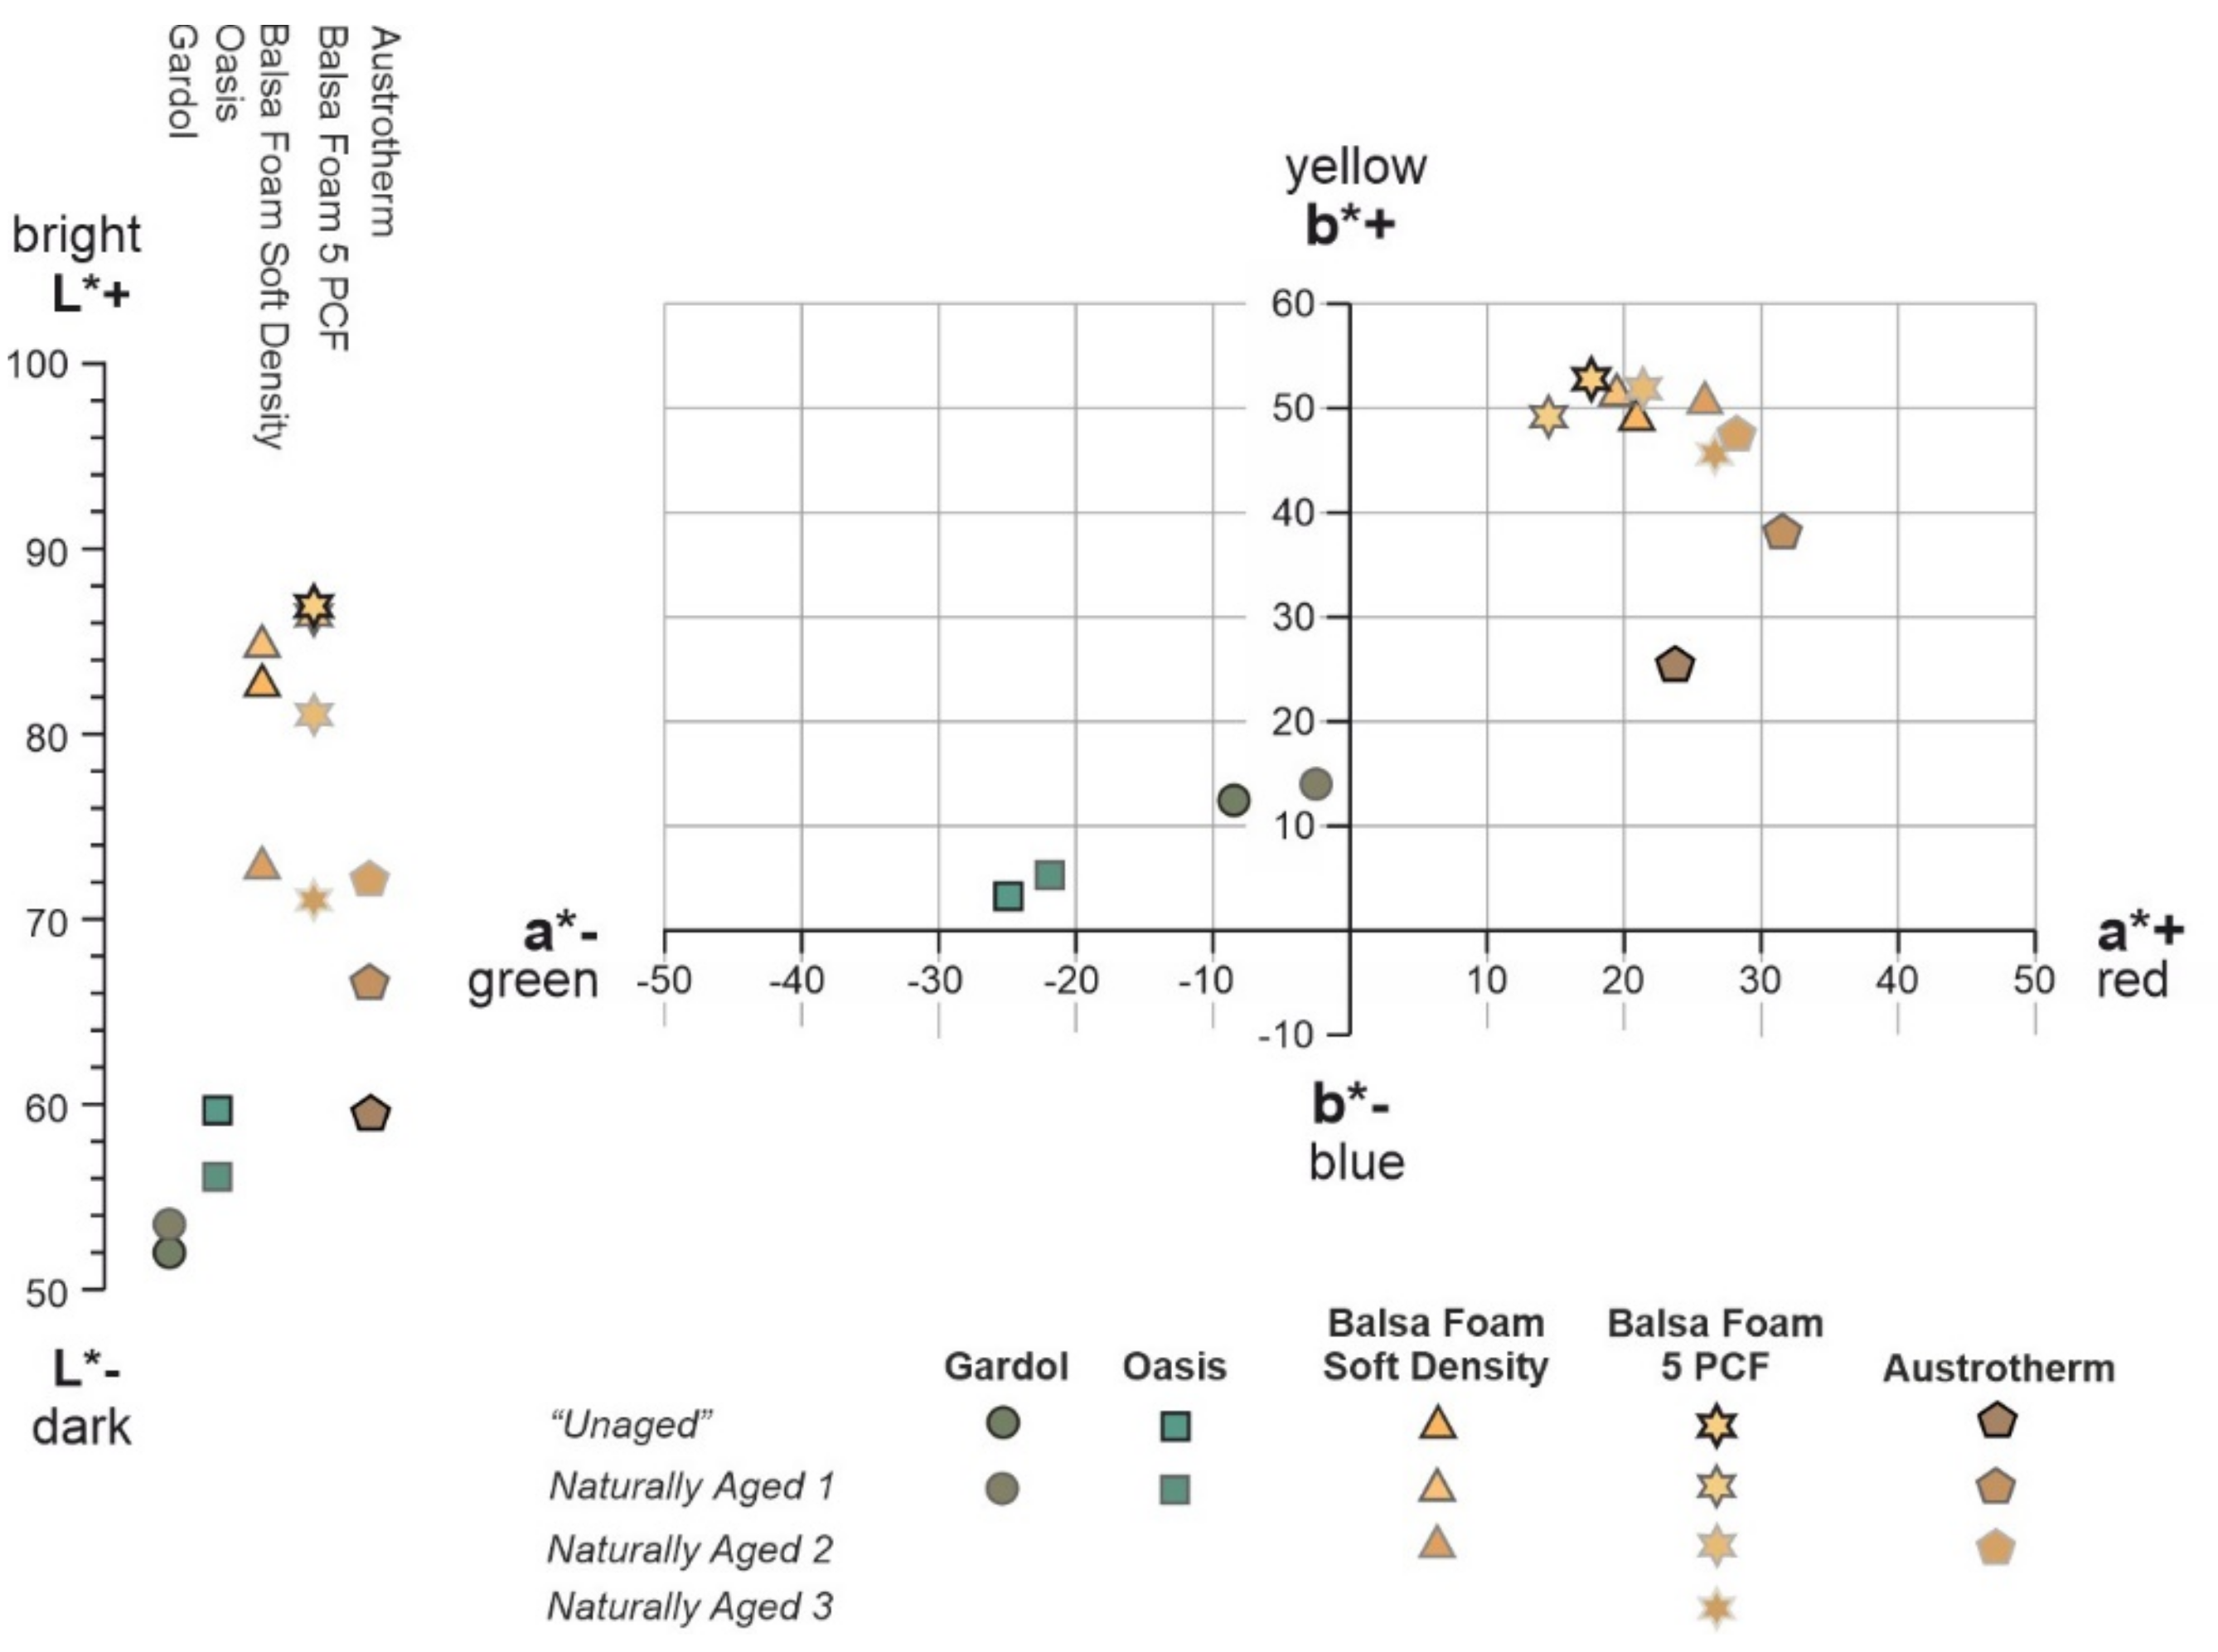
| Structure Cell Type | Samples | Color | CIELab Color Coordinates | CIELab Color Shifts | Total Color Change | |||||
|---|---|---|---|---|---|---|---|---|---|---|
| L* | a* | b* | ∆L* | ∆a* | ∆b* | ∆E*1976 | ||||
| Open-cell | Gardol | “Unaged” | 52.4 | −8.0 | 12.3 | 1.1 | 5.6 | 1.9 | 6.0 | |
| Natually Aged | 53.5 | −2.4 | 14.2 | |||||||
| Oasis | “Unaged” | 59.2 | −25.5 | 3.0 | −2.3 | 3.3 | 1.7 | 4.4 | ||
| Natually Aged | 56.9 | −22.2 | 4.7 | |||||||
| Closed-cell | Balsa Foam Soft Density | “Unaged” | 82.4 | 20.6 | 49.8 | 2.1 | −1.6 | 1.1 | 2.9 | |
| Naturally Aged 1 | 84.5 | 19.0 | 50.9 | |||||||
| Naturally Aged 2 | 73.6 | 26.3 | 49.3 | −10.9 | 7.3 | −1.6 | 13.2 | |||
| Balsa Foam 5 PCF | “Unaged” | 86.8 | 17.3 | 51.1 | −0.6 | −1.9 | −2.1 | 2.9 | ||
| Naturally Aged 1 | 86.2 | 15.4 | 49.0 | |||||||
| Naturally Aged 2 | 80.3 | 21.2 | 50.1 | −5.9 | 5.8 | 1.1 | 8.3 | |||
| Naturally Aged 3 | 70.5 | 26.4 | 45.9 | −9.8 | 5.2 | −4.2 | 11.9 | |||
| Austrotherm | “Unaged” | 59.1 | 23.2 | 25.0 | 7.1 | 7.4 | 14.8 | 18.0 | ||
| Naturally Aged 1 | 66.2 | 30.6 | 39.8 | |||||||
| Naturally Aged 2 | 72.1 | 28.5 | 47.1 | 5.9 | -2.1 | 7.3 | 9.6 | |||
| PF Foams | |||||||
|---|---|---|---|---|---|---|---|
| Open-Cell | Closed-Cell | ||||||
| Bond Type | Gardol | Oasis | Balsa Foam Soft Density | Balsa Foam 5 PCF | Austrotherm | Lit. Data Range [5,8,13,24,25,26,27,28,29,30,31,32,33,34,35,36,37,38,39] | Lit. Compound Type Assignment |
| Wavenumber cm−1 | |||||||
| O–H stretching | 3374 | 3348 | 3386 | 3386 | 3387 | 3389–3100 | Phenolic O–H [5,8,24,25,26,27,28] and methylol OH [5,24,26,29] |
| C–H stretching | 3009 | 3014 | 3007 | 3009 | 3010 | 3300–3010 | Phenolic ring C–H [5,24,27,28] |
| 2921; 2868 | 2924; 2855 | 2908; 2864 | 2911; 2867 | 2921; 2871 | 2953–2800 | Methylene group –CH2– [5,24,25,27,28] | |
| O | O | 2789 | 2791 | O | 2724 | CH2 groups of formaldehyde (–CHO) [25] | |
| C=O stretching and C–C stretching | 1742.000 | O | 1751.000 | 1751.000 | O | 1755–1735 | Arlyl carboxylic acid [35,38]/Tetra–substituted benzene ring C–C stretching [27,36] |
| C=O stretching | O | O | 1722 (shoulder) | 1721 | O | 1720 | Hydroxy acids COOH [13] |
| O | O | O | O | 1709 | 1704 | (Phenolic) C=O [34] | |
| O | O | 1685 (shoulder) | O | O | 1660–1690 | Quinoid structures [13] | |
| 1650 | O | 1651 | 1651 | 1653; 1648 | 1643 | Formaldehyde monomer residue [8]/benzophenone by oxidation of methylene groups [13,27]/(Phenolic) C=O [34] | |
| C=C stretching | 1606 | 1606; 1594; 1558; 1504 | 1606; 1503 (weak shoulder) | 1607; 1503 (weak shoulder) | 1600; 1501 | 1633–1500 | Phenolic ring C=C [5,8,24,25,26,28,29] |
| C–H bending and C=C stretching | 1478 | 1478 | 1476 | 1478 | 1475 | 1480–1473 | Scissor bending vibration of CH2 (o–p’ ) [31,32,33] |
| 1447 | 1442 | 1450 (shoulder) | 1450 (shoulder) | 1451 (weak shoulder) | 1456–1450 | Scissor bending vibration of CH2 (p–p’) [31,32,33] and C=C aromatic ring [28,29] | |
| O | O | O | O | 1436 | 1437 | Aliphatic CH3 [27] | |
| O–H in plane bending and C–H bending | O | O | 1377 | 1377 | O | 1378–1370 | Phenolic O–H groups [5,24,25] /C–H deformation vibration of aliphatic hydrocarbons [27] / O–H in plane bending of carboxylic acids [39] |
| 1354 | 1353 | 1353 | 1353 | 1349 | 1360 –1340 | Phenolic O–H groups [5,8,24,25,26,28] / C–H deformation vibration of aliphatic hydrocarbons [27] | |
| C–H bending (overtone) | 1326 | O | 1324 | 1326 | O | CH2 groups | |
| C–O stretching | O | O | 1260 (shoulder) | 1260 (shoulder) | 1257 (shoulder) | 1270–1260 | Biphenyl ether C–O [28] / alkyl–phenol C–O [30] / carboxylic acids C–O [39] |
| 1223 | 1210 | 1235; 1223 | 1234; 1223 | 1208 | 1240–1210 | Phenolic C–O [5,24,25,26,27,28,30] and ether bond [29] | |
| C–H bending andC–O stretching | 1167 | O | 1168 | 1168 | O | 1175–1160 | Aromatic C–H in plane deformation [5,24,28] |
| 1146 | 1151 | 1143 | 1146 | 1138 | 1153–1147 | Aromatic C–H in plane deformation [26,28] and dimethylerne ether C–O–C– bridges [29] | |
| 1064 | 1124; 1102 (shoulders) | 1077 | 1077 | 1098; 1077 | 1120–1060 | Aromatic C–H in plane deformation [5,8,24,28] and dimethylene ether C–O–C [5,26,27] | |
| C–O stretching | 1031; 1006 | 1029; 1005 | 1012 | 1035; 1013 | 1032; 1011 | 1058–1010 | Alcoholic C–O (methylol groups) [5,24,25,26,27,28,29] |
| C–H bending | O | O | 992 | 992 | O | 997–960 | Phenol with trisubstitution at 1,2,4 positions [25,28] / =C–H def. of aryl and/or a,b–unsaturated carboxylic acid [38] |
| O | O | 933 | 932 | O | 950–920 | C–O–C ether alyphatic or aromatic C–O–O–C peroxide [32]; O–H out of plane of carboxylic acids [39] | |
| 884 | 885 | 880 | 881 | 883 | 890–875 | Phenol with tri–substitution at 1,2,4 positions (o,p) [5,13] and tetra–substitution at 1,2,4,6 positions (o,o',p) [5,24,25,26,28,30] | |
| 818 | 828 | 822 | 820 | 822 | 826–814 | Phenol with di–substitutions at 1,4 positions (p) [5,24,25,26,28,30] and tri–substitution at 1,2,4 positions (o,p) [13] | |
| 779 | O | 775 | 778 | 777 | 790–780 | Phenol with tri–substituions at 1,2,6 positions (o,o') [5,24,28] | |
| 759 | 767 | 753 | 754 | 748 | 760 –756 | Phenol with di–substituions at 1,2 positions (o) [5,24,25,28,31] and tri–substituions at 1,2,6 positions [30,31] | |
| O | O | 714 | 714 | O | – | CH2 rocking [32] | |
| 685 | 695 | 680 | 680 (shoulder) | 700 | 694–690 | Monosubstituted ring [5,24,25,28] | |
| Bond Type | Wavenumber (cm−1) | Change Type | Assignment |
|---|---|---|---|
| C=O stretching | 1751 | → shift to 1744 | changes in aryl carboxylic acids conformation |
| 1721 | ↑ increase | formation of hydroxy acids | |
| 1650 | ↑ increase | formation of benzophenone through oxidation of methylene bridges | |
| C–H bending | 1447; 1326 | ↓ decrease | decrease of methylene bridge through primary oxidation |
| O–H in plane bending | 1354 | ↓ decrease | slight reduction of phenolic O–H through secondary oxidation |
| C–H bending and C–O stretching | 1168–1064 | ↓ decrease | ether bridge oxidation andvariation of aromatic C–H conformation |
| C–O stretching | 1005–1035 | ↓ decrease | decrease of methylol groups |
| Structure Cell Type | Samples | Color | pH | |
|---|---|---|---|---|
| Open-cell | Gardol | “Unaged” | 2.8 ± 0.01 | |
| Natually Aged | 2.9 ± 0.06 | |||
| Oasis | Unaged | 2.8 ± 0.00 | ||
| Natually Aged | 2.9 ± 0.00 | |||
| Closed-cell | Balsa Foam Soft Density | “Unaged” | 3.8 ± 0.00 | |
| Naturally Aged 1 | 4.0 ± 0.06 | |||
| Naturally Aged 2 | 4.1 ± 0.06 | |||
| Balsa Foam 5 PCF | “Unaged” | 4.0 ± 0.00 | ||
| Naturally Aged 1 | 4.2 ± 0.00 | |||
| Naturally Aged 2 | 4.3 ± 0.00 | |||
| Naturally Aged 3 | 4.4 ± 0.00 | |||
| Austrotherm | “Unaged” | 3.0 ± 0.06 | ||
| Naturally Aged 1 | 3.0 ± 0.00 | |||
| Naturally Aged 2 | 3.1 ± 0.01 | |||
Publisher’s Note: MDPI stays neutral with regard to jurisdictional claims in published maps and institutional affiliations. |
© 2021 by the authors. Licensee MDPI, Basel, Switzerland. This article is an open access article distributed under the terms and conditions of the Creative Commons Attribution (CC BY) license (https://creativecommons.org/licenses/by/4.0/).
Share and Cite
Pintus, V.; Piccolo, A.; Vetter, W.; Moretto, L.M.; Sterflinger, K.; Schreiner, M. What about Phenol Formaldehyde (PF) Foam in Modern-Contemporary Art? Insights into the Unaged and Naturally Aged Material by a Multi-Analytical Approach. Polymers 2021, 13, 1964. https://doi.org/10.3390/polym13121964
Pintus V, Piccolo A, Vetter W, Moretto LM, Sterflinger K, Schreiner M. What about Phenol Formaldehyde (PF) Foam in Modern-Contemporary Art? Insights into the Unaged and Naturally Aged Material by a Multi-Analytical Approach. Polymers. 2021; 13(12):1964. https://doi.org/10.3390/polym13121964
Chicago/Turabian StylePintus, Valentina, Anna Piccolo, Wilfried Vetter, Ligia Maria Moretto, Katja Sterflinger, and Manfred Schreiner. 2021. "What about Phenol Formaldehyde (PF) Foam in Modern-Contemporary Art? Insights into the Unaged and Naturally Aged Material by a Multi-Analytical Approach" Polymers 13, no. 12: 1964. https://doi.org/10.3390/polym13121964