Article

MCM-41 Supported Co-Based Bimetallic Catalysts for Aqueous Phase Transformation of Glucose to Biochemicals

1
CATMAT Lab, Department of Molecular Sciences and Nanosystems, Ca’ Foscari University, Venice and INSTM-RUVe, 155 Via Torino, 30172 Venezia Mestre, Italy
2
Department of Chemistry, Sapienza University of Rome, 5 P.le A.Moro, 00185 Rome, Italy
3
Department of Industrial Chemistry, University of Bologna, 4 Viale del Risorgimento, 40136 Bologna, Italy
*
Author to whom correspondence should be addressed.
Processes 2020, 8(7), 843; https://doi.org/10.3390/pr8070843
Submission received: 22 June 2020 / Revised: 6 July 2020 / Accepted: 10 July 2020 / Published: 15 July 2020
(This article belongs to the Special Issue Metal Nanoparticles as Catalysts for Green Applications)

Abstract

:
The transformation of glucose into valuable biochemicals was carried out on different MCM-41-supported metallic and bimetallic (Co, Co-Fe, Co-Mn, Co-Mo) catalysts and under different reaction conditions (150 °C, 3 h; 200 °C, 0.5 h; 250 °C, 0.5 h). All catalysts were characterized using N2 physisorption, Temperature Programmed Reduction (TPR), Raman, X-ray Diffraction (XRD) and Temperature Programmed Desorption (TPD) techniques. According to the N2-physisorption results, a high surface area and mesoporous structure of the support were appropriate for metal dispersion, reactant diffusion and the formation of bioproducts. Reaction conditions, bimetals synergetic effects and the amount and strength of catalyst acid sites were the key factors affecting the catalytic activity and biochemical selectivity. Sever reaction conditions including high temperature and high catalyst acidity led to the formation mainly of solid humins. The NH3-TPD results demonstrated the alteration of acidity in different bimetallic catalysts. The 10Fe10CoSiO2 catalyst (MCM-41 supported 10 wt.%Fe, 10 wt.%Co) possessing weak acid sites displayed the best catalytic activity with the highest carbon balance and desired product selectivity in mild reaction condition. Valuable biochemicals such as fructose, levulinic acid, ethanol and hydroxyacetone were formed over this catalyst.

1. Introduction

The depletion of fossil fuels along with the environmental problems associated with their utilization promote new processes for the generation of fuels based on renewable sources [1]. The use of biomass, typically lignocellulosic biomass, in the production of fuels, fuel additives or added-value chemicals has attracted considerable interest, becoming a potential research area [2]. Biomass can be converted into biofuels and valuable chemicals via chemical or thermochemical processes; among them, aqueous phase reaction is an effective method to convert lignocellulose into biochemicals [3]. Lignocellulosic biomass is principally constituted of cellulose, hemicellulose and lignin [4,5]. Due to the complex nature of biomasses and their chemical compositions, they have different reactivities, and conversion processes can occur via various reaction pathways. Thus, researchers often prefer to use typical model components focusing on special reaction stages in order to study the conversion process [6,7]. Glucose, the most plentiful and approachable monosaccharide unit in the lignocellulosic biomass, is the most desirable feedstock for the production of valuable biochemicals [8]. One of the most significant reaction pathways is the isomerization of glucose to fructose, followed by dehydration of fructose to 5-hydroxymethylfurfural (5-HMF) and rehydration of 5-HMF to levulinic acid and formic acid [9]. Moreover, retro aldol condensation may occur with glucose, yielding glycolaldehyde and erythrose, or with fructose to give dihydroxyacetone and glyceraldehyde. Glyceraldehyde can be hydrogenated to glycerol or rearranged to lactic acid, which can be further hydrogenated with propionic acid or decarboxylated to yield ethanol. Another pathway involving C-O and C-C cleavage leads to acetic acid, which can be obtained from glycerol [10,11,12,13,14].
The competing reaction pathways happening through biomass conversion lead to different bioproducts with relatively low yields and difficulties in separation. It is important to underline one of the major drawbacks of working with sugars: the formation of humins, i.e., insoluble, heavy compounds that form under glucose transformation conditions. Therefore, catalysts and the reaction conditions play a crucial role in the control of reactions or the production of the desirable bioproduct, higher feedstock conversion and also in avoiding byproducts [15]. Compared to homogeneous catalysts, heterogeneous catalysts can be used in viable greener methods and approaches for efficient biomass transformation. High thermal and mechanical stability, recovery and recyclability are the main advantages of heterogenous catalysts [16]. In recent years, a wide variety of heterogeneous catalysts has been utilized for biomass transformation, such as carbon-based materials, mesoporous silica, zeolites, metal oxide supported metals, organic polymers and ionic liquids [17,18].
In particular, mesoporous silica materials such as SBA-15, KIT-6, and MCM-41 have been investigated as supports owing to their high surface area and large pore volume, flexible and tunable properties, and easy diffusion of large molecules, enabling efficient transformation [2,7,19]. For instance, Qing Xu et al. reported the effect of a Sn-containing silica mesoporous framework (Sn-MCM-41) on the conversion of glucose to 5-HMF in ionic liquid. The results showed that Sn can act as a highly active Lewis acid center in conjunction with the silanol group of MCM-41, which catalyzes both the isomerization of glucose into fructose and the dehydration of fructose to HMF without the addition of a mineral Brønsted acid catalyst [20]. Other authors reported the use of hybrid catalysts such as CrCl3 and HY zeolite for the production of lactic acid (LA) acid from glucose, with better performance compared to parent HY catalyst because of their higher acidity [21,22]. Cao Xuefei et al. used various transition metal sulfates (Mn2+, Fe2+, Fe3+, Co2+, Ni2+, Cu2+, and Zn2+) to achieve glucose, fructose and cellulose conversion into several chemicals; the authors pointed out that different metal salts showed different reactivities regarding the conversion of sugars. Among these metal ions, Zn2+ and Ni2+ were more selective towards LA, whereas Cu2+ and Fe3+ showed high levels of efficiency for the conversion of glucose and cellulose into LA and formic acid at high temperature [23].
Materials possessing high surface areas and large pore sizes with more accessible acidic moieties are crucial for catalyst preparation. To the best of our knowledge, no studies have reported the use of mesoporous-supported, bimetallic catalysts for the aqueous phase transformation of glucose into biochemicals. Furthermore, using metals such as Fe, Co, Mo and Mn, which are cheaper and more widely available, as the active phase may be interesting and of crucial importance.
Here, we report on four catalysts including, i.e., Co, Co-Mn, Co-Mo, and Co-Fe supported MCM-41 (hexagonal mesoporous silica) for the aqueous phase formation of valuable chemicals from glucose under different reaction conditions. The aim of this study is to benefit from the high surface area, large pore size and acidity of the silanol group in MCM-41 and the metal active phase in order to facilitate the penetration of substrates into the catalyst pores.

2. Experimental Part

2.1. Catalysts Synthesis

A silica mesoporous support (MCM-41) was synthesized following the procedure described by Ghedini et al. [24]. Hexadecyltrimethylammonium bromide (CTAB, Aldrich) was first dissolved in a NaOH aqueous solution at room temperature (r.t) under stirring; then, the required amount of tetraethyl orthosilicate (TEOS) was added. The resulting mixture was aged in an autoclave at 150 °C for 22 h, and thereafter filtrated, thoroughly washed and dried at room temperature. The surfactant was removed by calcination at 500 °C for 6 h in air flow (50 mL/min).
For the monometallic catalyst, the active phase was introduced on a silica support by incipient wetness impregnation using an aqueous solution of Co(NO3)2·6H2O in order to obtain 20 wt.% of metal loading.
For bimetallic samples, the precursors were introduced by co-impregnation of the previous Co solution and the corresponding precursors including (NH4)6Mo7O24.4H2O, MnSO4.H2O and Fe(NO3)3.9H2O) in order to obtain a nominal value of 10 wt% for each metal. Finally, the samples were dried and calcined at 500 °C in air flow (50 mL/min) for 6 h.
The catalysts were labelled: 20CoSiO2, 10Mo10CoSiO2, 10Mn10CoSiO2 and 10Fe10CoSiO2.

2.2. Catalysts Characterisation

2.2.1. Nitrogen Physisorption

Nitrogen physisorption measurements were performed at −196 °C using a Micromeritics Tristar II Plus sorptometer (MICROMERITICS, Norcross, GA, USA). The sample (~400 mg) was outgassed at 200 °C for 2 h in vacuum prior to the sorption experiment. The surface area was calculated using the BET equation [25], and the total pore volume, Vtot, was measured as the adsorbed amount of N2 at P/P0 values near 0.98. Pore size distribution was determined by the BJH method [26] applied to the N2 adsorption isotherm branch [27,28].

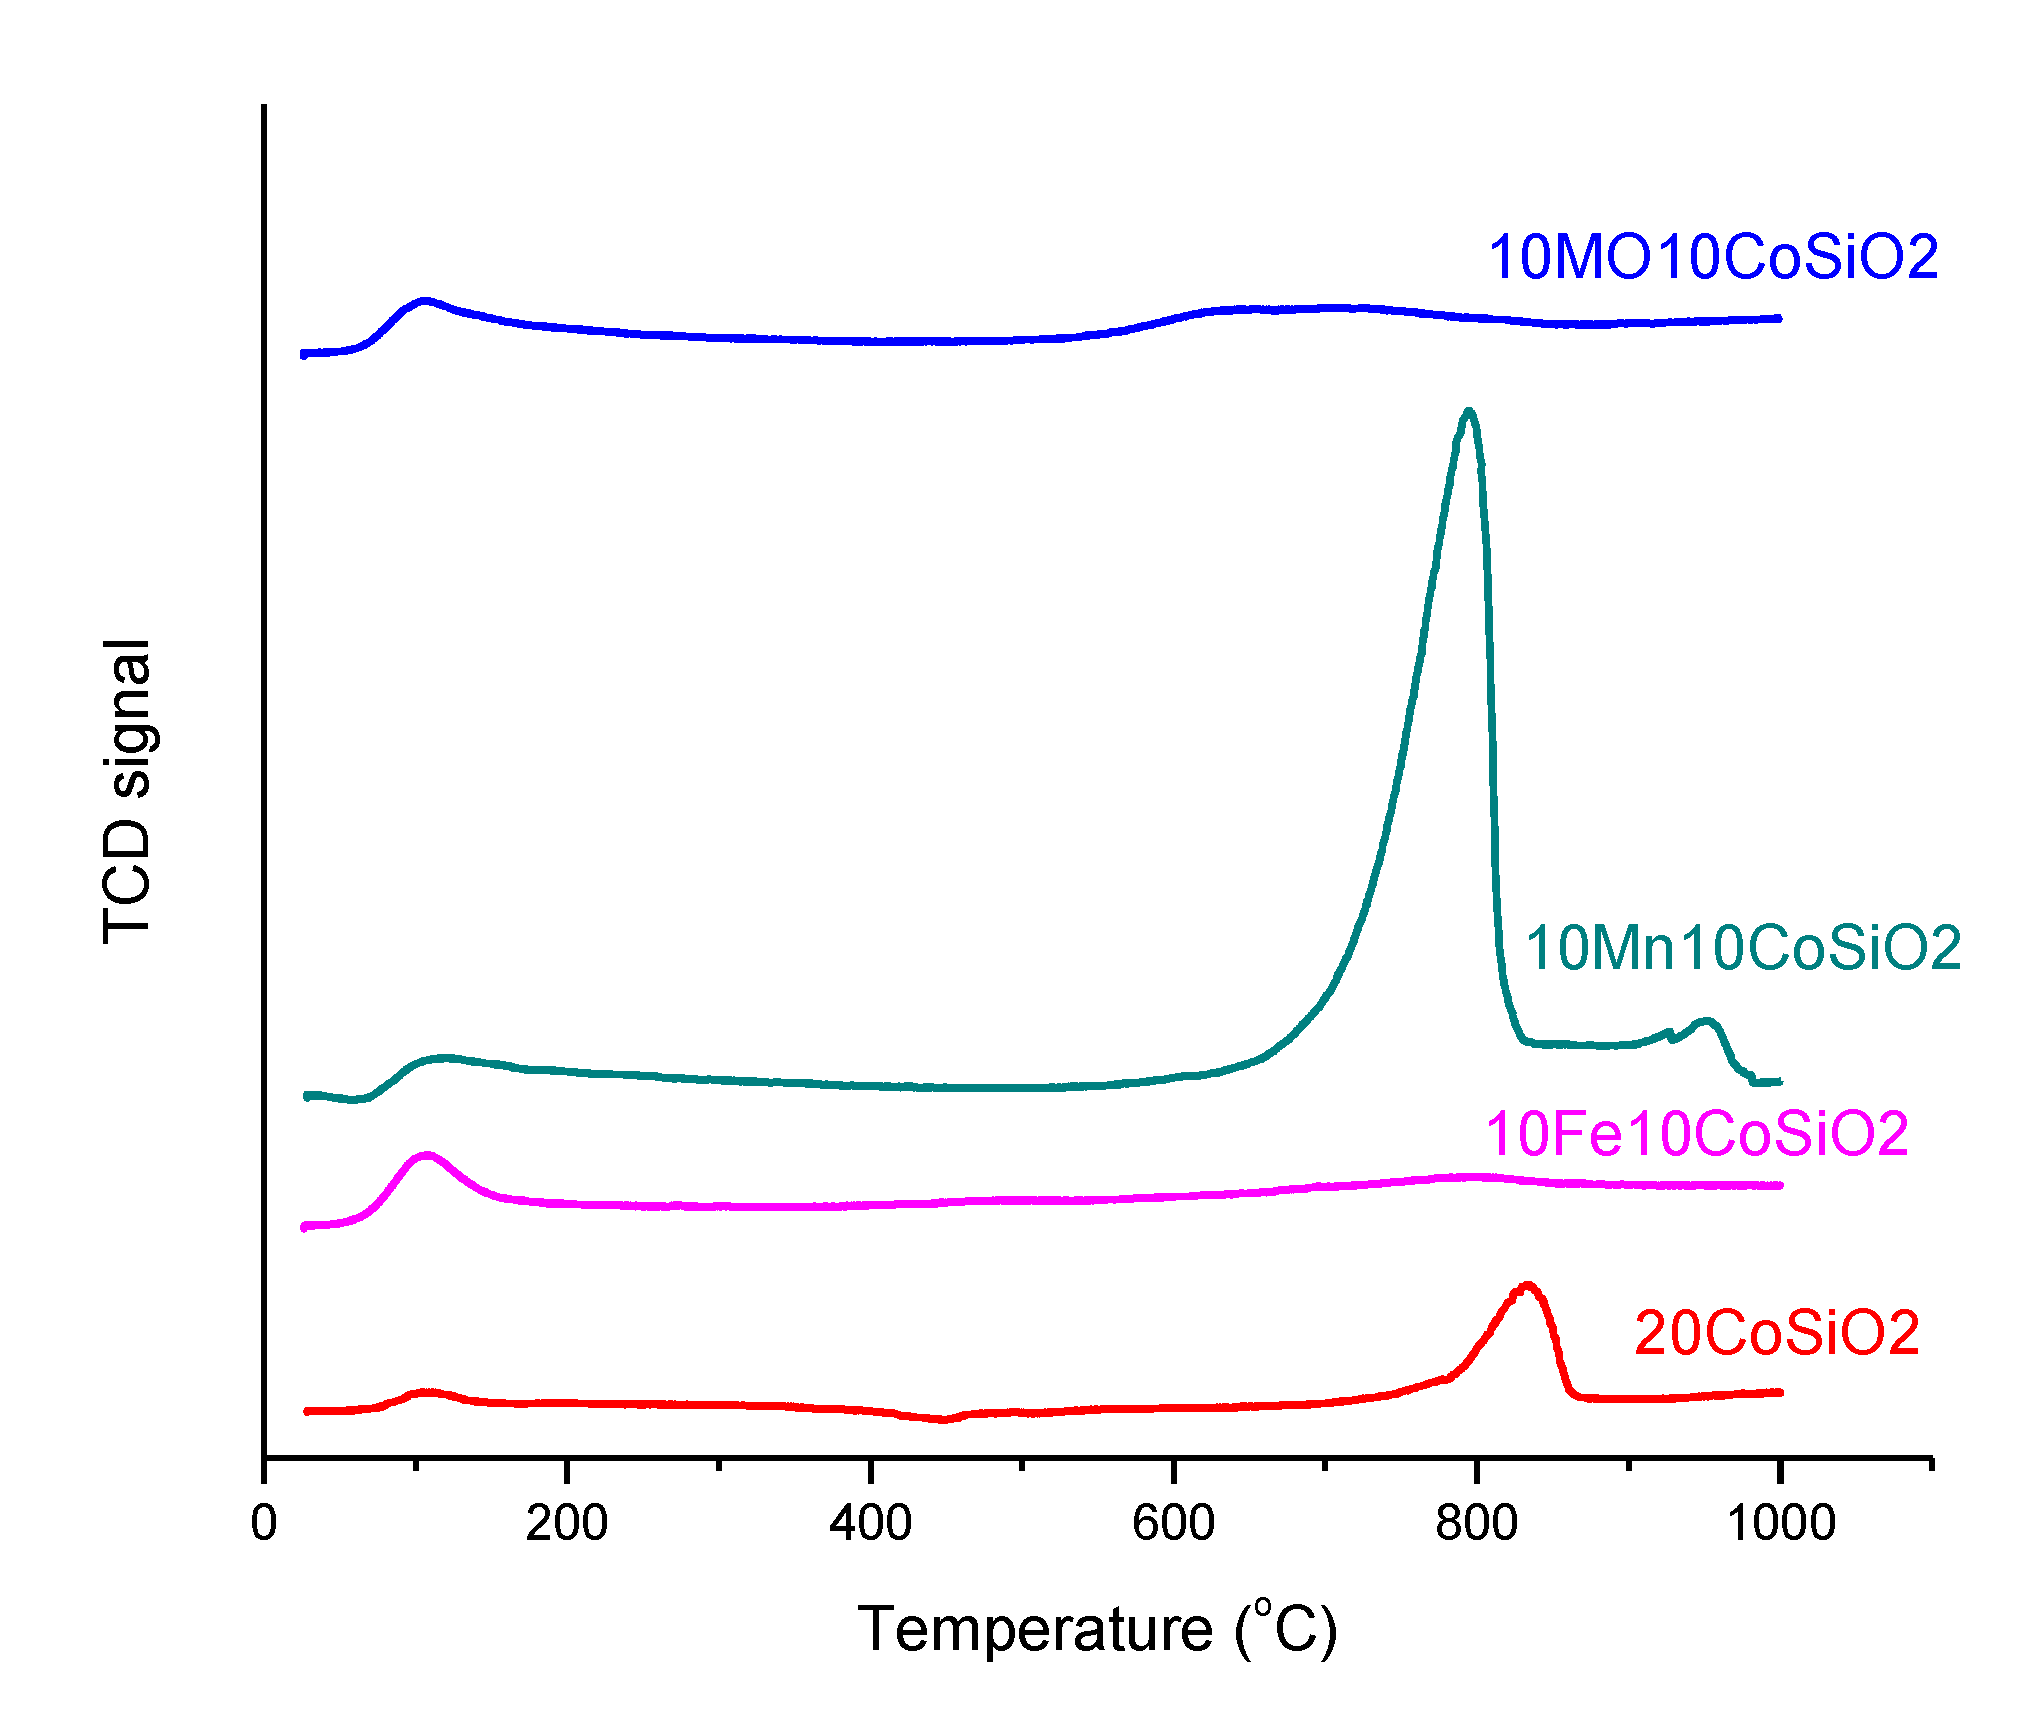
2.2.2. Temperature Programmed Reduction (TPR)

TPR measurements were carried out with a lab-made instrument at CATMAT laboratory, Ca’ Foscari University of Venice. The analysis was performed under 5% H2/Ar (40 mL/min) from 25 °C to 800 °C with a heating rate of 10 °C/min. The H2 consumption was analyzed by a Micrometrics TPD-TPR 2900 analyzer equipped with a TCD detector (Gow-Mac 24-550 TCD instrument CO, Bethlehem, PA, USA).

2.2.3. X-ray Powder Diffraction (XRD)

A XRD (PW1769, Philips Analytical, Eindhoven, The Netherlands) using Cu-Kα (Ni-filtered) radiation was used for crystalline phase determination. The measured 2θ angle range was 10.0°–70.0° with a step size of 0.02° and a counting time of 1.25 s per step. The size of the metal particle phase was obtained using the Scherrer equation [26]. The correction for instrument broadening was applied after background subtraction and curve-fitting procedures on the assumption of Lorentzian peak profiles.

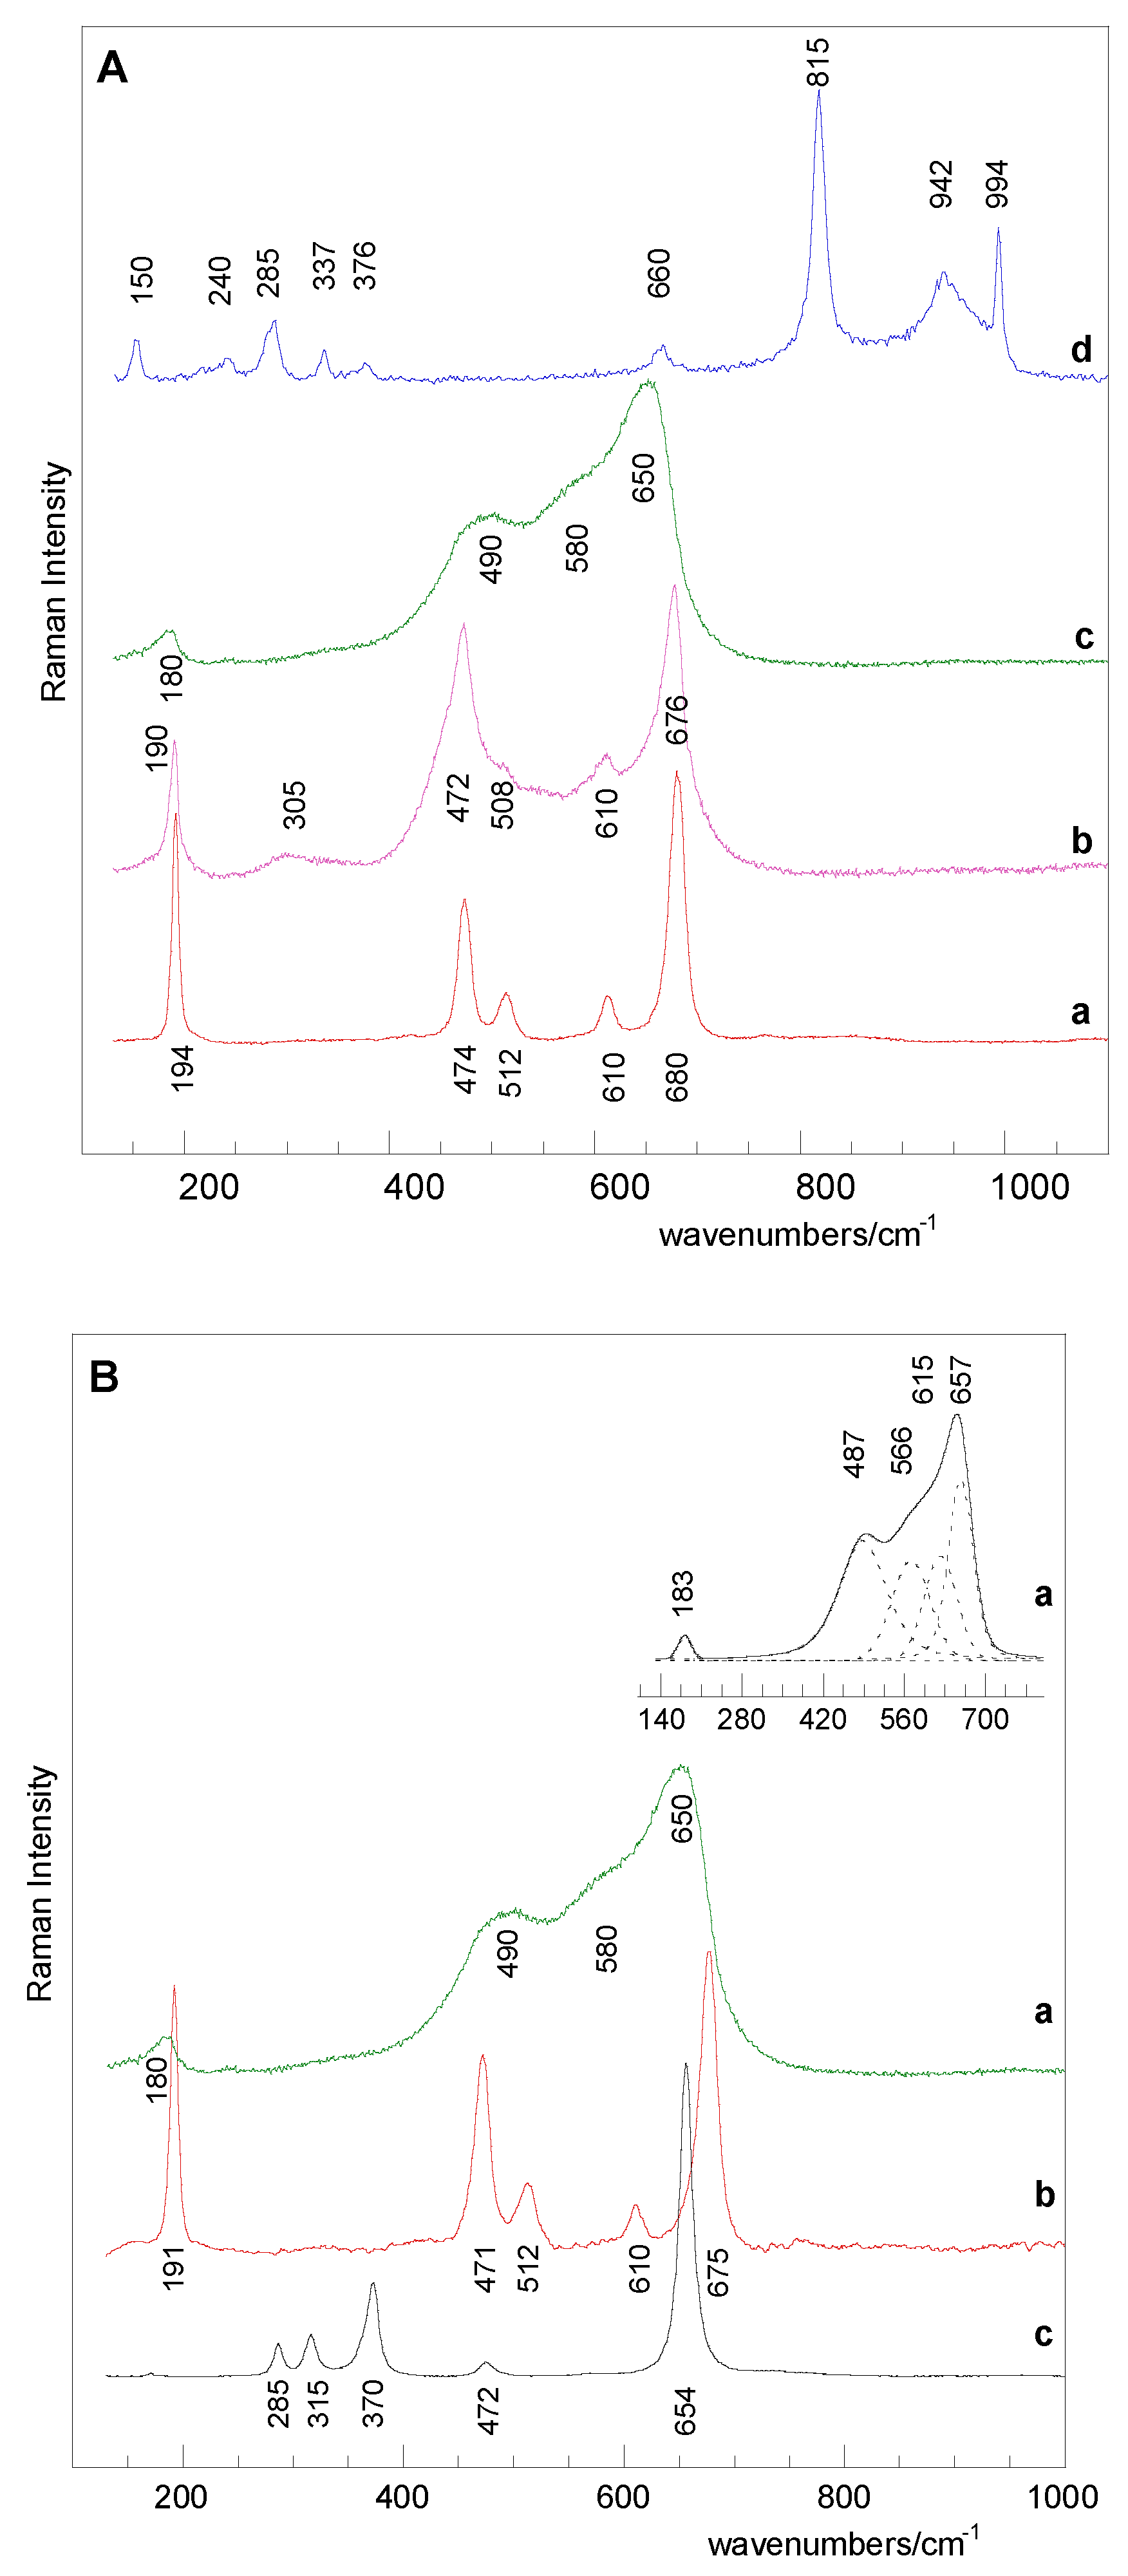
2.2.4. Raman Spectroscopy

Raman spectra were collected on powder samples at room temperature in back-scattering geometry using an inVia Renishaw 1000 spectrometer equipped with an air-cooled, charge-coupled device (CCD) detector and edge filters. A 488.0 nm emission line from an Ar+ laser was focused on the sample using a Leica DLML microscope with 5 × or 20 × objectives and an incident beam power of about 5 mW. A solid-state laser emitting at 785 nm with low power to avoid sample damage (about 2 mW) was used to analyze the 10Fe10CoSiO2 catalyst. The spectra were calibrated using the 520.5 cm−1 line of a silicon wafer. The spectral resolution was 3 cm−1. Data analyses included baseline removal and curve fitting using the Gauss Lorentzian cross-product function in the Peakfit 4.12 software (Systat Software Inc., San Jose, CA, USA, 2007).

2.2.5. Temperature-programmed Desorption (NH3-TPD)

NH3-TPD analyses of samples were carried out using lab-made equipment at CATMAT laboratory, Ca’ Foscari University of Venice in order to study the acidity of the catalysts. First, 100 mg of the catalyst was charged in a quartz reactor and degassed in He with a flow rate of 40 mL/min at 500 °C for 90 min. The catalyst was then cooled to room temperature (25 °C) prior to adsorption of ammonia. Then, the adsorption of 5% NH3/He with a flow rate of 40 mL/min at 25 °C for 30 min was performed. The physisorbed ammonia was removed from the catalyst surface by passing He (40 mL/min) at room temperature for 10 min. The desorption profile of NH3-TPD was recorded using a Micrometrics TPD-TPR 2900 analyzer equipped with a thermal conductivity detector TCD (Gow-Mac 24-550 TCD instrument CO, Bethlehem, PA, USA) from 25 to 1000 °C at a heating rate of 10 °C/min under the flow of He (40 mL/min).

2.3. Aqueous Phase Transformation Catalytic Tests

Aqueous phase reforming (APR) tests were carried out in a 300 mL stainless-steel Parr autoclave loaded with a 0.3–3.0 wt.% solution of glucose in water and 0.45 g of catalyst. All the catalysts were pelletized and reduced at 500 °C for 3 h under a 10 % (v/v) H2/N2 flow before each test.
The experiments were performed by placing the catalyst and glucose water solution (50 mL) into the autoclave. Thereafter, the sealed autoclave was first purged under N2 flow for a few minutes to remove oxygen in the gas phase, and then heated to the desired temperature at 4.2 °C/min. When the desired temperature was reached, the reaction was started. The heating period was not considered in the reaction time. All the reactions were performed in a temperature range of 150–250 °C at autogenous pressure for different durations. At 150 °C, the tests were conducted for 3 h to allow glucose conversion and product formation, while at higher temperatures, the reaction was carried out for 0.5 h to avoid complete glucose transformation into humins. Considering the heating step, the following reaction times were employed: 3.5 h at 150 °C (0.5 h heating); 1.25 h at 200 °C (0.75 h heating); and 1.5 h at 250 °C (1,0 h heating). At the end of the reaction time, the autoclave was quenched in ice and allowed to cool to room temperature over 30–40 min. The reaction mixture was analyzed using Agilent HPLC over a Rezex ROA Organic Acid column (0.0025 M H2SO4 eluent, oven temperature 60 °C and 0.6 mL/min flux) with a RID detector. Gas analyses were performed in an off-line Thermo Focus GC with a carbon molecular sieve column (Carbosphere 80/100 6 * 1/8) and TCD detector.
The glucose conversion, carbon balance and product yields were calculated using the following equations:
Conversion   ( % ) = ( mmol   sub   in ) ( mmol   sub   out ) mmol   sub   in · 100
C a r b o n   b a l a n c e   ( % ) = i ( m m o l   o u t ) · ( C   a t o m s ) ( m m o l   s u b i n   · C   a t o m s   g l c ) · 100
Y i e l d   ( % ) = m m o l   i   o u t m m o l   s u b   i n · 100
where i represents the general product of the reaction.
A couple of randomly chosen center-points were duplicated according to a statistical approach to estimate the variability of the results. The maximum standard deviation exceeded 0.03 and 3 for the conversion and the carbon balance, respectively.

3. Result and Discussion

3.1. Catalysts Characterization
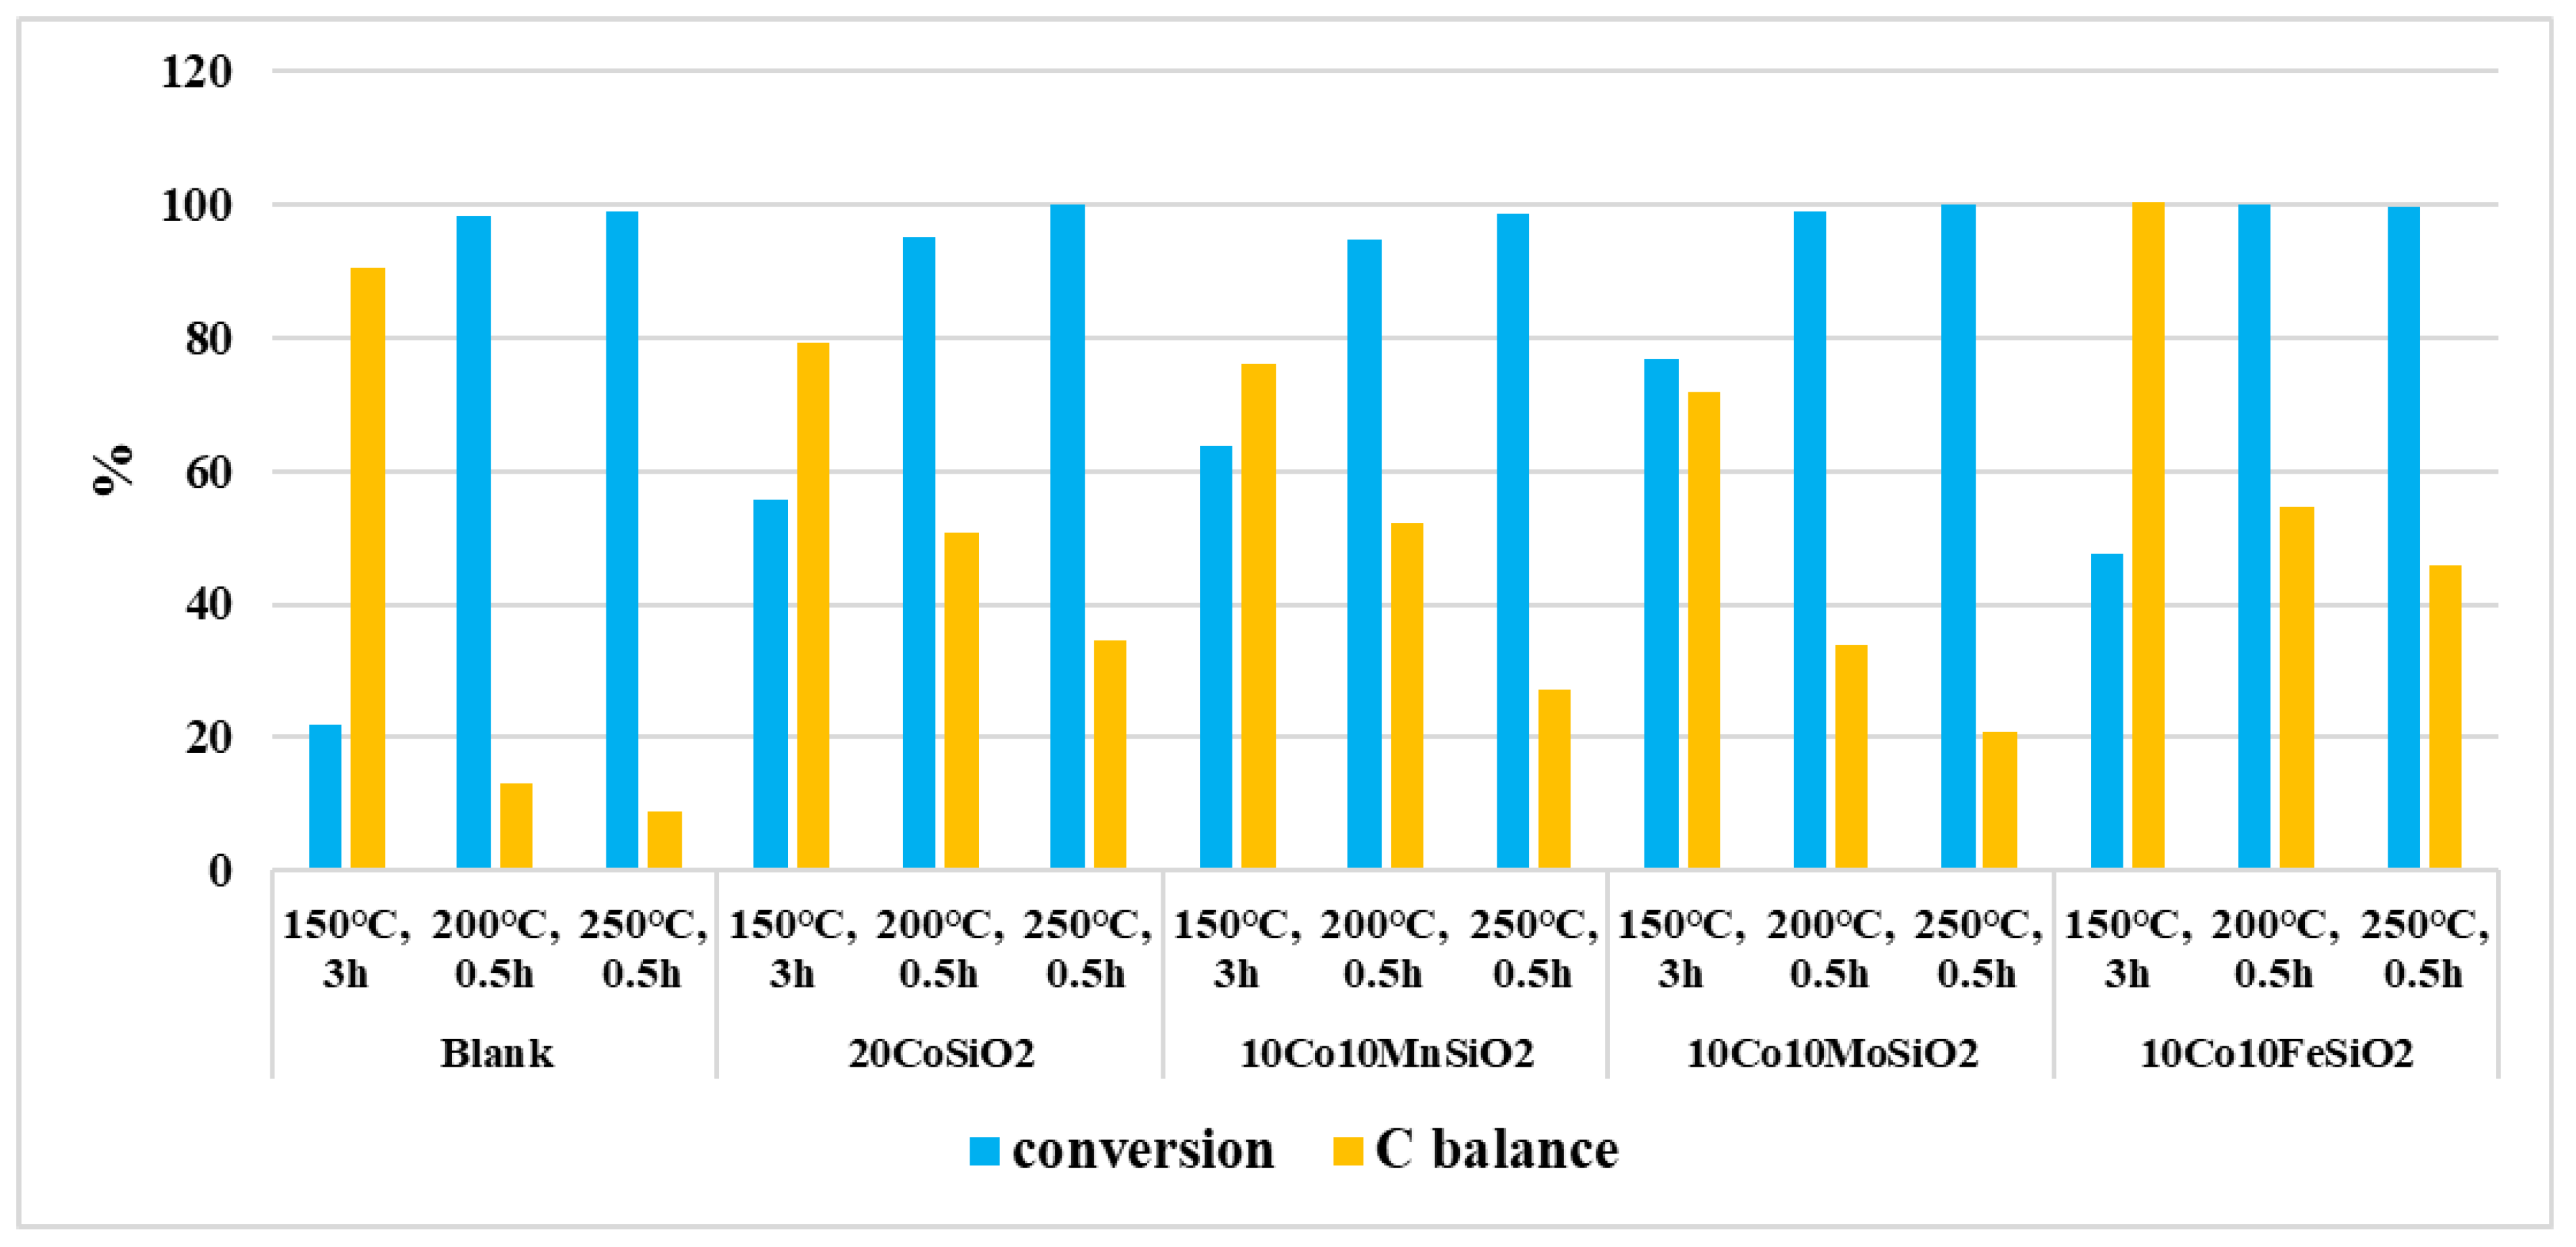
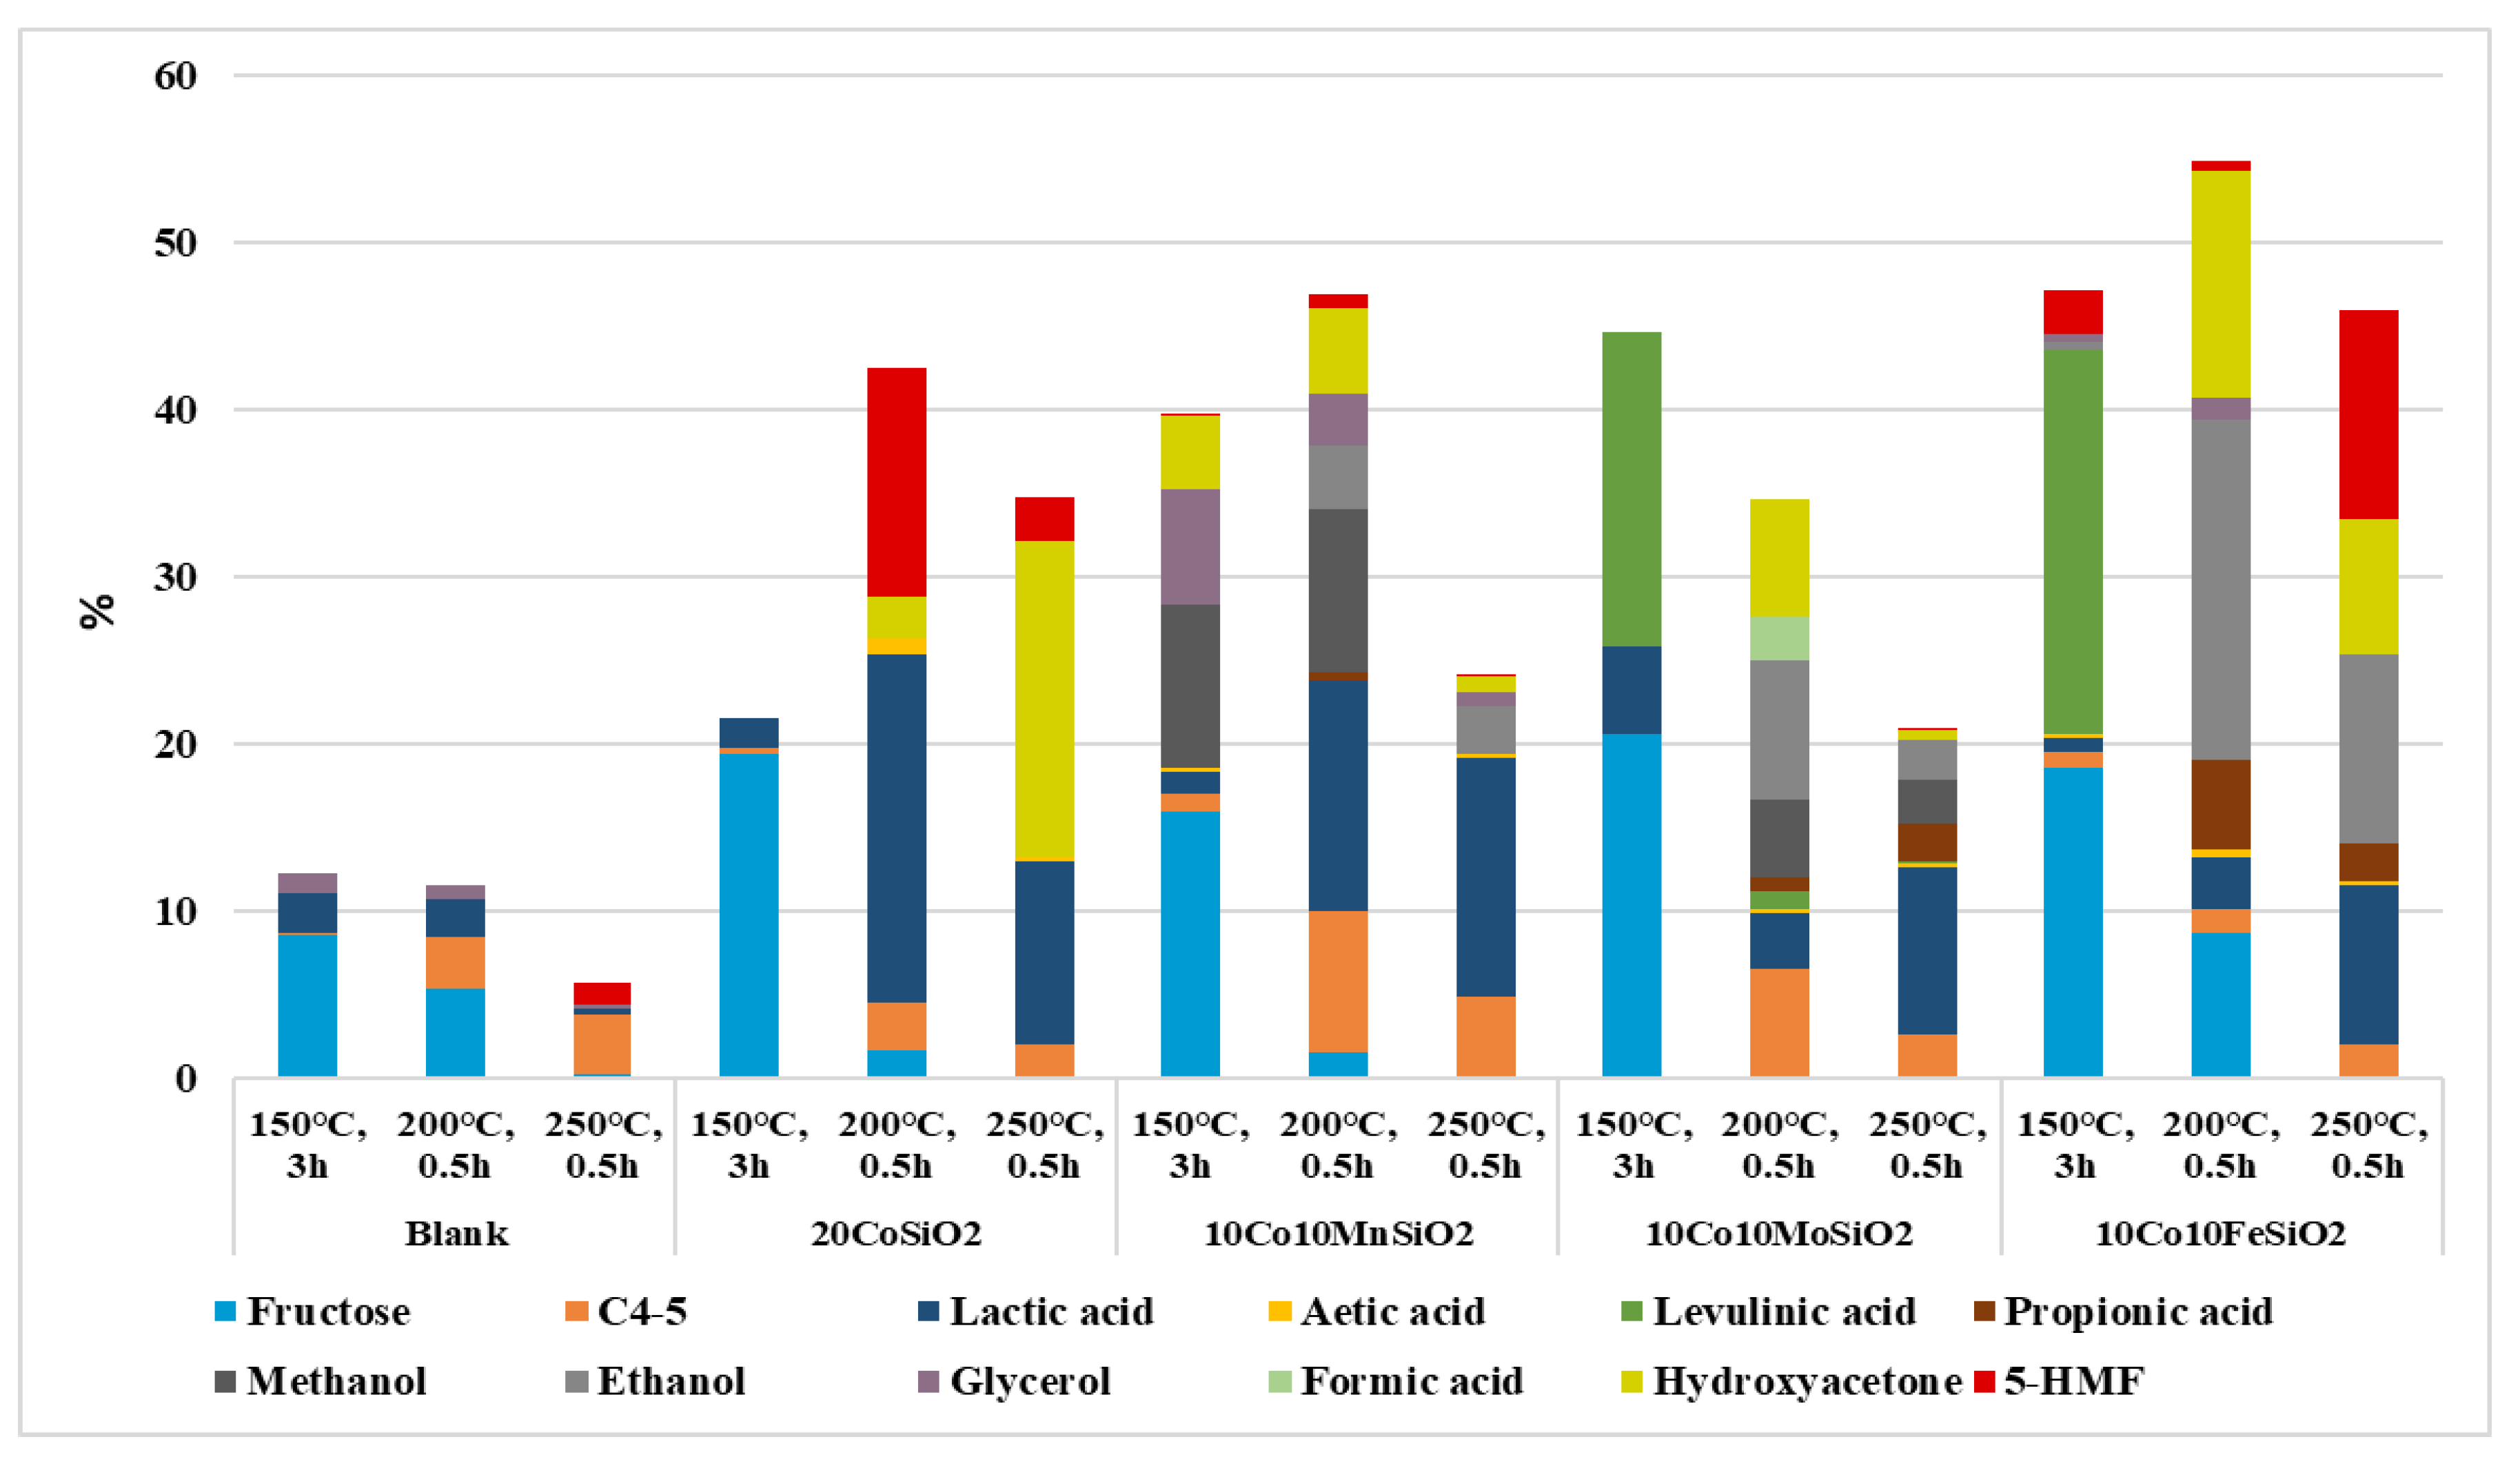
A TEM image of MCM-41 as a catalyst support is shown in Figure 1. It demonstrates the presence of a highly ordered array and layered structure.
The X-ray powder diffraction pattern of the 20CoSiO2 sample (Figure S1) shows peaks at 2θ values of 31.5, 36.9, 38.6, 44.8, 59.4, 65.2° corresponding to the Co3O4 (220), (311), (222), (400), (511), (440) planes, respectively [JCPDS card 9-418]. For the 10Fe10Co SiO2 sample, the peaks at 2θ values of 35.4 and 36.7 denote the most intense lines of the Fe3O4 (311) and of Co3O4(311) phases, respectively [JCPDS card 19-629; JCPDS card 9-418], whereas features at 2θ values of about 31.0, 58.0 and 64 are hardly distinguishable.
The 10Mn10Co SiO2 sample exhibits a broad peak at 2θ of 36.6° and barely detectable features at 2θ of 59° and 65° which were assigned to the most intense Co3O4 (311), (511), (440) planes; no peaks of manganese-containing phases were detected. The average crystallite size of Co3O4, determined by Scherrer equation (Lorentzian peak profile; 2θ, 36.6°), was ~30 nm for the 20CoSiO2 sample, ~ 10 nm for the 10Fe10CoSiO2 sample and ~ 6 nm for the 10Mn10CoSiO2 sample. An average crystallite size of about 10 nm was determined for Fe3O4 (2θ, 35.4°) in the 10Fe10CoSiO2 sample. These results indicate that in the bimetallic catalysts, the spreading of surface species was favored, with an ensuing reduction in material crystallinity [29].
As for the 10Mo10CoSiO2 system, the XRD pattern shows reflections due to MoO3 [JCPDS card 5-0508] and to CoMoO4, identified by the peaks at 2θ values of 26.4 and 31.9° and 35.5° [JCPDS card 21-868]. The average crystallite size results of ~100 nm for MoO3 and ~50 nm for CoMoO4 are indicative of highly crystalline materials [29]
Raman Spectroscopy was applied to obtain information concerning the chemical structure and molecular interactions among the various components in both monometallic and bimetallic samples (Figure 2A).
The 20CoSiO2 sample (Figure 2A), curve a) exhibits the sharp Raman-active modes (F2g, Eg, F2g, F2g and A1g, respectively) predicted for the Co3O4 spinel structure [30], confirming the XRD results. Co3O4 has a normal spinel structure with Co2+ positioned at the tetrahedral site and Co3+ at octahedral site. The most intense mode (A1g) is attributed to the octahedral site symmetry, whereas the weakest modes (F2g and Eg) are related to the combined vibrations of tetrahedral sites and octahedral oxygen motions [31]. In the 10Fe10CoSiO2 spectrum (Figure 2A, curve b), the most intense bands (190, 472 and 676 cm1) are assigned to Co3O4 modes [24], while the broad and low intensity one at about 305 cm−1 clearly identifies Fe3O4 nanoparticles [25], in line with XRD analysis. The presence of both Fe3O4 and Co3O4 is further confirmed by the broad features at 508 and 610 cm−1 and the asymmetric shape of the main band at 676 cm−1, resulting from the superimposition of some of their bands.
The bimetallic 10Mn10CoSiO2 sample (Figure 2A), curve c) showed a broad unresolved feature with some prominent components (at about 180, 490, 580 and 650 cm−1), indicative of nanostructured surface species [32].
For the 10Mo10CoSiO2 sample (Figure 2A), curve d), bands characteristic of the α-MoO3 crystal phase [33] (sharp peaks at about 240, 285, 337, 376, 660, 815 and 994 cm−1) and of the CoMoO4 structure [34] (broad feature at about 942 cm−1) were identified. As for the α-MoO3 phase, the narrow peak at 994 cm−1 could be assigned to the terminal oxygen (Mo = O) stretching mode, and the peaks at 811 cm−1 and at 660 cm−1 were attributed to the doubly (Mo2-O) and triply coordinated (Mo3-O) oxygen stretching mode, respectively, whereas the low intensity of peaks in the 200–400 cm−1 region were due to the Mo–O bending modes.
In Figure 2B, the broad feature representing the 10Mn10CoSiO2 sample (curve a) is inspected with reference to the spectral features of Co3O4 (curve b) and Mn3O4 (curve c) oxides. Both the oxides showed sharp peaks indicative of a crystalline structure, with the Mn3O4 spectrum being characterized by an intense peak at 654 cm−1 assigned to Mn-O vibrations of manganese (II) ions in tetrahedral coordination [35]. With reference to the Co3O4 spectrum, the addition of manganese species caused bands shift to a lower frequency, broadening and coalescence of some of the vibration modes in the 500–700 cm−1 region. These changes could have arisen from the formation of nanostructured species, which caused changes in the coordination and local symmetry of the pure oxide components [32,36]. Bands at 566 and 615 cm−1 identified by Curve fitting results (Figure 2B), curve a inset) suggested that surface Mn3O4 and Co-Mn mixed oxide species had formed [37,38], as also supported by bands at 487 cm−1 and at 657 cm−1, arising from coalescence (bands at 471 and 512 cm−1) and down shift of Co3O4 modes.
In order to investigate the specific surface areas and pore size distribution of the catalysts, nitrogen physisorption was performed. The adsorption–desorption profile of pristine silica support exhibited a type IV isotherm, which was typical of a high surface area mesoporous material (Figure S2 black line), in accordance with IUPAC classification [28]. The BET surface area of the obtained material was 1000 m2/g and the pore volume of 0.4 cm3/g. A high surface area and the mesoporous structure of a catalyst have direct and indirect effects on the reaction results, i.e., increasing the active metal dispersion on the catalyst surface, which could make the active phase more accessible for the reactant and improve the activity of the catalyst. Moreover, a mesoporous catalyst structure made the reactant diffusion and product formation more efficient.
The adsorption–desorption profiles of Co-supported catalysts (Figure S2) were similar to the isotherm profile of SiO2, proving that the pristine support kept its structure after the deposition of the metal phase. However, the isotherm and surface area values of the 10Mo10CoSiO2 sample substantially changed compared to the support ones. The textural properties, including surface areas and pore volumes, decreased somewhat (Table 1) with the deposition of metal active phase. As shown in Table 1, the 10Mo10CoSiO2 catalyst presented the lowest surface area; this was ascribed to the deposition of a large number of cobalt species inside the pores of the mesoporous silica structure. Moreover, according to the XRD analysis, the sample consisted of large crystallites of MoO3 and CoMoO4, leading to a decrease in specific surface area due to pore blocking.
A H2-TPR analysis was carried out to determine the reducibility of metal species and the possible interaction between the metals present on each catalyst. Figure 3 shows the profiles related to hydrogen consumption as a function of temperature for mono and bimetallic Co-based samples.
The TPR profiles of the catalysts showed several peaks indicating the formation of different Cobalt/Promoters species and their various interactions with the support. The pattern of the monometallic 20CoSiO2 sample presented two major reduction peaks at 330 °C and 365 °C. The peak at a lower temperature (330 °C) was assigned to the reduction of Co3O4 species to CoO, while the second one (365 °C) was ascribed to the reduction of CoO to Co0 [39,40,41]. The presence of a broad feature situated between 400 °C and 850 °C could instead be related to the reduction of cobalt species strongly interacting with the support [40].
The TPR profile of the 10Fe10CoSiO2 catalyst was similar to that of the 20CoSiO2 sample, even though the position of the second peak was slightly shifted toward a higher temperature (from 365 °C to 400 °C) and the broad feature centered at 490 °C disappeared, indicating stronger interaction with the support. In addition, the second peak at 400 °C could be ascribed to the reduction of both CoO to Co0 and Fe3O4 to Fe0 [42].
The TPR profile of the 10Mo10CoSiO2 catalyst showed two well-resolved reduction peaks centered at 515° and 640 °C, and a low intensity broad peak at 355 °C. With regards to the peak at 515 °C, it was not possible to assign it to specific metal species, since it may have been due to the reduction step of CoO to Co0 shifting toward higher temperatures, or to the reduction of MoO3 to MoO2 which occurs over a temperature range of 450–650 °C [43]. On the other hand, the peak at 650°, which was not present in TPR profile of the monometallic catalysts (20CoSiO2), could be ascribed to the reduction of MoO2 to Mo0 [44], and to the reduction of CoMnO4 [45].
Finally, compared to the 10CoSiO2 catalyst, the presence of Mn in the 10Mn10CoSiO2 catalyst led to a shift to higher temperature of the first reduction peak, which was related to the harder reduction of Co3O4→Co0; this was proven by using less hydrogen. However, the reduction profile of the 10Mn10CoSiO2 sample showed broad peaks at 560° and 790 °C, that could be related to the reduction of Mn4+ and Mn3+ to Mn2+ 37, and to the reduction of Co species, which have strong metal–support interactions, and Co–Mn mixed oxide species, as also identified by Raman analysis [46,47].
NH3-TPD was performed in order to study the acidic features of the catalysts. The NH3-TPD spectra of all the catalysts are presented in Figure 4. Two peaks in two temperature ranges were found in the spectra of the catalysts, indicating the presence of two types of acidity. The peak in the temperature range of around 100–150 °C was associated with the week acidic sites, while that in the temperature range of approximately 700–850 °C was ascribed to the strong acidic sites [48]. 20CoSiO2 showed a small peak in a higher temperature range (750–850 °C), indicating the presence of slight amounts of strong acidic sites, probably due to the acidity of SiO2 and the formation of CoOx over the support. Compared to the Co monometallic catalyst, mixed Fe-Co and Mo-Co phases exhibited weak acid sites, while the mixed Mn-Co phase increased the intensity of the strong acidity peak. The various bimetallic phases showed different acidic properties [48,49,50].

3.2. Catalytic Test

In order to understand the reactivity of glucose under different reaction conditions, and to determine the effect of the catalysts, blank test were performed. The results obtained at different reaction conditions (150 °C for 3.0 h, 200 °C and 250 °C for 0.5 h) are shown in Figure 5 and Figure 6 and Table 2.
The conversion of glucose without any catalyst was only 22% at 150 °C (Figure 5). Fructose, C4-C5 sugars, glycerol and lactic acid were also detected. This suggests that the isomerization, retro-aldol condensation and dehydration reactions occurred under reaction conditions without any catalyst. Further increases in temperature up to 200 and 250 °C resulted in the almost complete conversion of glucose (98 and 99%, respectively). However, the yields of the identified products did not increase appreciably. The obtained data evidenced high conversion and carbon loss at temperatures above 200 °C due to changes in the reaction pathways; at high temperatures, glucose was converted into both insoluble humins and soluble polymeric byproducts [51]. This could be attributed to the oligomerization reaction of both glucoses, HMF and other reaction products (fructose, other C4-C5 sugars). This underlines one of the main drawbacks of working with sugars [12]. For this reason, different catalysts under the same reaction conditions were screened to identify a reliable method to reduce these byproducts.
In the presence of 20Co/SiO2, even at a low reaction temperature (150 °C), the conversion of glucose was 58%, and fructose was identified as the main product according to NH3-TPD tests that showed the presence of slight number of strong acidic sites active in the isomerization of glucose to fructose. However, the temperature was too low to allow further conversion to occur of fructose to other products. Hence, at 200 °C, the presence of Co nearly completely converted the glucose, and the yield of lactic acid increased to 19%, along with larger amounts of HMF (14%) from the dehydration of fructose. As shown in the experimental data, it seems that the Co-based catalyst with few strong acid sites according to NH3-TPD analyses favored dehydration and the breakage of C–C bonds, in comparison to the blank experiment [52,53].
However, by further increasing the temperature to 250 °C, the yield sum was lower, with hydroxyacetone being the main product, followed by lactic acid. This caused a decrease in the carbon balance values, together with an increase in conversion due to the formation of humins at higher temperature.
Among the tested bimetallic catalysts, the best conversion was achieved over 10Mo10CoSiO2 (77%), followed by 10Mn10CoSiO2 (64%) at 150 °C. Compared to the Co monometallic catalyst, 10Mn10CoSiO2 with strong acidity enhanced the C–C bond cleavage, facilitating the generation of C3 products (lactic acid, hydroxyacetone, glycerol) [54]. In contrast, the 10Fe10CoSiO2 catalyst with weak acidity exhibited the lowest activity for glucose conversion (48%). Thus, it was confirmed that the presence, amount and strength of acid sites are important variables in determining the extent of glucose conversion into biochemicals. This notwithstanding, the use of 10Fe10CoSiO2 resulted in a complete carbon balance, thereby inhibiting the pathway to the formation of humins due to the slight acidity of the catalyst. It was demonstrated that strong acidity can increase product polymerization and the production of humins, and therefore, cause a decrease in product yields and carbon balance. This effect was also demonstrated by the formation of levulinic acid for both 10Fe10CoSiO2 and 10Mo10CoSiO2 catalysts with weak acid sites [54,55].
At higher temperatures (200 and 250 °C), 10Mo10CoSiO2 showed lower performance in terms of glucose conversion and sum yields of products compared to 20CoSiO2 only.
Even though the substitution by Mn or Fe did not significantly affect the conversion of glucose and the carbon balance at 200 °C compared to those obtained using only Co, different reaction product distributions occurred. For instance, the presence of Mn promoted the formation of a wide range C3 products, C4-C5 sugars and methanol, thus enhancing C-C cleavage and dehydration. In comparison, 10Fe10CoSiO2 promoted the production of ethanol and hydroxyacetone. This might stem from the synergistic effect between the two types of metal species and the difference of acidity in the two catalysts [54,56].
Completely different behavior was observed with the bimetallic catalysts at 250 °C. The data obtained from the experiment using 10Mn10CoSiO2 show the lowest carbon balance among the tested catalysts. Considering the reaction product distribution, it seems that the formation of humins could be due to the condensation reaction of C4-C5 sugars, one of the main products at 200 °C, under harsh reaction conditions, as demonstrated in NH3-TPD results.
The best balance (46%) was obtained at 250 °C, with complete conversion using the 10Fe10CoSiO2 catalyst, owing to its lower acidity, as shown by NH3-TPD tests. The main product was 5-HMF, due to the dehydration of fructose. Ethanol was produced with a yield of 11%, while the yield of lactic acid reached 9%.

4. Conclusions

MCM-41-supported Co and bimetallic Co-Mn, Co-Mo and Co-Fe catalysts were investigated regarding the aqueous phase transformation of glucose into biochemicals, operating under different reaction conditions. With increases in temperature and the number and strength of catalyst acid sites, the conversion of glucose increased, but resulted in a low carbon balance due to the formation of humins. Isomerization was the predominant reaction at lower temperatures, while humins prevailed at higher temperatures, longer reaction times and higher catalyst acidity. The synergy of Fe, Mn and Mo with the Co increased the activity at 150 and 200 °C, while 250 °C hydrothermal conditions favored the retro aldol condensation reaction of glucose and its intermediates (fructose, C4-C5 sugars and 5-HMF) to form humins. The best catalytic reactivity was obtained under mild reaction conditions with the weak acidic sites of the 10Fe10CoSiO2 catalyst, yielding valuable biochemicals such as fructose, levulinic acid, ethanol and hydroxyacetone.

Supplementary Materials

The following are available online at https://www.mdpi.com/2227-9717/8/7/843/s1, Figure S1: XRD patterns of the 20CoSiO2 (a), 10Fe10CoSiO2 (b) 10Mn10CoSiO2 (c) and 10Mo10CoSiO2 (d) samples*Co3O4; ^Fe3O4; MoO3; #CoMoO4, Table S1: N2 adsorption/desorption isotherms of catalysts and pristine support.

Author Contributions

Conceptualization, S.T.; methodology, D.P. and E.G.; validation, F.M., F.B. and D.G.; formal analysis and investigation, S.T., A.M. and A.F.; writing—original draft preparation, S.T.; supervision, M.S.; project administration, G.F.; funding acquisition, A.V. All authors were contributed in the manuscript writing. All authors have read and agreed to the published version of the manuscript.

Funding

This research was funded by Italian National Research Program PRIN 2015 “Heterogeneous Robust catalysts to upgrade low value biomass stream (HERCULES)” project.

Conflicts of Interest

The authors declare no conflicts of interest.

References

  1. Wang, J.; Xi, J.; Wang, Y. Recent advances in the catalytic production of glucose from lignocellulosic biomass. Green Chem. 2015, 17, 737–751. [Google Scholar] [CrossRef]
  2. Chen, S.; Maneerung, T.; Tsang, D.C.; Ok, Y.S.; Wang, C.-H. Valorization of biomass to hydroxymethylfurfural, levulinic acid, and fatty acid methyl ester by heterogeneous catalysts. Chem. Eng. J. 2017, 328, 246–273. [Google Scholar] [CrossRef]
  3. Kang, S.; Fu, J.; Zhang, G. From lignocellulosic biomass to levulinic acid: A review on acid-catalyzed hydrolysis. Renew. Sustain. Energy Rev. 2018, 94, 340–362. [Google Scholar] [CrossRef]
  4. Somerville, C.; Youngs, H.; Taylor, C.; Davis, S.C.; Long, S. Feedstocks for Lignocellulosic Biofuels. Science 2010, 329, 790–792. [Google Scholar] [CrossRef] [PubMed] [Green Version]
  5. Sun, Y.; Lu, X.; Zhang, S.; Zhang, R.; Wang, X. Kinetic study for Fe (NO3)3 catalyzed hemicellulose hydrolysis of different corn stover silages. Bioresour. Technol. 2011, 102, 2936–2942. [Google Scholar] [CrossRef]
  6. Chen, H. Biotechnology of Lignocellulose; Springer: Berlin/Heidelberg, Germany, 2014. [Google Scholar]
  7. Karnjanakom, S.; Guan, G.; Asep, B.; Hao, X.; Kongparakul, S.; Samart, C.; Abudula, A. Catalytic Upgrading of Bio-Oil over Cu/MCM-41 and Cu/KIT-6 Prepared by β-Cyclodextrin-Assisted Coimpregnation Method. J. Phys. Chem. C 2016, 120, 3396–3407. [Google Scholar] [CrossRef]
  8. Qib, X.; Watanabe, M.; Aida, T.M.; Smith, R.L. Fast Transformation of Glucose and Di-/Polysaccharides into 5-Hydroxymethylfurfural by Microwave Heating in an Ionic Liquid/Catalyst System. ChemSusChem 2010, 3, 1071–1077. [Google Scholar] [CrossRef]
  9. Choudhary, V.; Pinar, A.B.; Sandler, S.I.; Vlachos, D.G.; Lobo, R.F. Xylose Isomerization to Xylulose and its Dehydration to Furfural in Aqueous Media. ACS Catal. 2011, 1, 1724–1728. [Google Scholar] [CrossRef]
  10. Tanksale, A.; Beltramini, J.N.; Lu, G.Q. Reaction Mechanisms for Renewable Hydrogen from Liquid Phase Reforming of Sugar Compounds. Dev. Chem. Eng. Miner. Process. 2008, 14, 9–18. [Google Scholar] [CrossRef]
  11. Fasolini, A.; Cespi, D.; Tabanelli, T.; Cucciniello, R.; Cavani, F. Hydrogen from Renewables: A Case Study of Glycerol Reforming. Catalysts 2019, 9, 722. [Google Scholar] [CrossRef] [Green Version]
  12. Sasaki, M.; Goto, K.; Tajima, K.; Adschiri, T.; Arai, K. Rapid and selective retro-aldol condensation of glucose to glycolaldehyde in supercritical water. Green Chem. 2002, 4, 285–287. [Google Scholar] [CrossRef]
  13. Fasolini, A.; Cucciniello, R.; Paone, E.; Mauriello, F.; Tabanelli, T. A Short Overview on the Hydrogen Production Via Aqueous Phase Reforming (APR) of Cellulose, C6-C5 Sugars and Polyols. Catalysts 2019, 9, 917. [Google Scholar] [CrossRef] [Green Version]
  14. Deng, W.; Zhang, Q.; Wang, Y. Catalytic transformations of cellulose and cellulose-derived carbohydrates into organic acids. Catal. Today 2014, 234, 31–41. [Google Scholar] [CrossRef]
  15. Signoretto, M.; Taghavi, S.; Ghedini, E.; Menegazzo, F. Catalytic Production of Levulinic Acid (LA) from Actual Biomass. Molecules 2019, 24, 2760. [Google Scholar] [CrossRef] [PubMed] [Green Version]
  16. Sudarsanam, P.; Zhong, R.; Bosch, S.V.D.; Coman, S.M.; Parvulescu, V.I.; Sels, B.F. Functionalised heterogeneous catalysts for sustainable biomass valorisation. Chem. Soc. Rev. 2018, 47, 8349–8402. [Google Scholar] [CrossRef] [Green Version]
  17. Sarkar, J.; Bhattacharyya, S. Application of Graphene and Graphene-Based Materials in Clean Energy-Related Devices Minghui. Arch. Thermodyn. 2012, 33, 23–40. [Google Scholar] [CrossRef]
  18. Lam, E.; Luong, J.H. Carbon Materials as Catalyst Supports and Catalysts in the Transformation of Biomass to Fuels and Chemicals. ACS Catal. 2014, 4, 3393–3410. [Google Scholar] [CrossRef]
  19. Taghavi, S.; Norouzi, O.; Tavasoli, A.; di Maria, F.; Signoretto, M.; Menegazzo, F.; di Michele, A. Catalytic conversion of Venice lagoon brown marine algae for producing hydrogen-rich gas and valuable biochemical using algal biochar and Ni/SBA-15 catalyst. Int. J. Hydrogen Energy 2018, 43, 19918–19929. [Google Scholar] [CrossRef]
  20. Xu, Q.; Zhu, Z.; Tian, Y.; Deng, J.; Shi, J.; Fu, Y. Sn-MCM-41 as Efficient Catalyst for the Conversion of Glucose into 5-Hydroxymethylfurfural in Ionic Liquids. BioResources 2013, 9, 303–315. [Google Scholar] [CrossRef] [Green Version]
  21. Ya’Aini, N.; Amin, N.A.S.; Endud, S. Characterization and performance of hybrid catalysts for levulinic acid production from glucose. Microporous Mesoporous Mater. 2013, 171, 14–23. [Google Scholar] [CrossRef]
  22. Ya’Aini, N.; Amin, N.A.S.; Asmadi, M. Optimization of levulinic acid from lignocellulosic biomass using a new hybrid catalyst. Bioresour. Technol. 2012, 116, 58–65. [Google Scholar] [CrossRef]
  23. Cao, X.; Peng, X.; Sun, S.; Zhong, L.; Chen, W.; Wang, S.; Sun, S. Hydrothermal conversion of xylose, glucose, and cellulose under the catalysis of transition metal sulfates. Carbohydr. Polym. 2015, 118, 44–51. [Google Scholar] [CrossRef] [PubMed]
  24. Ghedini, E.; Menegazzo, F.; Signoretto, M.; Manzoli, M.; Pinna, F.; Strukul, G. Mesoporous silica as supports for Pd-catalyzed H2O2 direct synthesis: Effect of the textural properties of the support on the activity and selectivity. J. Catal. 2010, 273, 266–273. [Google Scholar] [CrossRef]
  25. Brunauer, S.; Emmett, P.H. The Use of Low Temperature van der Waals Adsorption Isotherms in Determining the Surface Areas of Various Adsorbents. J. Am. Chem. Soc. 1937, 59, 2682–2689. [Google Scholar] [CrossRef]
  26. Barrett, E.P.; Joyner, L.G.; Halenda, P.P. The Determination of Pore Volume and Area Distributions in Porous Substances. I. Computations from Nitrogen Isotherms. J. Am. Chem. Soc. 1951, 73, 373–380. [Google Scholar] [CrossRef]
  27. Gregg, S.J.; Sing, K.S.W. Adsorption, Surface Area end Porosity; Academic Press: New York, NY, USA, 1967. [Google Scholar]
  28. Union, I.; Pure, O.F.; Chemistry, A. International union of pure commission on colloid and syrface chemistry including catalysis reporting physisorption data for gas/solid systems with Special Reference to the Determination of Surface Area and Porosity. Area 1985, 57, 603–619. [Google Scholar]
  29. Ungár, T. Microstructural parameters from X-ray diffraction peak broadening. Scr. Mater. 2004, 51, 777–781. [Google Scholar] [CrossRef]
  30. Hadjiev, V.G.; Iliev, M.; Vergilov, I.V. The Raman spectra of Co3O4. J. Phys. C Solid State Phys. 1988, 21, L199–L201. [Google Scholar] [CrossRef]
  31. Rivas-Murias, B.; Salgueiriño, V. Thermodynamic CoO-Co3O4 crossover using Raman spectroscopy in magnetic octahedron-shaped nanocrystals. J. Raman Spectrosc. 2017, 14, 640–841. [Google Scholar] [CrossRef]
  32. Gouadec, G.; Colomban, P. Raman Spectroscopy of nanomaterials: How spectra relate to disorder, particle size and mechanical properties. Prog. Cryst. Growth Charact. Mater. 2007, 53, 1–56. [Google Scholar] [CrossRef] [Green Version]
  33. Sharma, R.K.; Reddy, G.B. Synthesis, and characterization ofα-MoO3microspheres packed with nanoflakes. J. Phys. D Appl. Phys. 2014, 47, 65305. [Google Scholar] [CrossRef]
  34. Cherian, C.T.; Reddy, M.V.; Haur, S.C.; Chowdari, B.V.R. Interconnected Network of CoMoO4 Submicrometer Particles As High Capacity Anode Material for Lithium Ion Batteries. ACS Appl. Mater. Interfaces 2013, 5, 918–923. [Google Scholar] [CrossRef] [PubMed]
  35. Julien, C.; Massot, M.; Poinsignon, C. Lattice vibrations of manganese oxides. Spectrochim. Acta Part A Mol. Biomol. Spectrosc. 2004, 60, 689–700. [Google Scholar] [CrossRef]
  36. Lorite, I.; Romero, J.J.; Fernández, J.F. Effects of the agglomeration state on the Raman properties of Co3 O4 nanoparticles. J. Raman Spectrosc. 2012, 43, 1443–1448. [Google Scholar] [CrossRef]
  37. Klissurski, D.G.; Uzunova, E. Cation-deficient nano-dimensional particle size cobalt–manganese spinel mixed oxides. Appl. Surf. Sci. 2003, 214, 370–374. [Google Scholar] [CrossRef]
  38. Kovanda, F.; Rojka, T.; Dobešová, J.; Machovič, V.; Bezdička, P.; Obalová, L.; Jirátová, K.; Grygar, T.M. Mixed oxides obtained from Co and Mn containing layered double hydroxides: Preparation, characterization, and catalytic properties. J. Solid State Chem. 2006, 179, 812–823. [Google Scholar] [CrossRef]
  39. Liu, B.; Ouyang, B.; Zhang, Y.; Lv, K.; Li, Q.; Ding, Y.; Li, J. Effects of mesoporous structure and Pt promoter on the activity of Co-based catalysts in low-temperature CO2 hydrogenation for higher alcohol synthesis. J. Catal. 2018, 366, 91–97. [Google Scholar] [CrossRef]
  40. Griboval, A.; Butel, A.; Ordomsky, V.V.; Chernavskii, P.A.; Khodakov, A.Y. Cobalt and iron species in alumina supported bimetallic catalysts for Fischer–Tropsch reaction. Appl. Catal. A Gen. 2014, 481, 116–126. [Google Scholar] [CrossRef]
  41. Tavasoli, A.; Trépanier, M.; Abbaslou, R.M.M.; Dalai, A.K.; Abatzoglou, N. Fischer–Tropsch synthesis on mono- and bimetallic Co and Fe catalysts supported on carbon nanotubes. Fuel Process. Technol. 2009, 90, 1486–1494. [Google Scholar] [CrossRef]
  42. Mai, K.; Elder, T.; Groom, L.H.; Spivey, J.J. Fe-based Fischer Tropsch synthesis of biomass-derived syngas: Effect of synthesis method. Catal. Commun. 2015, 65, 76–80. [Google Scholar] [CrossRef]
  43. Kukushkin, R.; Bulavchenko, O.; Kaichev, V.; Yakovlev, V. Influence of Mo on catalytic activity of Ni-based catalysts in hydrodeoxygenation of esters. Appl. Catal. B Environ. 2015, 163, 531–538. [Google Scholar] [CrossRef]
  44. Saghafi, M.; Heshmati-Manesh, S.; Ataie, A.; Khodadadi, A.A. Synthesis of nanocrystalline molybdenum by hydrogen reduction of mechanically activated MoO3. Int. J. Refract. Met. Hard Mater. 2012, 30, 128–132. [Google Scholar] [CrossRef]
  45. Rodríguez, J.A.; Chaturvedi, S.; Hanson, J.C.; Brito, J.L. Reaction of H2and H2S with CoMoO4and NiMoO4: TPR, XANES, Time-Resolved XRD, and Molecular-Orbital Studies. J. Phys. Chem. B 1999, 103, 770–781. [Google Scholar] [CrossRef]
  46. Khodakov, A.Y.; Chu, W.; Fongarland, P. Advances in the Development of Novel Cobalt Fischer−Tropsch Catalysts for Synthesis of Long-Chain Hydrocarbons and Clean Fuels. Chem. Rev. 2007, 107, 1692–1744. [Google Scholar] [CrossRef] [PubMed]
  47. Bragança, L.; Ojeda, M.; Fierro, J.L.G.; da Silva, M.P. Bimetallic Co-Fe nanocrystals deposited on SBA-15 and HMS mesoporous silicas as catalysts for Fischer–Tropsch synthesis. Appl. Catal. A Gen. 2012, 423, 146–153. [Google Scholar] [CrossRef]
  48. Srivastava, S.; Jadeja, G.C.; Parikh, J.K. A versatile bi-metallic copper–cobalt catalyst for liquid phase hydrogenation of furfural to 2-methylfuran. RSC Adv. 2016, 6, 1649–1658. [Google Scholar] [CrossRef]
  49. Peng, Y.; Chang, H.; Dai, Y.; Li, J. Structural and Surface Effect of MnO2 for Low Temperature Selective Catalytic Reduction of NO with NH3. Procedia Environ. Sci. 2013, 18, 384–390. [Google Scholar] [CrossRef] [Green Version]
  50. Mosallanejad, S.; Dlugogorski, B.Z.; Kennedy, E.; Stockenhuber, M. On the Chemistry of Iron Oxide Supported on γ-Alumina and Silica Catalysts. ACS Omega 2018, 3, 5362–5374. [Google Scholar] [CrossRef]
  51. Liu, C.; Zhang, Z.; Zhai, X.; Wang, X.; Gui, J.Z.; Zhang, C.; Zhu, Y.; Li, Y. Synergistic effect between copper and different metal oxides in the selective hydrogenolysis of glucose. New J. Chem. 2019, 43, 3733–3742. [Google Scholar] [CrossRef]
  52. Watanabe, M.; Bayer, F.; Kruse, A. Oil formation from glucose with formic acid and cobalt catalyst in hot-compressed water. Carbohydr. Res. 2006, 341, 2891–2900. [Google Scholar] [CrossRef]
  53. Aman, D.; Radwan, D.; Ebaid, M.; Mikhail, S.; van Steen, E. Comparing nickel and cobalt perovskites for steam reforming of glycerol. Mol. Catal. 2018, 452, 60–67. [Google Scholar] [CrossRef]
  54. Cheng, Z.; Everhart, J.L.; Tsilomelekis, G.; Nikolakis, V.; Saha, B.; Vlachos, D.G.; Vlachos, D. Structural analysis of humins formed in the Brønsted acid catalyzed dehydration of fructose. Green Chem. 2018, 20, 997–1006. [Google Scholar] [CrossRef]
  55. Swift, T.D.; Nguyen, H.; Anderko, A.; Nikolakis, V.; Vlachos, D.G. Tandem Lewis/Brønsted homogeneous acid catalysis: Conversion of glucose to 5-hydoxymethylfurfural in an aqueous chromium(iii) chloride and hydrochloric acid solution. Green Chem. 2015, 17, 4725–4735. [Google Scholar] [CrossRef] [Green Version]
  56. Kuninobu, Y.; Uesugi, T.; Kawata, A.; Takai, K. Manganese-Catalyzed Cleavage of a Carbon-Carbon Single Bond between Carbonyl Carbon and α-Carbon Atoms of Ketones. Angew. Chem. Int. Ed. 2011, 50, 10406–10408. [Google Scholar] [CrossRef]
Figure 1. TEM image of MCM-41.
Processes 08 00843 g001
Figure 2. (A) Raman spectra of 20CoSiO2 (a), 10Fe10CoSiO2 (b) 10Mn10CoSiO2 (c) and 10Mo10CoSiO2 (d); (B) Raman spectra of 10Mn10CoSiO2 (a), Co3O4 (b) and Mn3O4 (c) oxides. inset: curve fitting results obtained for the 10Mn10CoSiO2 sample.
Processes 08 00843 g002
Figure 3. TPR profiles of the mono and bimetallic Co-based samples.
Processes 08 00843 g003
Figure 4. NH3-TPD profiles for synthesized catalysts.
Processes 08 00843 g004
Figure 5. Glucose conversion and carbon balance in the presence of catalysts.
Processes 08 00843 g005
Figure 6. Product distribution for the transformation of glucose in the presence of catalysts.
Processes 08 00843 g006
Table 1. Surface area and pore size of catalysts.
Catalyst.Specific Surface Area (m2/g)Average Pore Diameter (nm)Pore Volume (cm3/g)
SiO21000-0.40
20CoSiO24601.60.32
10Fe10CoSiO25101.50.33
10Mn10CoSiO24031.60.30
10Mo10CoSiO21852.90.23
Table 2. Glucose conversion, product selectivity and carbon balance obtained under different conditions.
CatalystReaction CondtionsConversion, %Selectivity %Carbon Balance*, %
FructoseC4-5Lactic AcidAcetic AcidLevulinic AcidPropiionic AcidMethanolEtanolGlcyerolFormic AcidHydroxyacetone5-HMF
No cat150° C, 3h2240<111591
200° C, 0.5h98532<113
250 °C, 0.5h99<14<10.0-<119
Co150 °C, 3 h5635<1379
200 °C, 0.5h952322131451
250 °C, 0.5 h100211<119335
Co-Mn150 °C, 3 h642522<115117<176
200 °C, 0.5 h952915<110435<152
250 °C, 0.5h99514<13<1<1<127
Co-Mo150 °C, 3 h7727725
200 °C, 0.5h9963<11<15937
250 °C, 0.5h100210<1<1232<1
Co-Fe150 °C, 3 h483922<1481<15100
200 °C, 0.5h100913<15201-14<155
250 °C, 0.5 h100209<121181246

