Article

Novel Correlations between Spectroscopic and Morphological Properties of Activated Carbons from Waste Coffee Grounds

1
Dipartimento di Ingegneria Industriale, Università degli Studi di Padova, via F. Marzolo 9, 35131 Padova, Italy
2
Dipartimento di Scienze Chimiche, Università degli Studi di Padova, via F. Marzolo 1, 35131 Padova, Italy
3
Dipartimento di Scienze Molecolari e Nanosistemi, Università Ca’ Foscari Venezia, via Torino 155, 30172 Venezia Mestre, Italy
4
Dipartimento di Fisica e Astronomia, Università degli Studi di Padova, Laboratori INFN, viale dell’Università 2, 35020 Legnaro, Italy
5
Consiglio Nazionale delle Ricerche, Istituto di Chimica della Materia Condensata e di Tecnologie per l’Energia, Corso Stati Uniti 4, 35127 Padova, Italy
6
Centro de Química Estrutural, Instituto Superior Técnico, Lisbona, Avenida Rovisco Pais 1, 1049-001 Lisbon, Portugal
7
Laboratoire d’Etude sur les Interactions Matériaux-Environnement, Faculté des Science et de la Technologie, Université Mohamed Seddik BenYahia, BP 98 Ouled Aissa, Jijel 18000, Algeria
8
Centro di Analisi e Servizi per la Certificazione, Università degli Studi di Padova, via Jappelli 1, 35131 Padova, Italy
*
Author to whom correspondence should be addressed.
Processes 2021, 9(9), 1637; https://doi.org/10.3390/pr9091637
Submission received: 23 June 2021 / Revised: 3 September 2021 / Accepted: 8 September 2021 / Published: 10 September 2021
(This article belongs to the Special Issue Activated Carbon in Contaminant Removal)

Abstract

:
Massive quantities of spent coffee grounds (SCGs) are generated by users around the world. Different processes have been proposed for SCG valorization, including pyrolytic processes to achieve carbonaceous materials. Here, we report the preparation of activated carbons through pyrolytic processes carried out under different experimental conditions and in the presence of various porosity activators. Textural and chemical characterization of the obtained carbons have been achieved through Brunauer–Emmett–Teller (BET), ESEM, 13C solid state NMR, XPS, XRD, thermogravimetric and spectroscopic determinations. The aim of the paper is to relate these data to the preparation method, evaluating the correlation between the spectroscopic data and the physical and textural properties, also in comparison with the corresponding data obtained for three commercial activated carbons used in industrial adsorption processes. Some correlations have been observed between the Raman and XPS data.

1. Introduction

Coffee is the second most popular beverage after water and the second largest traded commodity after petroleum, thus massive quantities of waste are generated by industries and users around the world, which represent an abundant and low-cost bio-resource for energy and chemicals due to their high organic content, opening up a wide range of applications in a circular economy perspective [1,2,3,4,5,6,7]. With an estimated average of 11 g of fresh ground coffee going into each cup, around 6 million tons of wet waste of ground coffee are brewed every year around the world (it was evaluated that 1 ton of green coffee generates about 650 kg of spent coffee grounds (SCGs) and about 2 kg of wet SCGs from 1 kg of soluble coffee) [8,9]. Different processes have been proposed in the literature for the valorization of spent coffee grounds (Scheme 1), which can be summarized into the following five principal topics [10]:
(a) Value-added chemicals can be recovered by extraction or by enzymatic processes to achieve [3,11]: polysaccharides (about 45% w/w, of dry weight of the material, mainly consisting of mannan, galactomannan, arabinogalactane and cellulose [12]); proteins (about 13% w/w, with a low content of aromatic amino acids and high content of leucine); caffeine (about 1.8 mg/g); brown-colored compounds (melanoidins); lipids (10–20% w/w, with characteristics similar to petroleum ether extracts: diterpene alcohol esters about 12%, sterols approximately 2%, and approximately 2% of polar materials and sterol esters together with triacyglycerols in about 85% amount mainly of linoleic, palmitic, stearic, oleic and linolenic acids); minerals (ranging from 1 to 3% w/w, consisting in 3–21 mg/g of K, Mg from 0.1 to 0.4 mg/g together with traces of P, Co, Na, Fe, Mn, and Cu) and phenolic compound as antioxidants (about 20% w/w, mainly chlorogenic acid and its derivatives) [4,13].
(b) Biopolymers and biocomposites can be achieved owing to the high content of hemicellulose, cellulose, and lignin, thus SCGs have been proposed as reinforcement agents for polymers [14,15] or mixed with natural waxes to prepare biobased polymeric composite material (PCM) [16] or in suspension with silicone oil to achieve electrorheological fluids [17].
(c) The positive impact as soil amendment of SCGs has been shown in lettuce physical and nutritional features [18] or in improving microbial activity and reducing leaching of mineral nitrogen from the arable soil [19]. SCGs have been also studied as additive in animal feed [20] and in integrated hydrothermal carbonization-anaerobic digestion processes to improve biomethane production.
(d) Many papers explored the availability of SCGs for energy recovery [21]: from biodiesel [22], hydrocarbons [23], to bioethanol and bioether [24,25], bio-oil [26,27], or biogas [28] preparation.
(e) The preparation of activated carbon was extensively studied starting from SCGs with different purposes: as adsorbent material for water purification [29,30,31,32,33,34] and in particular for heavy metal removal from water [35] or amelioration of environmental pollution [36]; as media for separation of hydrogen sulfide from air at ambient conditions [37]; for CO2 capture [38,39,40,41] and as materials for methane [42], hydrogen [43], or lithium [44] storage. Activated carbon from wastes was also studied as a catalyst [45] or a support for metal catalysts [46]. Recently, intriguing papers have been reported concerning the influence of the preparation processes on the activated carbon derived from SCGs as anodic or cathodic material in carbon or microbial fuel cells, respectively [47], in sodium ion [48] or Li-Se batteries [49]. High-capacitance nitrogen-containing nano-porous carbon materials from SCGs have been shown to exhibit high performance as supercapacitor electrodes for energy storage applications [40,41,50].
Technological applications of activated carbons (ACs) in adsorption processes are becoming increasingly broader in different sectors including pharmaceutical uses [51]. In this last frame, ACs are applied either in industry for the purification of pharmaceutical products to remove unwanted impurities and as a nutraceutical or active pharmaceutical ingredient. Furthermore, ACs have an undisputed role in the treatment of acutely poisoned patients, being considered the universal antidote. Some stringent characteristics are necessary for use of ACs in this context; a high degree of microporosity with surface area values towards 2000 m2/g or higher, and traceability of the starting materials and synthetic process (no animal contact).
The preparation of ACs consists of two main steps: carbonization of a carbonaceous raw material typically via pyrolysis in an inert atmosphere (to achieve pyrochar, a carbon rich and thermally stable product) followed by chemical or physical activation to develop porosity. As for raw materials, in recent years, increasing attention has been devoted to renewable resources and biomasses, including wastes, being inexpensive and largely available. The use of waste coffee grounds as a source of ACs is particularly intriguing because of the possibility to agree with the qualification for pharmaceutical applications, with the raw material belonging to the food chain. Different synthetic protocols have been reported to influence strongly the morphological, physical, and chemical properties of the activated carbon obtained.
As for physical activation processes, treatment with gases such as CO2 [52,53,54] or steam [55] have been performed, while as chemical activators dehydrating agents and oxidants such as H3PO4, H2SO4 or bases such as NaOH or KOH have been considered besides ZnCl2 [56]. Even if physical activation is largely employed for large amounts of AC preparation for industrial and environmental applications, chemical activation is exploited due to the modulation of chemical and physical properties of the final AC, depending on the experimental parameters, such as time, temperature, activating agent/precursor ratio and activator nature. The KOH activation of waste coffee grounds was proposed to involve the generation of pore structures via redox reactions between potassium compounds and carbon, followed by the additional development of pore structures via the gasification of carbon and the expanding of carbon lattices by intercalating metallic K generated during activation into the carbon matrix [57]. Also, water vapor and carbon material undergo a steam reforming reaction yielding the porous structure [1].
Even if many studies have been reported concerning the valorization of coffee grounds into ACs, some experimental and characterization aspects deserve, to the best of our knowledge, further consideration [1]. The aim of the present work was to prepare ACs from two different waste coffee grounds, under different experimental conditions and to achieve to a more detailed characterization with the aim to correlate their spectroscopic data with physical and textural properties, also in comparison with the corresponding data obtained for three commercial activated carbons used in industrial adsorption processes.

2. Materials and Methods

2.1. Raw Materials

Two different types of waste coffee ground were collected from local cafeterias: samples R (Robusta, dark brown flakes, scraggy with deep pores; Figure S1a) and A (Arabica, light brown, more compact, flakes, Figure S1b). They were dried at 110 °C for 24 h and kept under vacuum to avoid the formation of mold. A preliminary elemental analysis (averaged values of five samples) gave the results reported in Table 1. It is notable that there is a good agreement with the X-ray fluorescence (XRF, Figure S1) and literature data [58] showing that sample A had a better energy value compared with R, having higher “H:C” ratio and lower “O:C” ratio, as suggested for the correlation of higher hydrogen and carbon content to the heating value of biomass material [59].
Then the samples were washed with water, ethanol, or hexane to remove impurities and organic compounds. The ethanol and hexane solutions were analyzed by gas chromatography-mass spectrometry (GCMS): they showed the presence of caffeine and methyl- and ethyl-ester-derivatives of palmitic and stearic acids, in a larger extent in the ethanol extract. (Figure S2).

2.2. Preparation of Activated Carbons

The washed powders (typically 10 g) were pyrolyzed under nitrogen (flow rate 100 or 150 mL/min) from room temperature to the final one (heating rate 20 °C/min) for 2 h in a horizontal stainless-steel reactor in the presence of activator agents as scheduled in Table 2. After cooling, the resulting RACs (Robusta Activated Carbons, from Robusta) and AACs (Arabica Activated Carbons, from Arabica) samples were washed with a 0.1 M HCl solution, followed by hot distilled water until neutrality. The ACs were collected, dried at 110 °C for 24 h and kept in tightly closed bottles for further analyses. All the data were compared with those of three commercial activated carbons used in industrial adsorption processes (Samples M, C, and LP39).

2.3. Textural and Chemical Characterization

The textural properties of the samples were studied by N2 adsorption at 77 K with a static volumetric instrument (ASAP2020 or ASAP2010, Micrometrics) over a wide relative pressure range from about 10−6 to 0.998 (p/p0). Prior to the analysis, all the samples were degassed at 353 K for 18 h under vacuum to completely remove any trace of adsorbed water. The specific surface area of the samples was assessed by the standard Brunauer–Emmett–Teller (BET) method (software available in the instruments), using N2 adsorption data in the relative pressure ranging from 0.001 to 0.35, and by applying the Density Functional Theory (DFT) Plus Software provided by Micrometrics. The total pore volume was estimated from the amount of nitrogen adsorbed at a relative pressure of about 0.98. Pore size distributions (PSDs) were calculated by using the Barret–Joyner–Halenda algorithm for mesopores (2–50 nm) using the desorption branch.
Magic angle spinning-solid state nuclear magnetic resonance (MAS-NMR) experiments were collected on a Bruker AVANCE III spectrometer 300 (magnetic field of 7.0 T corresponding to 13C Larmor frequencies of 75.468 MHz) equipped for solid-state analysis with 4 mm diameter zirconia rotors and Kel-F caps. The magic angle (MA) was accurately adjusted prior to data acquisition using KBr. 13C chemical shifts were externally referenced to solid adamantane at 38.48 ppm (in relation to tetramehtylsilane, TMS). Both 13C MAS and 13C cross-polarization (CP-MAS) spectra were collected. For CP-MAS, the solid-state 13C{1H} nuclear magnetic resonance spectra were recorded using the combination of cross-polarization, proton decoupling and magic angle spinning. Rotation at the magic angle at a frequency of 8/10 KHz was used in 13C CP-MAS measurements (see supplementary); duration of proton π/2 pulses 4 μs, 1H–13C contact time 2 ms, interval between pulses D1 (see supplementary). 13C–1H dipolar interactions were suppressed via proton decoupling with the corresponding proton resonance frequency (300.13 MHz). Rotation at MA of 10/12 kHz was used for 13C MAS (see supplementary) with an interval between 13C pulses of 15 s.
Thermogravimetric analysis (TGA) and differential thermal analysis (DTA) of the samples were conducted with an SDT Q600 TA instrument under air, from 30 °C up to 1000 °C at a heating rate of 10 °C/min or with a Netzsch STA 449 F1 Jupiter Thermal Analyzer on Al2O3 crucibles, heating from 25 °C to 1000 °C at 10 °C/min under N2 atmosphere (100 mL/min). Data were processed via Netzsch Proteus Thermal Analysis software.
X-ray diffraction (XRD) spectra were recorded to characterize samples using a PANalytical X’Pert Pro diffractometer equipped with a Co X-ray tube and a real-time multiple strip (RTMS) detector (X’Celerator).
X-ray photoelectron spectroscopy (XPS) was carried out by means of a Perkin Elmer PHI 5600ci Multi Technique System, using AlKα radiation (1486.6 eV) working at 250 W. The spectrometer was calibrated by assuming the binding energy (BE) of the 4f 7/2 line to be 84.0 eV with respect to the Fermi level. Both extended and detailed spectra were collected. The standard deviation in the BE value of the XPS line is 0.1 eV. the atomic percentage, after a Shirley-type background subtraction was evaluated by using the PHI sensitivity factors. The peak positions (referred to NIST database) were corrected for the charging effects by considering the C 1s peak at 285.0 eV and evaluating the BE differences.
Fourier transform infrared spectroscopy (FTIR) spectra of coffee and carbon powders were obtained on a Nicolet spectrophotometer Avatar 320 as KBr pellets. For each sample 32 scans were recorded in the range 4000–400 cm−1 in the transmittance mode with a resolution of 4 cm−1.
Raman spectra were recorded using a continuous wave linearly polarized (514.5 nm wavelength, 2.41 eV, 16 mW power. The laser beam was focused by a 100× objective lens, resulting in a spot of about 1 μm in diameter.
The morphology of the samples was studied by environmental scanning electron microscopy (ESEM, Quanta 200 FEI) and a semi-quantitative composition was achieved by the XRF embedded. Selected samples were investigated also by transmission electron microscopy (TEM) using a TECNAI FEI G2 microscope by dispersing the powdered AC in deionized water and depositing a drop of the suspension on a carbon-coated copper grid. The PACs (powdered activated carbon) skeletal density was measured by a helium pycnometer (Multivolume Pycnometer 1305 by Micromeritics), obtaining the values reported in Table 3.
The surfaces of some AC samples were chemically characterized by Boehm titration carried out according to the procedure reported in the literature [60]. 0.25 g of activated carbon were mixed with 25 ml of different solutions: 0.1 M HCl, 0.1 M NaOH, 0.1 M NaHCO3, and 0.05 M Na2CO3. The solutions were kept under magnetic stirring (800 rpm) for 24 h, at ambient temperature (20 ± 2 °C). The activated carbon was removed by filtration and 10 ml of the filtered solutions were titrated with 0.1 M NaOH solution (for HCl) or 0.1 M HCl solution (for NaOH, NaHCO3, and Na2CO3), using the Tashiro indicator. The number of acidic sites was determined under the following assumptions: NaOH neutralizes carboxyl, phenolic, and lactonic groups; Na2CO3 neutralizes carboxyl and lactonic groups and NaHCO3 neutralizes only carboxyl groups. The number of basic sites was calculated from the titration of HCl solution with NaOH.
The point of zero charge (PZC) of some activated carbons was determined using the solid addition method according to the literature [61]. Different flasks were prepared with 50 ml of 0.1 M KNO3 solution and 0.1 M HCl or 0.1 M NaOH solutions, added dropwise to reach pH 2, 4, 6, 8, 10, and 12. The pH value was recorded for each flask (pH0). We added 1 g of activated carbon to each flask and the solutions were mixed under magnetic stirring (800 rpm) for 48 h at ambient temperature (20 ± 2 °C). The activated carbon was removed by filtration and the pH of the filtered liquid solution recorded (pHf) for each sample. The difference between the final and the initial pH (ΔpH = pHf − pH0) was plotted against pH0. The PZC corresponded to ΔpH = 0, which is the intersection of the resulting curve with the x axis (Table 3).

3. Results and Discussion

3.1. Characterization of the Starting Spent Coffee Grounds

In Figure 1 the 13C-MAS NMR of the washed raw material SCG Arabica has been reported indicating the presence of different compounds in agreement with the literature data [54,62]: saturated and unsaturated chains (signals in the ranges 14–35, 60–80 ppm, 130 ppm, and 160–180 ppm due to hydrocarbons and fatty acids) together with carbohydrates, sugar moieties present in chlorogenic acid (CLA) and its derivatives (signals in the 60–100 ppm range), and signals attributable to caffeine (CF) (13C-CP MAS of caffeine is reported in Figure S3) [11,63]. The solid state 13C NMR of sample R is reported in Figure S3 (13C MAS NMR chemical shifts are collected in Table S1).
The FTIR spectra of raw sample A has been reported in Figure 2. In the region 3600–3200 cm−1 broad absorptions of –OH and –NH functional groups of carboxylic acids and amine groups in caffeine and proteins could be observed. The strong absorptions at 2924 and 2854 cm−1 were due to asymmetric and symmetric stretching of C-H bond in aliphatic chains of caffeine, lipids and hydrocarbons, and the band at 1440 cm−1 was due to the bending of the same moieties. The sharp band at 1743 cm−1 was attributed to the C=O absorption in aliphatic esters or triglycerides, while the band at 1660 cm−1 could be assigned to C=C vibration of lipids and fatty acids, and to carbonyl stretching of lignin. The band at 1523 cm−1 could be ascribed to C=C vibration of lignin. The bands at 1058, 1113, 1167, 1244 and 1376 cm−1 could be attributed to chlorogenic acids which include esters formed by quinic acid and some trans-cinnamic acids. Axial C-O deformation of the chlorogenic, caffeic and coumarinic acids occurred in the range 1085–1050 cm−1. The absorptions at 1446, 1378, and 897 cm−1 could be attributed to β-linkage in cellulose [54,62]. The similarity of the spectra of the raw R and A materials, in particular the absence of the signals in the range 1724–1705 cm−1 of aliphatic or aromatic acids and ketones indicated that both SCGs derived from coffee roasted in similar thermal conditions [64].

3.2. Thermal Behavior of Raw Materials A and R and of the A,R/KOH 1/1 Mixtures

In Figure S4a,b the combined TG and derivative (DTG) profiles of samples R and A in the range 30–920 °C under air, and in Figure 3a,b, under nitrogen, have been reported, showing the thermal degradation characteristics of the samples at a heating rate of 10 °C/min. Under nitrogen a loss of residual moisture of about 5% was observed (at 95 °C for R and 108 °C for A). In the range from 200 to 400 °C, numerous weight losses (approximately 70% w/w for both A and R) originated by the primary pyrolysis of the SCGs and the formation of a carbonaceous material, with CO and CO2 evolution and various dehydration reactions of the original biopolymers and/or dehydration of the pyrolysis vapors from removal of -OH groups were observed. The three peaks indicative of the decomposition of hemicellulose (about 300 °C), cellulose (about 330 °C) and lignin (about 384 °C) were evident in the profile of both samples. The removal of -OCH3 groups from the lignocellulosic structure was associated with the production of CH4 during pyrolysis: the evolution of H2, CH4, C2H4, and C2H6 has been reported to start from about 250 °C and continue during complete degradation of the matrix. The burnout was about 450 °C for both samples with the formation of a solid residue of about 23% w/w (TG and DTG data of samples A, R, A/KOH, and R/KOH are available in Table S2) [52,59,62,65,66,67].
In both cases most of the material loss was observed at about 380 °C. Thus, in a separate experiment the A raw material was heated at 380 °C for 6 h under nitrogen: the brownish oil residue formed was dissolved in acetone and a GC/MS analysis showed the presence of methyl and ethyl esters of palmitic and stearic acid together with a lower amount of caffeine (Figure S5a). From the experiment also a black material was achieved, formed by a spongy and a powder fraction, whose morphology has been reported in Figure S5b (the C content was about 85%).
In Figure 3c,d, the TG and DTG profiles of the mixtures R/KOH 1/1 and A/KOH 1/1 have been reported: they were completely different from those of R and A, alone, with a sequence of different degradation and loss processes. On the basis of the data reported in the literature [59,65,66,67] we could divide the thermal degradation of the mixtures into four steps: in the first one, ranging from ambient temperature to about 150 °C, a weight loss of 10–15% occurred due to water and initial H2 evolution; in the second step, from 150 to 350 °C, with a weight loss of 15–20%, the initial formation of C2 hydrocarbons and CH4 and of water from dehydration of biopolymers could occur together with the initiation of carbonization; increasing the temperature in the range 350–800 °C, a weight loss of about 25% was observed due to evolution of CO, CO2, CH4, C2H4, and C2H6 originated by the C–C and C–H bonds break to give radicals which can be recombined into small molecules, during the aromatization of the matrix and carbonization which can be completed at about 600 °C. In this frame, further studies will be carried out by TG–MS either changing the mixture composition and the heating rate. In the range 800–900 °C the completion of the aromatization occurred.

3.3. Chemical Characterization of the Activated Carbons

As reported above, a series of activated carbons have been prepared from two different spent coffee grounds through pyrolytic process at different temperatures and in the presence of different activator agents (i.e., KOH, K2CO3, ZnCl2, NaHCO3) according to Scheme 2. The characterization of the ACs was carried out using different analytical techniques able to determine chemical, physical, and morphological properties, and the data were compared with those of three commercial carbons used in water decontamination plants.

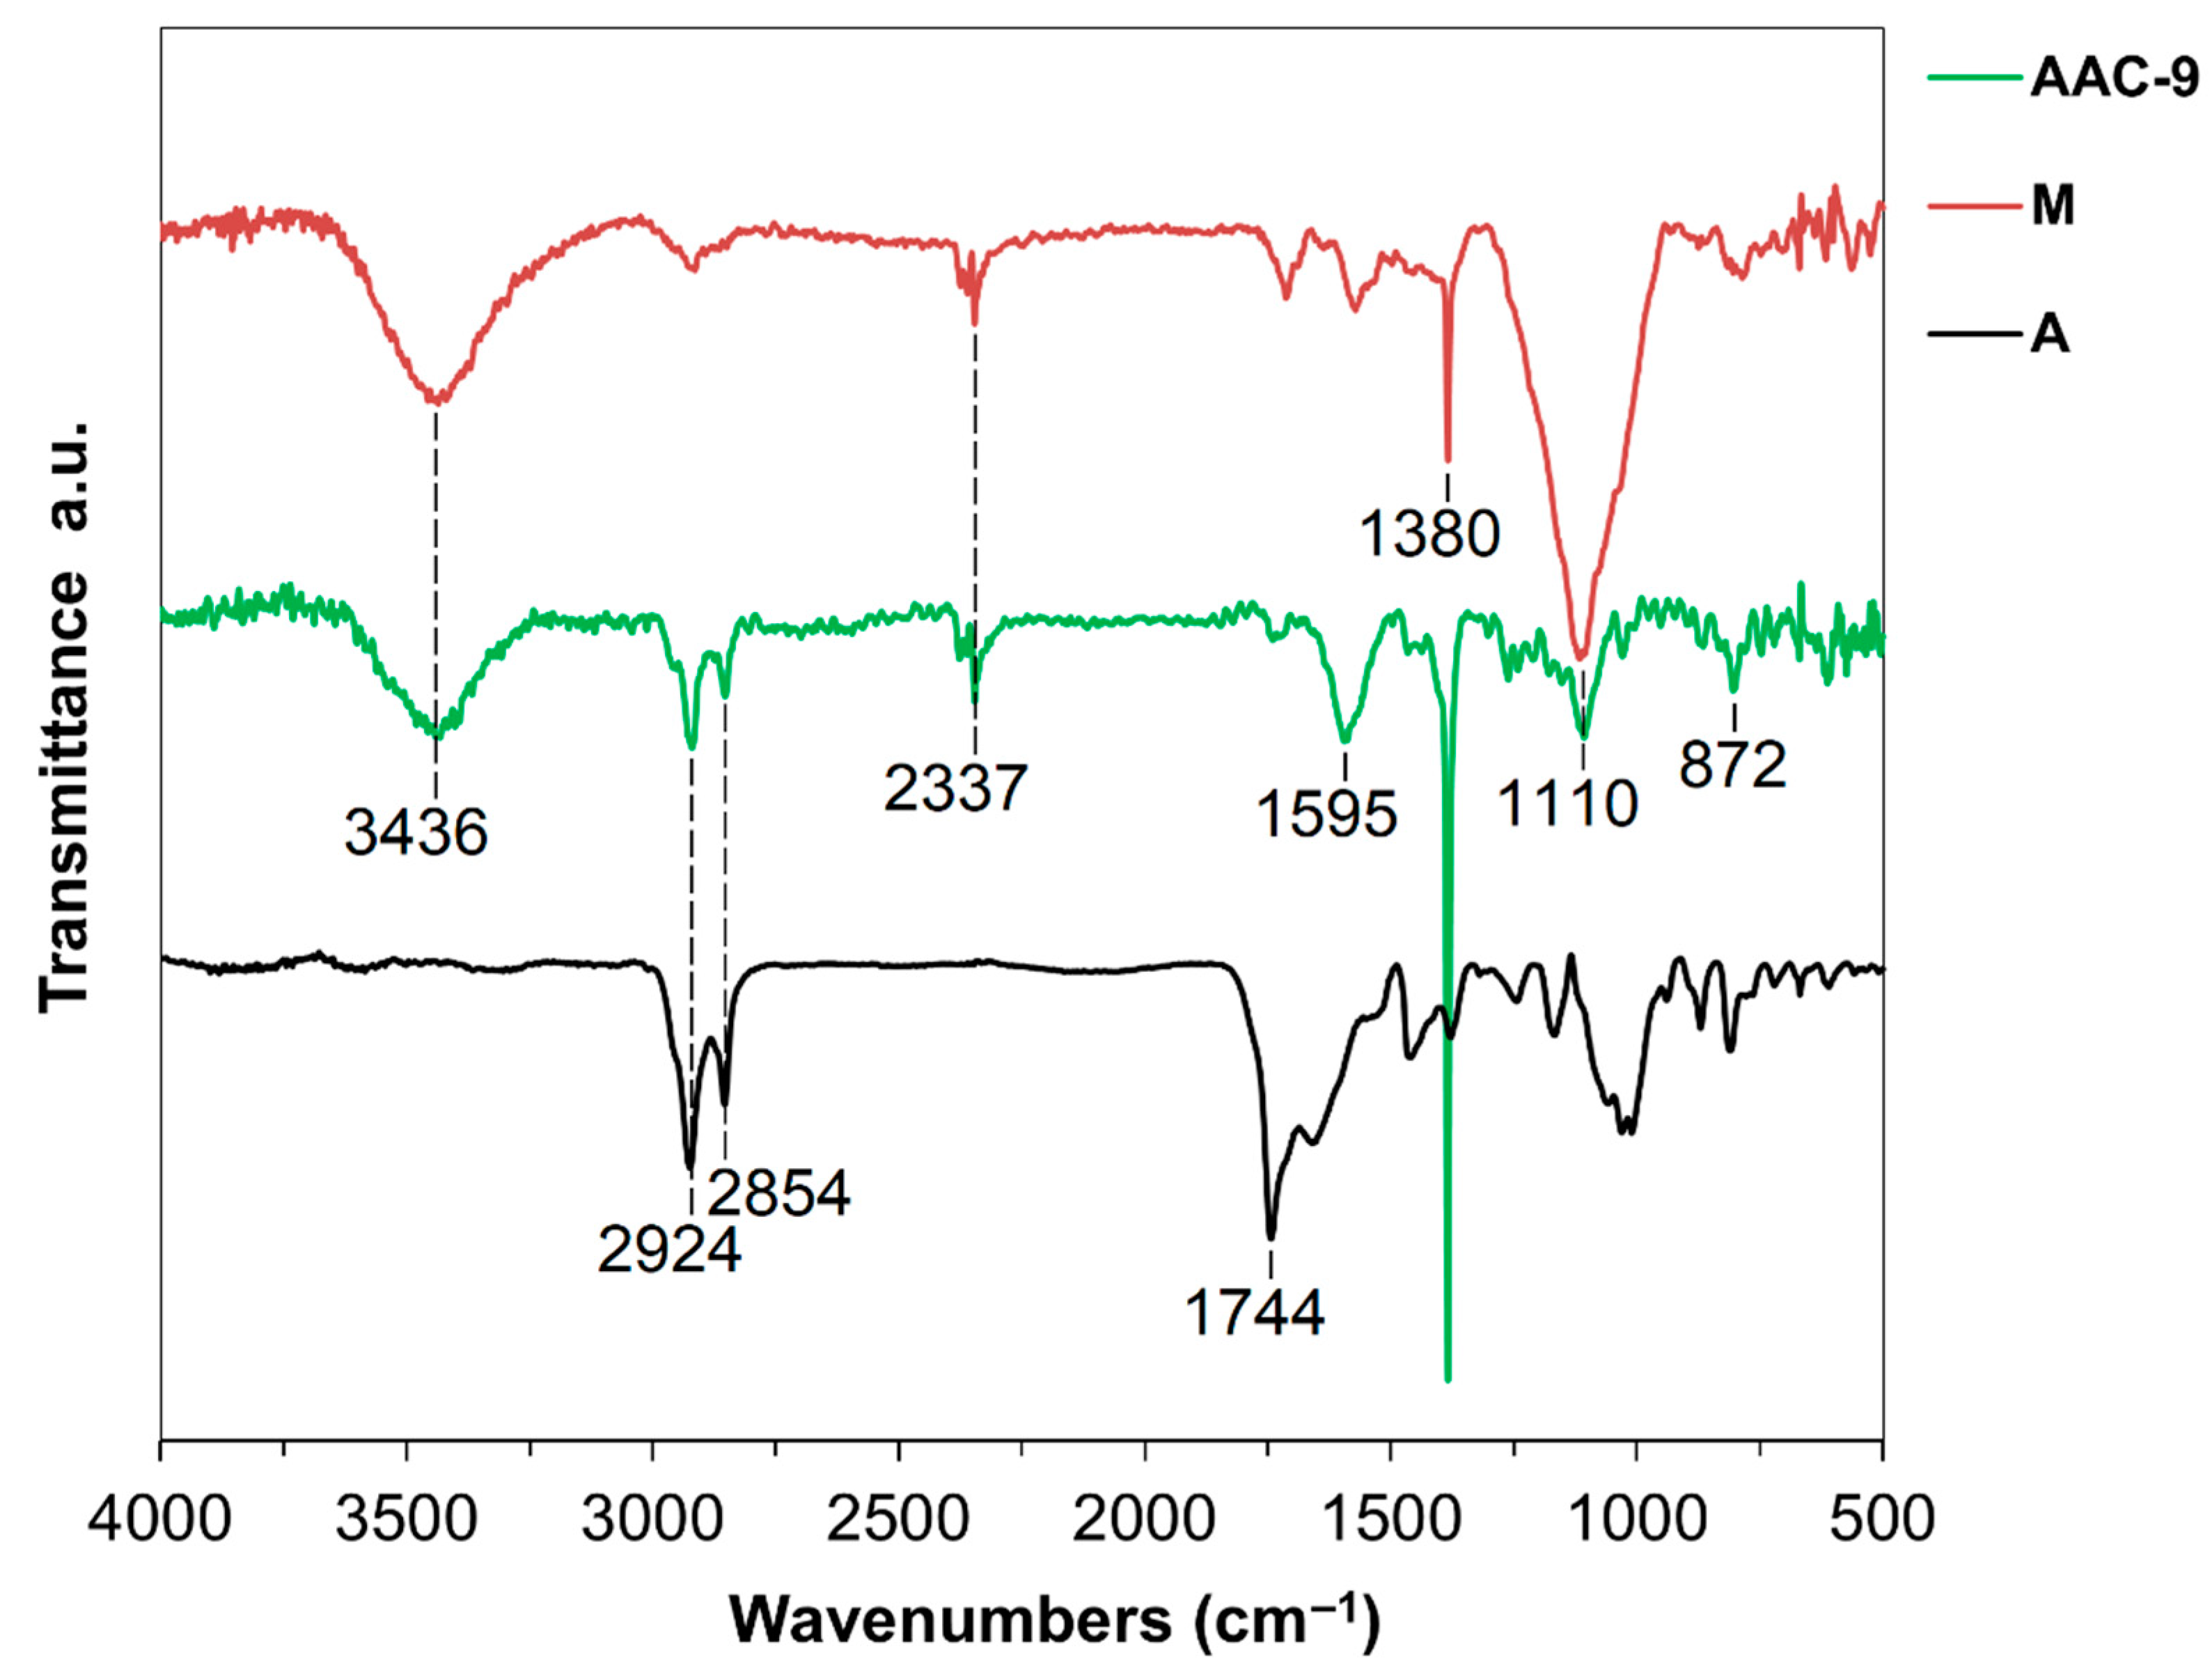
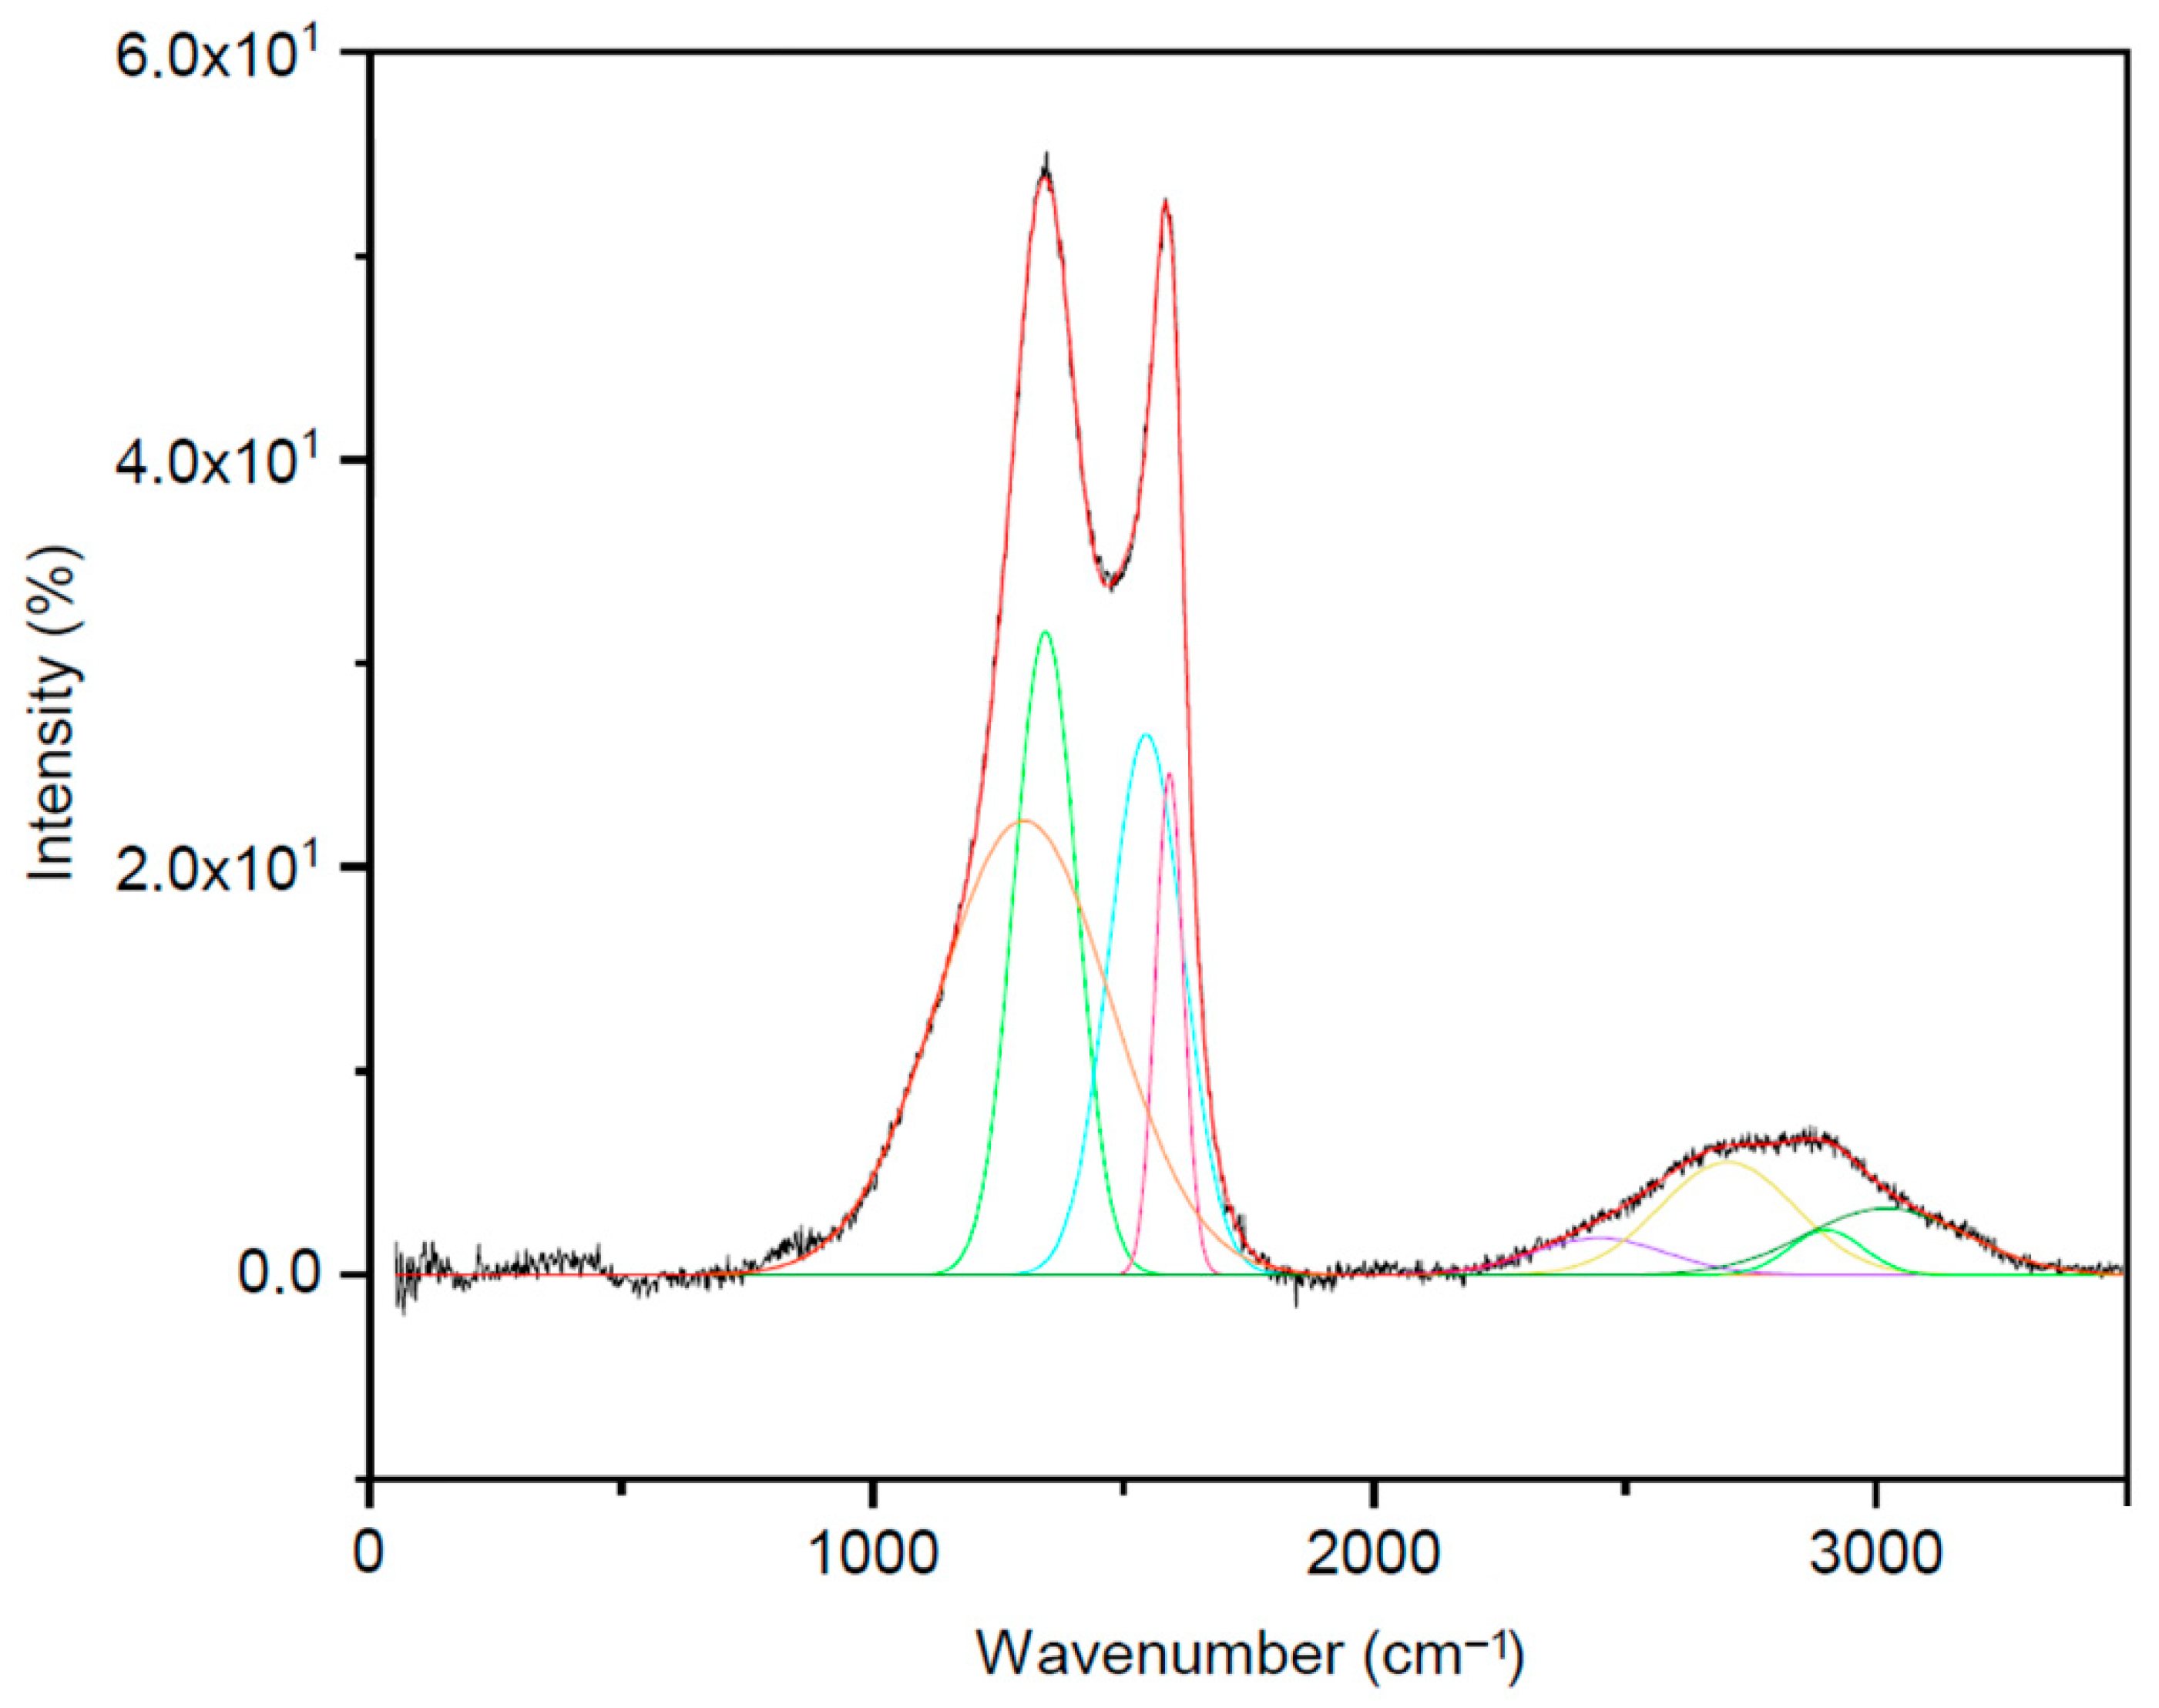
3.3.1. Fourier Transform Infrared (FT-IR) and Raman Data
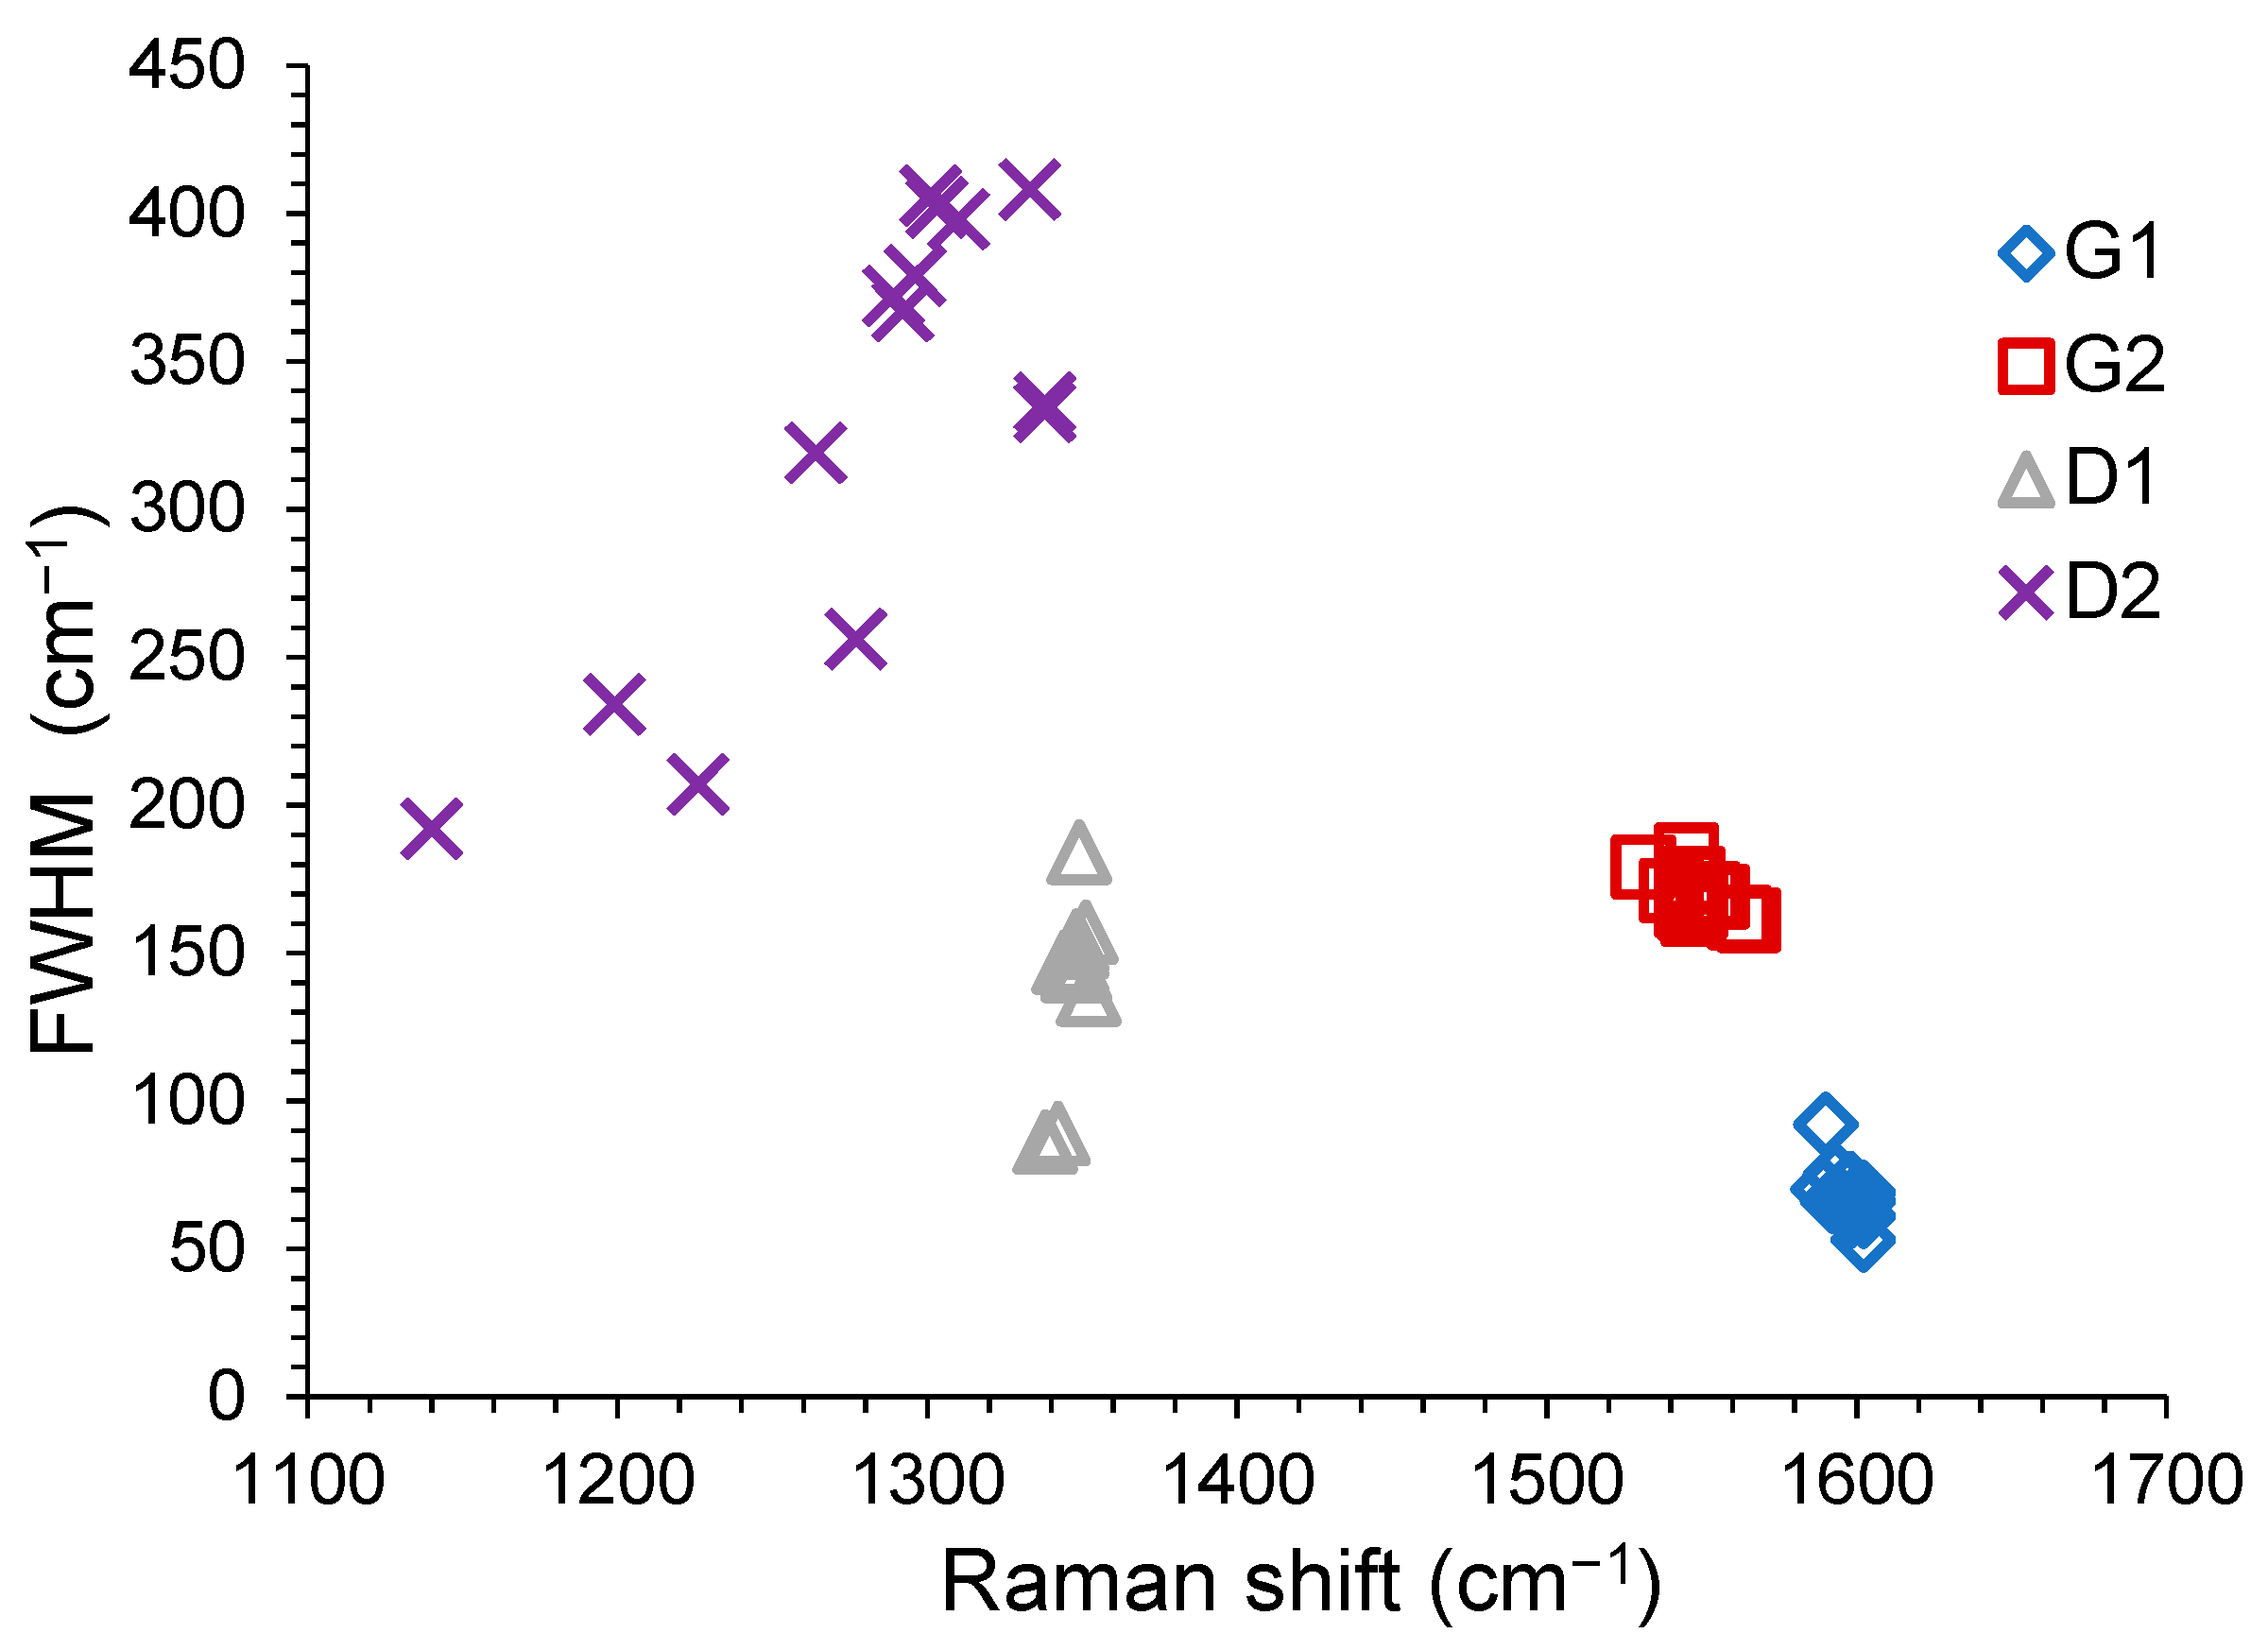
Significant changes were observed in the RACs and AACs FT-IR spectra (Figure 2) with respect those of the starting SCGs. The FT-IR spectra of the carbons (in Figure 2 the FT-IR spectrum of the commercial M sample was reported, too) showed no significant peaks in the νC-H region, indicating that organic compounds were degraded or removed from the char during the heating process. New bands were observed at about 3400 and 1080 cm−1 assigned to O–H and C–OH stretching of phenolic groups, respectively, due to the alkaline treatment. In addition, carbon skeleton vibrations characteristic of ACs in the 1600–1400 cm−1 region could be observed [68,69,70].
To achieve deeper information concerning the carbonization degree and the microstructure of the ACs, a detailed analysis of the Raman spectra has been carried out. All the Raman spectra (Figure S6) showed [71,72,73,74,75,76,77] signals in two distinct regions: (a) the defect-derived peak centered at about 1350 cm−1 related to a disordered (amorphous) carbon structure (the D-band, related to the K-point phonons of A1g symmetry, indicating the disorder in the breathing mode of the 6-fold aromatic ring near the basal edge) and the graphite structure-derived (G-band, related to the zone center phonons of E2g symmetry) peak centered at about 1570 cm−1 indicative of a hexagonal carbon structure; and (b) a broad absorption centered at about 2800 cm−1, the 2D or G’ band, related to the interactions between the stacked graphitic layers. In Figure 4, the Raman spectrum of the AAC-6 sample has been reported together with the deconvolution of the signals with the components of the bands, which could give useful structural information.
In Table S3 the parameters obtained from fitting two Gaussians as G and D bands to the Raman spectra of the ACs samples have been reported together with the peak intensity ratio ID/IG which indicates the carbonization degree and the amount of defective (amorphous) carbon structures induced by activation. The higher the ID/IG value, the higher the distortion of sp2 rings in the material [71,72,73,74,75,76,77].
In Table S4 the fitting parameters obtained from further deconvolution of the G and D bands have been reported together with the peak intensity ratio ID1/IG1, ID2/IG2 and IG2/IG1 which can give information concerning the size of the basal plane, the relative sp2/sp3 bonding ratio and a relative content of the bond angle disorder in AC materials.
A similar treatment has been devoted to the signals in the Raman spectra in the 2D region, as shown in Figure 4 and reported in Table S5.
Much structural information can be obtained from the Raman spectra. The activated carbons can be schematically considered formed by two structural parts: one is winding short basal plane with bond angle order represented by a pair of sharp G1 and D1 bands, and the other is sp2-cluster like amorphous-carbons with bond angle disorder represented by a pair of broad G2 and D2 bands. Some correlations have been proposed in the literature [72,73] and have been studied for our samples, too.
In Figure 5, where ν and FWHM of all the samples have been reported, we could observe that D1, G1 and G2 were in well-defined domains, while D2 resulted more distributed:
(a)
the G1 position is quite stable: for RACs in the range 1589–1599 cm−1 (FWHM of 66.5 ± 3.5 cm−1) and for AACs in the range 1592–1603 cm−1 (FWHM of 68 ± 7 cm−1);
(b)
the D1 position is quite stable: for RACs in the range 1342–1352 cm−1 (FWHM of 140.5 ± 13.5 cm−1) and for AACs in the range 1344–1354 cm−1 (FWHM of 164 ± 20 cm−1);
(c)
the G2 position is less stable and the signals are broader: for RACs in the range 1531–1555 cm−1 (FWHM of 174.5 ± 4.5 cm−1) and for AACs in the range 1540–1565 cm−1 (FWHM of 172 ± 11 cm−1);
(d)
the D2 position is significantly less stable and the signals are broader: for RACs in the range 1140–1350 cm−1 (FWHM of 272 ± 80 cm−1) and for AACs in the range 1199–1333 cm−1 (FWHM of 321 ± 87 cm−1).

3.3.2. X-ray Diffraction (XRD) and X-ray Photoelectron Spectroscopy (XPS)

Microstructures of ACs were analyzed via XRD. The XRD pattern (some of them have been reported in Figure 6, and the other in Figure S7) of all the ACs samples exhibited two very broad bands at about 24° and 43° corresponding to planar graphite (002), indicating the degree of carbon layer stacking and (100) indicating the degree of ordered hexagonal carbon structures, respectively. The extreme broadening of the (002) peak indicated a carbon layer exfoliation via potassium during the pyrolysis process, particularly for samples RAC-1, AAC-1, AAC-6 compared with the XRD spectrum of the commercial C sample.
The broadening increases with an increase in specific surface area [43], even if no good correlation have been detected between BET and XRD data for all our samples. Upon KOH activation the diffraction peaks for (100) had a smaller effect than the diffraction peaks for (002). The average interlayer dspacing 002 (from 0.37 to 0.39 nm) and average crystalline diameter Lc were calculated from the diffraction patterns (Table 4).
The surface properties of the ACs samples were characterized via X-ray photoelectron spectroscopy spectra, and as shown in Figure S8 for some samples the signals have been deconvoluted to achieve the data reported in Table 5 and Table 6, for C 1s and O 1s, respectively. In the XPS C 1s spectra, C–O were centered at 285.8 eV, C=O at 286.7 eV and C(O)O at 288.1 eV with a main C=C bond centered at 284.4 eV; this position decreases towards lower values (around 283.9–284.0 eV) for nanometric sized particles. For some samples a signal at 290.1 eV was observed, which can be attributed to carbons in a carbonate environment, in agreement with the presence of an absorption at 872 cm−1 in the FT-IR spectra, characteristic of carbonate moiety [78]. Additionally, C=O and C–O bonds centered at 532.2 eV and 531.0 eV, respectively, were evident in the O 1s spectra. The N 1s signal is not always detectable and is characterized by a low W/N ratio. The peak centroid, however, ranges around 399.5 eV, consistently with the presence of pyrrolic species [57]. It is noteworthy that the compositional data from the XPS measurements agree with the results achieved by elemental analysis and XRF (Table S6) [79].
It is observed that carbon structures were manly composed of major C=C bonding and minor C–C. No adsorbed water on the ACs surfaces was observed in O 1s spectra.

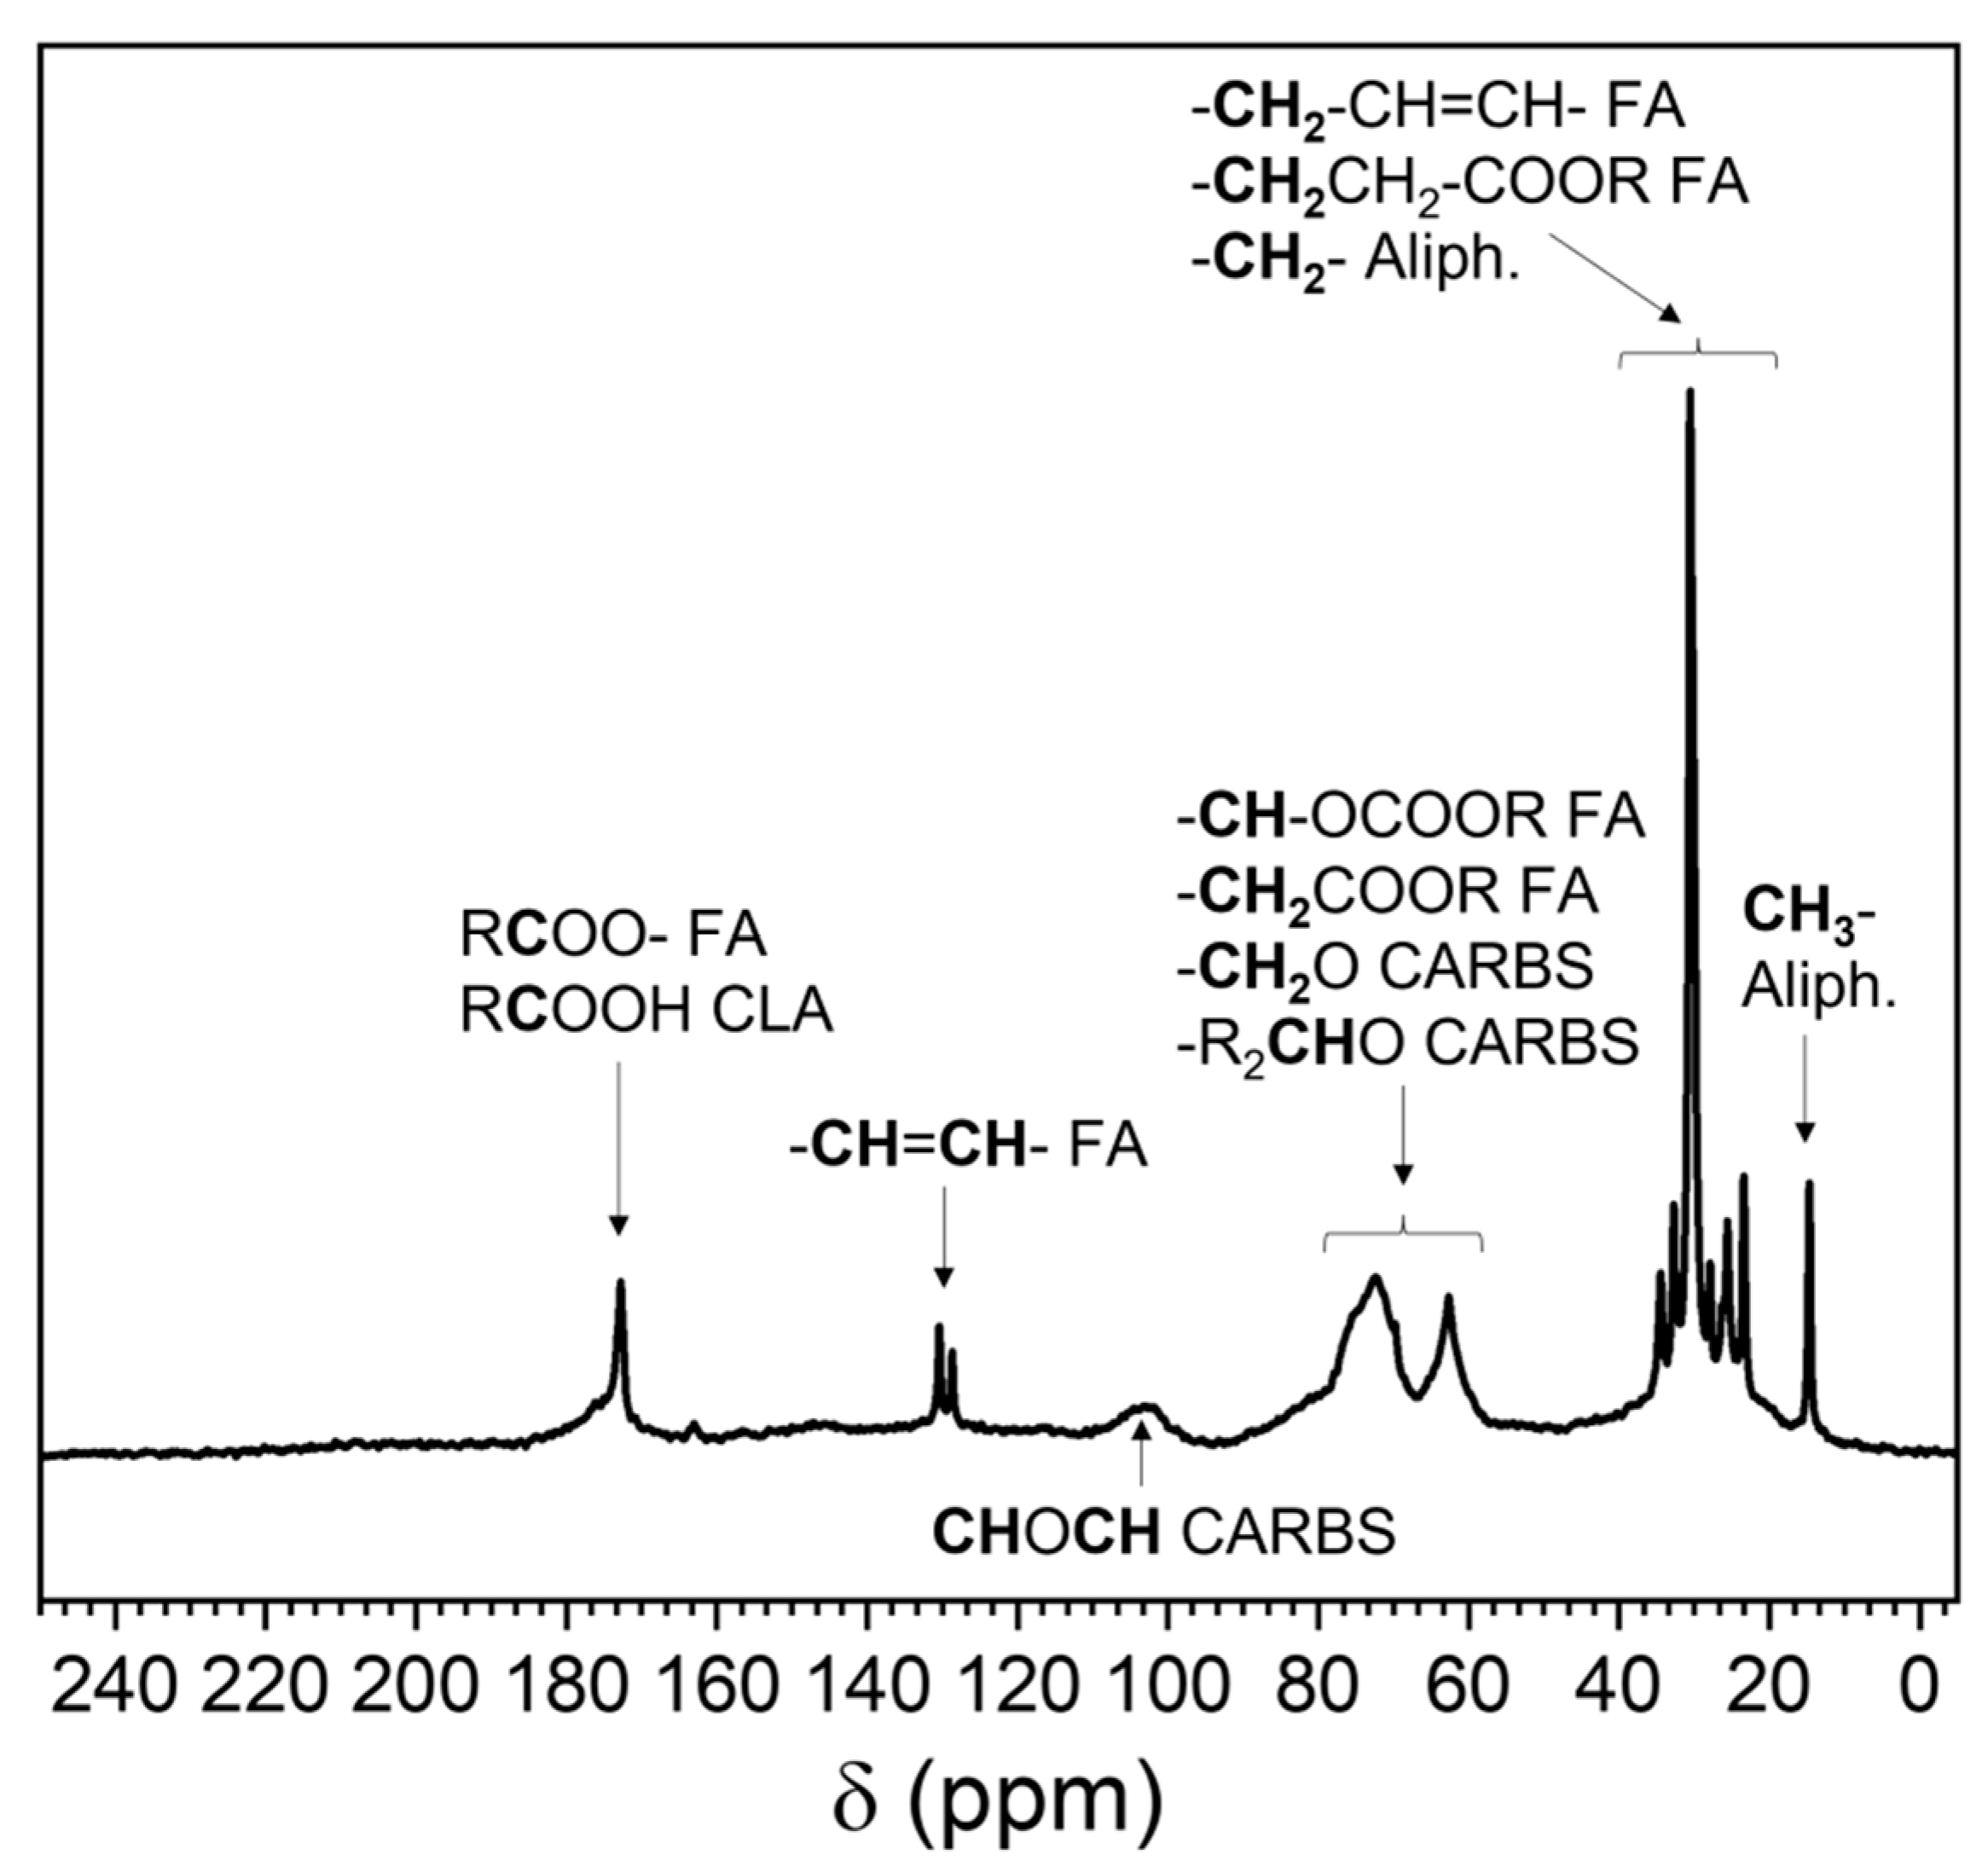
3.3.3. 13C Nuclear Magnetic Resonance (NMR)

The 13C NMR in the solid state of the activated carbons prepared reported in Figure S9, showed that the structure of the raw materials was completely transformed into a polycyclic material exhibiting the typical aromatic broad signal centered at about 125–130 ppm [80,81,82].
It is noteworthy that for samples AAC-9, M and C it was not possible to tune the 1H NMR frequency, thus 13C MAS-NMR spectra were not 1H-decoupled. This effect was tentatively attributed to the presence of a high amount of adsorbed oxygen, but after long and repeating degassing processes of the samples the effect was still present. For this reason, it was explained with a conductive behavior of the samples, which was measured for columns (piston diameter 5.9 mm; column height before pressure 19 mm for M, 25 mm for C and 33 mm for AAC-9) of the samples under different applied pressures. The effect was cited in the literature, and will deserve further investigation in our samples, for application of activated carbons in electrochemical devices (Figure 7) [83,84]. It could be observed that the δ value for AAC-10 resulted significantly lower than that of the AAC-9, M and C, samples.

3.3.4. Surface Chemistry Characterization

Table 7 shows quantitative surface chemical analyses in terms of amount of acid and basic functional groups of ACs. There is a slight predominance of acid or basic groups depending on the preparation. The presence of phenolic groups agrees with the FT-IR and XPS data [60,85,86,87]. In the case of the tested samples prepared in the presence of KOH as activating agent (AAC-5, -6, -7, -9), the predominance of basic moieties can be observed. Note the different behavior of the commercial samples, reasonably obtained under different experimental conditions.

3.4. Physical and Textural Characterization

3.4.1. Brunauer–Emmett–Teller (BET) Analysis and Pore Size Distribution

In Figure S10 selected N2 absorption isotherm profiles have been reported, and the specific surface area data are shown in Table 8. The curves for the series RAC and AAC show similar trends, with type I shape, typical of microporous materials, as evidenced by the steep adsorption increase at low pressure. In fact, the mesopore fraction is quite low with respect to the micropore amount, as evidenced by the ratio Vm/Vtot where Vm is estimated as Vtot − Vμ (Vμ derived from t-plot regression), as previously reported for KOH activated carbon from waste coffee beans. [88] Nevertheless, the BJH model has been applied to the desorption branch to derive the pore size distribution of this small fraction of mesopores and in the sample RAC-3 the distribution is structureless and a maximum is not visible, while for AAC-9 it is found at around 4 nm. In the case of LP39 (a commercial activated carbon of unknown preparation), the isotherm belongs to type IV, showing both the steep adsorption in the low-pressure regime, indicating micropores, and the hysteresis loop typical of mesoporous materials. The fraction of mesopores over total pores is 70% and the pore size distribution has a maximum at 9 nm.
Considering the specific surface area, it was observed that the highest values have been obtained through processes carried out at 800 °C in the presence of NaHCO3/CH3COOH. In the case of activation with KOH, in agreement with the data reported in the literature [57,89], the highest BET value can be achieved by pyrolysis of SCGs at 700 °C, even without a preliminary treatment with KOHaq.
The nature of the activator and preparation conditions strongly influence the final physical, chemical and morphological properties of activated carbons from biomasses [90]: of specific relevance is the tuning of the experimental conditions to achieve hierarchically mesoporous/microporous carbon materials [91,92] due to the wide variety of possible applications.

3.4.2. Environmental Scanning Electron Microscopy (ESEM) and Transmission Electron Microscopy (TEM)

ESEM images of the raw material A and of the AAC-5, AAC-6 and AAC-7 have been reported in Figure 8. Progressive surface changes can be observed. The surface of the raw material is homogeneous without any porous structure. Nevertheless, major surface damage appeared when the raw material was carbonized due to the release of volatile compounds, with a porosity strongly depending on the experimental conditions, temperature, and activator agent, as indicated by the BET values and textures (Figures S10 and S11), with the formation of holes and channels, in agreement with the microporous nature of the samples [93].
The TEM images of some samples are reported in Figure S12. The non-uniformity of light transmittance confirms that all samples possess a diversity of pore structures randomly distributed, consistent with ESEM results. The observation that in AAC-5 only a few graphitic layers are visible at the edges of the porous structure, while in AAC-6 and AAC-7 they are more numerous and more extensive, indicates a graphitization and exfoliation level that depends on the temperature.

3.5. General Considerations on Characterization Data and Correlations

In this paper we would try to evidence possible correlations between the data obtained from different measurements which observe the same property but from different points of view.
It is noteworthy that, even if it was not possible establish a direct correlation, by considering the data relative to the samples with BET value higher than 1000 m2/g, the set of ID1/IG1, ID2/IG2 and IG2/IG1 have quite similar values ranging between 2.2–2.9 (average value 2.7 ± 0.5), 1.4–2.1 (average value 1.8 ± 0.4) and 2.0–2.8 (average value 2.4 ± 0.4), respectively (Table S4).
Some trends can be observed between the ID/IG values from Raman spectra and the pores diameter for the samples which developed a value higher than 1000 m2/g (Figure S13a) and similarly by considering the samples with lower BET values, where we could suggest that the porosity has been only partially developed (Figure S13b). A trend can be seen also between the ID/IG values and the specific surface area value for the same samples (Figure S14).
A good correlation can be achieved by considering BET values and the Vt, even if the data concerning the samples with lower BET values appear to be more scattered (Figure 9). The data concerning LP39 have not considered here, showing a completely different morphology and porosity in the ESEM images (Figure S11).
Again, a good correlation can be obtained between the ID/IG ratio derived from the Raman spectra and the sp2/(sp2 + sp3) values obtained by XPS data (Figure 10), considering only the samples which developed a specific surface area higher than 1000 m2/g (except LP39).

4. Conclusions

In conclusion, we observed that, for the series of activated carbons here reported, the experimental data can be correlated with the preparation method and that the results achieved from different measurement techniques can in principle be correlated with each other. Further and deeper studies will be necessary to better understand these correlations with the aim of previewing, for instance, an approximate specific surface area from Raman or XRD measurements. It was not possible to extend this approach to the numerous data in the literature, since not all the data and the necessary details are usually reported in the papers.
Research is ongoing to prepare other samples, starting from different biomasses and by using different activating agents such as Na2CO3 or NaHCO3, with the aim to explain more deeply, from the theoretical point of view, these empirical correlations, and to discover other relationships that will deepen understanding of the morphology of carbonaceous materials.

Supplementary Materials

The following are available online at www.mdpi.com/2227-9717/9/9/1637/s1, Figure S1: ESEM data of the starting SCGs; Figure S2: GC MS analysis of the EtOH mother liquors after washing spent coffee grounds from Arabica; Figure S3 (a): 13C HPDEC NMR spectrum in the solid state of caffeine; Figure S3 (b): 13C HPDEC NMR spectrum in the solid state of R and A samples; Table S1: 13C MAS Chemical shifts; Figure S4: TG and DTG profiles of R and A under air; Table S2: TG and DTG data of samples A, R, A/KOH, and R/KOH 1/1 mixtures in the range 30–1000 °C under nitrogen; Figure S5 (a): GC MS analysis of the acetone solution of the residue after treatment at 380 °C for 6 h under nitrogen of a 1:1 mixture A:KOH; Figure S5 (b): Environmental scanning electron microscopy (ESEM) images of the black powder recovered from treatment at 380 °C for 6 h under nitrogen of a 1:1 mixture A:KOH; Figure S6: Raman spectra of the prepared activated carbons; Figure S7: XRD spectra; Figure S8: XPS spectra: (a) C 1s signal; (b) O 1s signal; (c) N 1s signal; Table S3: Parameters obtained from fitting two Gaussians as G and D bands to the Raman spectra of the ACs samples; Table S4: Parameters in ACs samples obtained from fitting four Gaussians G1, G2, D1 and D2 to the Raman spectra in the region 1000–1600 cm−1; Table S5. Parameters in ACs samples obtained from fitting four Gaussians G*, G’’, D+D’ and 2D’ to the Raman spectra in the region 2300–3200 cm−1; Table S6. Elemental composition (% w/w) of the ACs from XPS data compared with elemental analysis and EDX data; Figure S9: Selected 13C NMR spectra in the solid state of the prepared AC; Figure S10: Selected N2 absorption isotherm profiles together with pore size distribution; Figure S11. ESEM images of the activated carbons at different magnifications; Figure S12: TEM images of the samples AAC-5, AAC-6, and AAC-7, prepared by KOH activation at 600 °C, 700 °C and 800 °C, respectively; Figure S13 (a): Raman ID/IG ratio vs. pore diameter for samples with BET values higher than 1000 m2/g; Figure S13 (b): Raman ID/IG ratio vs. pore diameter for samples with BET values lower than 1000 m2/g; Figure S14: Raman ID/IG ratio vs. specific surface area for samples with BET values higher than 1000 m2/g.

Author Contributions

Conceptualization, P.S., R.B., S.B. (Sara Bogialli), E.M., R.K. and A.P.d.C.R.; methodology, S.B. (Sadjia Benhabiles), E.R.; investigation, S.B. (Sadjia Benhabiles), E.R., A.T., F.V., A.G., F.Z., S.M.C., A.T., S.T. and A.F.; writing—original draft preparation, R.B.; writing—review and editing, P.S. and M.M.; All authors have read and agreed to the published version of the manuscript.

Funding

This research was funded by the Department of Industrial Engineering (DII), University of Padova, TWINNING-2017 research project “Supramolecular transition-metal architectures based on non-covalent interactions for selective molecular sorption and non-linear optics: Rational design and preparation”.

Institutional Review Board Statement

Not applicable.

Informed Consent Statement

Not applicable.

Conflicts of Interest

The authors declare no conflict of interest. The funders had no role in the design of the study; in the collection, analyses, or interpretation of data; in the writing of the manuscript, or in the decision to publish the results.

References

  1. Galanakis, C. Handbook of Coffee Processing By-Products: Sustainable Applications, 1st ed.; Academic Press: London, UK, 2017; Chapters 3 and 9, In Particular. [Google Scholar]
  2. Zabaniotou, A.; Kamaterou, P. Food waste valorisation advocating circular bioeconomy. A critical review of potentialities and perspectives of spent coffee grounds biorefinery. J. Clean. Prod. 2019, 211, 1553–1566. [Google Scholar] [CrossRef]
  3. Campos-Vega, R.; Loarca-Pina, G.; Vergara-Castaneda, H.A.; Oomah, B.D. Spent coffee grounds: A review on current research and future prospects. Trends Food Sci. Technol. 2015, 45, 24–36. [Google Scholar] [CrossRef]
  4. Karmee, S.K. A spent coffee grounds based biorefinery for the production of biofuels, biopolymers, antioxidants and biocomposites. Waste Manag. 2018, 72, 240–254. [Google Scholar] [CrossRef]
  5. Osman, A.I.; Abdelkader, A.; Farrell, C.; Rooney, D.; Morgan, K. Reusing, recycling and up-cycling of biomass: A review of practical and kinetic modelling approaches. Fuel Process. Technol. 2019, 192, 179–202. [Google Scholar] [CrossRef]
  6. Atabani, A.E.; Al-Muhtaseb, A.H.; Kumar, G.; Saratale, G.D.; Aslam, M.; Khan, H.A.; Said, Z.; Mahmoud, E. Valorization of spent coffee grounds into biofuels and value-added products: Pathway towards integrated bio-refinery. Fuel 2019, 254, 115640. [Google Scholar] [CrossRef]
  7. Massaya, J.; Pereira, A.P.; Mills-Lamptey, B.; Benjamin, J.; Chuck, C.J. Conceptualization of a spent coffee grounds biorefinery: A review of existing valorisation approaches. Food Bioprod. Process. 2019, 118, 149–166. [Google Scholar] [CrossRef]
  8. Mussatto, S.I.; Machado, E.M.S.; Martins, S.; Teixeira, J.A. Production, composition, and application of coffee and its industrial residues. Food Bioprocess Technol. 2011, 4, 661–672. [Google Scholar] [CrossRef] [Green Version]
  9. Girotto, F.; Pivato, A.; Cossu, R.; Nkeng, G.E.; Lavagnolo, M.C. The broad spectrum of possibilities for spent coffee grounds valorisation. J. Mater. Cycles Waste Manag. 2018, 20, 695–701. [Google Scholar] [CrossRef]
  10. Stylianou, M.; Agapiou, A.; Omirou, M.; Vyrides, I.; Ioannides, I.M.; Maratheftis, G.; Fasoula, D. Converting environmental risks to benefits by using spent coffee grounds (SCG) as a valuable resource. Environ. Sci. Pollut. Res. 2018, 25, 35776–35790. [Google Scholar] [CrossRef]
  11. Peshev, D.; Mitev, D.; Peeva, L.; Peev, G. Valorization of spent coffee grounds—A new approach. Sep. Purif. Technol. 2018, 192, 271–277. [Google Scholar] [CrossRef]
  12. Nguyen, Q.A.; Cho, E.J.; Lee, D.S.; Bae, H.J. Development of an advanced integrative process to create valuable biosugars including manno-oligosaccharides and mannose from spent coffee grounds. Bioresour. Technol. 2019, 272, 209–216. [Google Scholar] [CrossRef]
  13. Tongcumpou, C.; Usapein, P.; Tuntiwiwattanapun, N. Complete utilization of wet spent coffee grounds waste as a novel feedstock for antioxidant, biodiesel, and bio-char production. Ind. Crop. Prod. 2019, 138, 111484. [Google Scholar] [CrossRef]
  14. Dattatraya Saratale, G.; Bhosale, R.; Shobana, S.; Banu, J.R.; Pugazhendhi, A.; Mahmoud, E.; Sirohi, R.; Bhatia, S.K.; Atabani, A.E.; Mulone, V.; et al. A review on valorization of spent coffee grounds (SCG) towards biopolymers and biocatalysts production. Bioresour. Technol. 2020, 314, 123800. [Google Scholar] [CrossRef]
  15. Tan, M.Y.; Kuan, H.T.N.; Lee, M.C. Characterization of alkaline treatment and fiber content on the physical, thermal and mechanical properties of ground coffee waste/oxobiodegradable HDPE biocomposites. Int. J. Polym. Sci. 2017, 2017, 6258151. [Google Scholar] [CrossRef] [Green Version]
  16. Yoo, J.; Chang, S.J.; Wi, S.; Kim, S. Spent coffee grounds as supporting materials to produce biocomposite PCM with natural waxes. Chemosphere 2019, 235, 626–635. [Google Scholar] [CrossRef] [PubMed]
  17. Chun, Y.; Ko, Y.G.; Do, T.; Jung, Y.; Kim, S.W.; Choi, U.S. Spent coffee grounds: Massively supplied carbohydrate polymer applicable to electrorheology. Colloids Surfaces A Physicochem. Eng. Asp. 2019, 562, 392–401. [Google Scholar] [CrossRef]
  18. Cruz, R.; Mendes, E.; Torrinha, A.; Morais, S.; Pereira, J.A.; Baptista, P.; Casal, S. Revalorization of spent coffee residues by a direct agronomic approach. Food Res. Int. 2015, 71, 190–196. [Google Scholar] [CrossRef]
  19. Elbl, J.; Plosek, L.; Kintl, A.; Prichystalova, J.; Zahora, J.; Friedel, J.K. The effect of increased doses of compost on leaching of mineral nitrogen from arable land. Pol. J. Environ. Stud. 2014, 23, 697–703. [Google Scholar]
  20. Sikka, S.S.; Chawla, I.S. Effect of feeding spent coffee grounds on the feedlot performance of carcass quality of fattening pigs. Agric. Wastes 1986, 18, 305–308. [Google Scholar] [CrossRef]
  21. Mendoza Martinez, C.L.; Alves Rocha, E.P.; Oliveira Carneiro, A.C.; Borges Gomes, F.J.; Ribas Batalha, L.A.; Vakkilainen, E.; Cardoso, M. Characterization of residual biomasses from the coffee production chain and assessment the potential for energy purposes. Biomass Bioenerg. 2019, 120, 68–76. [Google Scholar] [CrossRef]
  22. Nguyen, H.C.; Nguyen, M.L.; Wang, F.M.; Juan, H.Y.; Su, C.H. Biodiesel production by direct transesterification of wet spent coffee grounds using switchable solvent as a catalyst and solvent. Bioresour. Technol. 2020, 296, 122334. [Google Scholar] [CrossRef]
  23. Dohlert, P.; Weidauer, M.; Enthaler, S. Spent coffee ground as source for hydrocarbon fuels. J. Energy Chem. 2016, 25, 146–152. [Google Scholar] [CrossRef]
  24. Fischer, A.; Du, S.; Valla, J.A.; Bollas, G.M. The effect of temperature, heating rate and ZSM-5 catalyst on the product selectivity of the fast pyrolysis of spent coffee grounds. RCS Adv. 2015, 5, 29252–29261. [Google Scholar] [CrossRef]
  25. Tehrani, N.F.; Aznar, J.S.; Kiros, Y. Coffee extract residue for production of ethanol and activated carbons. J. Clean. Prod. 2015, 91, 64–70. [Google Scholar] [CrossRef]
  26. Vardon, D.R.; Moser, B.R.; Zheng, W.; Witkin, K.; Evangelista, R.L.; Strathmann, T.J.; Rajagopalan, K.; Sharma, B.K. Complete utilization of spent coffee grounds to produce biodiesel, bio-oil and biochar. ACS Sustain. Chem. Eng. 2013, 1, 1286–1294. [Google Scholar] [CrossRef]
  27. Primaz, C.T.; Schena, T.; Lazzari, E.; Caramao, E.B.; Jaques, R.A. Influence of the temperature in the yield and composition of the bio-oil from the pyrolysis of spent coffee grounds: Characterization by comprehensive two dimensional gas chromatography. Fuel 2018, 232, 572–580. [Google Scholar] [CrossRef]
  28. Cay, H.; Duman, G.; Yanik, J. Two-step gasification of biochar for hydrogen-rich gas production: Effect of the biochar type and catalyst. Energy Fuels 2019, 33, 7398–7405. [Google Scholar] [CrossRef]
  29. Jutakridsada, P.; Prajaksud, C.; Kuboonya-Aruk, L.; Theerakulpisut, S.; Kamwilaisak, K. Adsorption characteristics of activated carbon prepared from spent ground coffee. Clean Technol. Environ. Policy 2016, 18, 639–645. [Google Scholar] [CrossRef]
  30. Alcaraz, L.; Escudero, M.E.; Alguacil, F.J.; Llorente, I.; Urbieta, A.; Fernandez, P.; Lopez, F.A. Dysprosium removal from water using active carbons obtained from spent coffee ground. Nanomaterials 2019, 9, 1372. [Google Scholar] [CrossRef] [PubMed] [Green Version]
  31. Babu, N.A.; Reddy, D.S.; Kumar, G.S.; Ravindhranath, K.; Mohan, G.V.K. Removal of lead and fluoride from contaminated water using exhausted coffee grounds based bio-sorbent. J. Environ. Manag. 2018, 218, 602–612. [Google Scholar] [CrossRef]
  32. Fonseca Alves, A.C.; Antero, R.V.P.; de Oliveira, S.B.; Ojala, S.A.; Scalize, P.S. Activated carbon produced from waste coffee grounds for an effective removal of bisphenol-A in aqueous medium. Environ. Sci. Pollut. Res. 2019, 26, 24850–24862. [Google Scholar] [CrossRef] [PubMed]
  33. Wang, C.F.; Wu, C.L.; Kuo, S.W.; Hung, W.S.; Lee, K.J.; Tsai, H.C.; Chang, C.J.; Lai, J.Y. Preparation of efficient photothermal materials from waste coffee grounds for solar evaporation and water purification. Sci. Rep. 2020, 10, 12769. [Google Scholar] [CrossRef] [PubMed]
  34. Huang, S.; Liang, C. Evaluation of the engineering properties of powdered activated carbon amendments in porous asphalt pavement. Processes 2021, 9, 582. [Google Scholar] [CrossRef]
  35. Suganya, S.; Kumar, P.S. Influence of ultrasonic waves on preparation of active carbon from coffee waste for the reclamation of effluents containing Cr(VI) ions. J. Ind. Eng. Chem. 2018, 60, 418–430. [Google Scholar] [CrossRef]
  36. Rovani, S.; Censi, M.T.; Pedrotti, S.L., Jr.; Lima, E.C.; Cataluna, R.; Fernandes, A.N. Development of a new adsorbent from agro-industrial waste and its potential use in endocrine disruptor compound removal. J. Hazard. Mater. 2014, 271, 311–320. [Google Scholar] [CrossRef]
  37. Nowicki, P.; Skibiszewska, P.; Pietrzak, R. Hydrogen sulphide removal on carbonaceous adsorbents prepared from coffee industry waste materials. Chem. Eng. J. 2014, 248, 208–215. [Google Scholar] [CrossRef]
  38. Querejeta, N.; Gil, M.V.; Rubiera, F.; Pevida, C. Sustainable coffee-based CO2 adsorbents: Toward a greener production via hydrothermal carbonization. Greenh. Gases Sci. Technol. 2018, 8, 309–323. [Google Scholar] [CrossRef]
  39. Travis, W.; Gadipelli, S.; Guo, Z. Superior CO2 adsorption from waste coffee ground derived carbons. RCS Adv. 2015, 5, 29558–29562. [Google Scholar] [CrossRef]
  40. Mohamed, M.G.; Ahmed, M.M.M.; Du, W.T.; Kuo, S.W. Meso/Microporous carbon from conjugated hyper-crosslinked polymers based on tetraphenylethene for high-performance CO2 capture and supercapacitor. Molecules 2021, 16, 738. [Google Scholar] [CrossRef]
  41. Samy, M.M.; Mohamed, M.G.; Kuo, S.W. Directly synthesized nitrogen and oxygen doped microporous carbons derived from a bio-derived polybenzoxazine exhibiting high-performance supercapacitance and CO2 uptake. Eur. Polym. J. 2020, 138, 109954. [Google Scholar] [CrossRef]
  42. Kemp, K.C.; Baek, S.B.; Lee, W.G.; Meyyappan, M.; Kim, K.S. Activated carbon derived from waste coffee grounds for stable methane storage. Nanotechnology 2015, 26, 385602–385609. [Google Scholar] [CrossRef] [PubMed]
  43. Akasaka, H.; Takahata, T.; Toda, I.; Ono, H.; Ohshio, S.; Himeno, S.; Kokubu, T.; Saitoh, H. Hydrogen storage ability of porous carbon material fabricated from coffee bean wastes. Int. J. Hydrogen Energy 2011, 36, 580–585. [Google Scholar] [CrossRef]
  44. Um, J.H.; Kim, Y.; Ahn, C.Y.; Kim, J.; Sung, Y.E.; Cho, Y.H.; Kim, S.S.; Yoon, W.S. Biomass waste, coffee grounds-derived carbon for lithium storage. J. Electrochem. Sci. Technol. 2018, 9, 163–168. [Google Scholar] [CrossRef]
  45. Oh, W.D.; Lisak, G.; Webster, R.D.; Liang, Y.N.; Veksha, A.; Giannis, A.; Moo, J.G.S.; Lim, J.W.; Lim, T.T. Insights into the thermolytic transformation of lignocellulosic biomass waste to redox-active carbocatalyst: Durability of surface active sites. Appl. Catal. B Environ. 2018, 233, 120–129. [Google Scholar] [CrossRef]
  46. Goncalves, M.; Guerreiro, M.C.; Alves de Oliveira, L.C.; Soares de Castro, C. A friendly environmental material: Iron oxide dispersed over activated carbon from coffee husk for organic pollutants removal. J. Environ. Manag. 2013, 127, 206–211. [Google Scholar] [CrossRef]
  47. Hung, Y.H.; Liu, T.Y.; Chen, H.Y. Renewable coffee waste-derived porous carbons as anode materials for high-performance sustainable microbial fuel cells. ACS Sustain. Chem. Eng. 2019, 7, 16991–16999. [Google Scholar] [CrossRef]
  48. Lee, M.E.; Kwak, H.W.; Jin, H.J.; Yun, Y.S. Waste beverage coffee-induced hard carbon granules for sodium-ion batteries. ACS Sustain. Chem. Eng. 2019, 7, 12734–12740. [Google Scholar] [CrossRef]
  49. Zhao, P.; Aboonasr Shiraz, M.H.; Zhu, H.; Liu, Y.; Tao, L.; Liu, J. Hierarchically porous carbon from waste coffee grounds for high-performance Li-Se batteries. Electrochim. Acta 2019, 325, 134931–134938. [Google Scholar] [CrossRef]
  50. Choi, J.; Zequine, C.; Bhoyate, S.; Lin, W.; Li, X.; Kahol, P.; Gupta, R. Waste coffee management: Deriving high-performance supercapacitors using nitrogen-doped coffee-derived carbon. C J. Carbon Res. 2019, 5, 44. [Google Scholar] [CrossRef] [Green Version]
  51. Frohlich, A.C.; dos Reis, G.S.; Pavan, F.A.; Lima, E.C.; Foletto, E.L.; Dotto, G.L. Improvement of activated carbon characteristics by sonication and its application for pharmaceutical contaminant adsorption. Environ. Sci. Pollut. Res. 2018, 25, 24713–24725. [Google Scholar] [CrossRef]
  52. Kim, Y.; Lee, J.; Yi, H.; Tsang, Y.F.; Kwon, E.E. Investigation into role of CO2 in two-stage pyrolysis of spent coffee grounds. Bioresour. Technol. 2019, 272, 48–53. [Google Scholar] [CrossRef]
  53. Laksaci, H.; Khelifi, A.; Trari, M.; Addoun, A. Synthesis and characterization of microporous activated carbon from coffee grounds using potassium hydroxide. J. Clean. Prod. 2017, 147, 254–262. [Google Scholar] [CrossRef]
  54. Laksaci, H.; Khelifi, A.; Belhamdi, B.; Trari, M. Valorization of coffee grounds into activated carbon using physic-chemical activation by KOH/CO2. J. Environ. Chem. Eng. 2017, 5, 5061–5066. [Google Scholar] [CrossRef]
  55. Rodriguez-Reinoso, F.; Molina-Sabio, M.; Gonzalez, M.T. The use of steam and CO2 as activating agents in the preparation of activated carbons. Carbon 1995, 33, 15–23. [Google Scholar] [CrossRef]
  56. Chiu, Y.H.; Lin, L.Y. Effect of activating agents for producing activated carbon using a facile one-step synthesis with waste coffee grounds for symmetric supercapacitors. J. Taiwan Inst. Chem. Eng. 2019, 101, 177–185. [Google Scholar] [CrossRef]
  57. Wang, C.H.; Wen, W.C.; Hsu, H.C.; Yao, B.Y. High-capacitance KOH-activated nitrogen-containing porous carbon material from waste coffee grounds in supercapacitors. Adv. Power Technol. 2016, 27, 1387–1395. [Google Scholar] [CrossRef]
  58. Pujol, D.; Liu, C.; Gominho, J.; Olivella, M.A.; Fiol, N.; Villaescusa, I.; Pereira, H. The chemical composition of exhausted coffee waste. Ind. Crop. Prod. 2013, 50, 423–429. [Google Scholar] [CrossRef]
  59. Wilson, L.; Yang, W.; Blasiak, W.; John, G.R.; Mhilu, C.F. Thermal characterization of tropical biomass feedstocks. Energy Conv. Manag. 2011, 52, 191–198. [Google Scholar] [CrossRef]
  60. Pawlicka, A.; Doczekalska, B. Determination of surface oxygen functional groups of active carbons according to Bohem’s titration method. For. Wood Technol. 2013, 84, 11–14. [Google Scholar]
  61. Kumar, A.; Prasad, B.; Mishra, I.M. Adsorptive removal of acrylonitrile by commercial grade activated carbon: Kinetics, equilibrium and thermodynamics. J. Hazard. Mater. 2007, 152, 589–600. [Google Scholar] [CrossRef]
  62. Ballesteros, L.F.; Teixeira, J.A.; Mussatto, S.I. Chemical, functional and structural properties of spent coffee grounds and coffee silverskin. Food Bioprocess Technol. 2014, 7, 3493–3503. [Google Scholar] [CrossRef] [Green Version]
  63. Sharma, R.K.; Hajaligol, M.R.; Martoglio Smith, P.A.; Wooten, J.B.; Baliga, V. Characterization of char pyrolysis of chlorogenic acid. Energy Fuels 2000, 14, 1083–1093. [Google Scholar] [CrossRef]
  64. Wang, N.; Lim, L.T. Fourier transform infrared and physicochemical analyses of roasted coffee. J. Agric. Food Chem. 2012, 60, 5446–5453. [Google Scholar] [CrossRef]
  65. Li, X.; Strezov, V.; Kan, T. Energy recovery potential analysis of spent coffee grounds pyrolysis products. J. Anal. Appl. Pyrolysis 2014, 110, 79–87. [Google Scholar] [CrossRef]
  66. Skreiberg, A.; Skreiberg, O.; Sandquist, J.; Sorum, L. TGA and macro-TGA characterization of biomass fuels and fuel mixtures. Fuel 2011, 90, 2182–2197. [Google Scholar] [CrossRef]
  67. Fermoso, J.; Masek, O. Thermochemical decomposition of coffee ground residues by TG-MS: A kinetic study. J. Anal. Appl. Pyrolysis 2018, 130, 358–367. [Google Scholar] [CrossRef] [Green Version]
  68. Chia, C.H.; Gong, B.; Joseph, S.D.; Marjo, C.E.; Munroe, P.; Rich, A.M. Imaging of mineral-enriched biochar by FTIR, Raman and SEM-EDX. Vib. Spectrosc. 2012, 62, 248–257. [Google Scholar] [CrossRef]
  69. Centrone, A.; Brambilla, L.; Renouard, T.; Gherghel, L.; Mathis, C.; Mullen, K.; Zerbi, G. Structure of new carbonaceous materials: The role of vibrational spectroscopy. Carbon 2005, 43, 1593–1609. [Google Scholar] [CrossRef]
  70. Zhuo, Y.; Lemaignen, L.; Chatzakis, I.N.; Reed, G.P.; Dugwell, D.R.; Kandiyoti, R. An attempt to correlate conversion in pyrolysis and gasification with FT-IR spectra of coals. Energy Fuels 2000, 14, 1049–1058. [Google Scholar] [CrossRef]
  71. Shimodaira, N.; Masui, A. Raman spectroscopic investigations of activated carbon materials. J. Appl. Phys. 2002, 92, 902–909. [Google Scholar] [CrossRef]
  72. Ferrari, A.C.; Robertson, J. Interpretation of Raman spectra of disordered and amorphous carbon. Phys. Rev. B 2000, 61, 14095–14107. [Google Scholar] [CrossRef] [Green Version]
  73. Ferrari, A.C. Raman spectroscopy of graphene and graphite: Disorder, electron-phonon coupling, doping and nonadiabatic effects. Solid State Commun. 2007, 143, 47. [Google Scholar] [CrossRef]
  74. Kaniyoor, A.; Ramaprabhu, S. A Raman spectroscopic investigation of graphite oxide derived graphene. AIP Adv. 2012, 2, 032183. [Google Scholar] [CrossRef] [Green Version]
  75. Malard, L.M.; Pimenta, M.A.; Dresselhaus, G.; Dresselhaus, M.S. Raman spectroscopy in graphene. Phys. Rep. 2008, 473, 51–87. [Google Scholar] [CrossRef]
  76. Pimenta, M.A.; Dresselhaus, G.; Dresselhaus, M.S.; Cancado, L.G.; Jorio, A.; Saito, R. Studying disorder in graphite-based systems by Raman spectroscopy. Phys. Chem. Chem. Phys. 2007, 9, 1276–1291. [Google Scholar] [CrossRef] [PubMed]
  77. Tan, P.H.; Deng, Y.M.; Zhao, Q. Temperature-dependent Raman spectra and anomalous Raman phenomenon of highly oriented pyrolytic graphite. Phys. Rev. 1998, 58, 5435–5439. [Google Scholar] [CrossRef] [Green Version]
  78. Morgan, D.J. Comments on the XPS analysis of carbon materials. J. Carbon Res. 2021, 7, 51. [Google Scholar] [CrossRef]
  79. Lesiak, B.; Kover, L.; Toth, J.; Zemek, J.; Jiricek, P.; Kromba, A.; Rangam, N. C sp2/sp3 hybridisations in carbon materials—XPS and (X)AES study. Appl. Surf. Sci. 2018, 452, 223–231. [Google Scholar] [CrossRef]
  80. Li, X.; Kang, Y.; Haghighi, M. Investigation of pore size distributions of coals with different structures by nuclear magnetic resonance (NMR) and mercury intrusion porosimetry. Measurement 2018, 116, 122–128. [Google Scholar] [CrossRef]
  81. McBeath, A.V.; Smernik, R.J.; Krull, E.S.; Lehmann, J. The influence of feedstock and production temperature on biochar carbon chemistry: A solid-state 13C NMR study. Biomass Bioenerg. 2014, 60, 121–129. [Google Scholar] [CrossRef]
  82. Chen, L.S.; Wang, L.I.; Pan, T.Y.; Zhang, Y.Y.; Zhang, D.X. Calibration of solid state NMR carbon structural parameters and application in coal structure analysis. J. Fuel Chem. Technol. 2017, 45, 1153–1163. [Google Scholar] [CrossRef]
  83. Celzard, A.; Mareche, J.F.; Payot, F.; Furdin, G. Electrical conductivity of carbonaceous powders. Carbon 2002, 40, 2801–2815. [Google Scholar] [CrossRef]
  84. Sanchez-Gonzalez, J.; Macias-Garcia, A.; Alexandre-Franco, M.F.; Gomez-Serrano, V. Electrical conductivity of carbon black under compressin. Carbon 2005, 43, 741–747. [Google Scholar] [CrossRef]
  85. Vargas, A.M.M.; Cazetta, A.L.; Garcia, C.A.; Moraes, J.C.G.; Nogami, E.M.; Lenzi, E.; Costa, W.F.; Almeida, V.C. Preparation and characterization of activated carbon from a new raw lignocellulosic material: Flamboyant (Delonix regia) pods. J. Environ. Manag. 2011, 92, 178–184. [Google Scholar] [CrossRef]
  86. Fuente, E.; Menendez, J.A.; Suarez, D.; Montes-Moran, M.A. Basic surface oxides on carbon materials: A global view. Langmuir 2003, 19, 3505–3511. [Google Scholar] [CrossRef]
  87. Schonner, J.; Buchheim, J.R.; Scholz, P.; Adelhelm, P. Boehm titration revisited (part I): Practical aspects for achieving a high precision in quantifyng oxygen-containing surface groups on carbon materials. C J. Carbon Res. 2018, 4, 21. [Google Scholar] [CrossRef] [Green Version]
  88. Takahata, T.; Toda, I.; Ono, H.; Ohshio, S.; Akasaka, H.; Himeno, S.; Kokubu, T.; Saitoh, H. Detailed structural analyses of KOH activated carbon from waste coffee beans. Jpn. J. Appl. Phys. 2009, 48, 117001. [Google Scholar] [CrossRef]
  89. Rodriguez Correa, C.; Kruse, A. Biobased functional carbon materials: Production, characterization, and applications—A review. Materials 2018, 11, 1568. [Google Scholar] [CrossRef] [Green Version]
  90. Yun, Y.S.; Park, M.H.; Hong, S.J.; Lee, M.E.; Park, Y.W.; Jin, H.J. Hierarchically porous carbon nanosheets from waste coffee grounds for supercapacitors. ACS Appl. Mater. Interfaces 2015, 7, 3684–3690. [Google Scholar] [CrossRef]
  91. Mohamed, M.G.; Atajde, E.C., Jr.; Matsagar, B.M.; Na, J.; Yamauchi, Y.; Wu, K.C.W.; Kuo, S.W. Construction hierarchically mesoporous/microporous materials based on block copolymer and covalent organic framework. J. Taiwan Inst. Chem. Eng. 2020, 112, 180–192. [Google Scholar] [CrossRef]
  92. Qian, M.; Xuan, X.Y.; Pan, L.K.; Gong, S.Q. Porous carbon electrodes from activated wastes coffee grounds for capacitive deionization. Ionics 2019, 25, 3443–3452. [Google Scholar] [CrossRef]
  93. Ramon-Goncalves, M.; Alcarez, L.; Perez-Ferreras, S.; Leon-Gonzalez, M.E.; Rosales-Conrado, N.; Lopez, F.A. Extraction of polyphenols and synthesis of new activated carbon from spent coffee grounds. Sci. Rep. 2019, 9, 17706. [Google Scholar] [CrossRef] [Green Version]
Scheme 1. Topics for the valorization of spent coffee ground.
Processes 09 01637 sch001
Figure 1. 13C nuclear magnetic resonance (NMR) spectrum in the solid state of the starting spent coffee ground (SCG) Arabica (sample A) (FA = fatty acids, CLA = chlorogenic acid, CARBS = carbohydrates, and Aliph. = aliphatic).
Processes 09 01637 g001
Figure 2. Fourier transform infrared (FTIR) spectra of the starting SCG (sample A), of the derived activated carbon (sample AAC-9), and of the commercial activated carbon (sample M) in the range 4000–500 cm−1.
Processes 09 01637 g002
Figure 3. Thermogravimetric (TG) and derivative thermogravimetric (DTG) profile of (a) sample R in the range 30–1000 °C (10 °C/min) under N2, (b) sample A in the range 30–1000 °C (10 °C/min) under N2; (c) the mixture R/KOH 1/1 in the range 30–1000 °C at 10 °C/min under N2; (d) the mixture A/KOH 1/1in the range 30–1000 °C at 10 °C/min under N2.
Processes 09 01637 g003
Scheme 2. Preparation process of the activated carbons.
Processes 09 01637 sch002
Figure 4. Raman spectrum of the AAC-6 sample together with the deconvolution.
Processes 09 01637 g004
Figure 5. Position of the different bands (G1, G2, D1, D2) in function of their FWHM.
Processes 09 01637 g005
Figure 6. X-ray diffraction (XRD) spectra of the samples RAC-1, AAC-1, AAC-6 and C.
Processes 09 01637 g006
Figure 7. Electrical conductivity measured for columns of samples of fixed dimensions under different applied pressures.
Processes 09 01637 g007
Figure 8. Environmental scanning electron micrographs (1600×) of (a) the raw material A and the derived (b) AAC-5 (pyrolysis at 600 °C, activator KOH), (c) AAC-2 (pyrolysis at 800 °C, activator KOH), and (d) AAC-3 (pyrolysis at 800 °C, activator NaHCO3). Scale bar 30 μm.
Processes 09 01637 g008
Figure 9. Correlation between specific surface area and total pore volume for samples with surface area higher than 1000 m2/g.
Processes 09 01637 g009
Figure 10. Correlation between Raman ID/IG ratio and XPS sp2/(sp2 + sp3) data for samples with surface area higher than 1000 m2/g.
Processes 09 01637 g010
Table 1. Elemental analysis (% w/w) of the waste coffee grounds starting materials 1.
SampleCHNS“H:C” Ratio“O:C” Ratio
Robusta (R)52.56.92.2<0.050.130.89
Arabica (A)56.07.92.5<0.050.140.78
1 The data correspond to averaged values of at least three measurements performed on five independent samples.
Table 2. Experimental conditions for preparation of activated carbons (ACs) and labeling.
SamplePreliminary
Washing
Activating Agent
(Activator/Substrate Ratio w/w)
Pyrolysis
Temperature
(°C)
Yield
(%)
Surface Area
(m2/g)
RAC-1 1EtOH, 24 h RT +
Hexane 24 h RT
KOH (1:1)80015629
RAC-2 1EtOH, 24 h RT +
Hexane 24 h RT
K2CO3 (1:1)60013765
RAC-3 1H2Onone80010478
RAC-4 1H2OZnCl2 (1:1)80015367
AAC-1H2OKOH (1:1)800121407
AAC-2H2O, 24 h RT +
Hexane 24 h RT
KOH (1:1)800121362
AAC-3 2EtOH, 1 h RTNaHCO3/CH3COOH (1:1:1) under stirring one night, RT; + KOH (1:1)800121868
AAC-4 2H2O, 24 h RTKOH (1:1)800101535
AAC-5EtOH, 24 h RT +
Hexane 24 h RT
KOH (1:1)60015615
AAC-6EtOH, 24 h RT +
Hexane 24 h RT
KOH (1:1)700131715
AAC-7EtOH, 24 h RT +
Hexane 24 h RT
KOH (1:1)800121375
AAC-8 3EtOH, 24 h RT +
Hexane 24 h RT
KOH (1:1)70012721
AAC-9 4noneKOH (1:1)800301200
AAC-10 5EtOH, 24 h RT +
Hexane 24 h RT
KOH (1:1)60017495
MCommercial: Merck, K39413913 002;
activated charcoal, extra food pure grade
unknown823
CCommercial: CECA, Arkema, Acticarbone NCL 1240unknown932
LP39Commercial: Jacobi®LP39®unknown1782
1 N2 flow rate 150 mL/min; 2 During the pyrolysis CH4 was formed; 3 After preliminary washing, the powder was heated at 500 °C for 1 h before pyrolysis; 4 The pyrolysis was carried out on a larger mass (c.a. 100 g); 5 The pyrolysis was carried out in a vertical glass reactor.
Table 3. Density and point of zero charge (PZC) values of some ACs samples.
SampleDensity (g/cm3)PZC
AAC-91.789.5
M1.818.8
C1.9610.5
LP391.446.7
Table 4. Average interlayer dspacing 002 and 100; average crystalline diameter Lc calculated from the analysis of the XRD spectra.
SampleSize Lc 002
(Å)
Size Lc 100
(Å)
dspacing 002
(Å)
dspacing 100
(Å)
RAC-10.71.73.7802.078
RAC-20.81.73.7952.060
RAC-30.91.93.7502.081
RAC-41.21.83.7602.062
AAC-1 1-1.7-2.065
AAC-21.32.03.7402.076
AAC-30.81.13.7982.061
AAC-41.11.83.8392.071
AAC-51.01.33.7392.081
AAC-60.91.53.7162.081
AAC-71.01.93.6912.078
AAC-80.81.63.7922.074
AAC-90.91.23.7762.085
AAC-100.81.43.7492.088
M0.82.03.5362.068
C1.12.23.7592.073
LP391.11.53.8742.099
1 Too broad to be calculated.
Table 5. Intensities of the C1s X-ray photoelectron spectroscopy (XPS) signals. All the values have been obtained from the average of three measurements in different regions of each sample.
SampleC=C sp2
~284.4 eV
C-C sp3
~285.2 eV
C-OH
~285.8 eV
C=O
~286.7 eV
O-C=O
~288.1 eV
CO32−
~290.1 eV
RAC-157.59.29.38.25.310.6
RAC-241.934.611.63.74.93.4
RAC-437.432.67.112.76.24.0
AAC-151.914.96.78.35.412.8
AAC-248.026.311.68.65.5-
AAC-346.824.611.79.67.3-
AAC-456.47.111.28.75.910.7
AAC-555.113.010.18.35.77.8
AAC-654.412.09.410.35.68.3
AAC-759.612.29.26.05.27.8
AAC-8 *46.724.611.79,67.3-
AAC-937.336.89.55.63.96.9
AAC-1048.628.912.45.64.5-
M57.617.35.76.63.19.7
C47.228.518.16.2--
LP3942.834.78.54.63.85.7
* An additional signal at 292.8 eV (2.7) is present.
Table 6. Intensities of the O1s XPS signals. All the values have been obtained from the average of three measurements in different regions of each sample.
SampleCsp3−OH
531.0 eV
C=O
532.2 eV
CAr−OH
533.5 eV
RAC-122.041.037.0
RAC-233.843.023.2
RAC-419.933.346.8
AAC-112.751.136.2
AAC-2 129.740.129.4
AAC-3 122.140.928.4
AAC-425.248.326.5
AAC-522.952.224.8
AAC-625.842.132.0
AAC-733.644.721.7
AAC-841.239.519.4
AAC-935.949.814.3
AAC-1030.546.622.9
M4,865,429,8
C26.654.319.1
LP3934.547.118.4
1 An additional signal at 535.1 eV is present due to O1s satellites and the possible contribution from carbonate.
Table 7. Results of Bohem titration.
SampleCarboxylic
(mmol/g)
Lactonic
(mmol/g)
Phenolic
(mmol/g)
Acidic
(mmol/g)
Basic
(mmol/g)
AAC-51.7100.802.342.51
AAC-62.8000.102.792.90
AAC-72.7700.032.803.20
AAC-90.0500.450.501.50
M000.100.100.60
C00000.70
LP390.4900.511.000
Table 8. Physical properties of ACs from coffee grounds by different activation conditions.
SampleSBET
(m2/g)
Vt
(cm3/g)
Vm
(cm3/g)
Vμ
(cm3/g)
Vμ/Vt
(%)
Dp
(nm)
RAC-16290.300.060.2480.01.69
RAC-27650.320.050.2784.81.64
RAC-34780.200.030.1785.01.69
RAC-43670.150.020.1386.71.61
AAC-114070.760.080.6889.52.16
AAC-213620.720.110.6184.72.13
AAC-318681.060.440.6258.52.27
AAC-415350.820.120.7085.42.14
AAC-56150.320.010.3196.92.10
AAC-617150.920.070.8592.42.14
AAC-713750.740.070.6790.52.14
AAC-87210.310.010.3096.82.12
AAC-912000.500.070.4386.01.67
AAC-104950.270.010.2696.32.18
M8230.520.140.3873.12.54
C9320.490.040.4591.92.11
LP3917821.621.140.5131.53.64
SBET = BET surface area. Vt = total pore volume. Vμ = micropore volume. Vm = mesopore volume. Vμ/Vt = percentage of micropores. Dp = average pore diameter.
Publisher’s Note: MDPI stays neutral with regard to jurisdictional claims in published maps and institutional affiliations.

