A Multi-Risk Methodology for the Assessment of Climate Change Impacts in Coastal Zones
by
 , ,
, ,
Valentina Gallina
1, 
Silvia Torresan
1,2,
Alex Zabeo
1,
Andrea Critto
1,2,
Thomas Glade
3 and
Antonio Marcomini
1,2,* 
1
Department of Environmental Sciences, Informatics and Statistics, University Ca’ Foscari Venice, Via Torino 155, Mestre, 30172 Venezia, Italy
2
Fondazione Centro-Euro Mediterraneo sui Cambiamenti Climatici (CMCC), Risk Assessment and Adaptation Strategies Division, Via della Libertà 12, Marghera, 30175 Venezia, Italy
3
Department of Geography and Regional Research, University of Vienna, Universitätsstraße 7, A-1010 Vienna, Austria
*
Author to whom correspondence should be addressed.
Sustainability 2020, 12(9), 3697; https://doi.org/10.3390/su12093697
Submission received: 19 December 2019
/
Revised: 21 April 2020
/
Accepted: 24 April 2020
/
Published: 2 May 2020
(This article belongs to the Special Issue Vulnerability Assessment and Disaster Risk Reduction)
Abstract
:Climate change threatens coastal areas, posing significant risks to natural and human systems, including coastal erosion and inundation. This paper presents a multi-risk approach integrating multiple climate-related hazards and exposure and vulnerability factors across different spatial units and temporal scales. The multi-hazard assessment employs an influence matrix to analyze the relationships among hazards (sea-level rise, coastal erosion, and storm surge) and their disjoint probability. The multi-vulnerability considers the susceptibility of the exposed receptors (wetlands, beaches, and urban areas) to different hazards based on multiple indicators (dunes, shoreline evolution, and urbanization rate). The methodology was applied in the North Adriatic coast, producing a ranking of multi-hazard risks by means of GIS maps and statistics. The results highlight that the higher multi-hazard score (meaning presence of all investigated hazards) is near the coastline while multi-vulnerability is relatively high in the whole case study, especially for beaches, wetlands, protected areas, and river mouths. The overall multi-risk score presents a trend similar to multi-hazard and shows that beaches is the receptor most affected by multiple risks (60% of surface in the higher multi-risk classes). Risk statistics were developed for coastal municipalities and local stakeholders to support the setting of adaptation priorities and coastal zone management plans.
1. Introduction
Nowadays, international and European policies for disaster risk reduction, sustainable development, and climate adaptation are posing increasing emphasis on systemic risks [1]. The need of holistic risk management was first mentioned in the Hyogo Framework for Action [2] and then confirmed in the UN’s Sendai Framework for Disaster Risk Reduction [3]. Furthermore, multi-hazard risk management was recognized by the Post-2015 Development Agenda as an important way to achieve the Sustainable Development Goals (SDG) and the Millennium Development Goals (MDG) [4]. Similarly, the European Civil Protection Mechanism emphasized the need to address all natural and man-made hazards affecting the environment, society, and economy at multiple spatial and temporal scales [5]. More recently, the IPCC special report on the impacts of global warming of 1.5 °C above pre-industrial levels points out that some regions of the world could be increasingly affected by concomitant changes in several types of hazards [6]. Therefore, the multi-risk paradigm is gaining importance also within the climate adaptation policies (e.g., the European Adaptation Strategy [7]) and the ambitious goals set by the European Green Deal Green Deal [8].
Even if it is recognized that the assessment of multi-risk can make a great difference in building resilience and sustainable development pathways, the achievement of multi-risk governance in the current disaster management and climate adaptation practices is still a big challenge [9].
Multi-risk assessments are particularly relevant in coastal zones that are vulnerable to climate change and several interacting hazards and impacts (e.g., sea-level rise, coastal erosion, and storm surge) [10,11]. Although several methods and tools (e.g., vulnerability index and indicators, GIS-based decision support systems) have been already developed to assess and manage coastal vulnerability to climate change and natural hazards [12], they cannot be easily applied for an integrated assessment of multiple hazards and risks affecting different systems and sectors. Moreover, some of them (e.g., dynamic computer models) are data-intensive and require specialized knowledge and the use of complex programs [13,14].
Even if in the last decade the interest about the multi-risk assessment has increased (e.g., [11,15]), especially in applications and initiatives aimed at the assessment of risks derived from different natural and man-made hazardous events, there are still few examples of applications in the climate change community [16]. A detailed description of the methodologies available in the scientific literature, as well as their assumptions and limitations, can be found in [17,18]. The more practical approach, representing a screening of the investigated hazards/risks, is the qualitative multi-risk method, allowing a first estimate of risks based on end-user and expert judgment (e.g., [19,20,21,22]). The semi-quantitative methods (e.g., weighted sum and cause–effect matrices) provide a deeper evaluation of the relationships between agents and processes [22] and the exposures of elements at risk [23]. Finally, quantitative multi-risk methods (e.g., probabilistic approaches, Bayesian networks, and agent-based models) allow a more robust analysis of the multi-risk dynamics [19,20,21,22,24,25] based on more sophisticated computational models [26,27,28].
Scientific challenges related to the application of multi-risk methodologies to climate-driven impacts are related to understanding the combination of multiple hazards contributing to societal or environmental risk (i.e., the compound events) and of their probability [29]. Moreover, current issues are related to: the identification of key variables and thresholds for the assessment of the impacts of both gradual climate changes and extreme events; the evaluation of multiple elements potentially at risk and of their interconnections; and the assessment of dynamic vulnerability to multiple hazards that may affect, jointly or consecutively, the same target [16]. Finally, a crucial point is to develop multi-risk information that is usable and easily understandable by stakeholders and decision-makers, in order to define sustainable adaptation pathways [9].
Going beyond the traditional risk-by-risk approach commonly used to evaluate the effect of individual hazards in coastal areas (e.g., [30,31,32,33,34,35,36]), this paper presents a pioneering Multi-Risk Assessment (MRA) methodology to measure the effect of climate change on multiple (interacting) hazards on exposed vulnerable sectors. The methodology allows:
- identifying a set of common metrics and operative steps for the assessment of multi-hazard risks in coastal areas, under current and future climate conditions;
- classifying the vulnerability of natural and human elements at risk to different types of hazards; and
- providing a relative ranking of hotspot multi-risk areas at the regional (sub-national) scale, employing Multi-Criteria Decision Analysis (MCDA).
It has been conceived as a screening risk tool to be used in coastal areas without the need of excessive data collection or computer processing capacity, with the final goal of mainstreaming a multi-hazard risk perspective in decision-making practices. The implementation of the MRA methodology in a test case makes it possible to quantify, integrate, and compare multiple risk pathways for a selected set of hazards, showing how cumulative risk analysis can be useful to improve cross-sectorial decision-making, climate proofing, and adaptation planning.
2. The North Adriatic Coastal Area
The study area considered for the application of the MRA methodology (Figure 1) comprises the Italian coast of the North Adriatic region from the national border between Italy and Slovenia to the mouth of the southern tributary of the Po Delta system (i.e., Po di Goro). It includes the coast of the Veneto and Friuli Venezia Giulia Regions, for an overall length of about 286 km along the Adriatic Sea [37]. It covers the territory below the 2 m elevation contour line, for a total surface of 3531 km2. From a morphological point of view, the coast includes a variety of coastal landforms spanning from the low-lying sedimentary coasts of the Po River Plain to the rocky and higher shorelines of Trieste, interrupted by several river mouths and lagoons. Moreover, it hosts several environmental and socioeconomic systems highly vulnerable to climate change (e.g., the Po River Delta, the historical city of Venice, wetlands, and habitats of international importance). Some examples of climate-related impacts affecting the region are the intensification of extreme flood events in the city of Venice [38,39], which have been particularly damaging in autumn 2018 and 2019 (www.comune.venezia.it). Moreover, the heavy rainfall events and the related pluvial floods in urban areas [40] as well as the risk of water quality deterioration and loss of ecosystem services in coastal [41] and marine waters [42] are an increasing concern for the region. Despite the widespread presence of artificial protections (e.g., seawalls, breakwaters, submerged defenses, and river banks in the Po River Delta), the possible effects of coastal flooding and erosion remain a big issue for coastal zone management [43,44,45] and are expected to increase in the future due to climate change [46,47]. For these reasons, the Italian Ministry of the Environment recognized the North Adriatic coast as a fragile region, highly vulnerable to climate change and sea-level rise impacts [48]. Even if several measures such as the mobile barriers designed to protect Venice from high tides (i.e., the MOSE project that should be completed by the end of 2021: www.mosevenezia.eu) and other types of natural and semi-natural coastal protections (e.g., beach and sandbanks nourishment, dune restoration, and creation of new dunes with the use of natural vegetation) [49,50,51,52,53,54] are already in place to protect the study area, sustainable and integrated coastal planning should be reinforced to consider the impacts that could amplify one another across the land-sea interface [55].
Differently from recent studies focusing on single-hazard risk assessments in the North Adriatic region (e.g., [30,32,37,43,55,56,57]), this study is a first attempt to adopt a multi-hazard risk perspective to analyze the cumulative impacts of climate-related impacts in the North Adriatic coast, using publicly available datasets at the regional (sub-national scale).
2.1. North Adriatic Dataset for Multi-Risk Assessment
Several data in graphic format or database were requested and retrieved from previous research projects and from local public authorities (mainly Veneto and Friuli-Venezia Giulia region) to characterize climate related hazards. The elements potentially at risk (i.e., receptors) and their vulnerability single hazard scenarios necessary to apply the multi-hazard approach in the North Adriatic coastal zone were selected from recent risk assessment studies developed for the North Adriatic coast [34,35,36,56,58], as summarized in Table 1.
The single hazard maps described in Table 1 were obtained following the single-hazard Regional Risk Assessment approach implemented by the DEcision support SYstem for COastal climate change impact assessment (DESYCO) [57]. These maps integrated individual hazard metrics produced by impact models (e.g., projected sea-level rise scenarios and wave height) with pathway (e.g., elevation of the territory) and attenuation factors (e.g., artificial protections) evaluating the potential areas affected by sea-level rise inundation, storm surge flooding, and coastal erosion. Specific information about the impact models used in the assessment can be found in the works of Umgiesser et al. [59], Carniel et al. [60], and Torresan et al. [35].
The sea-level rise hazard maps produced for the North Adriatic area allowed the identification of areas potentially inundated by sea-level rise at 2100, ranking the hazard intensity based on the projected water height over each grid cell [34]. The purpose of these maps is to provide a preliminary look at the extent of areas prone to coastal inundation, based on the highest accuracy elevation data publicly available at the regional scale. Digital Elevation Models (DEMs) used in the assessment were derived from regional technical offices of Veneto and Friuli-Venezia Giulia with a horizontal resolution of 5 and 10 m, respectively. Both DEMs were elaborated from technical regional maps (contour lines and ground control points). To homogenize the spatial resolution of all the raster maps used in the risk assessment, both DEMs were converted into 25-m grid layers that were already considered as a suitable resolution for meso-scale regional risk assessments [61,62]. Given the flat geology of the coastal plain, spatial interpolation was performed without significant loss of accuracy compared to the original data. However, to have more precise multi-risk results, it is recommended to refine the analysis using inundation maps based on a higher resolution DEM (e.g., Light Detection and Ranging (LiDAR) data) or quantitative hydrodynamic models.
Moreover, even if subsidence is an important factor for the assessment of future inundation risk, especially for the low-lying coastal plains of the Venice lagoon and the Po River Delta (with values of 1–2 mm/year) [63,64], this factor could not be considered in the present analysis due to the lack of homogeneous data mapping the phenomenon for the overall coast of Veneto and Friuli-Venezia Giulia Regions. Moreover, as highlighted by Rizzi et al. [58], extrapolating subsidence values for the future based on past trends could lead to big errors, especially when the main causes of subsidence are anthropogenic, such as on the North Adriatic coast.
The storm surge maps estimated the potential flooded areas due to extreme events of different return periods (e.g., 20, 50, 100, 200, and 500 years). In addition to the effect of astronomical and meteorological tides, the assessment considered the potential effect of sea-level rise in 2100, the elevation of the territory, and the distance from the coastline [56].
Finally, as described by Gallina et al. [36], the seasonal coastal erosion maps (i.e., spring, summer, autumn, and winter) represent coastal areas potentially exposed to higher rates of coastal erosion due to climate change in the future scenario 2070–2100, considering the action of waves and bottom stress, as well as the presence of artificial protections and the distance from the sea [34,35].
All single hazard maps consider the A1B emission scenario as climate forcing, representing an intermediate case compared to the more intense A2 and the weaker B1 storyline families [65]. The A1B projections are equally plausible and comparable with the more recent simulations of the Representative Concentration Pathway (RCP) 6 [66], an intermediate forcing pathway between RCP4.5 and RCP8.5. In fact, the overall performance of the Coupled Model Intercomparison Project Phase (CMIP) 5 ensemble [66] shows similar values to that of the older CMIP3 ensemble [65] considering the mean global temperature projections, which range 1.7–4.4 °C for the A1B and 1.8–3.7 °C for RCPs [67,68]. In addition, the projected sea-level rise used in this application (i.e., 42 cm) renders a medium value compared to the Special Report on Emissions Scenarios (ranging 18–52 cm, from [65]) and to the more recent RCPs (i.e., 26–98 cm from [10]).
As far as sea-level rise is concerned, there is a high uncertainty on future projections due both to the greenhouse gas emissions considered and to the assumptions done about the dynamics of terrestrial ice melting [45]. The present application employs sea-level rise projections produced by a dedicated model-chain composed of climate and high-resolution ocean/sea circulation models for the North Adriatic Sea [34,35], which allow properly evaluating the consequences associated to sea-level rise, storm surge and coastal erosion.
Various physical and environmental data are needed to characterize the spatial pattern and distribution of targets (e.g., beaches, wetlands, and agricultural areas) and define appropriate indicators of multi-vulnerability (e.g., vegetation cover, percentage of urbanization, and presence of protected areas) to cumulative climate change impacts in the studied area. The available dataset for the application of the exposure and multi-vulnerability assessment to the case study area of the North Adriatic coast is summarized in Table 2.
All case study data were pre-processed using GIS spatial operators to provide a homogeneous raster dataset for the application of the environmental multi-risk methodology with the final resolution of 25 m × 25 m, representing the highest feasible detail, according to scale of the analysis and the available dataset.
3. Multi-Risk Methodology for the Assessment of Natural and Climate-Related Impacts
The main aim of the MRA methodology is to estimate the cumulative impacts of climate-related hazards, providing a rapid assessment tool able to scan areas and targets at risk from different types of hazards, on a multiplicity of elements at risk (e.g., beaches, wetlands, population, urban and agricultural areas, etc.). The final goal of such methodology is to mainstream the multi-hazard risk perspective in decision-making practices, as claimed by the most recent international policies on disaster risk reduction and climate adaptation [3,4,5,7].
Specifically, the multi-risk methodology pursues the following objectives:
- to identify multi-hazard risk and vulnerability indicators suitable for the assessment of current and future climate change impacts on vulnerable natural and human targets;
- to provide a relative ranking of areas and targets more heavily affected by multiple risks related to climate change at the regional (sub-national) scale, employing expert-based Multi-Criteria Decision Analysis (MCDA) tools; and
- to assist local communities and stakeholders (e.g., water, soil, and coastal management authorities) in the definition of sustainable climate adaptation and disaster risk reduction strategies.
In line with the recent definitions of the IPCC [10,11], risk is considered as the potential adverse consequences for natural and human systems resulting from the interactions of climate-related hazards with vulnerabilities of the exposed systems (i.e., elements at risk). Moreover, going beyond the traditional hazard-by-hazard approach usually proposed by the coastal risk assessment community (e.g., [36,56,69,70,71]), the risk framework of this paper adopts a multi-risk perspective, considering that different hazards can be interrelated, potentially affecting a variety of receptors (i.e., elements at risk) featured by different (hazard-dependent) vulnerabilities. Specifically, according to the recent glossary proposed by the UNISDR [72], multi-hazard refers to the hazardous (chronic or acute) events that may occur simultaneously, cascadingly, or cumulatively over a certain region and timeframe, taking into account the potential interrelated effects, while multi-vulnerability considers how the sensitivity of receptors changes in relation to different hazards [16]. Figure 2 summarizes the four main steps of the MRA methodology: multi-hazards, exposure, multi-vulnerability, and multi-risk assessment.
As described in the next subsections, each step of the MRA requires the management of heterogeneous input data with different units of measures (e.g., climate projections, hydrodynamic simulations, publicly available land use, and geo-biophysical data) that are first geo-referenced and converted into homogeneous grid maps (raster data), and then normalized to ensure comparability across different spatial layers and their aggregation with MCDA. According to an acknowledged practice in natural hazard and environmental risk assessment [73], our MRA integrates the use of expert knowledge when a quantitative estimate of hazards or vulnerabilities is not achievable due to lack of resources or data. The experts involved in the MRA testing in the North Adriatic Coast are mainly the authors of the paper, representing a multi-disciplinary team of environmental scientists, geographers, and natural hazard and climate change risk experts, as well as experts with extensive experience in the application of Multi-Criteria Decision Analysis (MCDA). The experts’ opinions were first based on the survey of scientific literature and historical data on coastal erosion and flood hazard risk assessment on the case study area, and then complemented by discussions with other experts in relevant fields such as hydrodynamic and climate modelers, as well as local stakeholders and territorial experts (mainly civil engineers) from regional/local coastal zone management authorities (Table S1) who joined several workshops in the framework of national and European projects where the intermediate results of the analysis were presented and discussed (e.g., FP7 CLIM-RUN and PEGASO projects [74,75]). The output of the analysis (including multi-risk maps and statistics presented in Section 4) could support the definition of comprehensive climate adaptation and disaster risk management strategies.
3.1. Multi-Hazard Assessment
The multi-hazard assessment evaluates the potential influences among different types of hazards, taking into account possible interactions that may amplify the overall risk [76].
It is performed through the following procedure: (1) select the hazards and timeframe of analysis; (2) assess the hazard interactions; (3) analyze hazard probabilities; and 4) aggregate and normalize the multi-hazard score.
The hazards and timeframe to be considered in the MRA depend on the scope of the study and the data availability. Single hazard metrics can be derived from climate models (e.g., temperature or precipitation projections) and physical impact models (e.g., sea-level rise, currents velocity, and bottom stress) [34,35], or by reviewing single-hazard scenarios available from previous projects in the considered region. The selected metrics should represent the intensity of the hazard (e.g., projected water level for inundation and wave energy for coastal erosion) and capture the influence of climate change (e.g., anomalies between baseline and future scenarios).
In our analysis for the North Adriatic coast, the hazard scenarios for the future timeframe 2070-2100 were retrieved from previous single-hazard assessment (Table 1) and combined in the MRA to represent the worst conditions, following a precautionary approach. More specifically, the higher sea-level rise projection of 42 cm at 2100 was considered in the multi-hazard assessment, associated with the more extreme storm surge event (500-year return period) and the winter coastal erosion scenario (representing the worst pattern for the bottom stress and wave height hazard metrics). Heterogeneous hazard scenarios expressed in different units of measure (e.g., sea-level rise, wave height, and bottom stress) were first normalized in the same 0–1 scale over the study area, and then integrated in the assessment of hazard interactions.
The analysis of the relationships among the hazards (e.g., how a hazard could be negatively affected by another operating in the same area and in the same temporal window) is performed by means of an hazard influence matrix [22] (Table S2). This matrix evaluates how much the different hazards (hi) influence each other (i.e., the synergies among the hazards) by means of weights (wa,b) For example, h1 influences h2 with a magnitude represented by w1,2 and vice versa. If the synergy among h1 and h2 is higher (i.e., very strong), w1,2 should assume the maximum value of 1, while a missing interaction among the investigated hazards will be translated in the lowest value (i.e., 0). Where possible, a quantitative estimate of hazard interactions should be addressed in a quantitative way (e.g., by using physical modeling of hazard (co-)occurrence). However, in situations where resources and data are limited, scores and weights are usually assigned based on scientific literature, professional intuition, and expert judgement [72].
In this application, a team of environmental risk experts represented by the authors of this paper performed the assignation of the influence weights (Table S5). The weighting procedure was performed considering the recent scientific evidences about storm surge flooding, sea level rise, and coastal erosion risks in the North Adriatic region [35,36,58]. Qualitative and individual evaluations involved in the process can limit the validity and reproducibility of the results. It is worth noting that the common scale adopted for the assignation of weights to hazard interactions removes a certain amount of subjectivity, adding credibility to the multi-hazard analysis (Table S3).
Table S5 highlights that sea-level rise is not affected by the influence of storm surge and coastal erosion (i.e., influence weight equal to 0), as, considering the hydrodynamic model SHYFEM used for this application (Table 1), it is mainly forced by regional climate variables related to atmospheric pressure and winds [35]. Therefore, the hazard influences considered in the assessment include sea-level rise affecting storm surge and coastal erosion, and storm surge affecting coastal erosion. Specifically, an influence weight equal to 0.8 was assigned to the influence of the sea-level rise to storm surge events due to the strong effects that sea-level rise could have on tidal range and the evolution of storm surges, exacerbating the intensity of flood events [11,58,77].
Sea-level rise will also affect coastal erosion; however, in the literature, there are still controversial studies for what concerns the nature of this relationship (e.g., [10,36,78,79]). Therefore, an influence weight equal to 0.5 was assigned to the relationship between sea-level rise and coastal erosion, providing a certain but intermediate importance to the synergy that the two investigated hazards could have. Finally, looking at the relation between storm surge and coastal erosion, an influence weight equal to 0.8 was provided. In fact, the effects that storm surges could have on coastal erosion are quite certain in the scientific literature: they will increase the probability and the rate of the beach removal (e.g., [2]).
The assessment of hazard interactions acting on the same spatial units (i.e., the raster grid cells) is then performed according to Function 1 in Table S4. If there are no relationships among the hazards, the cell maintains its initial score. Otherwise, the multi-hazard weighted score (hi’) of each cell is increased considering the potential synergy of overlapping hazards, represented by hazard influence weights. To provide a normalized multi-hazard score (h), all values (hi’) are aggregated into a weighted sum (Function 2 in Table S4).
Afterwards, the expert should define the probabilities of single hazards happening in the same timeframe (not necessary simultaneously), based on the available hazard data. The best option is to derive the probabilities from numerical modeling, but, unfortunately, there is still a significant lack of information about probabilities associated to climate change projections and related hazards [16]. The second option is to consider the analysis of past events happened with the intensity of concern in a given timeframe: the more numerous are the events, the higher is the probability of the related hazard. In addition, the inverse of the return period could be used to represent the probability of a hazard event as already suggested by several studies and directives concerning natural hazards risk assessment (e.g., [73,80]). However, if no probabilities can be defined for each hazard, the most precautionary and conservative approach is to consider a probability score equal to 1, assuming the investigated hazard as certain event in the timeframe. For the testing application of the MRA in the North Adriatic coast, a value equal to 1 was assigned to the sea-level rise and coastal erosion scenarios, as it was not possible to reconstruct the probabilities from historical data or numerical models for these phenomena. Instead, for the storm surge extreme event, the inverse of the return period (i.e., 1/500 = 0.002) was defined as probability value in the multi-hazard assessment.
Once probabilities of single hazards are defined, the disjoint probability is applied to each cell obtaining a total multi-hazard probability value p. Probabilities of each individual hazard is generally expressed as a number between 0 and 1, where 0 indicates that the hazard is not affecting the investigated cell (impossible outcome), and 1 indicates that the hazard will certainly happen.
Function 3 (Table S4) considers that the hazards could happen both individually (i.e., a single hazard h1 or h2 will affect the cell) or simultaneously (e.g., h1 happens together with h2 in the same cell). Accordingly, the higher is the number of the hazards affecting the cell, the higher is the total probability.
The last step of the multi-hazard assessment is aimed at the aggregation of the hazard scores and probabilities. Therefore, the final score is comprehensive of the normalized multi-hazard weighted score (h) and of the probability of occurrence of the hazards affecting the cell, according to Equation (1):
where hp is the multi-hazard score with the associated probability; h is the multi-hazard score of the investigated cell weighed, normalized in [0,1] (Function 2); and p is the probability of the investigated cell according to the disjunctive probability function (Function 3).
hp = h * p
The assignation of the influence weight allows the implementation of Functions 1 and 2 (Table S4), which provide a weighted and normalized multi-hazard score for each cell of the study area. The score, visualized in the multi-hazard map (Section 4.1), ranges from 0 to 1, where 0 means no hazards affecting the cell and 1 represents the cells where the number, weights, intensities, and probabilities of hazards are relatively higher.
3.2. Exposure Assessment
The main aim of the exposure assessment is to identify all the elements at risk (i.e., the receptors), representing valued natural or human attributes that can be threatened by the hazards [76]. The process considers all the relevant features of the territory such as environmental resources, physical infrastructure, socioeconomic activities, and human health.
The exposure score (e) is evaluated as follows:
According to the main characteristics and vulnerabilities of the territory, the scale of analysis and the available dataset (Section 2), the exposure assessment in the North Adriatic coast was focused on environmental receptors including beaches, river mouths, wetlands, protected areas, natural/semi-natural systems, and agricultural area. Relevant socioeconomic elements such as infrastructure and population were also considered in the analysis, selected as potential risk hotspots in urban areas.
The result of this step is a map showing the localization and the geographic extent of all the investigated receptors, including areas where multiple receptors are located and therefore more socioecological values are potentially at risk.
3.3. Multi-Vulnerability Assessment
The main aim of this step is the assessment of receptors’ vulnerability to multiple hazards in the case study area. It considers the presence of different elements at risk and their physical-environmental predisposition (sensitivity) to be adversely affected by multiple natural and climate-related hazards, which means that different receptors are differently sensible to the same risk [36].
The assessment is based on the selection and aggregation of multiple physical and environmental vulnerability factors (vf) representing the sensitivity of receptors to the different investigated hazards. According to Torresan et al. [37], this step is carried out through the development of a vulnerability matrix in which the main column is an inventory of the selected natural and climate-related hazards affecting the analyzed area and the main row lists the major receptors at risk. For each receptor, a set of vulnerability factors (vf, grey cells in the intersection between a hazard and a receptor) is defined representing physical, ecological, and socioeconomic parameters (e.g., slope, vegetation cover, wetland extent, and percentage of urbanization) relevant for measuring vulnerability to different hazards. The same relative scoring system and guideline is used to normalize quantitative and qualitative vulnerability factors in a common scale where 0 indicates no vulnerability and 1 indicates the maximum vulnerability in the analyzed region and case study (Table S3). Then, the vulnerability assessment continues with the aggregation of normalized vf for each cell of the case study. If a cell is characterized by one receptor (e.g., r1) that is affected by one hazard (e.g., H1), only the biophysical and environmental vulnerability factors related to H1 and r1 of the matrix are considered. If a cell is characterized by two or more receptors and two or more hazards, the aggregation process considers all the vf identified for those receptors and hazards taken only once.
Moreover, individual vulnerability factors can be weighted to represent their relative importance in the estimation of vulnerability associated with selected natural and climate-related hazards. In addition, in this case, experts are asked to provide a hierarchy of importance to vulnerability factors according to a common 0–1 scale (Table S3). This means that a specific vulnerability factor (vf1) can be highly relevant for one hazard (e.g., weight 1) and strongly less important for another hazard (e.g., 0.4).
Therefore, the final weight for a vulnerability factor vf, possibly part of several receptors and affected by several hazards, is defined as the maximum of the weights of obtained by each vf in relation to each hazard Hi.
The aggregation of the weighted vulnerability factors is then performed by applying the “probabilistic or” operator [81], defined as follows:
where:
- vf = physical and environmental multi-vulnerability score of the investigated cell to the investigated impact(s).
- = set of physical and vulnerability factors weighted by the corresponding . They are related to all impact(s) and receptors present in the investigated cell c, i.e. .
Shown below is an example of the “or” operator at work (Equation (4)):
where
- fi = ith generic factor f
Due to the associative and commutative proprieties, the process can be repeated for all the vf that are present in each cell of the case study.
The fuzzy “or” operator is used to apply a conservative approach in the vulnerability assessment process. If just a vulnerability factor (vf) assumes the maximum value 1 (e.g., presence of dunes, shrubbery, and eroding coast), the higher score 1 will be assigned to the overall multi-vulnerability index. On the other side, the more numerous are the vulnerability factors that are present in a cell, even with low vulnerability scores, the greater is the final multi-vulnerability. For instance, if a cell has 3 vf with a score of 0.2 (e.g., advancing large wetlands in delta areas), they result in a final multi-vulnerability of 0.6.
Table 3 shows the multi-vulnerability matrix developed for the North Adriatic coast.
Vulnerability factors were identified considering only storm surge and coastal erosion hazards, since a sea-level rise inundation event was assumed to affect all the receptors in the same way, causing a permanent loss of all submerged receptors, based only on the elevation of the cells that is considered in the hazard map. Therefore, each cell of the territory was considered to have the same vulnerability (i.e., equal to 1) to sea-level rise.
To apply Equation (3), the classification and scoring of vulnerability factors was provided by the authors considering previous studies [36,37] and the scientific literature included in Table S6. The classification and assumptions employed in the rating of vulnerability factors is summarized in the Supplementary Materials (Table S6).
Moreover, to define the relative importance of each vulnerability factor in the multi-vulnerability of coastal areas, weights were assigned by the MCDA expert team, according to the linguistic evaluations provide in Table S3. This process tends to remove subjectivity and add credibility to the assessment, improving the communication of results among the research community and towards the end-users of information (e.g., local authorities and decision-makers). The weighting process was implemented considering also the output of a roundtable organized with several local stakeholders and experts involved in the development of the DEcision support SYstem for COastal climate change impact assessment (DESYCO [74]). The local experts joining the table (including civil engineers and coastal geologists) were aware of some preliminary results of the MRA, which have influenced their opinion during the assigning of weights.
Overall, the local stakeholders and experts have joined a series of workshops organized by the authors of the paper within the FP7 research projects CLIM-RUN and PEGASO. As specified in the related publications [74,82], the local stakeholders and experts engaged in the MRA included public institutions with a specific mandate for Integrated Coastal Zone Management (ICZM) in the Veneto and Friuli-Venezia Giulia Regions (e.g., environmental protection agencies, managers of protected areas, and representatives of geological surveys and regional meteorological services). The participatory process engaged 37 people involved by means of surveys, local workshops, and focus groups (Table S1). The early and continuous stakeholders’ involvement accompanied the development and refinement of the MRA framework, and turned out to be very useful to frame the right research questions in terms of future time scenarios, geographical scale and resolution, choice of hazards, receptors, vulnerability factors, and risk thresholds and weights to be considered in the analysis. Moreover, it was useful to identify relevant research products (risk maps and statistics) responding to real end-users’ needs.
The assigned weights are reported in Table S7. Coastal typology, slope angle, and shoreline evolution gained the higher weights (i.e., 0.8) in the present assessment as they represent geo-physical characteristics very important for the assessment of receptors vulnerability, compared to other vulnerability factors; vegetation cover and dunes were considered to have medium-high weight (i.e., 0.6); and medium and low weights (i.e., 0.5 and 0.4) were assigned to the vulnerability factors most related to ecological characteristics (i.e., wetland extent, river mouth, agricultural use, and wetland typology) and the percentage of urbanization, respectively.
The result of the multi-vulnerability assessment is a map (Section 4.3) highlighting the areas more vulnerable to multiple natural and climate-related hazards according to the intrinsic characteristics of the investigated territory.
3.4. Multi-Risk Assessment
The main aim of the multi-risk assessment is a relative evaluation of the cumulative risks affecting the study area, taking into account correlation and probabilities of the analyzed hazards, the presence and localization of multiple elements at risk, and their vulnerability to the different types of hazards [76].
According to IPCC [10], the aggregation of hazard, exposure, and vulnerability scores allows the evaluation of the multi-risk in the case study, as shown in Equation (5):
where:
- r = multi-risk score;
- hp = multi-hazard score with the associated probability (Equation (1));
- e = exposure score related to the union of the geographical area of the investigated receptors (Equation (2)); and
- vf = physical and environmental multi-vulnerability score of the investigated cell to the investigated impact(s) (Equation (3)).
According to the proposed multi-risk equation, one or more interacting hazard(s) could affect one or more receptor(s) and the vulnerability of the receptors can change according to different hazards. This approach is more useful than a single-hazard risk assessment since it considers, in a systemic way, the multiple hazards affecting a specific region, allowing the definition of more comprehensive adaptation strategies [11].
The multi-risk equation aggregates the results of each step (multi-hazard, exposure, and multi-vulnerability) and provides an overall view of the causes and consequences of the different types of hazards in a single multi-risk map (Section 4.4).
4. Results
This section presents the results of the implementation of the MRA to the pilot case of the North Adriatic coast, describing the obtained multi-risk maps and statistics as well as the potential policy implications for climate change adaptation and disaster risk reduction. As clarified in Section 2.1, the multi-risk maps derive from the combination of existing single-hazard scenarios available for the North Adriatic region. Specific details concerning the single-hazard maps employed in the assessment for coastal erosion, storm surge flooding, and sea-level rise inundation hazards are available and can be found in [35,36,58].
4.1. Multi-Hazard Maps
The final result of the multi-hazard assessment (Figure 3) highlights that circa 75% of the study area could be affected by more than one climate-related hazard. The multi-hazard map was classified using the equal interval method allowing the division of the scores into 5 equal sized classes (i.e., very low, low, medium, high, and very high). The equal interval is best applied to data ranges in order to emphasize the amount of an attribute value relative to other values. Moreover, this method is widely used for simplifying maps understanding and comparability amongst different scenarios [83].
From the maps in Figure 3I, it is possible to see that the higher multi-hazard classes are located near the coastline where there is an overlapping of the three considered hazards (i.e., sea-level rise, storm surge, and coastal erosion). Generally, the multi-hazard decreases with the distance from the coastline, going progressively from the highest to the lowest scores. In Figure 3I(a,b), the presence of artificial protections attenuates the multi-hazard score (streaked effect) near the shoreline. Figure 3I refers to the northern part of the Venice lagoon (Figure 3I(b) and the fragile area of the Po Delta (Figure 3I(c). In these areas, the high and very high multi-hazard classes denote the joint presence of coastal erosion (close to the Adriatic Sea), sea-level rise, and storm surge drivers.
Overall, the multi-hazard assessment allows the identification of coastal areas that could be affected by multiple hazards. As summarized in Figure 3II, the study area will be affected by different hazards for almost 75% of the territory (i.e., 2635 km2). Specifically, the 72% will be affected by one or two hazards (i.e., lower multi-hazard scores) and the 3% (i.e., higher multi-hazard scores) by all the three hazards.
Therefore, the multi-hazard map is useful for: getting a general picture of the investigated coastal hazards; supporting broader planning decisions in the long term; and identifying multi-hazard hotspots. Moreover, by exploring the single-hazard layers, it could be used to support sectorial planning decisions at the regional/sub-regional level (e.g., flood and coastal erosion mapping). Specifically, by integrating the effect of future climate change scenarios, the multi-hazard map is relevant for forward-looking analysis and for long-term planning decisions related to infrastructure development, human settlements and ecosystem conservation. Finally, this information could increase the awareness of coastal managers about multiple hazards affecting the same region, supporting the achievement of higher level of protections and resilience against disasters and climate change, as explicitly requested by the European Adaptation Strategy [7] and the Post 2015 Development Agendas [3,4].
4.2. Exposure Map
The exposure map (Figure 4) allows the spatial visualization of the investigated elements at risk in the North Adriatic study area.
Most of the territory is characterized by agricultural areas (ca. 70% in light green), which, in some areas, overlaps with protected areas and river mouths (e.g., the Natural reserve of the Po River Delta) highlighting complex and fragile ecosystems that should be preserved. Moreover, 11% of the North Adriatic coastal area is represented by urban areas (e.g., Venice municipality and around Grado and Marano lagoon), which includes infrastructures, buildings, and inhabitants and could be affected by multiple-risks causing damages to people, economic activities, and the environment. Other small receptors relevant at the local level are analyzed (i.e., beaches, natural and semi-natural systems, and wetlands) as they represent important features for the North Adriatic coastal area, increasing the socioecological and economic importance of this region. Overall, the assessment of exposure is instrumental to identify the elements potentially at risk (Section 4.4), such as the number of people, the total surface of buildings, and croplands located in potentially flooded areas, as required by the Sendai Framework for Disaster risk reduction (Targets A–C) [3].
4.3. Multi-Vulnerability Map
The multi-vulnerability map (Figure 5) was classified using the equal interval method allowing the division of the scores into five equal sized classes (i.e., very low, low, medium, high, and very high) [78].
Figure 5I highlights that generally multi-vulnerability is high or very over the whole territory. This is due to the widespread presence of low-sloped areas in the study area, and the predominant presence of arable lands, which are considered the more vulnerable class for the vulnerability factor agricultural use (Table S6). As shown in Figure 5II, the ranking of vulnerable receptors (including the percentage of vulnerable areas for the elements at risk identified in Section 4.2) indicates that beaches, wetlands, protected areas and river mouths have a very high multi-vulnerability score ranging from 95% for beaches (ca. 13 km2) to 52% for river mouths (ca. 422 km2), while agricultural areas are featured by 54% of surface within the highest multi-vulnerability class. In addition, the vulnerability factor “percentage of urbanization” (Table S6) plays an important role in increasing the multi-vulnerability score, especially where the rating is higher than 10%, e.g. in the hinterland area of the Venice lagoon.
It is worth noting that the low and very low multi-vulnerability classes are scarce in the North Adriatic area, with a percentage ranging from less than 1% (for protected and urban areas) to ca. 20% (e.g., for the urban areas near Trieste that are featured by steeper slopes and a lower percentage of urbanization).
Finally, it is possible to see that overall the multi-vulnerability hotspots are located in the Po Delta and in the Venice lagoon where there is an overlay of exposed sensitive receptors, such as protected areas, river mouths, and wetlands. Protected areas are highly vulnerable due to their ecological and biodiversity relevance for different European directives (e.g., Nature 2000 network and Habitat and Bird Directives).
We recognize that land subsidence can accelerate marine ingression in low-lying coastal plains. For this reason, data on subsidence rates should have been considered in the multi-vulnerability assessment. The Italian coast of the North Adriatic Sea is characterized by diffuse and uneven vertical land movements, with some local sinking hotspots [46]. In the Veneto Region, the city of Venice and its lagoon are particularly vulnerable to land subsidence [84], with large local variability [85]. Even though the historical city of Venice and the central lagoon are relatively stable (with an average land subsidence of 1–2 mm/year), the northeastern coastland bordering the lagoon is characterized by higher sinking rates (4–6 mm/year). Moreover, some hotspots (up to 30 mm/year) can be observed at the lagoon inlets, where the new structures of the MOSE works (i.e., the mobile barriers designed for the protection of the city from high tides) are under construction. The salt marshes (which naturally protect the lagoon of Venice from storm surges and erosion), are also featured by variable subsidence rates reaching 20 mm/year. Other significant—but localized—sinking movements have been observed in correspondence of newly built-up areas (e.g., the tourist villages near the city of Jesolo to the north of the Venice lagoon), highlighting the need to monitor the anthropogenic land subsidence due to the establishment of new settlements, structures, and infrastructures. South of the Venice lagoon, the city of Chioggia and its surroundings are more stable (subsidence rate of about 1 mm/year), whereas higher sinking rates can be observed near the mouths of the Brenta and Adige Rivers. Subsidence up to 10–15 mm/year have been measured in the Po River Delta [86], which is a well-known vulnerable hotspot to relative sea-level rise [87].
Going to the Friuli Venezia Giulia Region, a recent analysis of land subsidence around the coastal area of the Grado and Marano lagoon [88] showed a regional southwest gradient (going from the hinterland toward the sea) with subsidence rates reaching 4 mm/year in the area adjacent to the mouth of the Tagliamento River. Even if the average subsidence of the Grado-Marano lagoon is about 2 mm/year, the northern coastal area bordering the lagoon ranges from a stable condition to a subsidence of about 8 mm/year. Finally, the littoral zone of the Grado-Marano lagoon shows uneven subsidence rates due to the combination of natural and local anthropogenic drivers (e.g., groundwater exploitation, loads induced by newly built-up areas for the tourism sector).
The present multi-vulnerability assessment did not integrate subsidence information due to the lack of accessible quantitative data with homogeneous spatial coverage, at the time of our analysis. However, this lack would not have changed the overall multi-vulnerability score of the main hotspots shown in Figure 5I (i.e., the red areas around the Po River Delta and those bordering the central and northern part of the Venice lagoon). On the contrary, the consideration of the recent subsidence studies in the multi-vulnerability map could have increased the vulnerability score of some local sites in the norther littoral zone of Venice (Jesolo municipality) and along the shoreline of the Grado and Marano lagoon, where recent anthropic drivers of subsidence (e.g., newly urbanized areas) are contributing to local subsidence phenomena. For this reason, we recommended monitoring this parameter in future site-specific analysis, in order to refine the investigation of subsiding areas that could increase present and future vulnerability to marine ingression.
Combined with the exposure assessment, the multi-vulnerability map can be useful for local and regional authorities to identify vulnerable hotspots where the resilience to multiple hazards (i.e., permanent/temporary inundation and coastal erosion) should be increased. For instance, it can help decision-makers in a first screening of infrastructure or buildings susceptible to coastal flooding (e.g., roads and houses located in gentle sloping and low-lying areas) and in the identification of urban areas where the drainage systems could be improved. Relevant examples of measures aimed at increasing the resilience (or reducing the vulnerability) of coastal communities are represented by nature-based solutions providing multiple benefits for human and environmental well-being [89]. These measures can be set-up for different receptors to mitigate multiple hazards and include all the actions aimed at conserving, restoring and reconstructing ecosystems (e.g., reinforcement of arboreal communities in areas susceptible to flooding; restoration of wetlands to mitigate the effects of floods; and stabilization of sandy dunes with vegetation to reduce coastal erosion).
4.4. Multi-Risk Map
The multi-risk map (Figure 6I) is the final result of the MRA. Similar to the previous maps, it is classified using the equal interval method, allowing the division of the scores into five equal-sized classes (i.e., very low, low, medium, high, and very high) [71].
Generally, multi-risk scores are lower than the multi-hazard ones as they are multiplied by multi-vulnerability (i.e., scores ranging 0–1). However, in Figure 6I, the same trend of the multi-hazard map is still visible. The hotspot risk zones shown in Figure 6I(a) are beaches, which is the receptor most affected by multiple risks, with a percentage of about 60% in the very high and high multi-risk classes (Figure 6II). The medium multi-risk areas around the Venice and Marano/Grado lagoons, instead, are mainly associated to the receptors wetlands and protected areas (Figure 6I(a,b)). Finally, around the Po River Delta (Figure 6I(c)), the higher multi-risk classes are located near the shoreline while decreasing risk scores can be observed going inland, following the trend of the multi-hazard map.
Figure 6II shows the ranking of receptors affected by multiple risks and, together with the statistics included in Figure S1, supports the identification of the more affected municipalities in the study area (e.g., Staranzano, Porto Tolle, Grado, Cavallino-Treporti, Caorle, and Venice).
Overall, the multi-risk assessment can be useful to highlight hotspots for future foreshore protection (e.g., priority areas for beach erosion and sea-level defenses) within Integrated Coastal Zone Management plans. Moreover, such maps can be useful to support ecosystems management in compliance with international environmental restrictions (e.g., Nature 2000 sites) and national and regional laws for the defense of the littoral zone [88]. The multi-risk maps are particularly helpful since they provide an integrated vision of the elements at risk from multiple hazards, considering the potential effects of climate change. This systemic view can be very helpful to reduce the likelihood that risk reduction efforts targeting one type of impact increase the exposure or vulnerability to other impacts [11,88].
Additional information useful for coastal managers can be obtained from the statistics presented in Figure 7, concerning the infrastructure and population at risk in urban areas, for the coastal municipalities of the study area.
Even if all the municipalities show relatively higher percentages of infrastructure (km) and population (number of citizens) in the lower multi-risk classes, it is possible to note that highly urbanized municipalities (e.g., Jesolo and Caorle) are partly affected by higher multi-risk scores. This information can help regional authorities in the identification of the municipalities more threatened by multi-risk, supporting an efficient allocation of risk management funds.
Overall, multi-risk maps and statistics can be used as a quick scan tool to rank coastal areas and municipalities requiring higher attention for the implementation of disaster risk reduction and climate adaptation strategies (e.g., coastal sediment management plans, flood proofing, or relocation of existing developments). The results can be helpful particularly helpful for the implementation of National Adaptation Plans, as required by the European Adaptation Strategy [73].
5. Discussion
The proposed MRA methodology is a first attempt to consider how multi-hazard interactions could trigger cumulative risks in flood-prone coastal areas. This is an important advancement compared to conventional single-hazard risk assessments, since it provides a systemic and forward-looking analysis able to consider: (1) how compound hazards could trigger risk amplifications on the same spatial units and timeframe; and (2) how the vulnerability of multiple elements at risk could vary according to different types of hazards.
Our MRA is conceived as a decision support tool aiding multi-risk screening at the regional/sub-national scale. One of the strengths of the approach is that it can be applied with publicly available datasets, to offer an improved basis for understanding and communicating multi-risk patterns to local authorities, stakeholders, and decision-makers. Moreover, by varying the parameters of the MRA model, it is possible to understand the relative importance of the main factors influencing multi-risk, as well as the effect of different climate and risk management scenarios. The final goal of the assessment is to provide an overall picture of the multiple threats affecting low-lying coastal areas in view of climate change, supporting the definition of holistic adaptation strategies avoiding maladaptation (e.g., due to fragmented single-hazard or single-sector measures). Overall, the MRA employs a wide range of physical, environmental and socioeconomic indicators widely used to help decision makers in the definition of disaster risk reduction and climate adaptation policies [72,90,91,92].
However, differently from usual applications of Multi-Criteria Decision Analysis focusing on individual elements at risk, ecological functions, or services [93,94,95,96,97,98], our methodology sets up a conceptual framework considering multiple cause–effect relationships and allows progressively systemizing different sources of empirical and modeling data to achieve an holistic estimate of coastal risks affecting both natural and human systems. Moreover, compared to recent studies assessing coastal vulnerability in the North Adriatic region [35,36,58] and Mediterranean region [99], the operative steps of the MRA allow an improved understanding of multi-hazard interactions in the coastal system, and of their cumulative impact in the final categorization of risks.
Even if the proposed MRA goes beyond the traditional hazard assessment by considering the potential relations among selected types of climate-related hazards, the methodology could be improved by integrating information related to other types of natural or man-made hazards (e.g., river floods, subsidence, and contamination of water resources). Particularly, land subsidence is an important factor that should be considered in the multi-hazard analysis, since it may amplify both sea level rise and storm surges flooding and the related risk scenarios in the North Adriatic coastal plains [30,58]. However, even if specific studies have been conducted to assess the rate of subsidence over the Venice lagoon [64,85,87,88], we could not consider this phenomenon in our MRA analysis since comprehensive and homogeneous spatial data for the whole study area (i.e., the interregional/sub-national scale) were not available when we developed the study. Nevertheless, MRA is an iterative process that should be regularly updated when new datasets related to coastal hazards or vulnerability indicators are available. Another important constraint was that there is still large uncertainty in the extrapolation of future subsidence values based on past trend observations, especially when the causes of subsidence are both natural and man-made, such as for the North Adriatic region [100]. We recognize that a more detailed analysis focused on specific regions (e.g., the city of Venice or the Po River Delta) should consider subsidence as a relevant triggering factor in the multi-hazard assessment.
The assessment and management of multiple natural hazards and climate-related risks requires an extension of commonly applied risk assessment and management frameworks toward the identification and quantification of multiple stressors interactions [16]. The MCDA based approach adopted in this paper is suitable for a preliminary consideration of risk interactions (which are still not well understood) and provides a relative (not absolute) quantification of multi-risk hotspots. However, most variables described in the MCDA rely on expert knowledge and depend on the individual perception of the system, failing to provide a strong quantitative assessment and validation of results [28].
More detailed knowledge on multi-risk patterns, therefore, may be obtained by progressing to a quantitative level of analysis at a site-specific spatial scale, applying more sophisticated complex system analysis tools such as Bayesian networks, agent-based models, or system dynamics [27]. Such methods are increasingly being applied for cumulative impact assessments of climate and anthropogenic hazards in different context (mountain regions, freshwater resources management, and marine areas) since they can provide a stochastic assessment of multi-risk values, combined with an improved characterization of uncertainties [101,102].
6. Conclusions
Decision makers and local authorities need to have a clear vision of systemic risks affecting human health and safety, the environment, the economy, and society at large to develop robust adaptation pathways [103,104]. However, such assessment is notoriously difficult due to the complex and uncertain combinations of hazardous events that might happen, the multiplicity of physical processes involved, and the continuous changes and interactions of vulnerable socioecological systems. Moreover, multi-risk dynamics are characterized by complex domino effects that could amplify the overall impact on exposed elements. Those include chains of hazardous events and increasing vulnerability of receptors, together with other types of correlations among the different risk components [9]. Understanding how different hazards and vulnerabilities sources interact to determine emerging risk states is one of the open issues for the scientific community, which is attempting to shift from the single-risk paradigm toward the more challenging systemic risk concept [29].
The proposed methodology should be considered as a quick scan tool, allowing the semi-quantitative evaluation of the relationships among different hazards (and vulnerabilities) in the same area. A more detailed and quantitative assessment should consider the joint probabilities of single and compound hazards and how vulnerability changes according to different hazard thresholds [83]. Since it does not require a large amount of data, the proposed MRA is flexible and scalable in a wide range of conditions and geographical regions. Moreover, it has been conceived with a modular approach, allowing an easy upgrade to additional natural hazards, climate change impacts, or vulnerable sectors. For instance, the multi-hazard assessment that has been focused thus far on climate-driven hazards affecting the shoreline at the regional scale (e.g., storm surges, sea-level rise, and erosion) could be in principle expanded to the analysis of additional hazards relevant at the local scale (e.g., local subsidence, heavy rainfall events, and urban heat islands), given the availability of more detailed data on this phenomena. Specifically, a comprehensive analysis of vertical land movements should be considered to achieve a better understanding of the potential correlations between climate and non-climate drivers contributing to future marine ingression. Additionally, the multi-vulnerability assessment, now focused on the physical and environmental dimensions of vulnerability, can be improved by integrating adaptive and coping capacity indicators (e.g., income level, education, and safety network) and other social factors related to individual and collective behaviors and risk perceptions. Moreover, parameters and algorithms for the economic assessment could be in principle included in the multi-risk modeling, allowing the estimate of consequences in terms of direct and indirect costs.
Finally, we recognize that the exposure and vulnerability dynamics are very important for analyzing multi-risk patterns, especially in coastal areas [105]. Therefore, future improvements of our MRA methodology should provide a more realistic comprehension of the distributions of the elements at risk across space and time (e.g., land use, population, and infrastructure dynamics) and of their vulnerability.
To properly support decision-making processes and assess the efficacy of different adaptation pathways, future testing of the MRA should consider how different management options can contribute to the reduction of the overall multi-risk score.
Finally, it is important to underline that the multi-risk methodology allows a relative ranking of the cumulative investigated impacts and risks and should be re-applied each time improved input information and data (e.g., new models and more accurate site-specific indicators) become available. To this respect, a future ambitious improvement of the MRA includes the exploitation of big data analytics and Information and Communication Technologies (ICT) to run a huge amount of risk scenarios and cascading uncertainties in space and time, in order to provide robust science-based outputs for decision-making in a multi-risk perspective.
Supplementary Materials
The following are available online at https://www.mdpi.com/2071-1050/12/9/3697/s1, Table S1: Public institutions involved as stakeholders and territorial experts during the implementation of the multi-risk assessment methodology in the North Adriatic coast [source: adapted from (Santoro et al., 2013)]. Table S2: Example of hazard influence matrix. Hazard scores are placed in the grey cells. Weights used to measure hazard interactions (e.g., influence of sea level rise (h1) on coastal erosion (h2)) are placed in the white cells, Table S3: Linguistic evaluation supporting the expert in the assignation of relative scores and weights (adapted from [1]), Table S4: Multi-hazard functions and their description applied in the multi-hazard assessment, Table S5: Hazard influence matrix applied to the North Adriatic case study. In the white cells, the influence weights are listed, Table S6: Vulnerability factors, classes and scores for the receptors analyzed in the North Adriatic case study. NA means Not Applied and concerns the vulnerability classes that are not relevant for the considered hazards, Table S7: Weights assigned to the vulnerability factors in the North Adriatic case study, Figure S1: Percentage of surface associated with the very high and high multi-risk classes for the investigated receptors in the ten coastal municipalities most affected by multi-risk in the North Adriatic coast.
Author Contributions
Conceptualization, V.G., S.T., and A.C.; methodology, V.G., S.T., A.Z., A.C., T.G., and A.M.; formal analysis, V.G.; writing—original draft preparation, V.G., S.T., and A.C.; and writing—review and editing, S.T. and A.C. All authors have read and agreed to the published version of the manuscript.
Funding
The research leading to these results has received funding from the Italian Ministry of Education, University and Research and the Italian Ministry of Environment, Land, and Sea under the GEMINA project.
Acknowledgments
The authors gratefully acknowledge the Centro Euro-Mediterraneo sui Cambiamenti Climatici (CMCC, www.cmcc.it) for financial support. The authors also thank their colleagues Jonathan Rizzi and Elisa Furlan for the assistance with the GIS analysis.
Conflicts of Interest
The authors declare no conflict of interest.
References
- Renn, O.; Lucas, K.; Haas, A.; Jaeger, C. Things are different today: The challenge of global systemic risks. J. Risk Res. 2019, 22, 401–415. [Google Scholar] [CrossRef]
- UNISDR. Hyogo Framework for Action 2005–2015: Building the Resilience of Nations and Communities to Disasters. Extract from the Final Report of the World Conference on Disaster Reduction. 2005. Available online: https://www.unisdr.org/2005/wcdr/intergover/official-doc/L-docs/Hyogo-framework-for-action-english.pdf (accessed on 24 April 2020).
- UNISDR. Sendai Framework for Disaster Risk Reduction 2015–2030. In UN Report UNISDR/GE/015; United Nations Office for Disaster Risk Reduction: Geneva, Switzerland, 2015. [Google Scholar]
- UN. Transforming Our World: The 2030 Agenda for Sustainable Development. 2015. Available online: https://sustainabledevelopment.un.org/post2015/transformingourworld/publication (accessed on 24 April 2020).
- EC. Commission Staff Working Document: Overview of Natural and Man-Made Disaster Risks in the European Union May Face; SWD: Bruxelles, Belgium, 2017. [Google Scholar] [CrossRef]
- IPCC. IPCC. IPCC Special Report 1.5—Summary for Policymakers. In Global Warming of 1.5 °C; An IPCC Special Report on the Impacts of Global Warming of 1.5 °C above Pre-Industrial Levels and Related Global Greenhouse Gas Emission Pathways, in the Context of Strengthening the Global Response to the Threat of Climate Change, Sustainable Development, and Efforts to Eradicate Poverty; Masson-Delmotte, V., Zhai, P., Pörtner, H.-O., Roberts, D., Skea, J., Shukla, P.R., Pirani, A., Moufouma-Okia, W., Péan, C., Pidcock, R., et al., Eds.; World Meteorological Organization: Geneva, Switzerland, 2018; p. 32. ISBN 9789291691432. [Google Scholar]
- EC. Communication from the Commission to the European Parliament, the Council, the European Economic and Social Committee and the Committee of the Regions an EU Strategy on Adaptation to Climate Change COM; EC: Bruxelles, Belgium, 2013. [Google Scholar]
- EC. Communication from the Commission to the European Parliament, the Council, the European Economic and Social Committee and the Committee of the Regions. The European Green Deal. COM; EC: Bruxelles, Belgium, 2019. [Google Scholar]
- Scolobig, A.; Komendantova, N.; Mignan, A. Mainstreaming Multi-Risk Approaches into Policy. Geosciences 2017, 7, 129. [Google Scholar] [CrossRef] [Green Version]
- IPCC. Climate Change 2014: Impacts, Adaptation, and Vulnerability. Part A: Global and Sectoral Aspects. Contribution of Working Group II to the Fifth Assessment Report of the Intergovernmental Panel on Climate Change; Field, C.B.V.R., Barros, D.J., Dokken, K.J., Eds.; Cambridge University Press: Cambridge, UK; New York, NY, USA, 2014. [Google Scholar]
- IPCC. Managing the Risks of Extreme Events and Disasters to Advance Climate Change Adaptation—Special Report of the Working Groups I and II of the Intergovernmental Panel on Climate Change; Cambridge University Press: Cambridge, UK, 2012; ISBN 9781139177245. [Google Scholar]
- Ramieri, E.; Hartley, A.; Office, M.; Barbanti, A.; National, I.; Santos, F.D. Methods for assessing coastal vulnerability to climate change. ETC CCA Tech. Pap. 2011, 1, 1–93. [Google Scholar]
- Hinkel, J.; Klein, R.J.T. The DINAS-COAST project: Developing a tool for the dynamic and interactive assessment of coastal vulnerability. Glob. Environ. Chang. 2009, 19, 384–395. [Google Scholar] [CrossRef]
- Mcleod, E.; Poulter, B.; Hinkel, J.; Reyes, E.; Salm, R. Sea-level rise impact models and environmental conservation: A review of models and their applications. Ocean Coast. Manag. 2010, 53, 507–517. [Google Scholar] [CrossRef]
- Dilley, M.; Chen, R.S.; Deichmann, U.; Lerner-Lam, A.L.; Arnold, M. Natural Disaster Hotspots: A Global Risk Analysis; The World Bank and Columbia University: Washington, DC, USA, 2005; ISBN 0821359304. [Google Scholar]
- Gallina, V.; Torresan, S.; Critto, A.; Sperotto, A.; Glade, T.; Marcomini, A. A review of multi-risk methodologies for natural hazards: Consequences and challenges for a climate change impact assessment. J. Environ. Manag. 2016, 168, 123–132. [Google Scholar] [CrossRef]
- Tilloy, A.; Malamud, B.D.; Winter, H.; Joly-laugel, A. A review of quantification methodologies for multi-hazard. Earth Sci. Rev. 2019, 196, 102881. [Google Scholar] [CrossRef]
- Kappes, M.S.; Keiler, M.; von Elverfeldt, K.; Glade, T. Challenges of analyzing multi-hazard risk: A review. Nat. Hazards 2012, 64, 1925–1958. [Google Scholar] [CrossRef] [Green Version]
- Greiving, S.; Fleischhauer, M.; Lückenkötter, J. A methodology for an integrated risk assessment of spatially relevant hazards. J. Environ. Plan. Manag. 2006, 49, 1–19. [Google Scholar] [CrossRef]
- Olfert, A.; Greiving, S.; Batista, M.J. Regional multi-risk review, hazard weighting and spatial planning response to risk-Results from European case studies. Spec. Pap. Surv. Finl. 2006, 42, 125. [Google Scholar]
- Schmidt-Thomé, P. Natural and Technological Hazards and Risks Affecting the Spatial Development of European Regions; Geological survey of Finland Espoo: Espoo, Finland, 2006; Volume 42, ISBN 9516909442. [Google Scholar]
- Farrokh, N.; Zhongqiang, L.; Gordon, W.; Jochen, Z. Framework for multi-risk assessment, Deliverable D5.2. MATRIX Proj. 2013. Grant agreement ID: 265138. [Google Scholar]
- Kappes, M.S.; Gruber, K.; Frigerio, S.; Bell, R.; Keiler, M.; Glade, T. The MultiRISK platform: The technical concept and application of a regional-scale multihazard exposure analysis tool. Geomorphology 2012, 151–152, 139–155. [Google Scholar] [CrossRef]
- Liu, Z.; Nadim, F.; Garcia-Aristizabal, A.; Mignan, A.; Fleming, K.; Quan Luna, B. A three-level framework for multi-risk assessment. Georisk Assess. Manag. Risk Eng. Syst. Geohazards 2015, 9, 59–74. [Google Scholar] [CrossRef] [Green Version]
- Marzocchi, W.; Garcia-Aristizabal, A.; Gasparini, P.; Mastellone, M.L.; Di Ruocco, A. Basic principles of multi-risk assessment: A case study in Italy. Nat. Hazards 2012, 62, 551–573. [Google Scholar] [CrossRef]
- Kappes, M.S. Multi-Hazard Risk Analyses: A Concept and Its Implementation; na: Wien, Austria, 2011. [Google Scholar]
- Terzi, S.; Torresan, S.; Schneiderbauer, S.; Critto, A.; Zebisch, M.; Marcomini, A. Multi-risk assessment in mountain regions: A review of modelling approaches for climate change adaptation. J. Environ. Manag. 2019, 232, 759–771. [Google Scholar] [CrossRef]
- Sperotto, A.; Molina, J.L.; Torresan, S.; Critto, A.; Marcomini, A. Reviewing Bayesian Networks potentials for climate change impacts assessment and management: A multi-risk perspective. J. Environ. Manag. 2017, 202, 320–331. [Google Scholar] [CrossRef]
- Zscheischler, J.; Westra, S.; Van Den Hurk, B.J.J.M.; Seneviratne, S.I.; Ward, P.J.; Pitman, A.; Aghakouchak, A.; Bresch, D.N.; Leonard, M.; Wahl, T.; et al. Future climate risk from compound events. Nat. Clim. Chang. 2018, 8, 469–477. [Google Scholar] [CrossRef]
- Gambolati, G.; Teatini, P.; Gonella, M. GIS simulations of the inundation risk in the coastal lowlands of the Northern Adriatic Sea. Math. Comput. Model. 2002, 35, 963–972. [Google Scholar] [CrossRef]
- Thorne, C.; Thorne, C.R.; Evans, E.P.; Penning-Rowsell, E.C. Future Flooding and Coastal Erosion Risks; Thomas Telford: London, UK, 2007; ISBN 0727734490. [Google Scholar]
- Lionello, P.; Cogo, S.; Galati, M.B.; Sanna, A. The Mediterranean surface wave climate inferred from future scenario simulations. Glob. Planet. Chang. 2008, 63, 152–162. [Google Scholar] [CrossRef]
- Hinkel, J.; Brown, S.; Exner, L.; Nicholls, R.J.; Vafeidis, A.T.; Kebede, A.S. Sea-level rise impacts on Africa and the effects of mitigation and adaptation: An application of DIVA. Reg. Environ. Chang. 2012, 12, 207–224. [Google Scholar] [CrossRef]
- Torresan, S. Development of a Regional Risk Assessment Methodology for Climate Change Impact Assessment and Management in Coastal Zones; Università Ca’ Foscari Venezia: Venice, Italy, 2011. [Google Scholar]
- Torresan, S.; Gallina, V.; Gualdi, S.; Bellafiore, D.; Umgiesser, G.; Carniel, S.; Sclavo, M.; Benetazzo, A.; Giubilato, E.; Critto, A. Assessment of climate change impacts in the North Adriatic coastal area. Part I: A multi-model chain for the definition of climate change hazard scenarios. Water 2019, 11, 1157. [Google Scholar] [CrossRef] [Green Version]
- Gallina, V.; Torresan, S.; Zabeo, A.; Rizzi, J.; Carniel, S.; Sclavo, M.; Pizzol, L.; Marcomini, A.; Critto, A. Assessment of climate change impacts in the North Adriatic coastal area. Part II: Consequences for coastal erosion impacts at the regional scale. Water 2019, 11, 1300. [Google Scholar] [CrossRef] [Green Version]
- Torresan, S.; Critto, A.; Rizzi, J.; Marcomini, A. Assessment of coastal vulnerability to climate change hazards at the regional scale: The case study of the North Adriatic Sea. Nat. Hazards Earth Syst. Sci. 2012, 12, 2347–2368. [Google Scholar] [CrossRef]
- Pirazzoli, P.A. A review of possible eustatic, isostatic and tectonic contributions in eight late-Holocene relative sea-level histories from the Mediterranean area. Quat. Sci. Rev. 2005, 24, 1989–2001. [Google Scholar] [CrossRef]
- Ferrarin, C.; Chiggiato, J.; Bajo, M.; Schroeder, K.; Zaggia, L.; Benettazzo, A. VENEZIA: L’acqua Alta Eccezionale Del 12/11/2019. Analisi Preliminare dei Dati E Descrizione Della Fenomenologia; CNR: Venice, Italy, 2019; pp. 1–6. [Google Scholar]
- Sperotto, A.; Torresan, S.; Gallina, V.; Coppola, E.; Critto, A.; Marcomini, A. A multi-disciplinary approach to evaluate pluvial floods risk under changing climate: The case study of the municipality of Venice (Italy). Sci. Total Environ. 2015, 562, 1031–1043. [Google Scholar] [CrossRef]
- Pesce, M.; Critto, A.; Torresan, S.; Giubilato, E.; Santini, M.; Zirino, A.; Ouyang, W.; Marcomini, A. Modelling climate change impacts on nutrients and primary production in coastal waters. Sci. Total Environ. 2018, 628–629, 919–937. [Google Scholar] [CrossRef]
- Rizzi, J.; Torresan, S.; Critto, A.; Zabeo, A.; Brigolin, D.; Carniel, S.; Pastres, R.; Marcomini, A. Climate change impacts on marine water quality: The case study of the Northern Adriatic sea. Mar. Pollut. Bull. 2016, 102, 271–282. [Google Scholar] [CrossRef]
- Bondesan, M.; Castiglioni, G.B.; Elmis, C.; Gabbianellis, G.; Marocco, R.; Pirazzolift, P.A.; Tomasin, A. Coastal areas at risk from storm surges and sea-level rise in northeastern Italy. J. Coast. Res. 1995, 11, 1354–1379. [Google Scholar]
- Ferretti, O.; Delbono, I.; Furia, S.; Barsanti, M. Elementi Di Gestione Costiera-Parte I Tipi morfo-sedimentologici dei litorali italiani. Rapp. Tec. ENEA RT/2003/42/CLIM 2003, 42, 146. [Google Scholar]
- Umgiesser, G.; Anderson, J.B.; Artale, V.; Breil, M.; Gualdi, S.; Lionello, P.; Marinova, N.; Orlic, M.; Pirazzoli, P.; Rahmstorf, S. From Global to regional: Local Sea Level Rise Scenarios. Focus on the Mediterranean Sea and the Adriatic Sea. In Proceedings of the Workshop Report: UNESCO, Venice, Italy, 2–6 July 2011; Volume 1. [Google Scholar]
- Antonioli, F.; Anzidei, M.; Amorosi, A.; Lo Presti, V.; Mastronuzzi, G.; Deiana, G.; De Falco, G.; Fontana, A.; Fontolan, G.; Lisco, S.; et al. Sea-level rise and potential drowning of the Italian coastal plains: Flooding risk scenarios for 2100. Quat. Sci. Rev. 2017, 158, 29–43. [Google Scholar] [CrossRef] [Green Version]
- Marsico, A.; Lisco, S.; Lo Presti, V.; Antonioli, F.; Amorosi, A.; Anzidei, M.; Deiana, G.; De Falco, G.; Fontana, A.; Fontolan, G.; et al. Flooding scenario for four italian coastal plains using three relative sea level rise models. J. Maps 2017, 13, 961–967. [Google Scholar] [CrossRef] [Green Version]
- Ministero Dell’Ambiente. Seventh National Communication under the UN Framework Convention on Climate Change; Ministero dell’Ambiente: Rome, Italy, 2017. [Google Scholar]
- Cecconi, G.; Ardone, V. La protezione dei litorali con ripascimento delle spiagge. L’esperienza dei litorali di Cavallino e Pellestrina. Proc. La Progett. Ambient. Nei Sist. Costieri Cura M Pietrobelli Atti X Semin. Roma Italy 1998, 10, 20–32. [Google Scholar]
- Caniglia, G.; Casetta, D.; Nascimbeni, P.; Pizzinato, C. Aspetti del dinamismo della vegetazione nell’edificazione di un sistema dunoso artificiale (Venezia–Cavallino). La Progett. Ambient. Nei Sist. costieri Cura M Pietrobelli Atti X Semin. Roma 1998, 10, 42–47. [Google Scholar]
- Cecconi, G.; Ardone, V. La fonte di approvvigionamento della sabbia nel ripascimento dei litorali veneti. Interv. Alla Present Della Costa Ligure Reg Liguria Genova 2000, 1, 2–4. [Google Scholar]
- Visintini Romanin, M.; Rismondo, A.; Scarton, F.; Leita, L. Interventi per il recupero morfologico della laguna di Venezia. La Barena Fossei Est Laguna Sud. Quad. Trimest 2000, 3, 3–35. [Google Scholar]
- Region, F.V.G. Piano di gestione del SIC IT3320037 Laguna di Grado e Marano. Cart. Delle Aree Di Tutela E Di Interv. Scala 2008, 1, 50000. [Google Scholar]
- Cecconi, G. The Venice Lagoon mobile barriers Sea level rise and impact of barrier closures. In Proceedings of the Italian Days of Coastal Engineering, Venice, Italy, 16 May 1997. International Debate-PIC 97. [Google Scholar]
- UNEP-MAP-RAC/SPA. Impact of Climate Change on Marine and Coastal Biodiversity in the Mediterranean Sea: Current State of Knowledge; Ben Haj, S., Limam, A., Eds.; United Nations Environnement Programme (UNEP) Mediterranean Action Plan (MAP) Regional Activity Centre for Specially Protected Areas (RAC/SPA): Tunis, Tunisia, 2010. [Google Scholar]
- Rizzi, J. Gis-Based Regional Risk Assessment and Its Implementation in A Decision Support Systems for Studying Coastal Climate Change Impacts; Università Ca’ Foscari Venezia: Venice, Italy, 2014. [Google Scholar]
- Torresan, S.; Rizzi, J.; Zabeo, A.; Critto, A.; Gallina, V.; Furlan, E.; Marcomini, A. Assessing environmental impacts of climate change at the regional scale to provide adaptation services: The DEcision support SYstem for COastal climate change impact assessment (DESYCO). In Proceedings of the First Annual Conference SISC on Climate Change and Its Implications on Ecosystem and Society, Venice, Italy, 23–24 September 2013; pp. 468–476. [Google Scholar]
- Rizzi, J.; Torresan, S.; Zabeo, A.; Critto, A.; Tosoni, A.; Tomasin, A.; Marcomini, A. Assessing storm surge risk under future sea-level rise scenarios: A case study in the North Adriatic coast. J. Coast. Conserv. 2017, 21, 453–471. [Google Scholar] [CrossRef]
- Umgiesser, G.; Canu, D.M.; Cucco, A.; Solidoro, C. A finite element model for the Venice Lagoon. Development, set up, calibration and validation. J. Mar. Syst. 2004, 51, 123–145. [Google Scholar] [CrossRef]
- Carniel, S.; Warner, J.C.; Chiggiato, J.; Sclavo, M. Investigating the impact of surface wave breaking on modeling the trajectories of drifters in the northern Adriatic Sea during a wind-storm event. Ocean Model. 2009, 30, 225–239. [Google Scholar] [CrossRef]
- Ronco, P.; Bullo, M.; Torresan, S.; Critto, A.; Olschewski, R.; Zappa, M.; Marcomini, A. KULTURisk regional risk assessment methodology for water-related natural hazards-Part 2: Application to the Zurich case study. Hydrol. Earth Syst. Sci. 2015, 19, 1561–1576. [Google Scholar] [CrossRef] [Green Version]
- Pasini, S.; Torresan, S.; Rizzi, J.; Zabeo, A.; Critto, A.; Marcomini, A. Climate change impact assessment in Veneto and Friuli Plain groundwater. Part II: A spatially resolved regional risk assessment. Sci. Total Environ. 2012, 440, 219–235. [Google Scholar] [CrossRef] [PubMed]
- Carminati, E.; Martinelli, G. Subsidence rates in the Po Plain, northern Italy: The relative impact of natural and anthropogenic causation. Eng. Geol. 2002, 66, 241–255. [Google Scholar] [CrossRef]
- Carbognin, L.; Teatini, P.; Tomasin, A.; Tosi, L. Global change and relative sea level rise at Venice: What impact in term of flooding. Clim. Dyn. 2010, 35, 1039–1047. [Google Scholar] [CrossRef]
- IPCC. Climate Change 2007: Impacts, Adaptation and Vulnerability: Contribution of Working Group II to the Fourth Assessment Report of the Intergovernmental Panel on Climate Change; Parry, M.L., Canziani, O.F., Palutikof, J.P., van der Linden, P.J., Hanson, C.E., Eds.; Cambridge University Press: Cambridge, UK, 2007; ISBN 0521880106. [Google Scholar]
- IPCC. Long-Term Climate Change: Projections, Commitments and Irreversibility. Clim. Chang. 2013 Phys. Sci. Basis. Contrib. Work. Gr. I to Fifth Assess. Rep. Intergov. Panel Clim. Chang; Collins, M., Knutti, R., Arblaster, J., Dufresne, J.-L., Fichefet, T., Friedlingstein, P., Gao, X., Gutowski, W.J., Johns, T., Krinner, G., et al., Eds.; Cambridge University Press: Cambridge, UK; New York, NY, USA, 2013; pp. 1029–1136. [Google Scholar]
- Cattiaux, J.; Douville, H.; Peings, Y. European temperatures in CMIP5: Origins of present-day biases and future uncertainties. Clim. Dyn. 2013, 41, 2889–2907. [Google Scholar] [CrossRef]
- Knutti, R.; Sedláček, J. Robustness and uncertainties in the new CMIP5 climate model projections. Nat. Clim. Chang. 2013, 3, 369. [Google Scholar] [CrossRef]
- Pantusa, D.; D’Alessandro, F.; Riefolo, L.; Principato, F.; Tomasicchio, G.R. Application of a coastal vulnerability index. A case study along the Apulian Coastline, Italy. Water 2018, 10, 1218. [Google Scholar] [CrossRef] [Green Version]
- McLaughlin, S.; Andrew, J.; Cooper, G. A multi-scale coastal vulnerability index: A tool for coastal managers? Environ. Hazards 2010, 9, 233–248. [Google Scholar] [CrossRef]
- Hereher, M.E. Coastal vulnerability assessment for Egypt’s Mediterranean coast. Geomat. Nat. Hazards Risk 2015, 6, 342–355. [Google Scholar] [CrossRef] [Green Version]
- UNISDR. Technical Guidance for Monitoring and Reporting on Progress in Achieving the Global Targets of the Sendai Framework for Disaster Risk Reduction; United Nations: Geneva, Switzerland, 2018; pp. 1–180. [Google Scholar]
- Crozier, M.J.; Glade, T. Landslide hazard and risk: Issues, concepts and approach. Landslide Hazard Risk 2005, 8, 1–40. [Google Scholar]
- Santoro, F.; Tonino, M.; Torresan, S.; Critto, A.; Marcomini, A. Involve to improve: A participatory approach for a Decision Support System for coastal climate change impacts assessment. The North Adriatic case. Ocean Coast. Manag. 2013, 78, 101–111. [Google Scholar] [CrossRef]
- Torresan, S.; Critto, A.; Rizzi, J.; Zabeo, A.; Furlan, E.; Marcomini, A. DESYCO: A decision support system for the regional risk assessment of climate change impacts in coastal zones. Ocean Coast. Manag. 2016, 120, 49–63. [Google Scholar] [CrossRef]
- Gallina, V. An Advanced Methodology for the Multi-Risk Assessment: An Application for Climate Change Impacts in the North Adriatic Case Study (Italy); Università Ca’ Foscari Venezia: Venice, Italy, 2015. [Google Scholar]
- Tebaldi, C.; Knutti, R. The use of the multi-model ensemble in probabilistic climate projections. Philos. Trans. R. Soc. Lond. A Math. Phys. Eng. Sci. 2007, 365, 2053–2075. [Google Scholar] [CrossRef] [PubMed]
- Woodroffe, C.D.; Murray-Wallace, C. V Sea-level rise and coastal change: The past as a guide to the future. Quat. Sci. Rev. 2012, 54, 4–11. [Google Scholar] [CrossRef]
- Tebaldi, C.; Strauss, B.H.; Zervas, C.E. Modelling sea level rise impacts on storm surges along US coasts. Environ. Res. Lett. 2012, 7, 14032. [Google Scholar] [CrossRef]
- EC. Directive 2007/60/EC of the European Parliament and of the Council of 23 October 2007 on the Assessment and Management of Flood Risks; EU: Bruxelles, Belgium, 2007. [Google Scholar]
- Ronco, P.; Gallina, V.; Torresan, S.; Zabeo, A.; Semenzin, E.; Critto, A.; Marcomini, A. The KULTURisk Regional Risk Assessment methodology for water-related natural hazards - Part 1: Physical-environmental assessment. Hydrol. Earth Syst. Sci. 2014, 18, 5399–5414. [Google Scholar] [CrossRef] [Green Version]
- Giannini, V.; Bellucci, A.; Torresan, S. Sharing skills and needs between providers and users of climate information to create climate services: Lessons from the Northern Adriatic case study. Earth Perspect. 2016, 3, 1–12. [Google Scholar] [CrossRef] [Green Version]
- Wade, T.; Sommer, S. A to Z GIS, An Illustrated Dictionary of Geographic Information Systems; Esri Press: Redlands, CA, USA, 2006; ISBN 1589481402. [Google Scholar]
- Da Lio, C.; Teatini, P.; Strozzi, T.; Tosi, L. Understanding land subsidence in salt marshes of the Venice Lagoon from SAR Interferometry and ground-based investigations. Remote Sens. Environ. 2018, 205, 56–70. [Google Scholar] [CrossRef]
- Tosi, L.; Da Lio, C.; Teatini, P.; Strozzi, T. Land subsidence in coastal environments: Knowledge advance in the Venice coastland by TerraSAR-X PSI. Remote Sens. 2018, 10, 1191. [Google Scholar] [CrossRef] [Green Version]
- Teatini, P.; Tosi, L.; Strozzi, T. Quantitative evidence that compaction of Holocene sediments drives the present land subsidence of the Po Delta, Italy. J. Geophys. Res. Solid Earth 2011, 116, 1–10. [Google Scholar] [CrossRef]
- Da Lio, C.; Tosi, L. Vulnerability to relative sea-level rise in the Po river delta (Italy). Estuar. Coast. Shelf Sci. 2019, 228, 106379. [Google Scholar] [CrossRef]
- Da Lio, C.; Tosi, L. Land subsidence in the Friuli Venezia Giulia coastal plain, Italy: 1992–2010 results from SAR-based interferometry. Sci. Total Environ. 2018, 633, 752–764. [Google Scholar] [CrossRef] [PubMed]
- European Commission. Towards an EU Research and Innovation Policy Agenda for Nature-Based Solutions & Re-Naturing Cities. Final Report of the Horizon 2020 Expert Group on “Nature-Based Solutions and Re-Naturing Cities” (Full Version); European Commission: Bruxelles, Belgium, 2015; ISBN 978-92-79-46051-7. [Google Scholar]
- Lung, T.; Lavalle, C.; Hiederer, R.; Dosio, A.; Bouwer, L.M. A multi-hazard regional level impact assessment for Europe combining indicators of climatic and non-climatic change. Glob. Environ. Chang. 2013, 23, 522–536. [Google Scholar] [CrossRef]
- Makinen, K.; Prutsch, A.; Karali, E.; Leitner, M.; Voller, S.; Lyytimaki, J.; Pringle, P.; Vanneuville, W. Indicators for Adaptation to Climate Change at National Level—Lessons from Emerging Practice in Europe; Technical paper 2018/3; European Topic Centre on Climate Change impacts, Vulnerability and Adaptation (ETC/CCA): Copenhagen, Denmark, 2018; pp. 1–68. [Google Scholar]
- Mysiak, J.; Torresan, S.; Bosello, F.; Mistry, M.; Amadio, M.; Marzi, S.; Furlan, E.; Sperotto, A. Climate risk index for Italy. Philos. Trans. R. Soc. A Math. Phys. Eng. Sci. 2018, 376, 20170305. [Google Scholar] [CrossRef]
- Bai, J.; Cui, B.; Chen, B.; Zhang, K.; Deng, W.; Gao, H.; Xiao, R. Spatial distribution and ecological risk assessment of heavy metals in surface sediments from a typical plateau lake wetland, China. Ecol. Modell. 2011, 222, 301–306. [Google Scholar] [CrossRef]
- Bateman, I.; Agarwala, M.; Binner, A.; Coombes, E.; Day, B.; Ferrini, S.; Fezzi, C.; Hutchins, M.; Lovett, A.; Posen, P. Spatially explicit integrated modeling and economic valuation of climate driven land use change and its indirect effects. J. Environ. Manag. 2016, 181, 172–184. [Google Scholar] [CrossRef]
- Chen, S.; Chen, B.; Fath, B.D. Assessing the cumulative environmental impact of hydropower construction on river systems based on energy network model. Renew. Sustain. Energy Rev. 2015, 42, 78–92. [Google Scholar] [CrossRef]
- Hobbs, T.J.; Neumann, C.R.; Meyer, W.S.; Moon, T.; Bryan, B.A. Models of reforestation productivity and carbon sequestration for land use and climate change adaptation planning in South Australia. J. Environ. Manag. 2016, 181, 279–288. [Google Scholar] [CrossRef]
- Tervonen, T.; Sepehr, A.; Kadziński, M. A multi-criteria inference approach for anti-desertification management. J. Environ. Manag. 2015, 162, 9–19. [Google Scholar] [CrossRef]
- Marignani, M.; Bruschi, D.; Garcia, D.A.; Frondoni, R.; Carli, E.; Pinna, M.S.; Cumo, F.; Gugliermetti, F.; Saatkamp, A.; Doxa, A. Identification and prioritization of areas with high environmental risk in Mediterranean coastal areas: A flexible approach. Sci. Total Environ. 2017, 590, 566–578. [Google Scholar] [CrossRef]
- Satta, A.; Snoussi, M.; Puddu, M.; Flayou, L.; Hout, R. An index-based method to assess risks of climate-related hazards in coastal zones: The case of Tetouan. Estuar. Coast. Shelf Sci. 2016, 175, 93–105. [Google Scholar] [CrossRef]
- Wolff, C.; Vafeidis, A.T.; Lincke, D.; Marasmi, C.; Wolff, C. Effects of Scale and Input Data on Assessing the Future Impacts of Coastal Flooding: An Application of DIVA for the Emilia-Romagna Coast. Front. Marine Sci. 2016, 3, 1–15. [Google Scholar] [CrossRef] [Green Version]
- Sperotto, A.; Molina, J.L.; Torresan, S.; Critto, A.; Pulido-Velazquez, M.; Marcomini, A. A Bayesian Networks approach for the assessment of climate change impacts on nutrients loading. Environ. Sci. Policy 2019, 100, 21–36. [Google Scholar] [CrossRef]
- Furlan, E.; Slanzi, D.; Torresan, S.; Critto, A.; Marcomini, A. Multi-scenario analysis in the Adriatic Sea: A GIS-based Bayesian network to support maritime spatial planning. Sci. Total Environ. 2020, 703, 134972. [Google Scholar] [CrossRef] [PubMed]
- International Risk Governance Center (IRGC). The Governance of Decision-Making Algorithms; Ecole Polytechnique Fédérale de Lausanne (EPFL): Lausanne, Switzerland, 2018; Volume 1, pp. 1–32. [Google Scholar]
- International Risk Governance Center (IRGC). Guidelines for the Governance of Systemic Risks; Ecole Polytechnique Fédérale de Lausanne (EPFL): Lausanne, Switzerland, 2018; Volume 1, pp. 1–182. [Google Scholar]
- Kulp, S.A.; Strauss, B.H. Vulnerability to sea-level rise and coastal flooding. Nat. Commun. 2019, 10, 1–12. [Google Scholar]
Figure 1.
Case study area of the North Adriatic coast (adapted from Google Maps). The coordinates of the case study are: latitude 44.728931–45.766326, longitude 11.572495–13.913956.
Figure 1.
Case study area of the North Adriatic coast (adapted from Google Maps). The coordinates of the case study are: latitude 44.728931–45.766326, longitude 11.572495–13.913956.

Figure 2.
The framework of the multi-risk methodology for the assessment of different climate change and natural impacts.
Figure 2.
The framework of the multi-risk methodology for the assessment of different climate change and natural impacts.

Figure 3.
Multi-hazard map of the North Adriatic coast (I) with a focus on three specific sub-areas (a–c); surface and percentage of the case study area affected by one, two or three hazards. The last row highlights the surface of the case study not affected by hazards (II).
Figure 3.
Multi-hazard map of the North Adriatic coast (I) with a focus on three specific sub-areas (a–c); surface and percentage of the case study area affected by one, two or three hazards. The last row highlights the surface of the case study not affected by hazards (II).

Figure 4.
Exposure map for the multi-risk assessment in the North Adriatic coast.

Figure 5.
Multi-vulnerability map for the North Adriatic Coast (I) and focus on three specific sub-areas (a–c); and distribution of the percentage of surface associated with each multi-vulnerability class for the analyzed receptors (II).
Figure 5.
Multi-vulnerability map for the North Adriatic Coast (I) and focus on three specific sub-areas (a–c); and distribution of the percentage of surface associated with each multi-vulnerability class for the analyzed receptors (II).

Figure 6.
Multi-risk map of the North Adriatic coast (I) and focus on three specific sub-areas (a–c); and distribution of the percentage of surface associated with each multi-risk class for the analyzed receptors (II).
Figure 6.
Multi-risk map of the North Adriatic coast (I) and focus on three specific sub-areas (a–c); and distribution of the percentage of surface associated with each multi-risk class for the analyzed receptors (II).


Figure 7.
Length of infrastructures (km) and number of citizens affected by multi-risk in the urban areas of coastal municipalities in the North Adriatic area (I); and their percentage distribution (II).
Figure 7.
Length of infrastructures (km) and number of citizens affected by multi-risk in the urban areas of coastal municipalities in the North Adriatic area (I); and their percentage distribution (II).


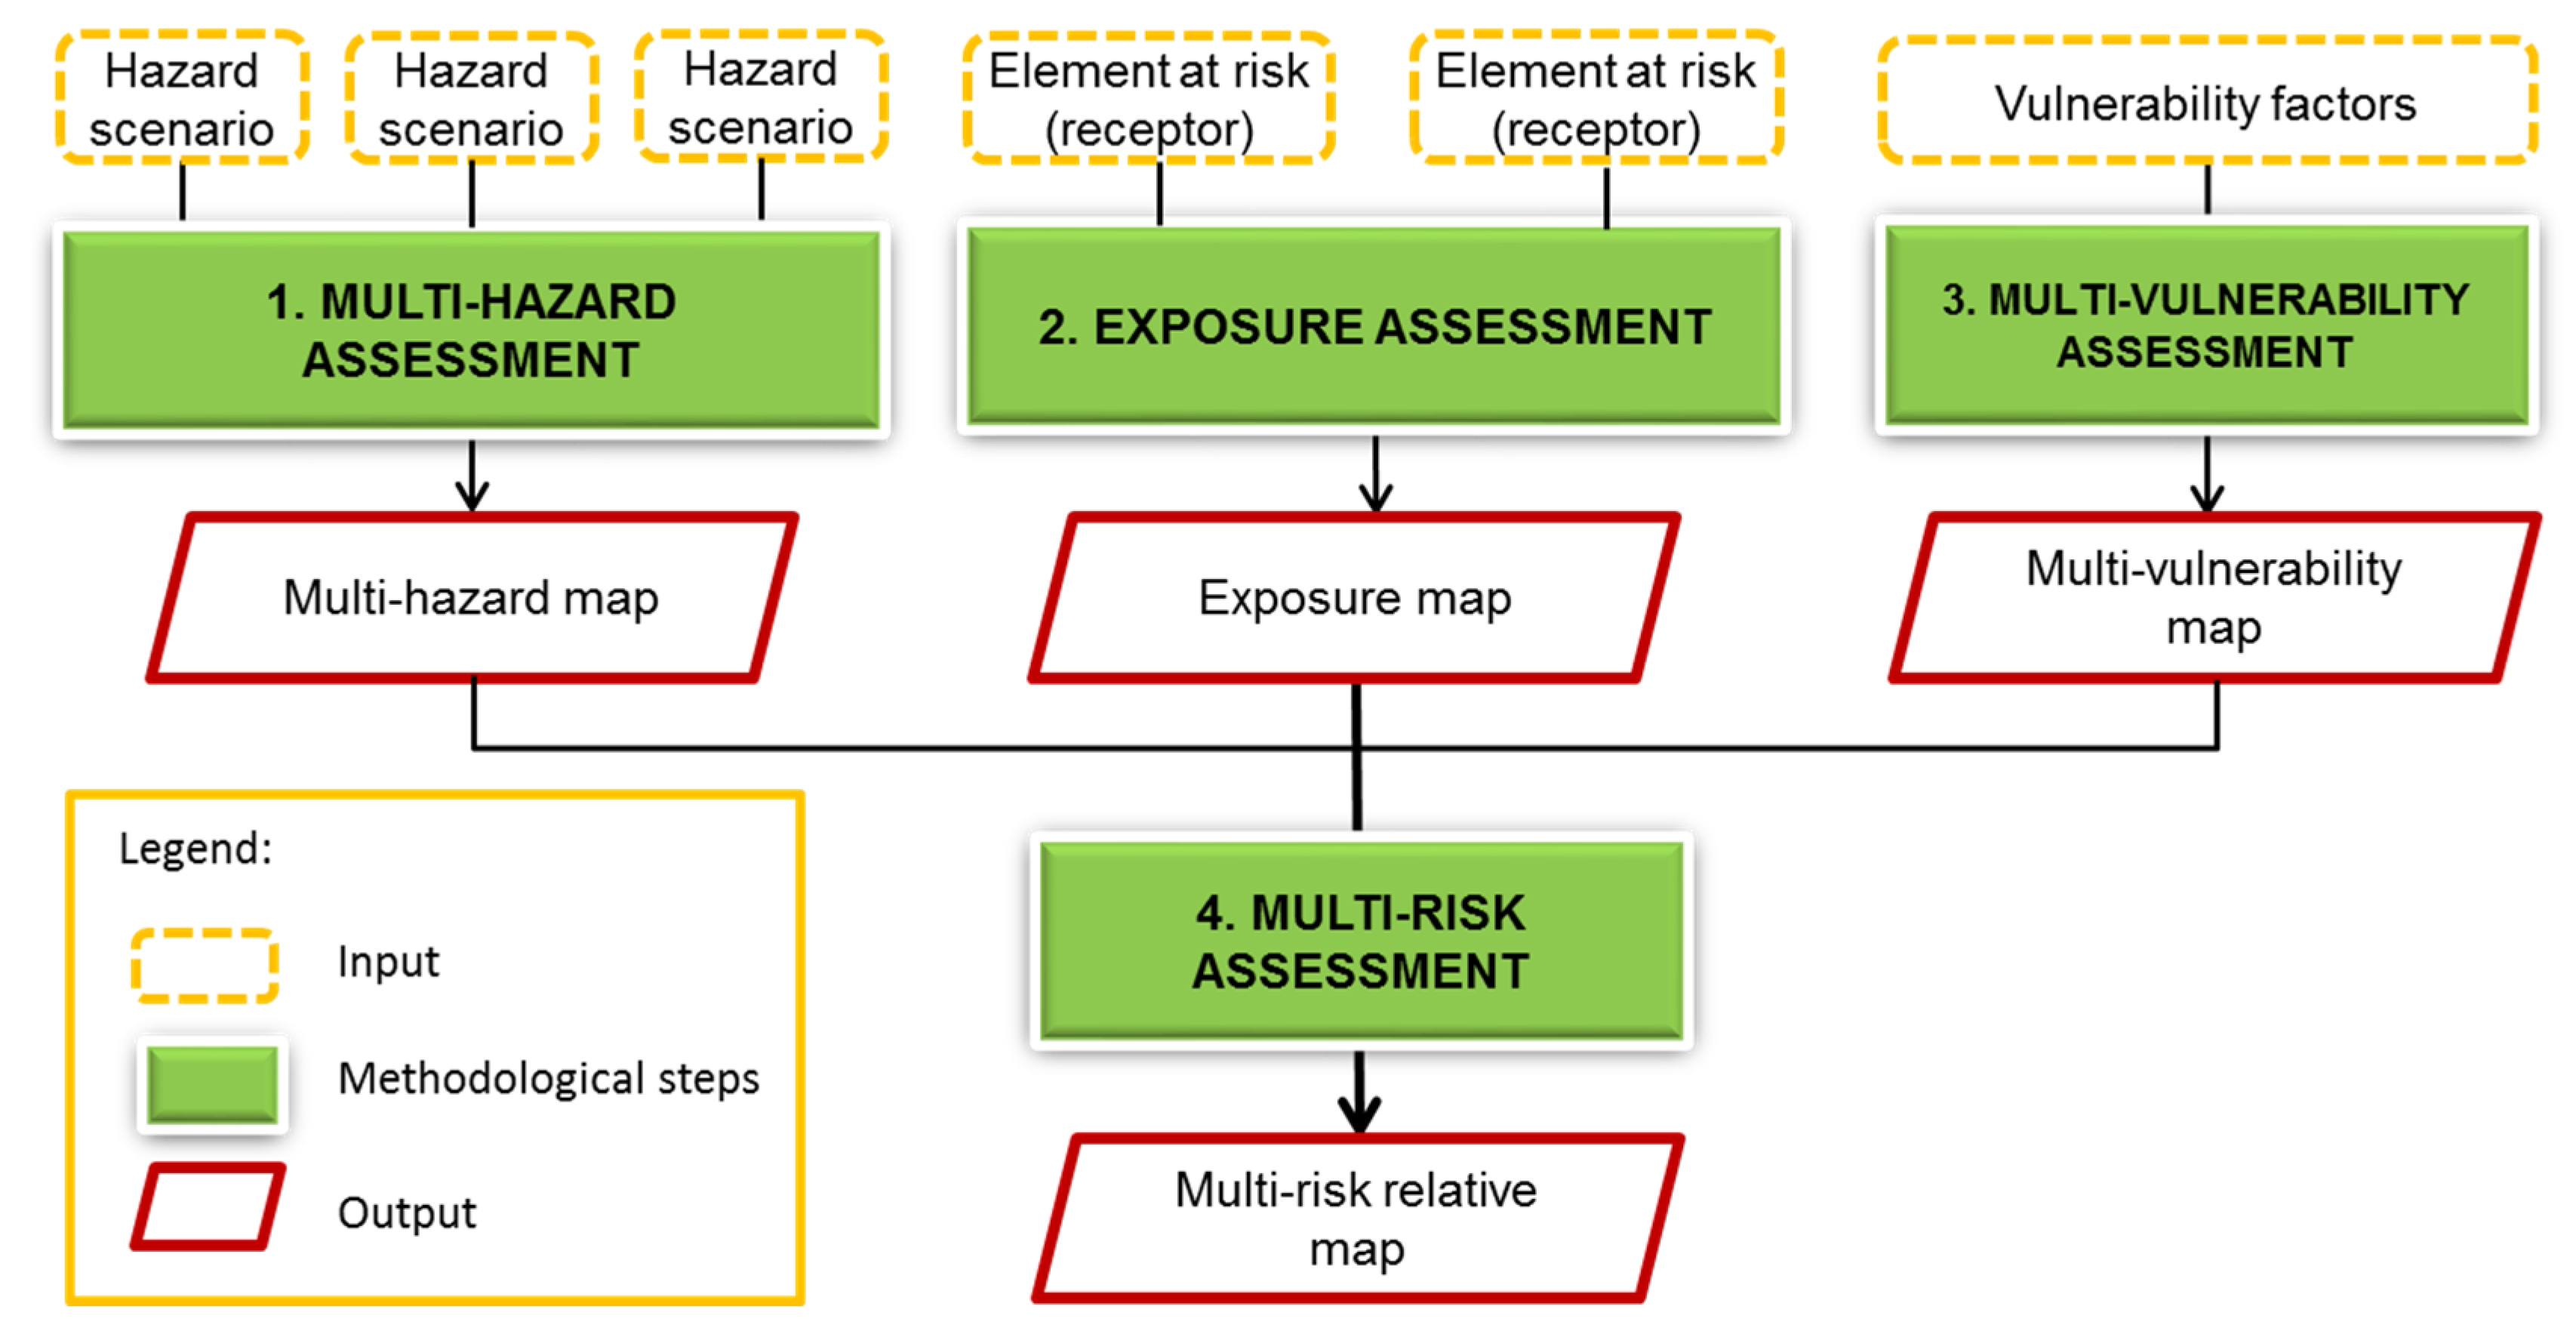
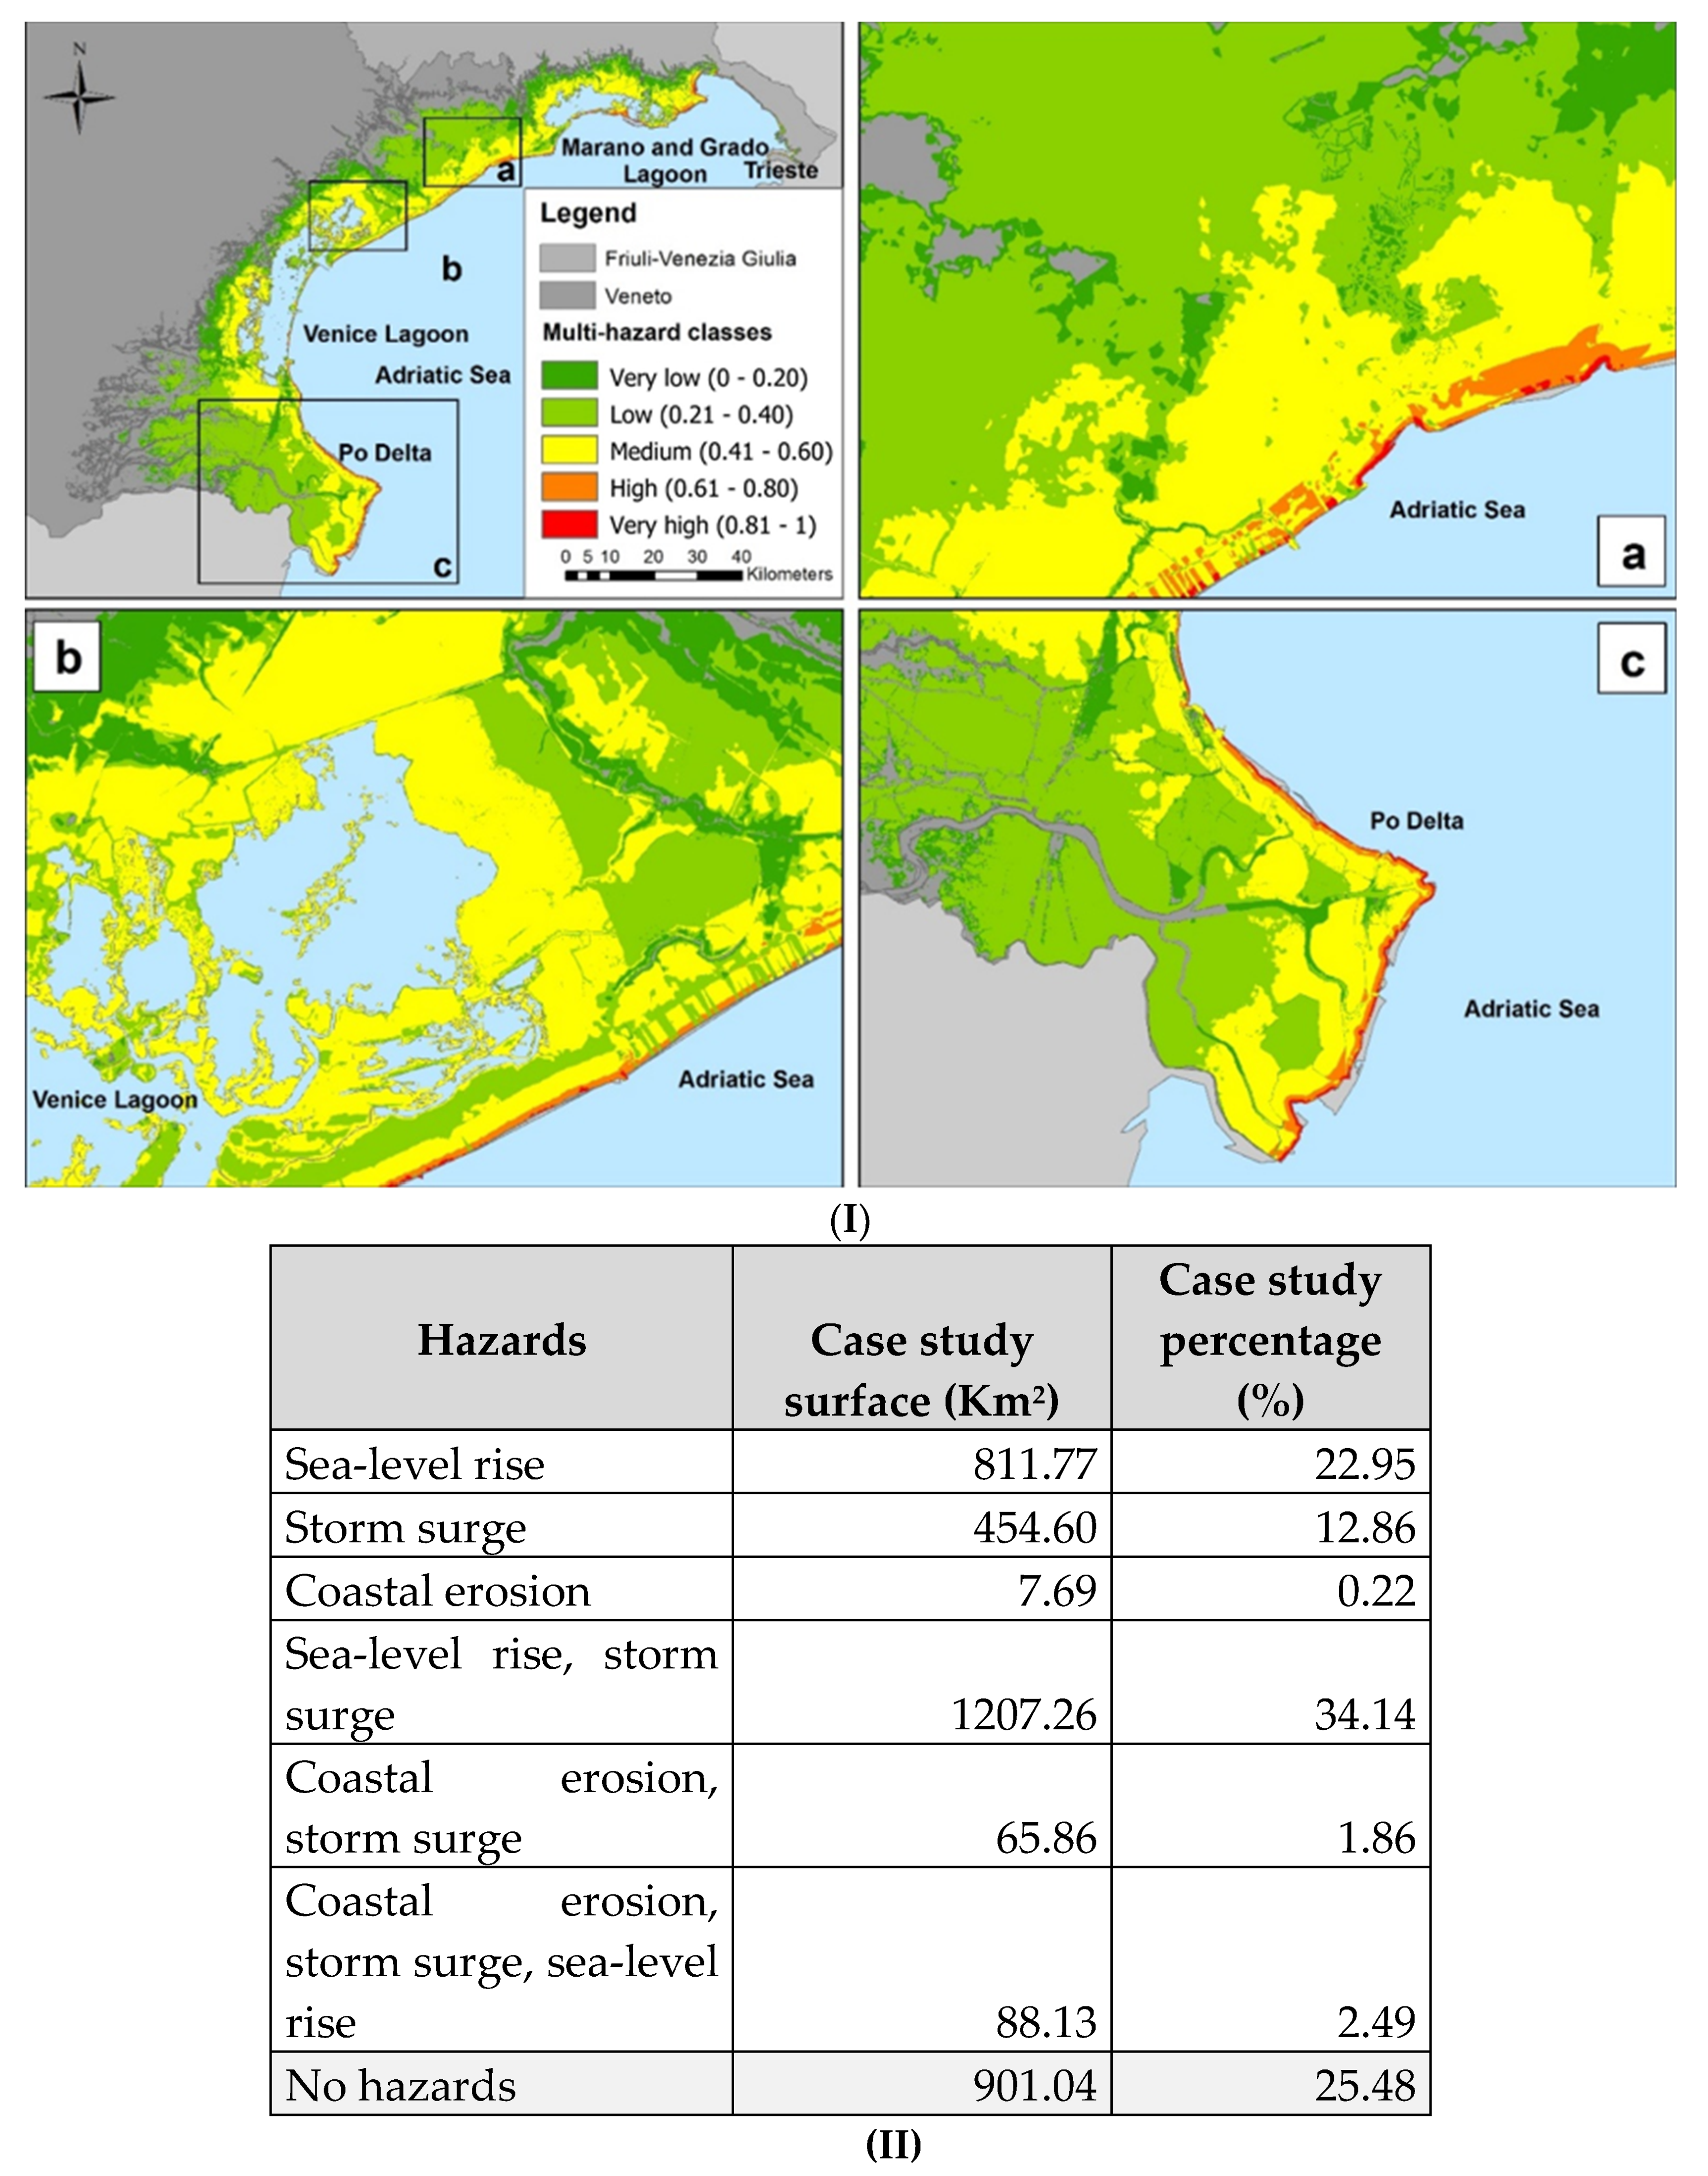
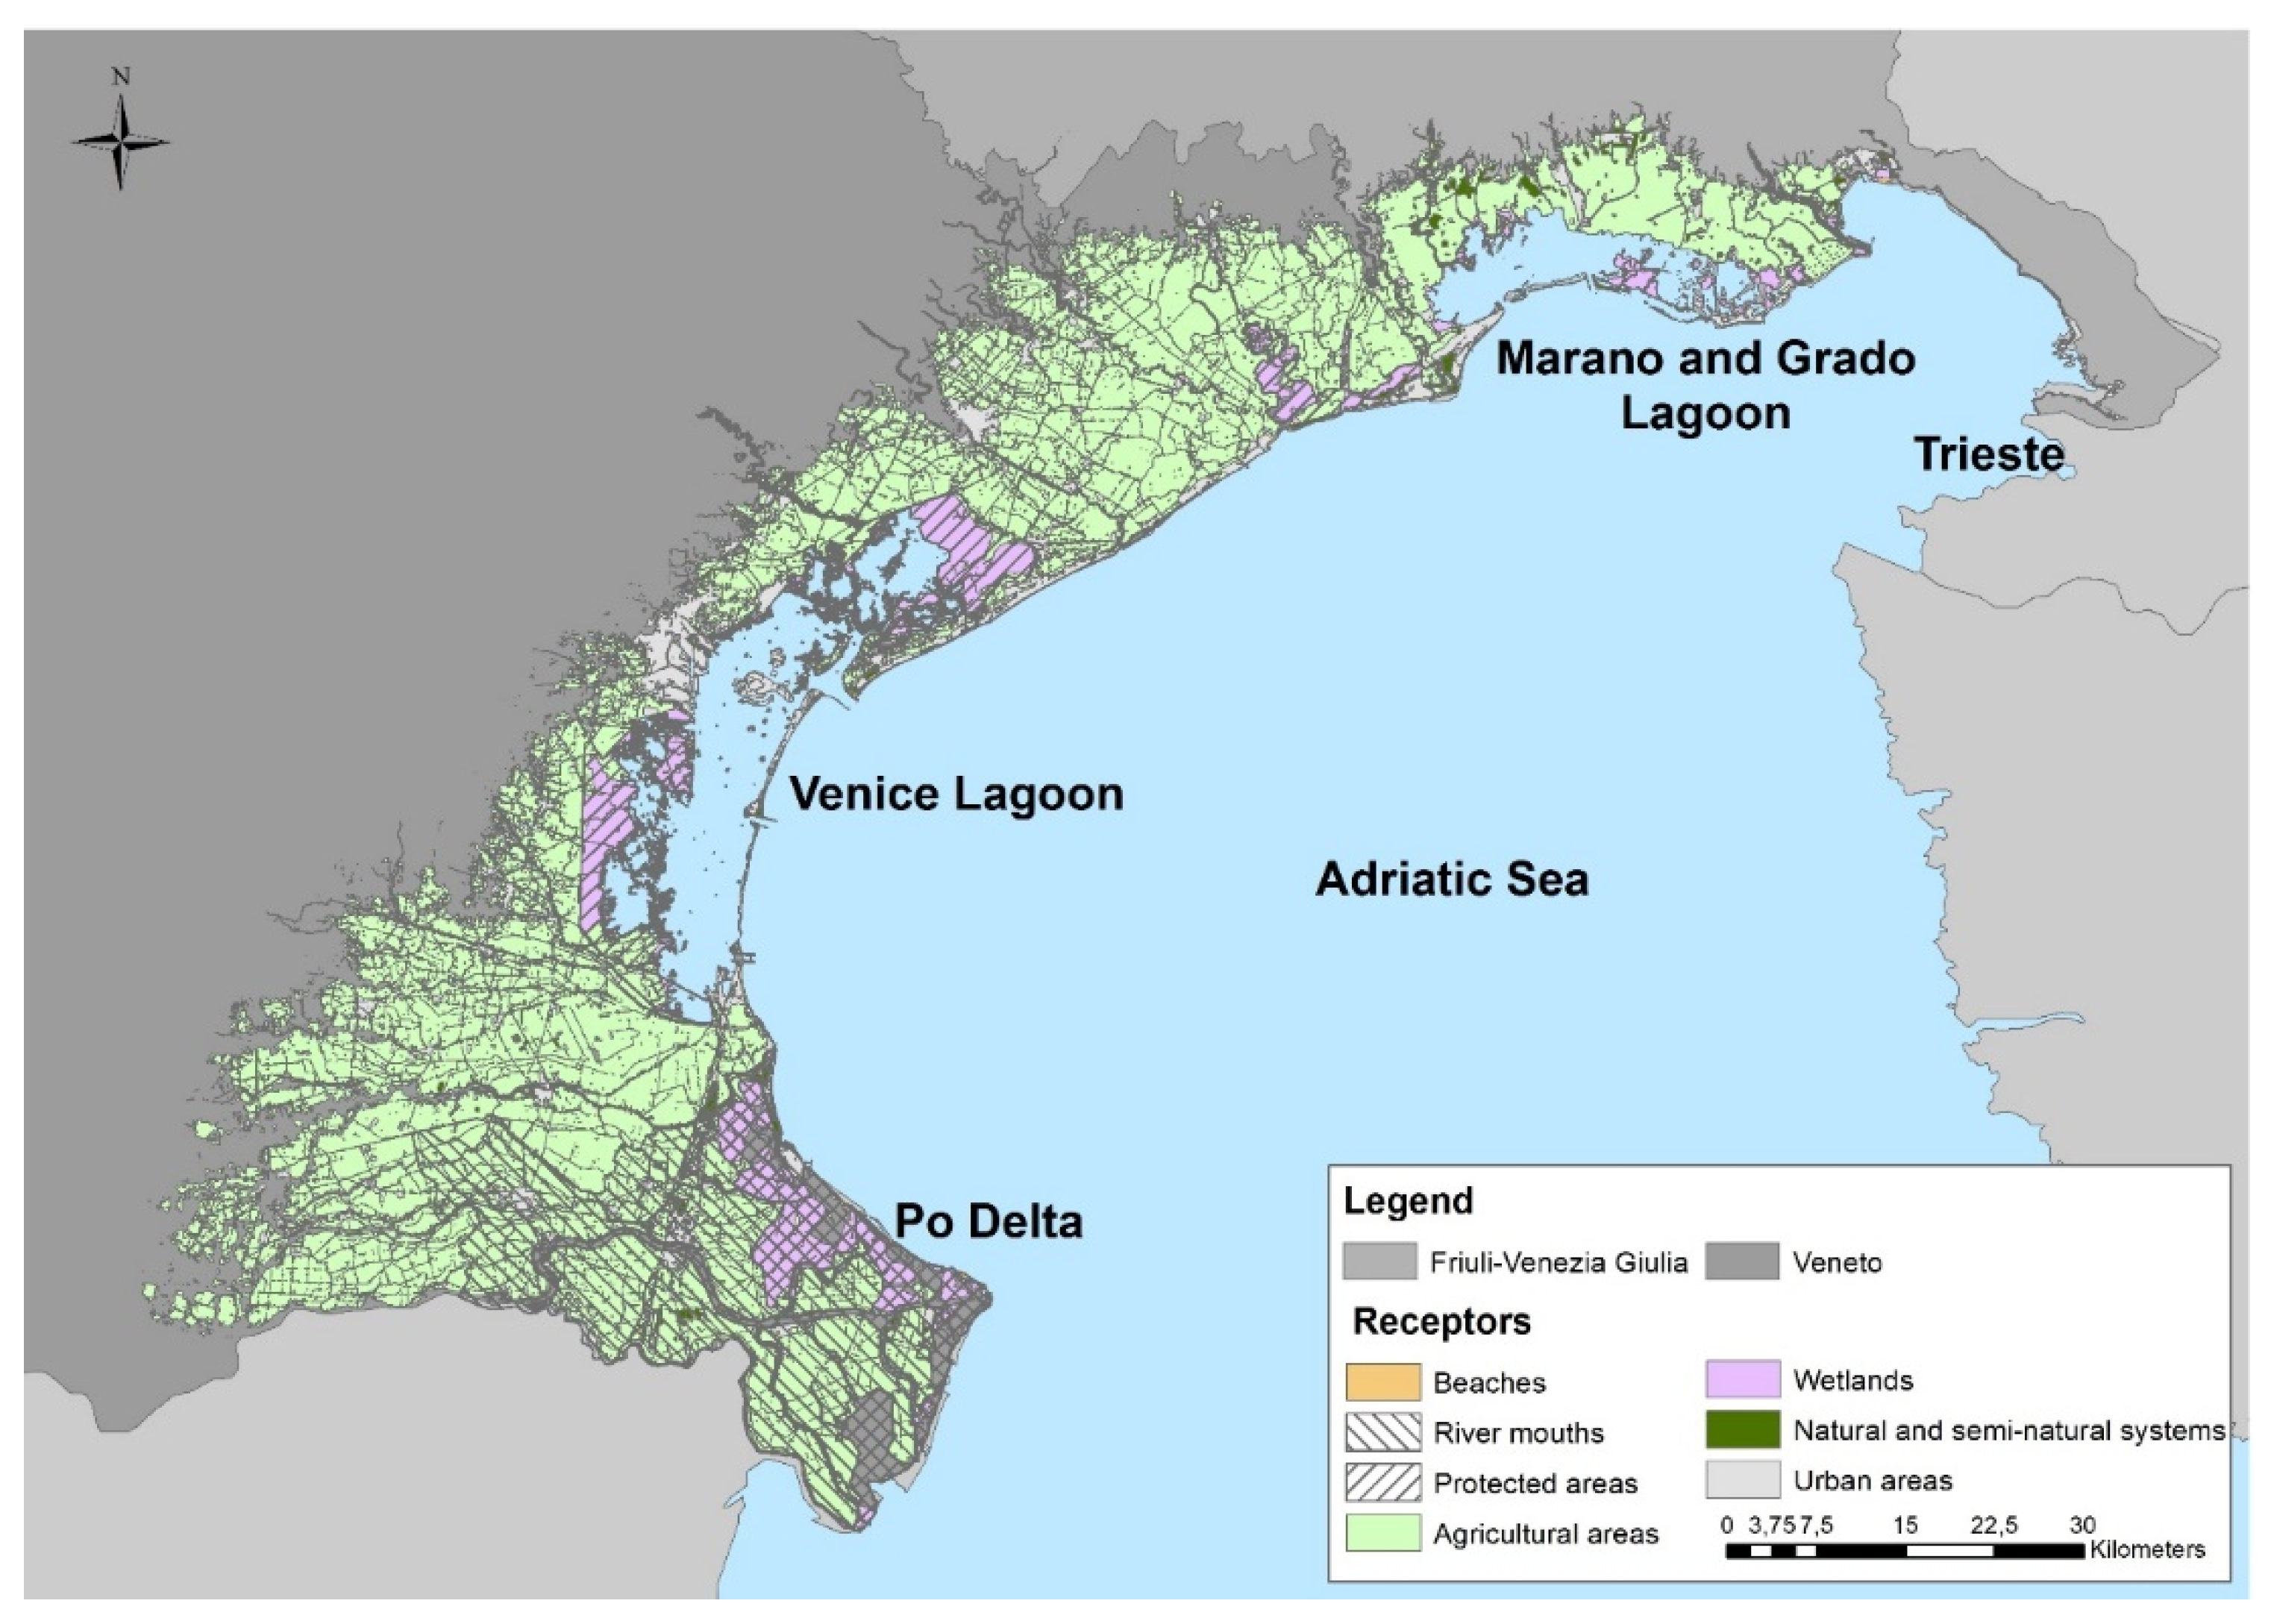
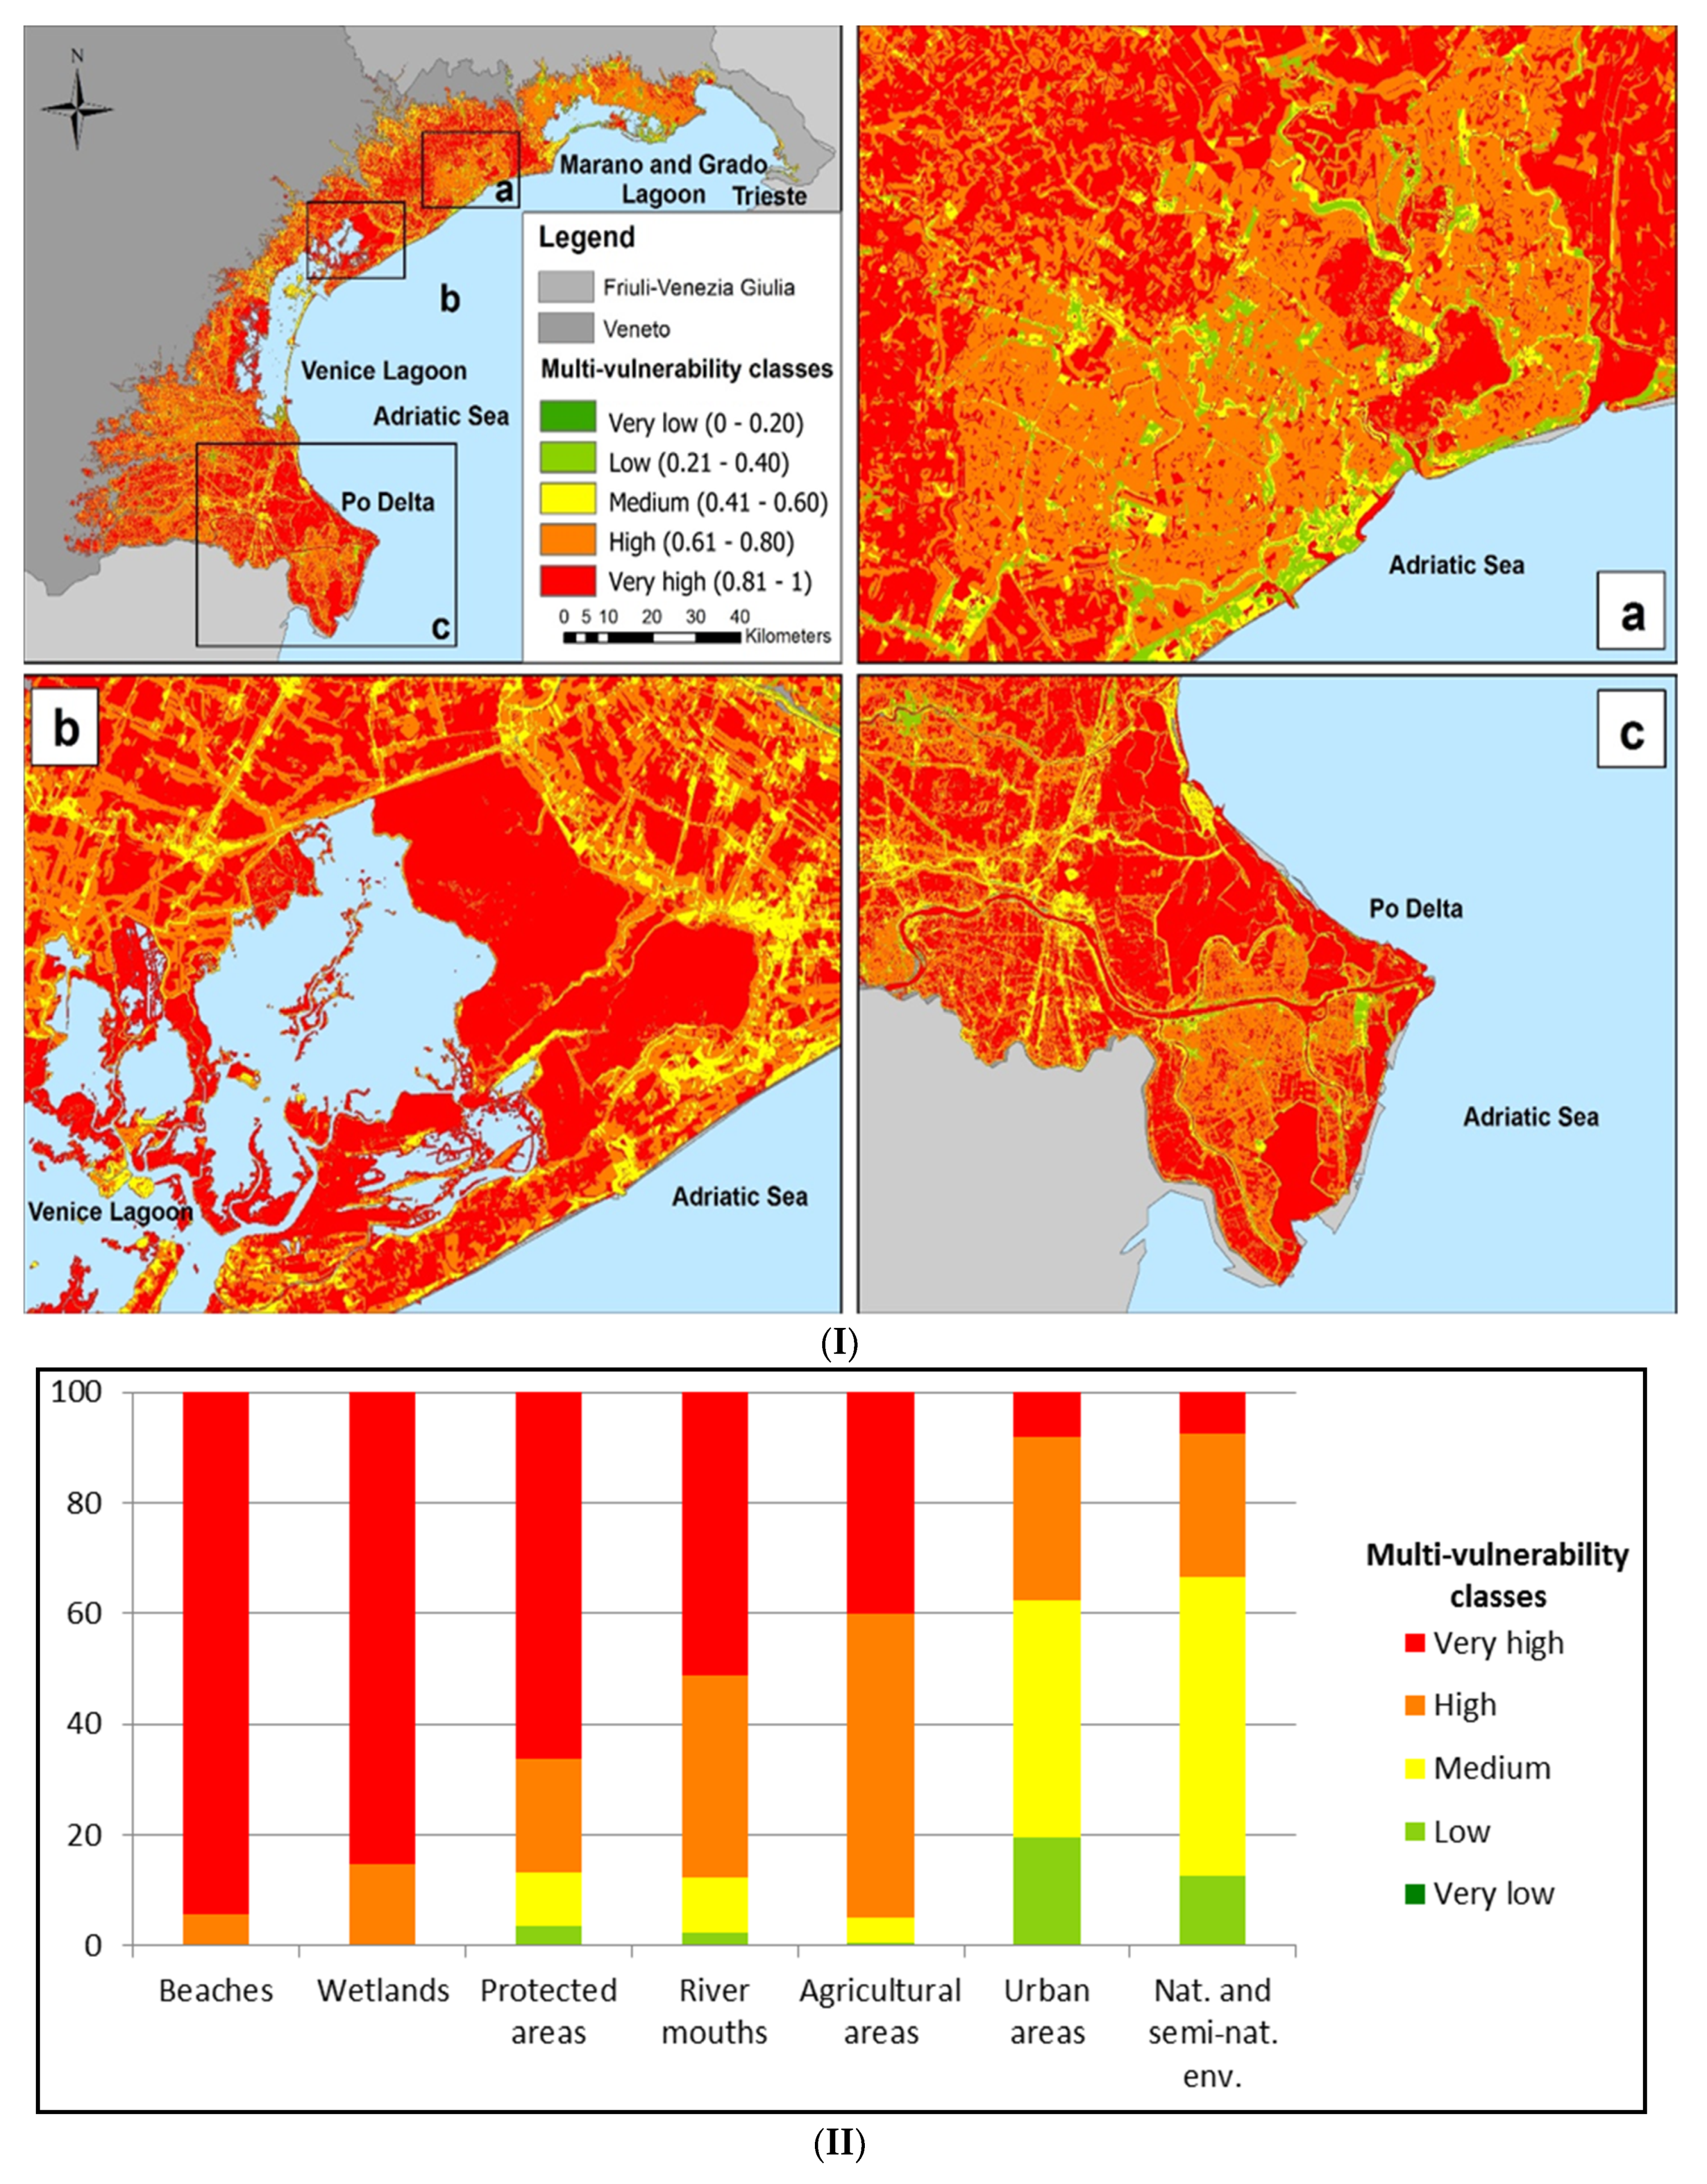
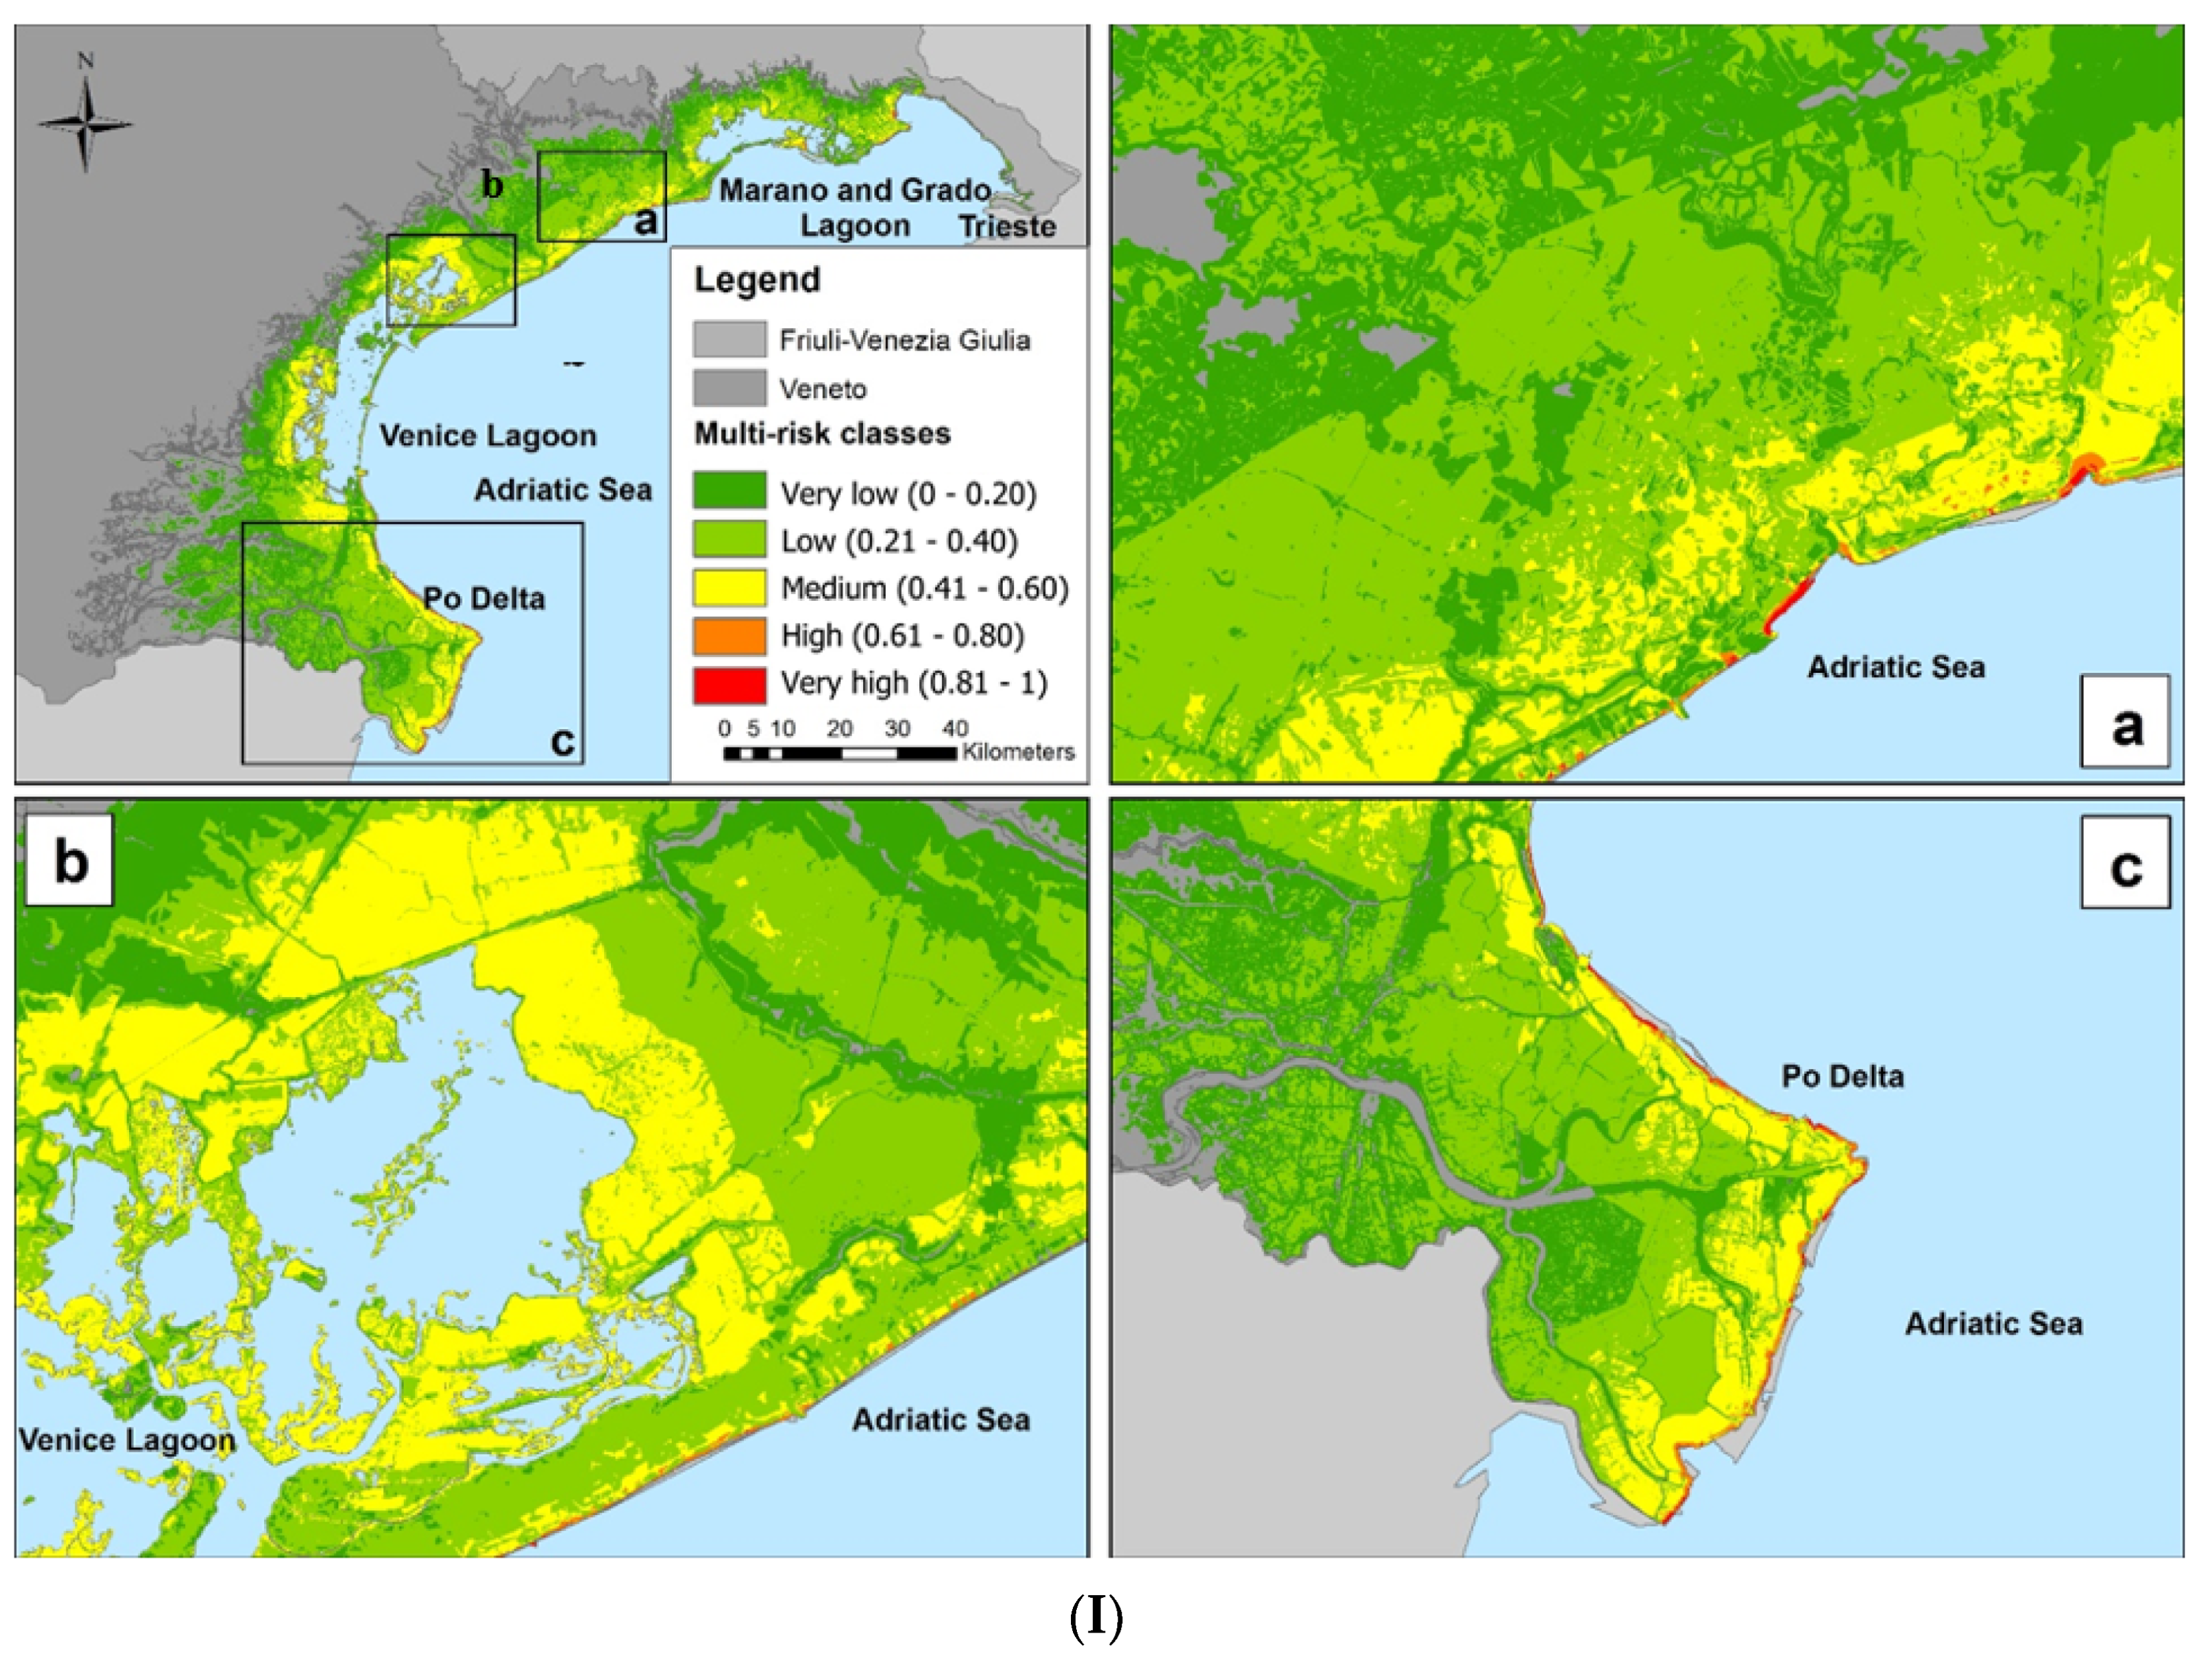
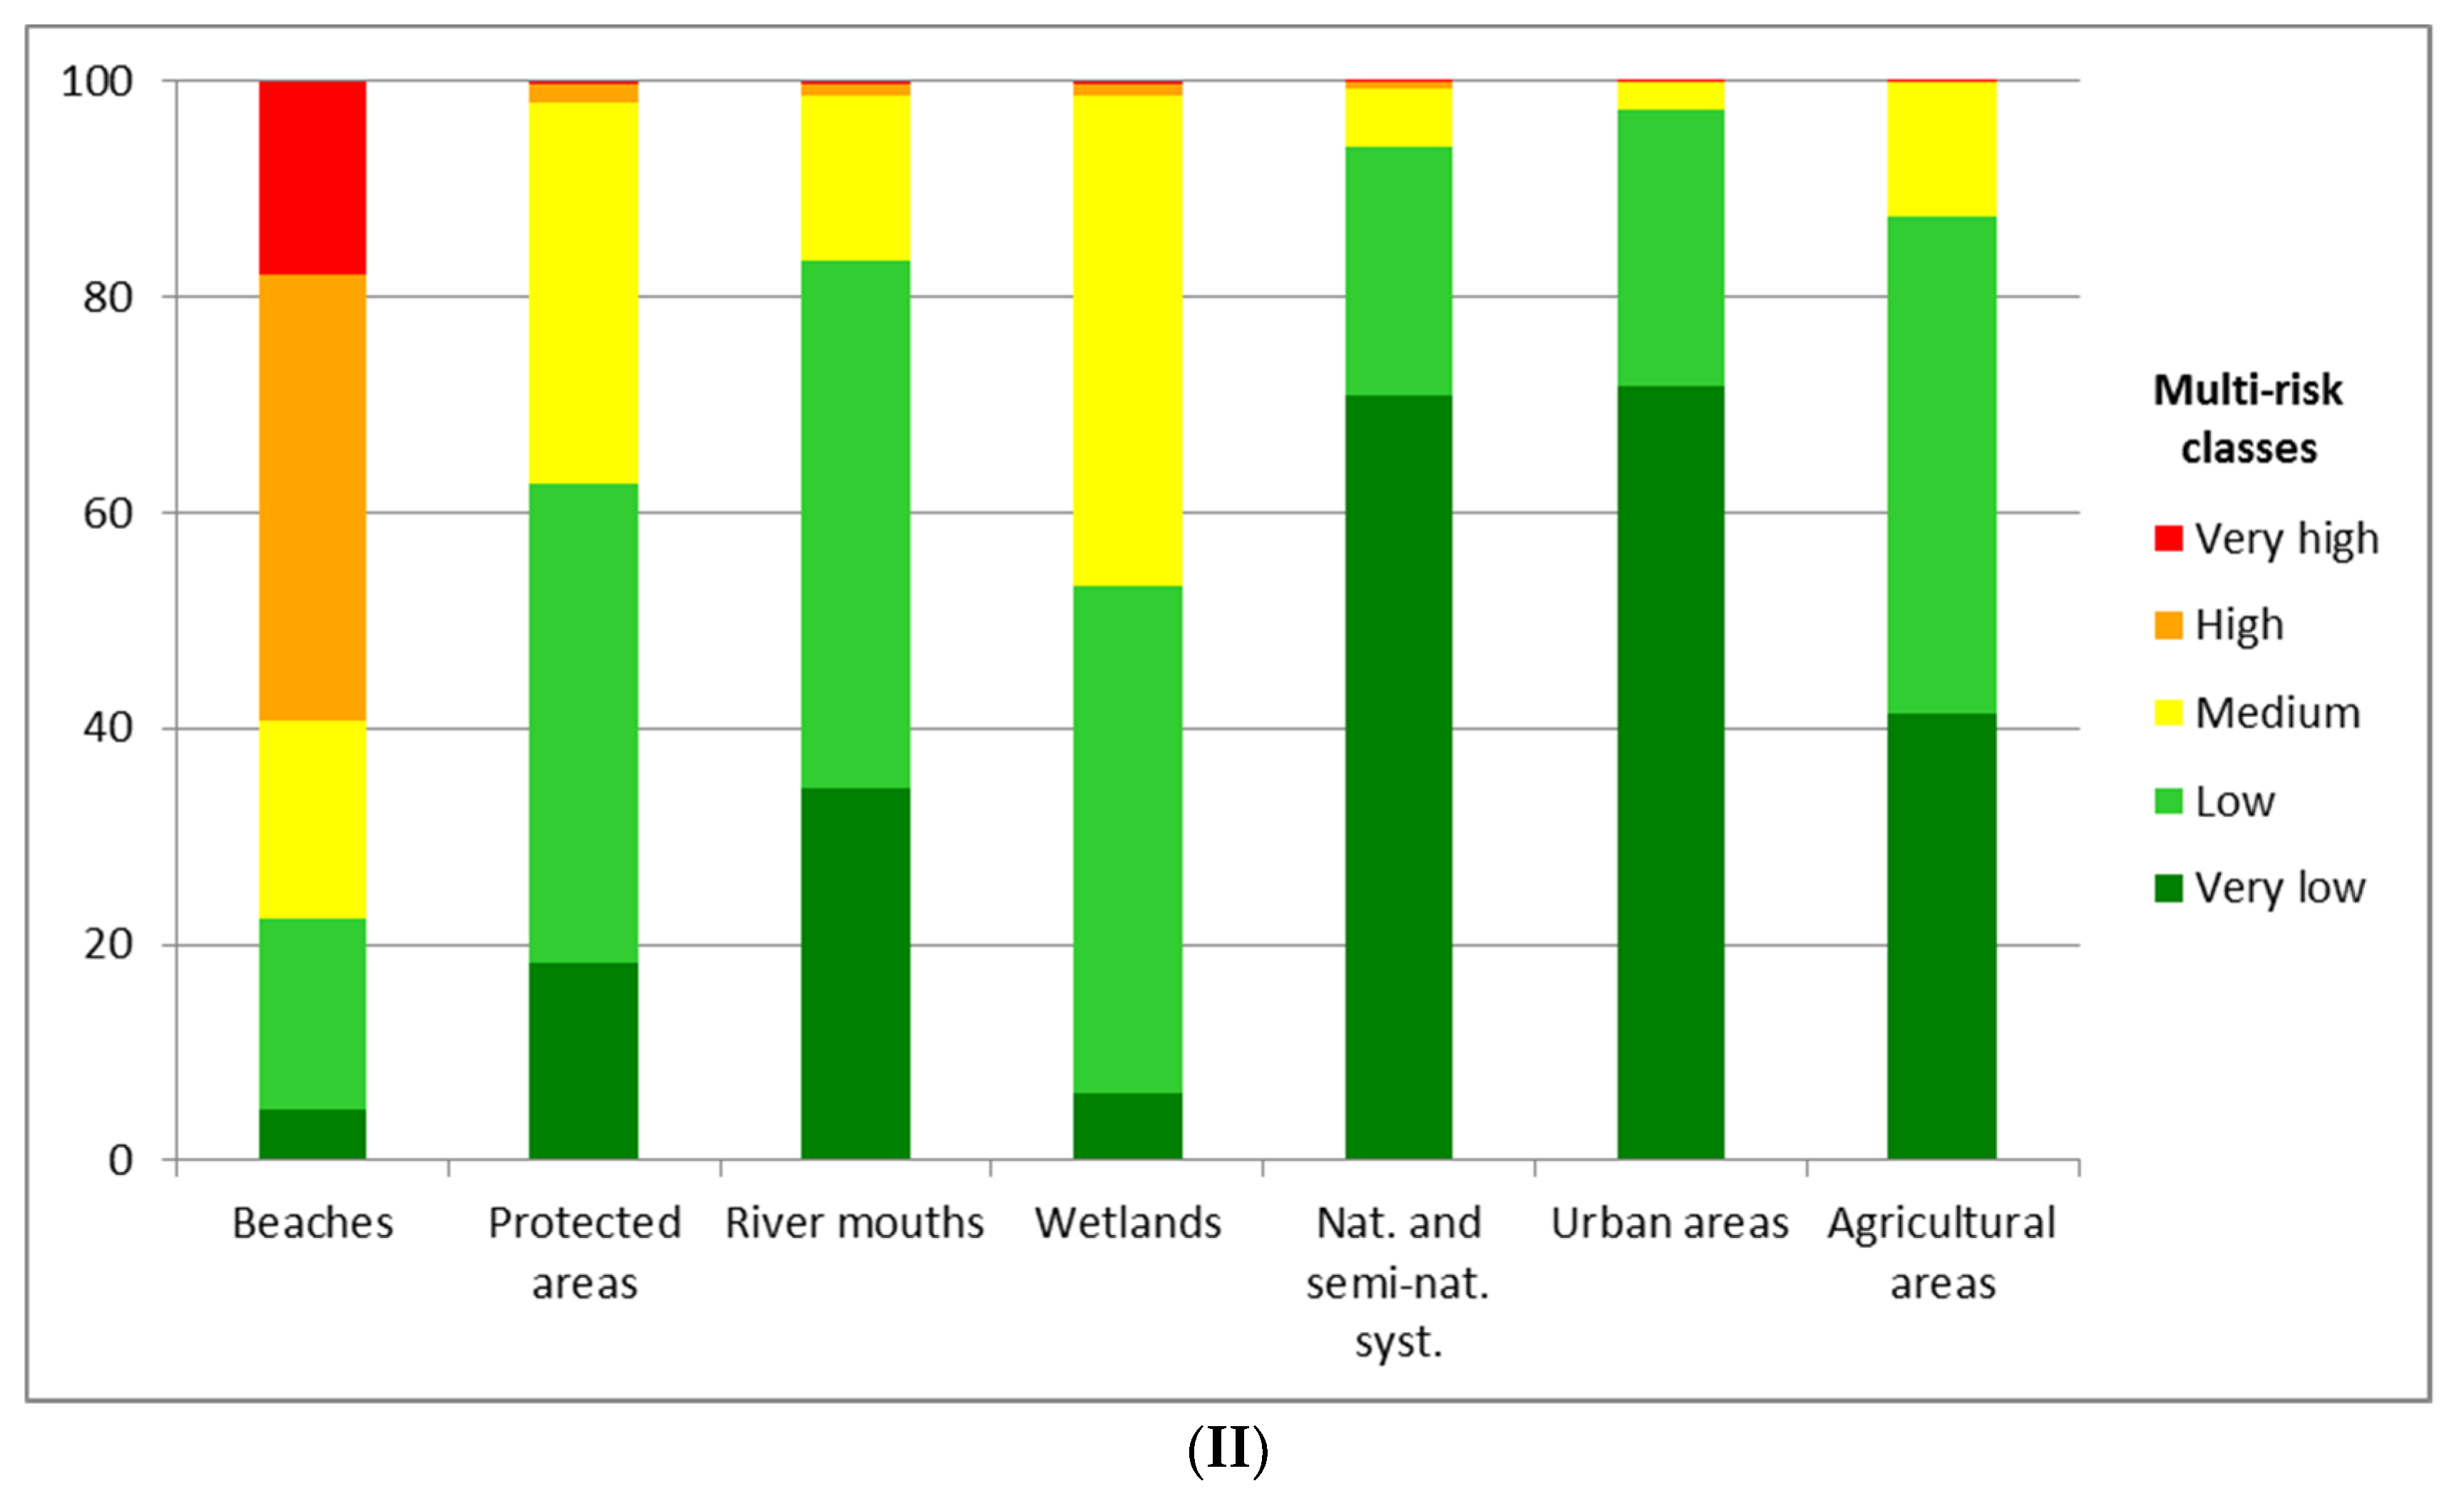
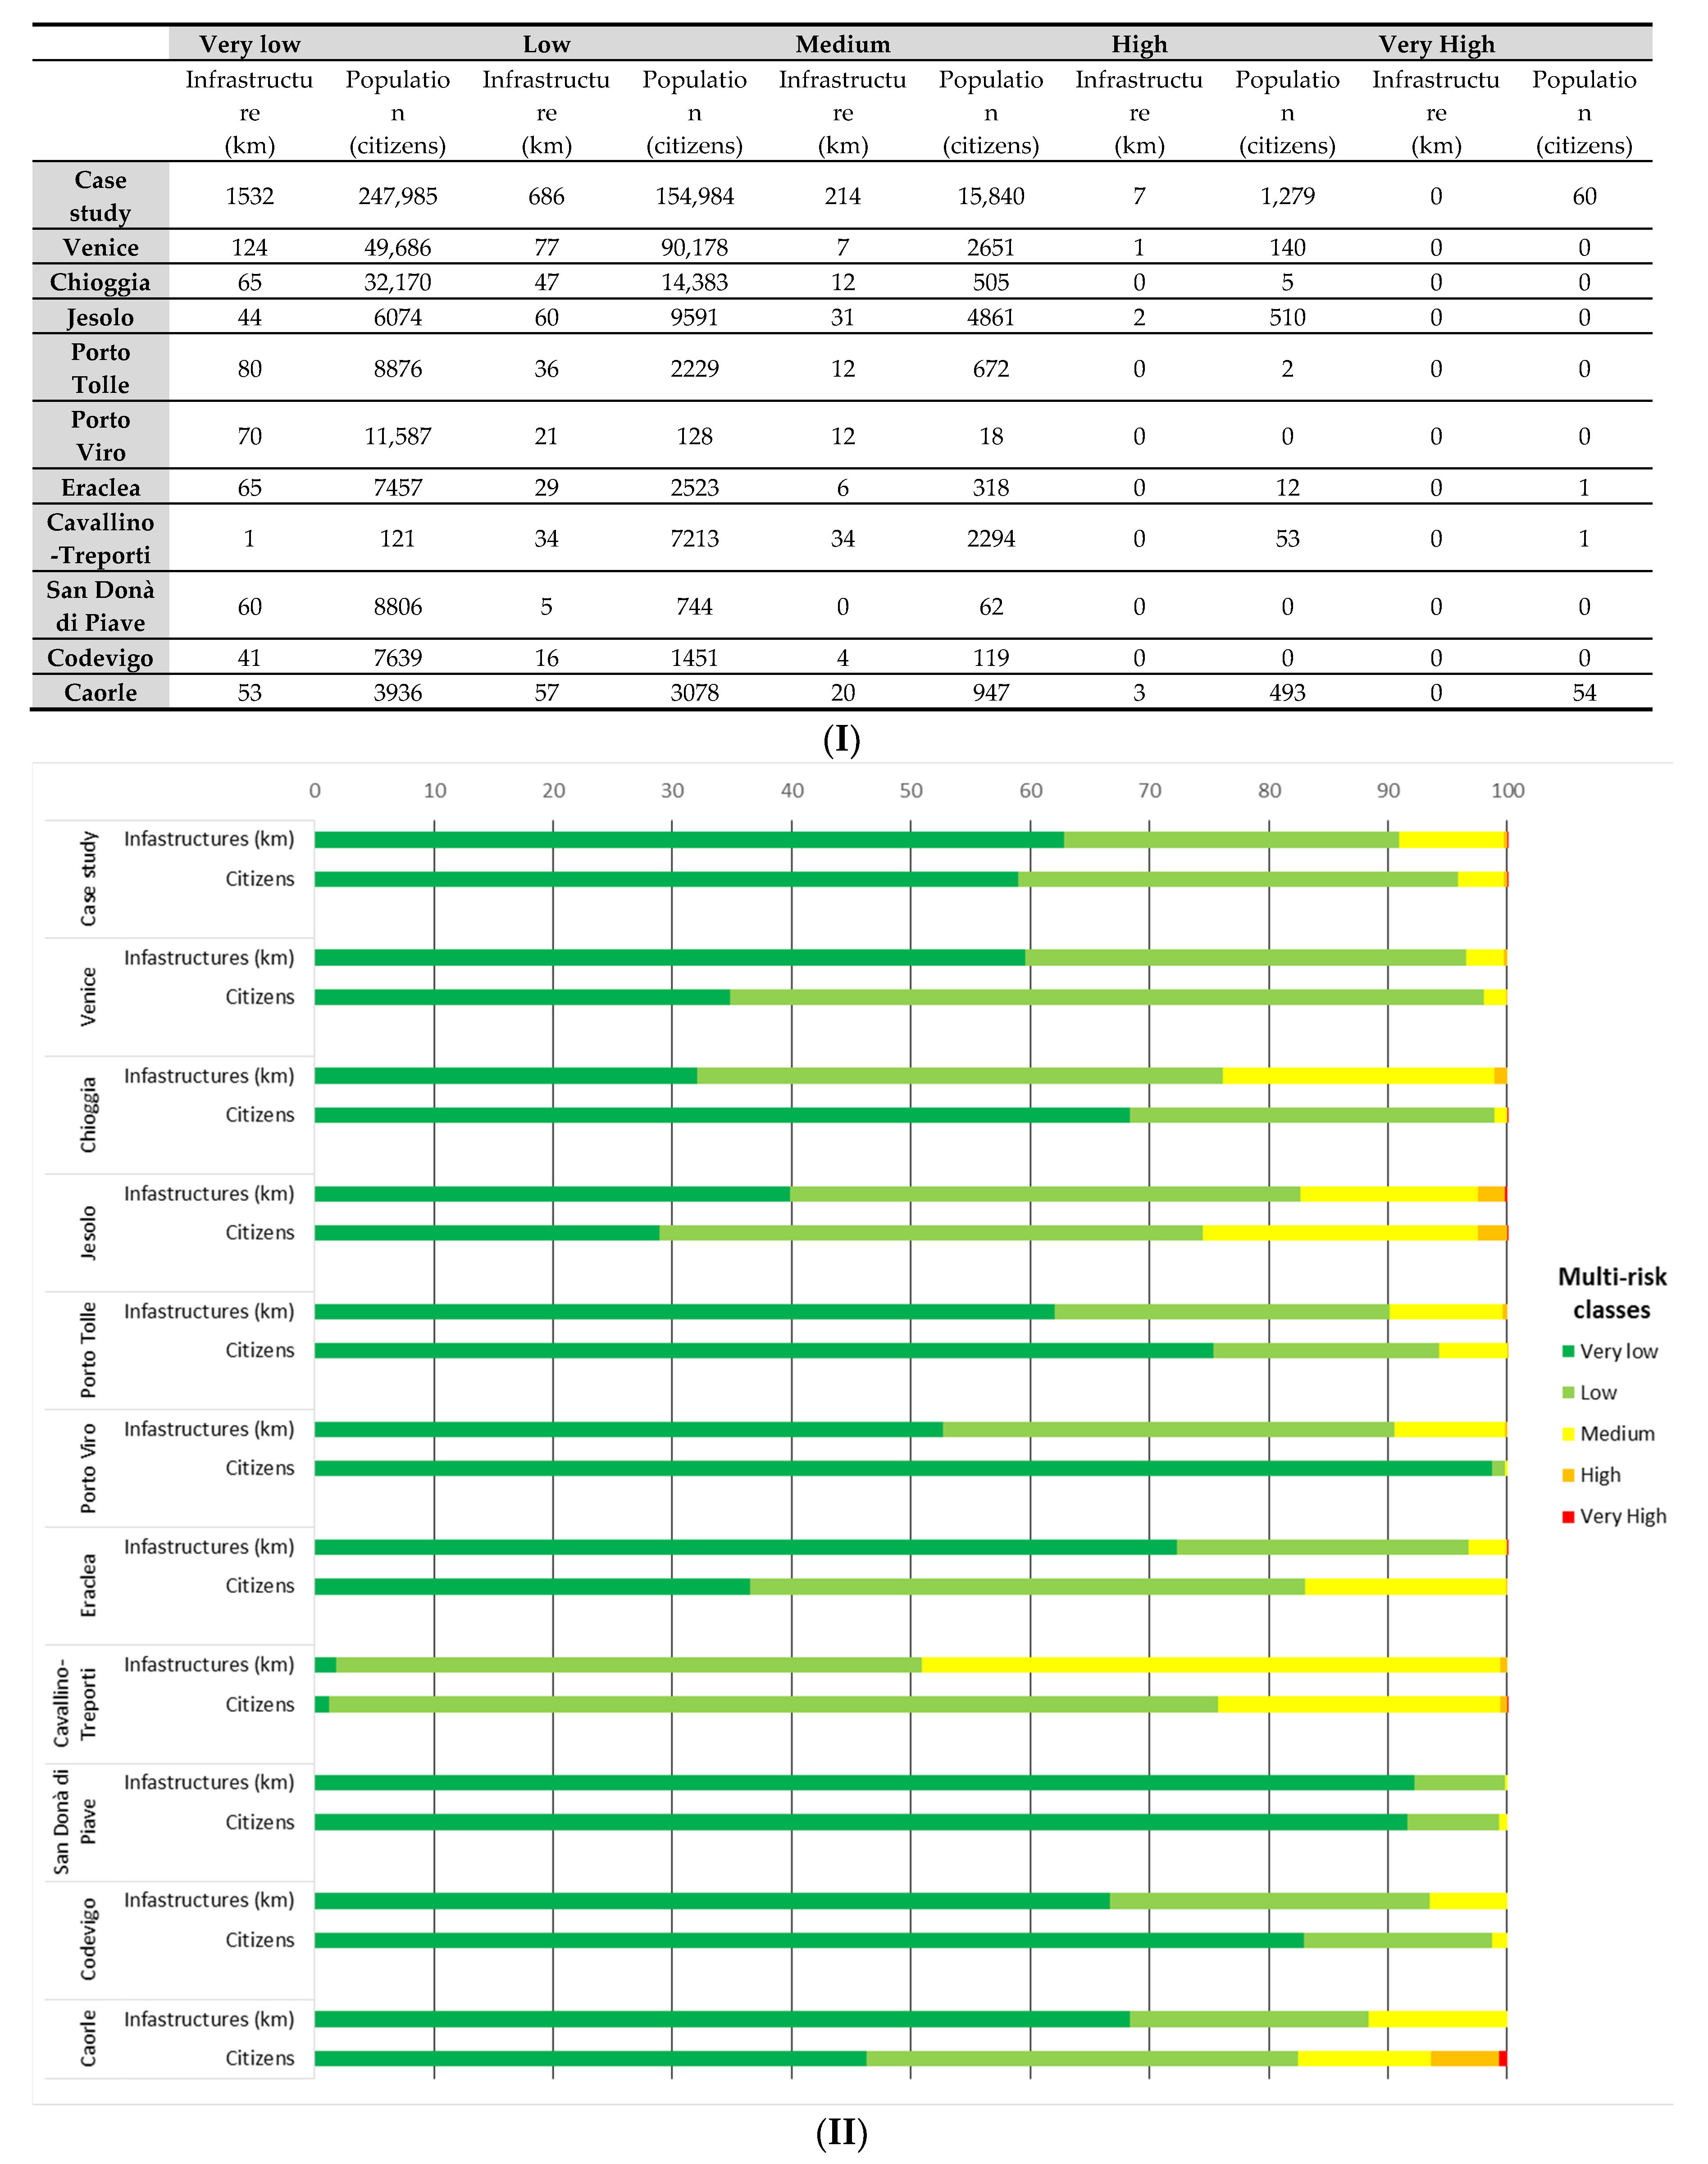
Table 1.
Summary and technical description of single hazard scenarios employed in multi-risk assessment for the North Adriatic coast.
Table 1.
Summary and technical description of single hazard scenarios employed in multi-risk assessment for the North Adriatic coast.
| Single Hazard Map | Description | Technical Features |
|---|---|---|
| Sea-level rise (source: [35]) | Maps of inundated areas (cm) according to projected sea-level rise scenarios for the year 2100 (spatial resolution 25 m). |
|
| Storm surge (source: [58]) | Maps of inundated areas (cm) according to different storm surge return periods and sea-level rise scenarios (spatial resolution 25 m). |
|
| Coastal erosion (source: [36]) | Maps of seasonal coastal erosion hazard for the thirty-year period 2070–2100 (spatial domain: 1 km from the shoreline, spatial resolution 25 m). |
|
Table 2.
Available dataset for the characterization of exposure and vulnerability in the North Adriatic coast (VE, Veneto Region; FVG, Friuli Venezia Giulia Region).
Table 2.
Available dataset for the characterization of exposure and vulnerability in the North Adriatic coast (VE, Veneto Region; FVG, Friuli Venezia Giulia Region).
| Dataset | Spatial Domain | Reference |
|---|---|---|
| Land cover Map (1:10,000) | VE | VE Region, 2009 |
| Monitoring Land Use/Cover Dynamics (MOLAND) (1:25,000) | FVG | FVG Region, 2000 |
| Digital Elevation Model (DEM) (5 m) | VE | VE Region, 2007 |
| Digital Elevation Model (DEM) (10 m) | FVG | FVG Region, 2006a |
| Natural reserves, Regional Parks, Sites of Community Importance (SIC)/ Special Protection Areas (ZPS) (1:150,000) | VE | VE Region, 2005 |
| VE | VE Region, 2008 | |
| VE | VE Region, 2006 | |
| FVG | FVG Region, 2007 | |
| FVG | FVG Region, 2008 | |
| Soil type, Geologic map (1:100,000) | VE | VE Region, 2009 |
| Soil type, Geologic map (1:150,000) | FVG | FVG Region, 2006b |
| Population and Housing Census | VE | ISTAT, 2001 |
| FVG | ISTAT, 2001 |
Table 3.
Multi-vulnerability matrix applied to the case study of the North Adriatic coast.
| Multi-Vulnerability Matrix | |||||||
|---|---|---|---|---|---|---|---|
| Beaches | River Mouths | Wetlands | Protected Areas | Natural and Semi-Natural Systems | Agricultural Areas | Urban Areas | |
| Storm surge | Slope angle | Slope angle | Slope angle | Slope angle | Slope angle | Slope angle | Slope angle |
| Vegetation cover | Vegetation cover | Wetland typology | Vegetation cover | Vegetation cover | Agricultural use | ||
| Coastal typology | Wetland extent | ||||||
| Vegetation cover | |||||||
| Coastal Erosion | Slope angle | Slope angle | Shoreline evolution | Slope angle | Slope angle | Slope angle | Slope angle |
| Coastal typology | Shoreline evolution | Wetland extent | Shoreline evolution | Vegetation cover | Agricultural use | % of urbanization | |
| Shoreline evolution | Mouth typology | Vegetation cover | Vegetation cover | ||||
| Dunes | Vegetation cover | ||||||
| Vegetation cover | |||||||
© 2020 by the authors. Licensee MDPI, Basel, Switzerland. This article is an open access article distributed under the terms and conditions of the Creative Commons Attribution (CC BY) license (http://creativecommons.org/licenses/by/4.0/).
Share and Cite
MDPI and ACS Style
Gallina, V.; Torresan, S.; Zabeo, A.; Critto, A.; Glade, T.; Marcomini, A. A Multi-Risk Methodology for the Assessment of Climate Change Impacts in Coastal Zones. Sustainability 2020, 12, 3697. https://doi.org/10.3390/su12093697
AMA Style
Gallina V, Torresan S, Zabeo A, Critto A, Glade T, Marcomini A. A Multi-Risk Methodology for the Assessment of Climate Change Impacts in Coastal Zones. Sustainability. 2020; 12(9):3697. https://doi.org/10.3390/su12093697
Chicago/Turabian StyleGallina, Valentina, Silvia Torresan, Alex Zabeo, Andrea Critto, Thomas Glade, and Antonio Marcomini. 2020. "A Multi-Risk Methodology for the Assessment of Climate Change Impacts in Coastal Zones" Sustainability 12, no. 9: 3697. https://doi.org/10.3390/su12093697
Note that from the first issue of 2016, this journal uses article numbers instead of page numbers. See further details here.