1. Introduction
Within the European Union (EU), urban areas cover about 25% of the entire populated area [
1]. Furthermore, according to Augère-Granier [
2], member of the EPRS (European Parliamentary Research Center), rural regions account for approximately half of European land and are home for 28% of the European population. Profound environmental, economic, cultural, and demographic differences characterize these regions, and in planning sustainable strategies for non-urban areas the choices are widely varied and heterogeneous. This huge variability means that a unique, simple, and direct political perspective is a challenging issue and, in the European multicultural framework, a common approach is even more difficult and perhaps ineffective. In Italy, the introduction of the National Strategy for Inner Areas (NSIA) in 2013 [
3,
4] enriched the rurality concept [
5]. The strategy was re-proposed and approved by the EU for the next programming period 2021–2027. The main criterion with which these territories, belonging to rural areas, were identified was the distance (in terms of time) from a selected municipality to the nearest agglomeration providing services of general interest (SGIs). The wider this dimension, the greater is its periphery [
6,
7].
Sustainable territorial development can be promoted via the three pillars of sustainability. Therefore, the research aim is to discover the relationships and interactions among the pillars and the indicators of each pillar in rural and peripheral municipalities, to provide decision makers with a cognitive framework for identifying possible sustainable paths. The case study involved the Italian peripheral and ultra-peripheral municipalities located in the national insular region composed of Sicily and Sardinia, corresponding to the unit NUTS2 (Nomenclature of Territorial Units for Statistics). For administrative purpose, Italy is divided into regions, provinces, and municipalities. NUTS2 refers to regions. We decided to analyze these two NUTS2 Italian regions after a reasoned process. The first step concerned the analysis of inner areas at the national level, starting with the cartography (maps) that supports the idea of the distribution of these areas in the territory. The attention then shifted to Sicily and Sardinia due to their insularity and peripherally. The second step consisted of integrating the municipalities classified as at least peripheral, with their degrees of rurality as attributed by the rural development plan (RDP). As a result, we obtained four territorial classifications based on peripherality and rurality.
From a territorial sustainable development perspective, a multi-criteria approach is recognized as a useful tool [
8,
9], about which a vast and growing literature has been developed [
10,
11,
12]. More specifically, we used the rough set theory (RST) approach because of its capacity to discover hidden patterns in data [
9]. Furthermore, the set of “if ... then” rules induced with this method allows us to propose approaches to sustainable territorial instruments with more effective results. In line with the literature [
13,
14], we established a set of indicators, based on the three pillars of sustainability at the municipality level in peripheral, ultra-peripheral, and rural (intermediate and with comprehensive development problems) municipalities.
Considering the current COVID-19 crisis, in which additional European funds could be made available for nations most severely affected by the pandemic, the importance of this type of analysis is crucial. These funds represent a significant opportunity for the development of those areas that have recently encountered difficulties. Therefore, they should be used as efficiently as possible.
Our work is organized as follows.
Section 2 provides the used materials and methods,
Section 3 focuses on the peripheral and rural concepts,
Section 4 presents the case study, and
Section 5 presents the main results, with an analysis of the obtained decision rules. Finally, the last section devotes attention to a discussion of the results and possible future development.
2. Materials and Methods
To better describe rural and/or peripheral areas, the literature has focused on identifying peculiar characteristics through the three pillars of sustainability. In line with previous studies [
13,
14], this research strives for a balance among different pillars, represented by eight socio-demographic, six economic, and six environmental indicators (see
Table 1). Furthermore, it should also be noted that, within each field (i.e., pillar), a multitude of aspects were taken into consideration. For example, in the first set of attributes, the first four (S1–S4) were concerned with the current demographic situation of the municipalities, whereas in S5 and S6 the aspects of social life were taken into consideration. These are also important because they can modify the attractiveness of a specific territory. Aspects of primary sectors were considered in ECO5 and ECO6, the industrial sector was included in ECO2, and services were represented both by the number of banks and the number of touristic beds. For the environmental pillar, a balance among the possible risks (hydrogeological risk and soil erosion) and positive impacts on the environment (organic farmers and park areas) were taken into consideration.
Among the mathematical and machine learning tools available to decision makers, due to the ease with which its outcomes can be understood, RST appears to be the best fit for this multi-attribute analysis [
9,
13]. The theory enunciated by Pawlak [
24] relies mainly on two concepts: the indiscernibility relations and the equivalence of classes.
The theory is founded on the idea that inside a nonempty universe
all objects are characterized by some information and, considering the available information, objects with the same information are indiscernible (similar) [
24]. More formally, objects
are related to some information, known as attributes
, which are part of the finite attribute set
, and all values taken by an attribute
are included in its domain set,
(meaning that there is a domain set for each attribute). Thus, for a subset
of the attribute set, the universe is partitioned into elementary sets (equivalence classes) by the indiscernibility relation. In other words, every granule (atom) of knowledge about the universe is contained in an elementary set, namely, in a set of indiscernible objects. Any union of elementary sets, inside the universe, can be defined either as a crisp (precise) set or otherwise as a rough (vague) set [
25]. The boundary region of the latter contains objects that cannot be certainly classified with the available information, and is calculated as the difference between the upper and lower approximation. To the lower approximation set belongs all of the elements that clearly belong to the rough set, whereas, in the upper approximation elements possibly belonging to the rough set can be found. Formally, denoting a crisp or rough set
and denoting an equivalence class with
, the upper approximation is defined as
, and the lower approximation definition is
. Thus, the boundary region is
[
24]. Another fundamental concept is that of the information system,
which is a non-empty pair defined by the universe and the attribute set. An information system can be visualized as a matrix in which columns are attributes and rows are objects with the corresponding entry values (attribute values). To perform the analysis, among the attributes in the information system, the individuation of a decision attribute is required. Thus, the attribute set
is divided into two disjoint categories, the conditional attributes
and the decision attributes
[
25]. In this case the information system takes the name of a decision table, that is,
.
In this study, the decision attribute was divided into four classes, resulting from the intersection between peripheral and ultra-peripheral areas with intermediate rural and lagging rural areas. From the authors’ perspective, no municipalities are considered to be better than others, but simply face different complexities and fragilities. However, purely from a classification perspective, a municipality classified as peripheral is better than an ultra-peripheral municipality, and intermediate rural is better than lagging rural. Moreover, to induce rules the attributes values were divided into different categories: Very Low (VL), Low (L), Medium (M), High (H), and Very High (VH). The subdivision of each attribute was based on the mean and the variance of the data in the sample. Furthermore, as boundaries between categories, meaningful percentiles were taken as a reference.
Table 2 presents the intervals of each category of the conditional attributes.
In other terms, this can be seen as a sequence of conditional attributes and decisional attributes, that is:
There are different ways to measure the suitability of a rule. One is to measure its strength, which is defined as the ratio between the support of the decision rule and the cardinality of the universe. Moreover, two conditional probabilities are associated with each rule, that is, the coverage and certainty coefficients. The former denotes the percentage of objects, given a specific set of conditional attribute classes that fall into a decision class with respect to the total objects falling into the same decision class. The latter, in contrast, reveals the number of objects with specific conditional and decision attributes relative to all objects having the same conditional attributes. If the certainty is equal to one (100%) the rule is certain and refers to objects inside the lower approximation set; on the contrary, if the certainty is less than one the rule is called uncertain and refers to the upper approximation set [
25]. The formal definition is based on the notion of support, which is
, and thus the strength of a rule is:
the coverage coefficient is represented by:
and the certainty coefficient follows as:
In addition, two other steps occur prior to rule processing in RST, namely, the creation of reducts and the related core. A reduct is the minimal set of attributes that safeguard the same decision classification with respect to the set of all attributes. More than one reduct is likely to be present in every decision table and its importance come from how specific subsets of attributed can give the same characterization, thus, if an attribute is missing in the reducts it can be defined as not important for the decision table. The core equals the intersection of all reducts. If the core is a non-empty set, then at least one of the attributes is essential and cannot be removed from the decision table without making the categorization collapse. By comparison, if the core is empty, as in this case study, then no attribute is essential for a perfect approximation [
25,
26].
Rules were induced using the freeware ROSE2, which is an abbreviation of ROugh Set data Explorer [
27]. The graphical user interface (GUI) makes interactions straightforward.
In the standard version of ROSE2, the rules are induced using three algorithms: Explore [
28], Learning from Example Module, version 2 (LEM2) [
29,
30] and Modified LEM (ModLEM) [
31]. The latter two algorithms are based on the system Learning from Example using Rough Sets (LERS). LEM2 adopts a single local covering approach for every decision concept by exploring the search space (the approximations). The result of rule induction is the creation of a minimal set of rules covering all examples in the decision table and usually produces the best result [
26]. An addition to LEM2 is the possibility to generate rules with interval extensions (LEM2 Interval); that is, in a rule, an attribute can assume more than one value if by doing so the strength of the rule is improved. For example, an attribute can move from having just the value “Low” to having possible values in both “Low” or “Medium”.
In the ModLEM algorithm the elementary conditions are set using a less–more relation according to a threshold in the attribute domain. There are two different ways to evaluate conditions: Entropy and Laplace. ModLEM-Entropy measures rules only cover a small number of examples, whereas ModLEM-Laplace refers to higher values of Laplace accuracy to induce rules. The latter is better at inducing the number of rules, whereas the former generates rules with more strength [
26,
31].
In contrast, the Explore algorithm extracts all decision rules from users’ stated requirements, such as the rule’s strength, level of discrimination, or the rule’s length (number of conditional attributes). The previous two algorithms’ inconsistencies are handled using RST. The rule space is continuously explored for each concept until the stopping condition is reached, and rules are generated with increasing size from one conditional attribute onwards. Depending on a user’s needs, a bigger set of rules might be generated compared to other algorithms [
32].
3. Rural and Inner Areas
Rural areas are extremely diverse and have different needs, and rurality is a recognized multi-dimension concept [
33,
34]. Despite their complexity, the indicator commonly used to identify rural areas is population density, as proposed by the Organization for Economic Co-operation and Development (OECD) [
33] and adopted by the EU for the drafting of the RDPs, due to its simplicity of calculation. This method classifies territories into three categories: predominantly rural, intermediate, and predominantly urban. However, this has not prevented member states from exploring and proposing alternative definitions that can cope with specific needs. This is the case of Italy, which has adopted a territorial classification methodology, identifying four areas based on population density and on the share of agricultural land. It follows that, regarding rurality, the national territory is classified as follows: urban poles (A), rural areas with specialized agriculture (B), intermediate rural areas (C), and rural areas with comprehensive development problems (D). Italy then adopted a further territorial classification based on the (in)adequacy of the population’s access to essential services, which originates from the analysis of the inefficient use of European funds [
35], due to a certain vagueness in the objectives and strategies defined in the 2007–2013 programming period. Among the suggested seven innovations in methods and three strategic advices for problem areas (cities, Southern Italy, and inland areas), the creation of Italian inner areas was widely taken into consideration in 2013, when the NSIA was signed as part of the 2014–2020 partnership agreement (PA). The final objectives of the strategy were local development (increasing the efficiency and size of local activities) and the reversal of negative demographic trends such as depopulation, low birth rate, aging of the population, and emigration. As a result, five intermediate objectives were identified, namely, the increase in the well-being of the local population, the rise in local demand for labor, a greater use of natural capital, the reduction of social costs, and the strengthening of local development factors. Each objective should be achieved through two sets of actions: increasing services of general interest (health, education, mobility, Internet access) and implementing local projects. An important role was assigned to local communities because they should efficiently manage these areas and, in addition, create projects to promote sustainable development. The interdependence between central government action and local action was underlined as it is seen as a way of ensuring a better future for inner areas, thus avoiding an increase in costs for society in general. The base for inner area classifications is the polycentric nature of local units or agglomeration of local units, which can provide a wide array of services of general interest [
3,
7,
36]. The methodology applied was articulated in two phases: identification of municipalities belonging to a “Service Center” (SC) and, then, based on physical distance, of the remaining municipalities [
37]. The first class includes municipalities, with the co-presence of at least a full range of secondary education (ISCED-International Standard Classification of Education) 3), a hospital at DEA1 level (a 1st level DEA (Dipartimento di Emergenza ed Accettazione) is a hospital department in which the following services are offered: emergency room, general practice, general surgery, orthopedics, traumatology, cardiology with intensive care unit, radiology, and medical laboratory [
37]), and a Silver category railway station (medium/small systems with an average degree of uptake lower than Gold, mostly for metropolitan/regional services and a few long-distance journeys). These services were chosen because education and health are essential, while railways have been of major importance to national development and internal mobility. Once the Service Center definition was set, following a gravitational model approach, the remaining municipalities were subdivided into two macro categories depending on their distance in terms of time from the closest Service Center. For practical purposes, a letter was assigned to all subcategories: the first macro-category is called Center and includes the Service Centers, both a single municipality (A) or a union of municipalities (B), and outlying municipalities (C), which are those within 20 min distance of an SC. The Inner Areas category includes all those areas that are further than 20 min and is subdivided into three: Intermediate (D), those between 20 and 40 min; peripheral municipalities (E), between 40 and 75 min; and ultra-peripheral (F) municipalities, over 75 min away (20, 40, and 75 min represent the 33rd, 66th, and 75th percentile of the distribution of time-distance between Service Centers and municipalities [
37]). 72 pilot areas [
7] were individuated, based on regional and local government help, for the programming period 2014–2020. The common criteria for choosing pilot areas were the following:
being an inner area, with preferences for peripheral and ultra-peripheral and as C or D in the RDP,
having critical values in socio-demographic, economic, and environmental indicators,
adoption, or intention to do so, of unions or associations between a number of municipalities to provide services,
having a pre-existent experience in local development cooperation (LAGs, parks, etc.) [
4].
According to [
38], the population of the Italian inner areas is around 24% of the total and resides in 4261 municipalities (53%), with a total territorial extension of 184,000 km
2 (around 60% of national territory). Thus, land abandonment or a general degradation of such a wide area would have a significant on the overall society. However, not all inner areas are subject to the depopulation trend. For example, at the national level, the intermediate areas (D) display a better socio-economic performance. In contrast to the municipalities classified as E and F, in which the change in resident population between 1971 and 2011 was negative (−8.1% and −5.3%, respectively), the inner peripheries as a whole experienced a positive variation of 4.2% [
4]. Thus, the intermediate areas showed a strong positive trend, resulting in performance that is even better than that of SCs. In Sicily, peripheral areas were subject to a strong negative demographic trend, with a loss of 8.1% at the peripheral level and of 21.1% at the ultra-peripheral level. By comparison, Sardinia ultra-peripheral municipalities saw an increase in residents of 13.9%, which is an improved performance compared to the Sardinian intermediate area (+11.3%) [
3].
4. Case Study
The Italian insular region is composed of Sicily and Sardinia, the largest islands in the Mediterranean Sea, with areas of 25,729 and 24,100 km
2 respectively [
39]. In both, a hilly environment prevails (over 60%), a multitude of islets surrounds them, and volcanoes are widespread. Both benefit from a typically Mediterranean climate, which, due to their rich natural and cultural heritage, means they are an ideal tourist destination, particularly during spring and summer seasons. The history of the two islands, even if quite different, is relevant: important traces in the culture, in the priceless natural and historical heritage, and in the territory are visible and attractive.
From an administrative perspective, the number of municipalities is quite similar: 390, divided into three metropolitan cities and six provinces, in Sicily; and 377 in Sardinia, widespread across four provinces and one metropolitan city [
39]. Both regions are recognized by the Italian Constitution (art. 116) with a special status (i.e., autonomous regions), which gives them extensive administrative powers. Sicily, however, has wider autonomy because it can rule exclusively over 17 subjects and is exempted from contributing to the central government budget. In contrast, Sardinia which has exclusive rule over 15 subjects, must share a portion of its tax revenue with the state, although this is a lower percentage than that of other regions with a special status.
From a demographic perspective, both regions have experienced the trend of advanced countries of a progressively aging population, but otherwise have little in common. Sicily has a population of around five million inhabitants with an average population density of 195 inhabitants/km
2 [
15]. Moreover, the region saw an increment in the median age of 6% during the past decade (from 41.2 to 43.7, 2007–2017) and, similarly, the aging index increased from 116 to 149 [
15]. Sardinia has experienced similar trends, although its starting point was higher than that of Sicily. During the past decade, the median age increased from around 43 years in 2007, to above 46 years, an increase of 8%. During the same period, the aging index increased from almost 150 to above 200 [
15]. In 2017, the region had a population of around 1,650,000 inhabitants and an average population density of 98 inhabitants/km
2. Because most people reside on the coast, the demographic situation in Sardinia appears to be less favorable than that of Sicily.
Economically, both regions have faced (and are facing) difficulties, with gross domestic product (GDP) per capita consistently lower than the European average. The EU classified both areas as less developed regions prior to 2013 (according to EU regional policies, less developed regions are those with GDP lower than 75% of the EU average). During the European programming period of 2014–2020, Sardinia was included in the EU’s list of transition regions; however in the subsequent programming period of 2021–2027, it will again be classified as a less developed region. In fact, during the past decade, the GDP per capita of Sardinia slowly decreased and is now around 70% of the EU average. Sicily followed a similar path; although a positive trend appears to have emerged in recent years, its GDP per capita is around 60% of the EU average. Furthermore, another similarity between the regions is the GDP composition by sector; in 2017, both regions were dominated by the service sector, which accounted for over 80% of GDP, a substantially higher share than the national average. Agriculture has a bigger role (around 4.5%) compared to the national average, which is around 2.1%, and the industry share is far below the national average of 18% [
15]. These weak regional economic performances are clearly reflected in the job market: employment rates are below, and unemployment rates above, the respective national averages (for the 2008–2018 period), with younger citizens and women the most severely affected. Gender inequality is demonstrated by the fact that the employment rate for women is lower than that of men by 18% in Sardinia and 23% in Sicily [
15]. A similar trend characterizes young people, with even more discrimination between women and men seen in the measure of employed people. Combining these trends with the percentage of the population defined as Not in Education, Employment or Training (NEET), which was around 48% in Sicily and 36% in Sardinia during the past decade (with worse percentage differences for women compared to the employment performances) [
39], highlights the static and problematic nature of the job market. This has consistently been a problem in the insular region despite a continuous improvement trend since World War 2 (which has been more marked in Sardinia).
The insular region is the home of around 200 areas of natural interest (national and regional parks, marine protected areas, nature 2000 sites, etc.), which represent a significant potential for rural tourism growth and important job opportunities for both regions. Moreover, in Sicily there are five cultural and two natural world heritage sites, and in Sardinia there is a world cultural heritage site [
40]. An additional positive recent trend unifying most inner areas is the increase in the number of protected geographical indication (PGI) products, which are subject to stricter regulation of production methods.
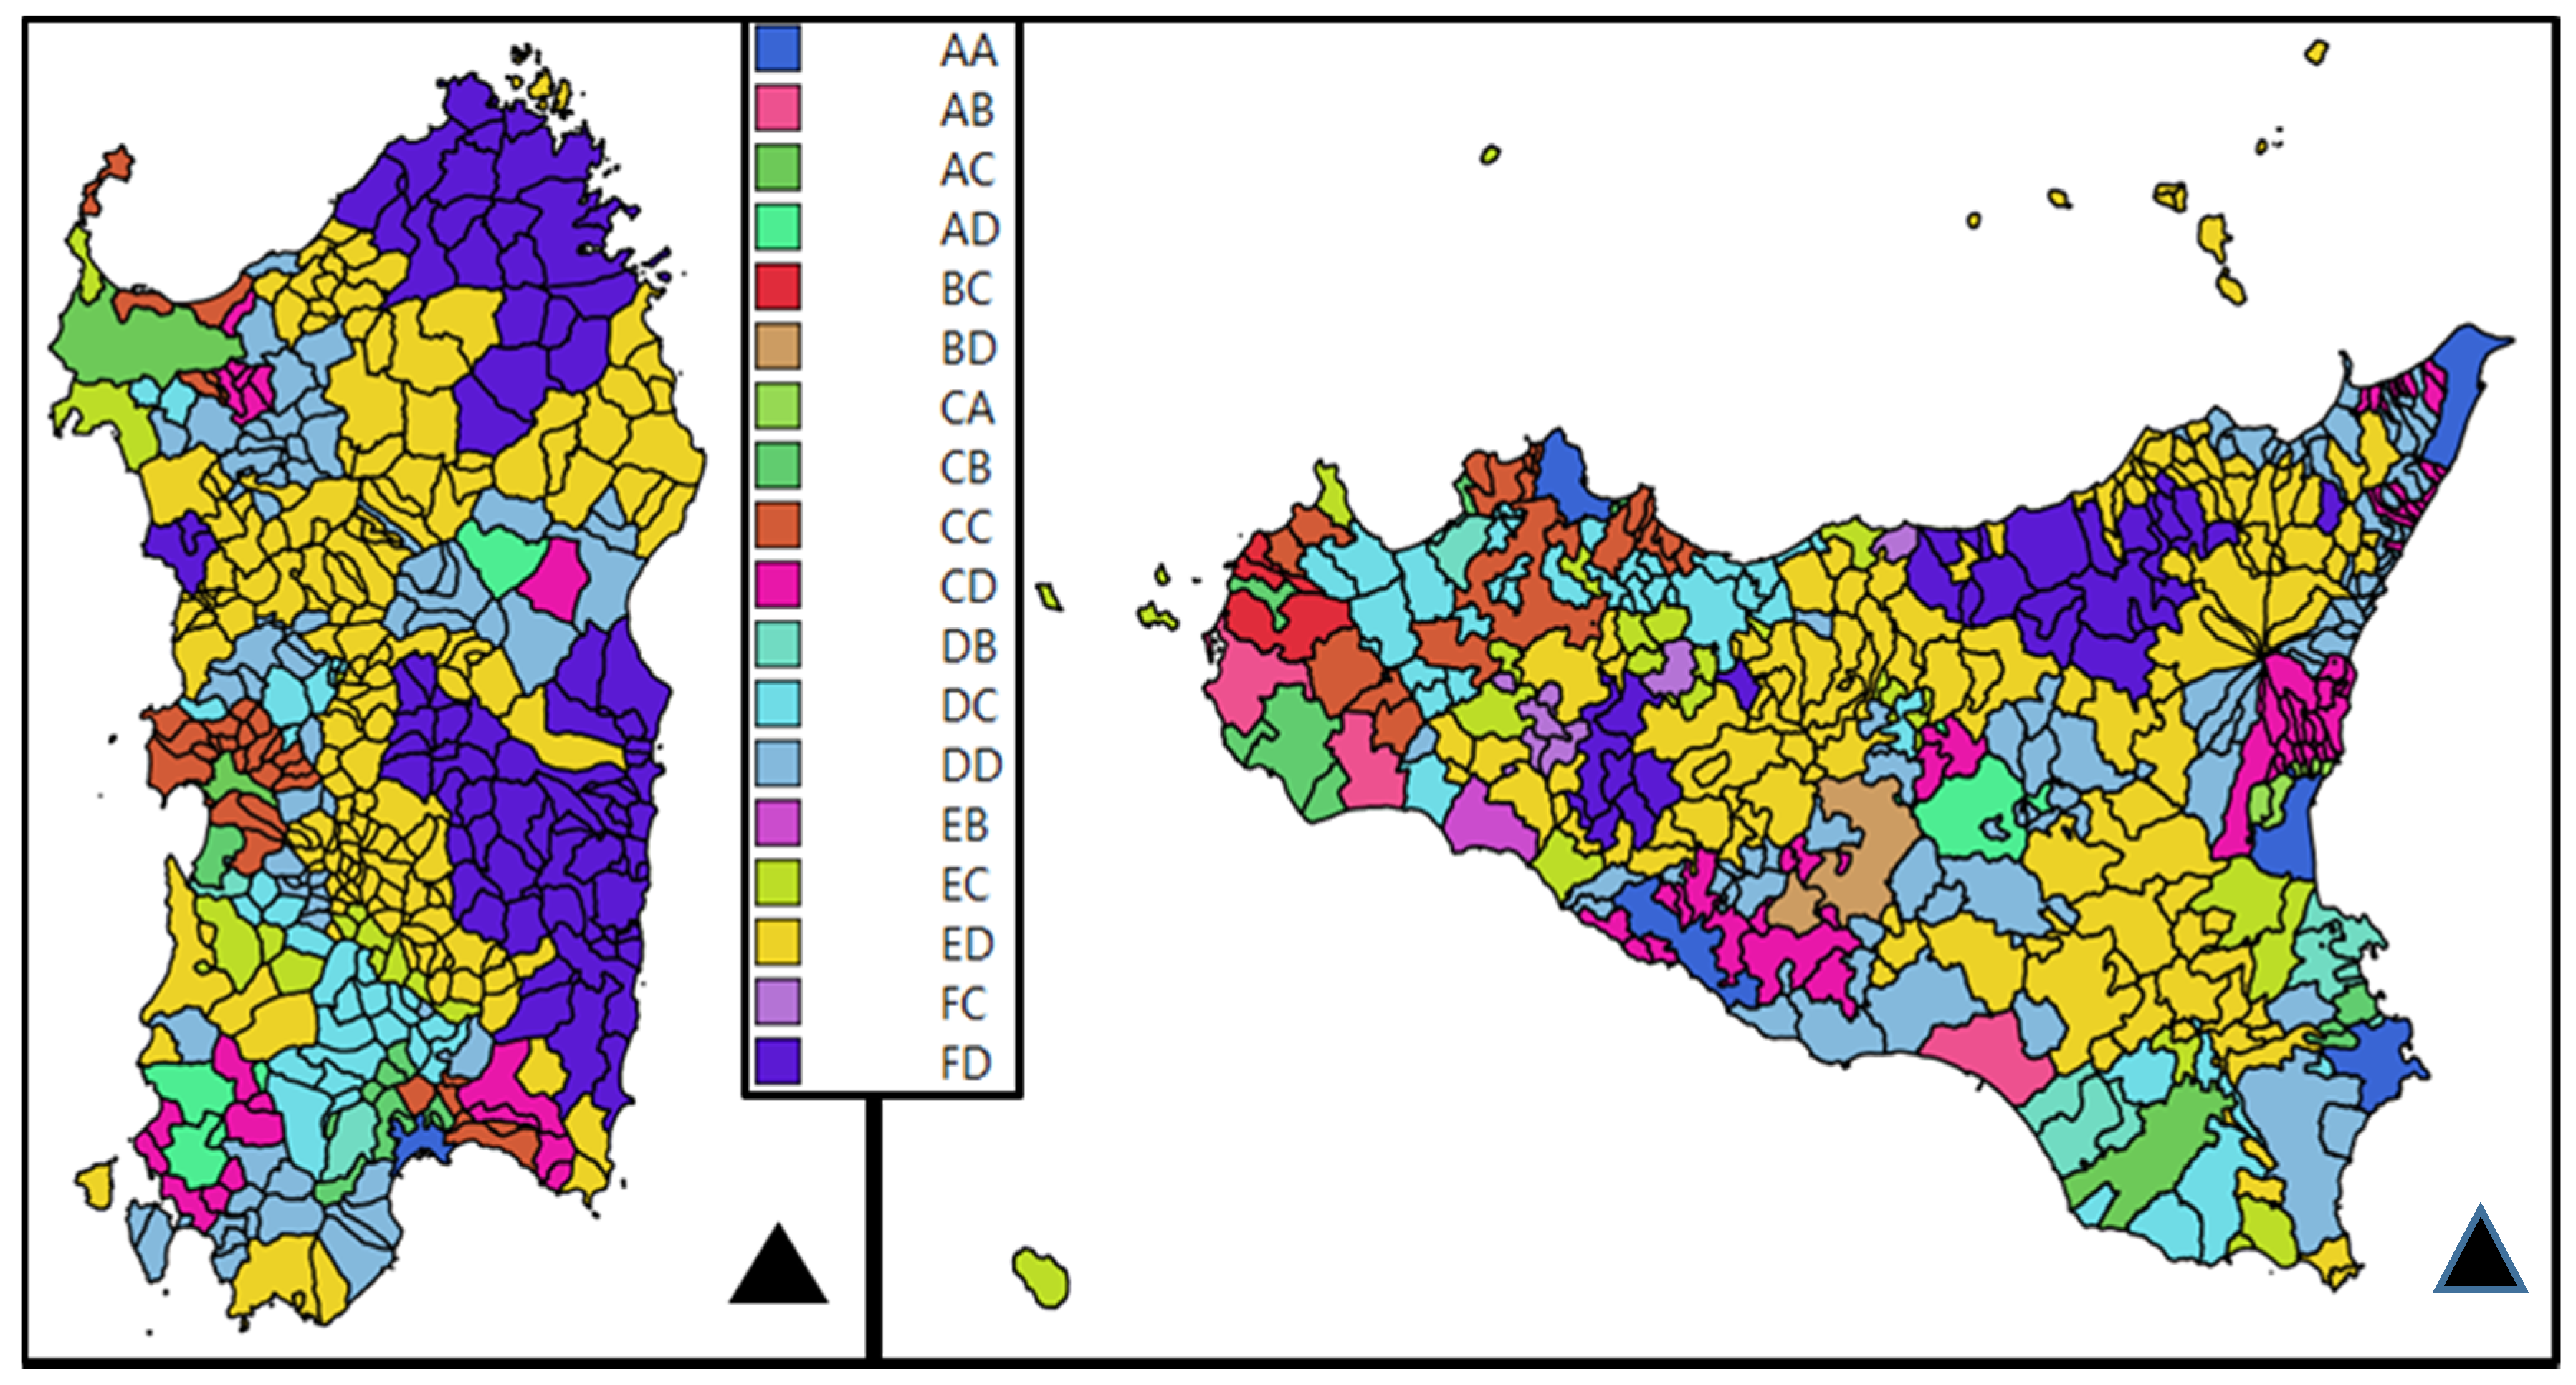
Rurality and peripherally are intertwined in many ways. In both regions, most provinces in the RDP are classified as either intermediate rural or rural with comprehensive development problems. If this classification is merged with the NSIA classification, as was done for this paper, a clear heterogeneity emerges, not only in terms of whether municipalities are able to be Service Centers, but also in terms of the manner in which the economic and environmental assets can vary. Map 1 (
Figure 1) clearly pictures this heterogeneity; in the legend the first letter represents the NSIA classification of the municipalities (Service Centers (A and B), outlying (C), intermediate (D), peripheral (E), and ultra-peripheral (F)), and the second letter represents the RDP classification (urban (A) and rural with specialized agriculture (B), intermediate (C), and with comprehensive development problems (D)).
Furthermore, a vast majority of the insular municipalities belong to inner areas (84% in Sardinia and 75% in Sicily). The municipality classification (our decision attributes) adopted and the number of selected municipalities in this paper are summarized in
Table 3. It can be seen how an overwhelming majority of municipalities are classified as rural with comprehensive development problem, which account for 95% of municipalities in Sardinia and 80% of municipalities in Sicily. Similarly, the peripheral areas numerically dominate the ultra-peripheral territories in both regions. It is also interesting to note that the FC class is populated only by Sicilian municipalities, corroborating a highlight of Map 1 (i.e., that the region is more heterogeneous). Moreover, it should be noted that the large number of municipalities in the ED class has an influence on the complexity of the analysis of these territories because more rules might be produced for this class.
Moreover, both regions had (and have) serious infrastructure deficits, with Sardinia facing the largest shortfall. In the region, the main public railway network is aligned in a south–north direction, whereas public transport on the west–east axis is almost absent. In this particular case, a different approach might be desired, as was noted in the report of the regional government that identified pilot areas for the NSIA [
41]. The regional offices extended the classification of Service Centers to a wider range of cities, such as Olbia in which only a type of high school was missing (the NSIA criterion is a full range of high schools). In this alternative view, the ultra-peripheral areas would almost disappear within the region. In the current work, the national classification was used because it covers the whole territory; however, it might be possible that the rules induced from this dataset will be distorted due to the presence of such cities, which are considered either peripheral or ultra-peripheral municipalities.
5. Results
This section is dedicated to the presentation of the results obtained from the analysis using ROSE2. It is structured as follows: the reporting of some general results is followed by the analysis of selected LEM2 rules and all the rules obtained for ultra-peripheral and intermediate rural areas (FC). This work is not focused on a comparison of the different algorithms, but rather on analyzing the induced rules to better understand the characteristics of the four decision classes.
From the four algorithms, a total of 229 rules were induced. For each algorithm, the more populated decision class was the peripheral and lagging rural class (ED), which ranged from 40% to 50% of all of the rules. Ranked second was the ultra-peripheral and lagging rural class (FD) with a range from 30% to 35%, followed by the peripheral and intermediate rural class (EC) ranging from 26% to 23%, and, finally, the ultra-peripheral and intermediate class (FC) with a constant 5% across algorithms. A perfect exemplification is given by the LEM2 rules, in which 10 (16%) fall under ED, 31 (49%) are in ED, 3 (5%) fall under FC, and 19 (30%) are in the FD class.
In line with the previous example of LEM2, the rules with the highest coverage rate (rule 2, rule 13, and rule 46) for the three decision-making attributes corresponding to the identified territorial classes (excluding FC) are shown below. Because these rules are those with the greatest number of supporting municipalities, their choice allows an understanding of the territorial dynamics of each class.
Municipalities are in a peripheral and intermediate rural area (rule 2) if the population density and food risk are High, organic agriculture is Low, and land consumption is Medium. The coverage rate is 19.05%.
Municipalities are in a peripheral and lagging rural area (rule 13) if recreational activities, flood risk, organic agriculture, and park area are Low, and land consumption is Medium (as in peripheral and intermediate rural areas). The coverage rate is 8.21%.
Municipalities are in an ultra-peripheral and lagging rural area (rule 46) if aging index, IRPEF (Imposta sul Reddito delle Persone Fisiche, Tax on Personal Income), and park area are Low, and touristic beds is High. The coverage rate is 15.79%.
A common aspect of the first two rules is the absence of the economic pillar, meaning that for the municipalities in these rules, a possible path of development must be envisioned in which the environmental and socio-demographic pillars are considered together, whereas different and specific policies should be adopted for economic development. In the third rule, all of the sustainability pillars with at least one indicator are included. In this case, the current situation is also influenced by the economic performance.
Moreover,
Table 4 shows the rules with the highest coverage rate, in the case of the ultra-peripheral and intermediate rural area, comparing the rules obtained with the four algorithms used. In our case study, four Sicilian municipalities belong to the ultra-peripheral and intermediate rural area.
Seven attributes, namely S3, S4, S6, S8, ECO4, ECO5, and ECO6 belonging to the socio-demographic and economic pillars, do not play any role in defining these municipalities. Furthermore, it should be noted that with this low number of municipalities, the algorithms of LEM2 and its interval extension induce the same rules and thus can be considered as one. Moreover, rules E_35 (ModLEM-Entropy, rule 35) and L_36 (ModLEM- Laplace, rule 36) also have the same conditional attributes. All of the similarities are highlighted with italics in the table.
Of the three economic indicators that play a role, the number of banks (ECO3) appears in two rules with Medium values and in two rules with High values. Notably, income (ECO1) and local units (ECO2) also appear together, the first with value High and the second with Medium. The socio-demographic attributes are all distributed in the central-low side of the distribution. Population density (S1) and education (S5) take only a Medium value. Moreover, the number of associations (S7) appears with a Low value and the replacement index (S2) takes values Medium and Low. The environmental pillar appears to be the more populated pillar in term of value appearances. Flood risk (ENV1) takes a Low value and landslide risk (ENV2) takes a Medium value. Furthermore, quantity of fertilizers (ENV3) takes the values High and Very High, and organic farmers (ENV4) similarly take a High value. In addition, having a park (ENV6) inside the municipal territory also appears to be important in characterizing the class. The last attribute to consider is land consumption, which takes either Medium or High values. From the table it can be also seen that the economic pillar assumes a relatively less important role in both types of ModLEM algorithm (Entropy and Laplace), appearing in only one rule.
6. Discussion
Rough set theory appears to be a fitting methodological approach to the multi-criteria analysis of inner area sustainability. The induced rules and, in particular, the supporting municipalities of each rule are easily readable by decision makers without technical skills. Moreover, this open rule description appears to be perfect for the framework of the National Strategy for Inner Areas because of its possible bidirectional usage. From a central government perspective, the indication of the attributes that are more frequent in the rules will help in choosing a base for the general context of national policies. However, due to the vast heterogeneity, national policies cannot be tailored to the specificity of each territory. Thus, it is important for each local decision maker (both institutional and action groups) to be able to identify the current situation of the municipality and the most appropriate part of the national legislation to refer to. Furthermore, local actors will be able to create more sustainable and efficient projects for the territory. It is clear, however, that the four algorithms induced different rules—this is evident by looking at LEM2 and LEM2 Interval—and some doubts might arise. Thus, decision makers should focus on the interaction between the three pillars across different algorithms; for example, if in class EC, the ModLEM-Entropy algorithm does not take into consideration the economic pillar, this should be taken as an indication of how environmental and socio-demographic pillars interact in the area, where the economic pillar partially evolves in a manner that is detached from the other two pillars. It should also be considered, however, that some trends (especially those relating to demographic issues) cannot be changed in the short term and require greater efforts to reverse the process.
Furthermore, results of the analysis show the importance of distinguishing between the differences among the inner areas. This distinction is further highlighted by the different number of rules connected with a decision class; the higher the number of rules, the more complex the territories belonging to those areas. In our case study, more attention should be paid to the peripheral and lagging rural areas. Moreover, different algorithms produce rules with different conditional attributes determining different specificities for each area. For example, in the intermediate rural areas (both peripheral and ultra-peripheral) the economic pillar has a smaller presence than the other two pillars. Thus, development policies should focus on the environmental and socio-demographic pillars simultaneously because the benefits will be greater. Similarly, policies directed toward economic development (such as better conditions for the job market) can be implemented by focusing only on some economic factors. By moving the focus to the lagging rural areas, it is also clear that the economic pillar begins to play a joint role with the other two pillars. Thus, decision makers should consider the territory from the perspective of each aspect to increase the efficacy of his/her action.
Furthermore, it is also important to recognize that some conditional attributes, such as the aging index or the usage of fertilizers, are repeated in more rules and more decision classes, even if they are not common to all of them. An additional note regarding the aging index is that it is always present in rules in which other attributes are provided by the other two pillars. Thus, population structure is closely related to both economic and environmental activities and performances, making it a key aspect for an efficient policy approach. Moreover, mostly for ModLEM algorithms, population density, replacement index, and birth rate are also present in all decision classes. In contrast, some attributes are less common and even disappear in some decision attributes, such as ultra-broadband access or income from agritourism activities. However, it should be remembered that although the lower frequency of appearance might mean that the aspect can be ignored by the central government, for decision makers of the municipalities involved it should be considered to be as important as the other conditional attributes in the rule.
7. Conclusions
In this study, we have identified the level of economic, environmental and social sustainability of selected municipalities identified as peripheral and ultra-peripheral areas and, at the same time, rural areas, located in the major islands of the Mediterranean Sea, therefore, in a national and European perspective, peripheral, as a whole. Our municipalities are, consequently, peripheral or ultra-peripheral in a peripheral area. In these areas, more than in others, it is advisable to identify adequate supporting strategies, in order to avoid progressive abandonment and degradation and, on the other hand, promote social unease. The identification of the state of sustainability at different territorial levels (in our case municipalities) allows policy makers to target policies and strategies for achieving a balance between the different sustainability dimensions. The literature offers numerous applications relating to the measurement of sustainability [
5,
8,
9,
12,
36] mainly in rural areas, but peripheral areas are not excluded. Our study, compared to those proposed by the literature, focuses on four territorial typologies that hinge on the concept of periphery, connecting it to that of rurality, which, in the selected municipalities, has been shown to be either intermediate rural or rural with comprehensive development problems. The rural municipalities with comprehensive development problems hold the primacy especially in Sardinia. By contrast, our study shows that rural areas with specialized agriculture are not peripheral or ultra-peripheral. For municipalities belonging to peripheral and rural with comprehensive development problems areas, the rules, obtained through multi-attribute analysis, give us an extremely heterogeneous image, underlining on the one hand the complexity of these territories, and on the other the need for tailor-made interventions due to their diversity. Other research should be directed to other peripheral and rural areas of EU countries or regions in order to identify critical issues and common strengths to address top down policies in a perspective of sustainable European territorial cohesion. On the other hand, the proposed method constitutes a useful tool for decision makers at a local level that can be easily updated and quickly consulted in bottom up approaches for sustainable territorial development.
Other further research is needed to include, for example, a revised decision class in both rural and peripheral classifications to increase the focus on the characteristics of the territories. Moreover, for more detailed analysis, some indicators at the municipality level are necessary and should be made publicly available; for example, a good integration for the economic pillar would be the availability of work force statistics (employment and unemployment rates). Other interesting attributes could be the disaggregation of gross domestic product at the municipality level (currently the data is not produced at this level). In addition, another possible indicator for territorial analysis would be an estimation of the impact of illegal work on the municipal economy. From the socio-economic perspective, updated data on education would also benefit the precision of the analysis. As climate change impacts are becoming more visible, an interesting additional attribute would be an updated dataset on the desertification sensibility index. Moreover, the information system should be integrated by considering the balance between the three pillars on which sustainable development rests. In addition, it should be kept in mind that some of the attribute’s trends cannot be tackled at the local level because the instruments that should be used are out of the reach of municipalities. A clear example in this case study is the negative trends of the aging index, replacement index, and birth rate. To reverse these trends, the only viable path is via a national policy because of the longer time horizon and the wider policy space that central governments have.


