Article

Resident Support for Tourism Development: Application of a Simplified Resident Empowerment through Tourism Scale on Developing Destinations in Flanders

1
Department of Earth and Environmental Sciences, KU Leuven, 3000 Leuven, Belgium
2
Visit Flanders, 1000 Brussels, Belgium
3
Department of Economics, University Ca’Foscari of Venice, San Giobbe 873, 30123 Venice, Italy
*
Author to whom correspondence should be addressed.
Sustainability 2021, 13(12), 6934; https://doi.org/10.3390/su13126934
Submission received: 15 May 2021 / Revised: 11 June 2021 / Accepted: 17 June 2021 / Published: 20 June 2021

Abstract

:
While the potential macro-economic benefits of tourism development have been well-established, the negative social effects of uninhibited growth have received increased attention in the last decade, emphasizing the central role of communities in the search for a sustainable balance in tourism. This paper focuses on the relatively underdeveloped Scheldeland region in Flanders (Belgium), where a strategic goal is to leverage cultural and natural heritage to boost development. Via a resident questionnaire based on a simplified version of the Resident Empowerment through Tourism Scale (RETS), we identified support for tourism development and deconstructed the drivers of this support. The objective was to empirically validate the research instrument and underlying theory in a situation of relative ‘undertourism’ and prospective future growth. The questionnaire collected 2058 responses, and the partial least squares-structural equation modeling (PLS-SEM) results indicated that support for tourism, which was generally high across the seven municipalities, was mainly affected by social, psychological, and political empowerment, with personal economic benefits not playing a significant role. These results show that social exchange theory (SET) as a theoretical basis for potential tourism support has limited validity in currently underdeveloped destinations. Secondly, comparatively speaking, the municipalities with the lowest tourism development were least supportive of tourism growth, with an increase in tourism intensity seemingly leading to increasing support due to a higher awareness of accrued benefits through tourism.

1. Introduction

The effects of tourism as a driver for tourism-led economic growth have a long research history, with the positive relationship between tourism and macro-economic indicators being empirically validated in a multitude of destinations [1]. It is, therefore, unsurprising that various forms of tourism—from urban to cultural and creative tourism—have been strategically adopted across destinations in order to develop local livelihoods, increase employment opportunities, and offer resources toward heritage protection [2,3,4]. While tourism undoubtedly offers opportunities for destinations to grow their economic bases, the strong, continuous rise in tourism that was witnessed prior to the COVID-19 pandemic—and its associated effects on societies and ecosystems—has increasingly received criticism in both the regular press and academic research. The focus has therein been predominantly on well-traveled destinations and on the concept of ‘overtourism’, highlighting the potential unsustainability of the tourism phenomenon, which affects both the local quality of life and the critical resources needed for tourism [5].
Lessons learnt from destinations where tourism has historically been allowed to grow uninhibited—or where careful visitor planning has proved difficult or impossible to implement—have increasingly emphasized the central role of communities in the search for a sustainable balance in tourism development in order to both protect local lifestyles and quality of life and reduce the risk of community backlash against tourists and tourism development [6]. Indeed, the attitudes and consent of local communities are often considered important aspects of indicator systems that help to make or keep tourism development sustainable. For instance, core indicator C1.2 in the European Tourism Indicator System [7] is defined as “percentage of residents who are satisfied with tourism in the destination (per month/season)” and C5.1 as “percentage of residents that are satisfied with the impacts of tourism on the destination’s identity”. In practice, though, these data are often harder to collect on a longitudinal and consistent basis because of their subjective nature and the resources needed to collect them in the first place.
This paper investigates the current conditions of the tourist–cultural sector across seven municipalities in the Scheldeland tourist region of Flanders (Belgium). Currently relatively underdeveloped, one of the strategic goals of the area is to leverage cultural and natural heritage sites as recreational and tourist products in order to boost economic development. In order for such development to occur sustainably, community attitudes were collected in order to (a) identify resident support for tourism in municipalities with current low-to-modest levels of tourism development and (b) deconstruct the drivers of tourism support. The objective herein was to empirically test a simplified version of the Resident Empowerment through Tourism Scale (RETS) [8] in a situation of relative ‘undertourism’ and prospective future growth.
The subsequent part of the paper will first give additional background on the potential of heritage-led development, resident perspectives in tourism development, and the long history of attitudinal studies, leading to the conceptual model on resident support for tourism. Next, the methodology of the paper is presented, with an overview of the case study area, the survey method, and the statistical analysis. Part 3 presents the results of the support for tourism, the perceived positive and negative impacts, and the drivers of residents’ support for tourism. Finally, parts 4 and 5 will provide a discussion and some conclusions to the results.
It is generally accepted that cultural and heritage interests are among the most important reasons for traveling. According to estimates from OECD [9], 40% of international tourists could be deemed cultural tourists, even though such an estimate failed to distinguish between strongly motivated and accidental cultural tourists. The importance of culture as a travel motive is further fueled by the fact that ‘culture’ is an evolving concept that has gradually come to incorporate tangible, immovable heritage; intangible elements such as lifestyles, habits, and gastronomy; and creative activities [10,11]. Changes on the demand side—following the general shift toward an experience and transformative economy—have also seen a growth in experience-oriented tourists, who increasingly seek to immerse themselves in authentic local life and its environment, creating new opportunities for less-traveled destinations [12,13]. Analyzing 20 role models, Egusquiza and colleagues [14] identified different successful, heritage-led rural regeneration models and found that among 33 key resources, the natural landscape, historic assets, and traditions were the main drivers of regeneration processes, ultimately leading to increased jobs and revenues, a more sustainable tourism sector, and improvements in well-being. It was further noted that how, apart from the link between tourism, conservation, and rural regeneration, tourism in natural areas has been seen to increase the physical and mental well-being of visitors [15]. The potential benefits, however, have to be balanced with the development pressures that might arise due to tourism.
General concerns regarding the growth of tourism and its societal, cultural, and ecological impacts have been around since the mid-60s and particularly popularized since the Brundtland Commission’s report in 1987 focused the debate on sustainable development [16,17]. Saarinen [18] offers a particularly relevant overview on how the idea of sustainable development has been adopted in tourism research, both in principle and in operationalization of limits of growth. The author recognizes three main research traditions in discussions on capacity constraints and sustainable development: the resource-based tradition, the activity-based tradition, and the norm-based tradition. The resource-based tradition has its roots in traditional carrying capacity research and in the natural sciences and seeks to identify natural maxima that cannot be violated if a resource is to be protected. Naturally, such a view has traditionally been related to more natural settings whereby impacts are evaluated against an original condition—even though the idea can be applied to social and cultural changes, as well [19]. In stark contrast to the resource-based focus, the activity-based tradition accepts certain resource impacts as inevitable and takes an industry-focused, tourism-centric approach that defines limits to maximum capacities of the economic system. Finally, the community-based tradition takes the middle ground between the two other research traditions by including the participative process as the defining factor. In this view, limits to growth are normatively established in a multi-stakeholder perspective and can be skewed by uneven power relations.
Within tourism, there has been an extensive history of resident attitude studies that fit within the community-based research tradition [20], particularly aimed at shifting the power balance toward local residents through resident empowerment [21]. One of the earliest conceptualizations can be found in Doxey’s Irridex [22], proposing four evolutionary stages of resident perceptions on tourism development: euphoria, apathy, annoyance, and antagonism. According to the author, the critical junction between apathy and annoyance happens at around a point where the numbers of tourists and residents are practically equal, arising in resource conflicts. Further growth, where tourists start to greatly outnumber locals, then leads to a situation of antagonism. A literature review of 140 resident attitude studies [23] found that around 11% of theory-based articles were grounded in the Irridex model, and another 18% adopted the similarly stage-related model of Butler’s Tourism Area Lifecycle. However, these early models have recognized limitations, generally focusing on a single explanatory variable of tourism development and failing to include mediating and moderating personal and contextual indicators. In reality, as found in multiple empirical studies [24,25,26], even in well-developed, mature destinations, the resident population does not react homogeneously to tourism development.
Through a general interest within many studies in explaining the formation of resident attitudes, more recent research has utilized a range of theories from social science such as resistance theory, stakeholder theory, dependency theory, place attachment theory, theory of reasoned action, and social exchange theory (SET) [23]. By far, the most dominant theory has been SET, stipulating residents as rational decision-makers who compare positive and negative impacts in a cost–benefit approach and will support tourism in those cases where the good outweighs the bad. Importantly, SET expands upon traditional economic exchange theory by recognizing heterogeneity of the host community [8]. While widely used, the application of SET within tourism studies has been critiqued on two main grounds: the overreliance on economic factors as drivers for tourism support [27], and the assumption that resident decisions are purely based on personal, not societal, gains [28]. Weber’s theory of formal and substantive rationality (WFSR) has, therefore, been proposed as an extension to traditional SET [8,29]. As a theory to understand the motivations behind a person’s behavior, the sociologist Max Weber argued for two types of rationality: means-end/market-related—formal—rationality, and belief-driven/non-market—substantive—rationality. The former comprised the influence of economic costs and benefits, while the latter included value systems, beliefs, morality, and philosophy [30]. Within the resident attitude literature in tourism, WFSR was formalized and empirically tested by Boley et al. [8] and Strzelecka et al. [31], including personal economic benefits as a formal rationality construct and proposing psychological empowerment, social empowerment, and political empowerment as substantive constructs. It was then postulated that direct economic benefits might cause residents to perceive negative impacts less intensively, emphasize positive impacts more strongly, and, hence, be generally more supportive for tourism development strategies. Furthermore, similar causal relations might exist for psychological empowerment—i.e., the enhancement of community pride and self-esteem, social empowerment—i.e., an increase cohesion and collaboration within the community, and political empowerment—i.e., being fairly represented and included in the decision-making process. In other words, when tourism positively influences the community in such non-economic ways, the effects might similarly lead to a decreased perception of negative impacts, an increased perception of positive impacts, and broader support for tourism in the destination.
Independent of the theoretical lens through which resident attitudes of tourism development are studied, an interesting further line of research relates to the scope of resident reactions in cases where tourism is no longer supported because negative reactions underline the importance of monitoring local situations. Within a primary backcountry recreation context but also relatable to urban environments, both temporal and spatial behavioral adjustments have been observed, with people avoiding certain locations altogether or at particular moments in time [32,33]. This might lead to the gradual creation of tourist bubbles or enclaves which are generally avoided by locals, at times further driven by gentrification [34,35]. In cases where overtourism has led to more severe discomforts and perceived impacts among locals, reactions have even led to anti-tourist movements and social unrest such as the Assembly of Neighbourhoods for Sustainable Tourism and the Network of Southern European Cities against Touristification in Barcelona, Mora rem Lisboa in Lisbon, and No Grande Navi in Venice [36]. Perceived issues with tourism have, at times, also led to the public rejection of any further development initiatives [37].
Based on these views, the theoretical model of this paper is proposed in Figure 1. The model is taken from Boley et al. [8] and proposes to test the construction of support for tourism by local residents through the use of a simplified WFSR framework, hypothesizing 14 relationships:
Hypothesis 1a–d (H1a–d).
Personal economic benefits, psychological empowerment, social empowerment, and political empowerment have a negative relationship with perceived negative impacts of tourism;
Hypothesis 2a–d (H2a–d).
Personal economic benefits, psychological empowerment, social empowerment, and political empowerment have a positive relationship with perceived positive impacts of tourism;
Hypothesis 3a–d (H3a–d).
Personal economic benefits, psychological empowerment, social empowerment, and political empowerment have a positive relationship with support for tourism;
Hypothesis 4 (H4).
Perceived negative impacts of tourism have a negative relationship with support for tourism;
Hypothesis 5 (H5).
Perceived positive impacts of tourism have a positive relationship with support for tourism.

2. Materials and Methods
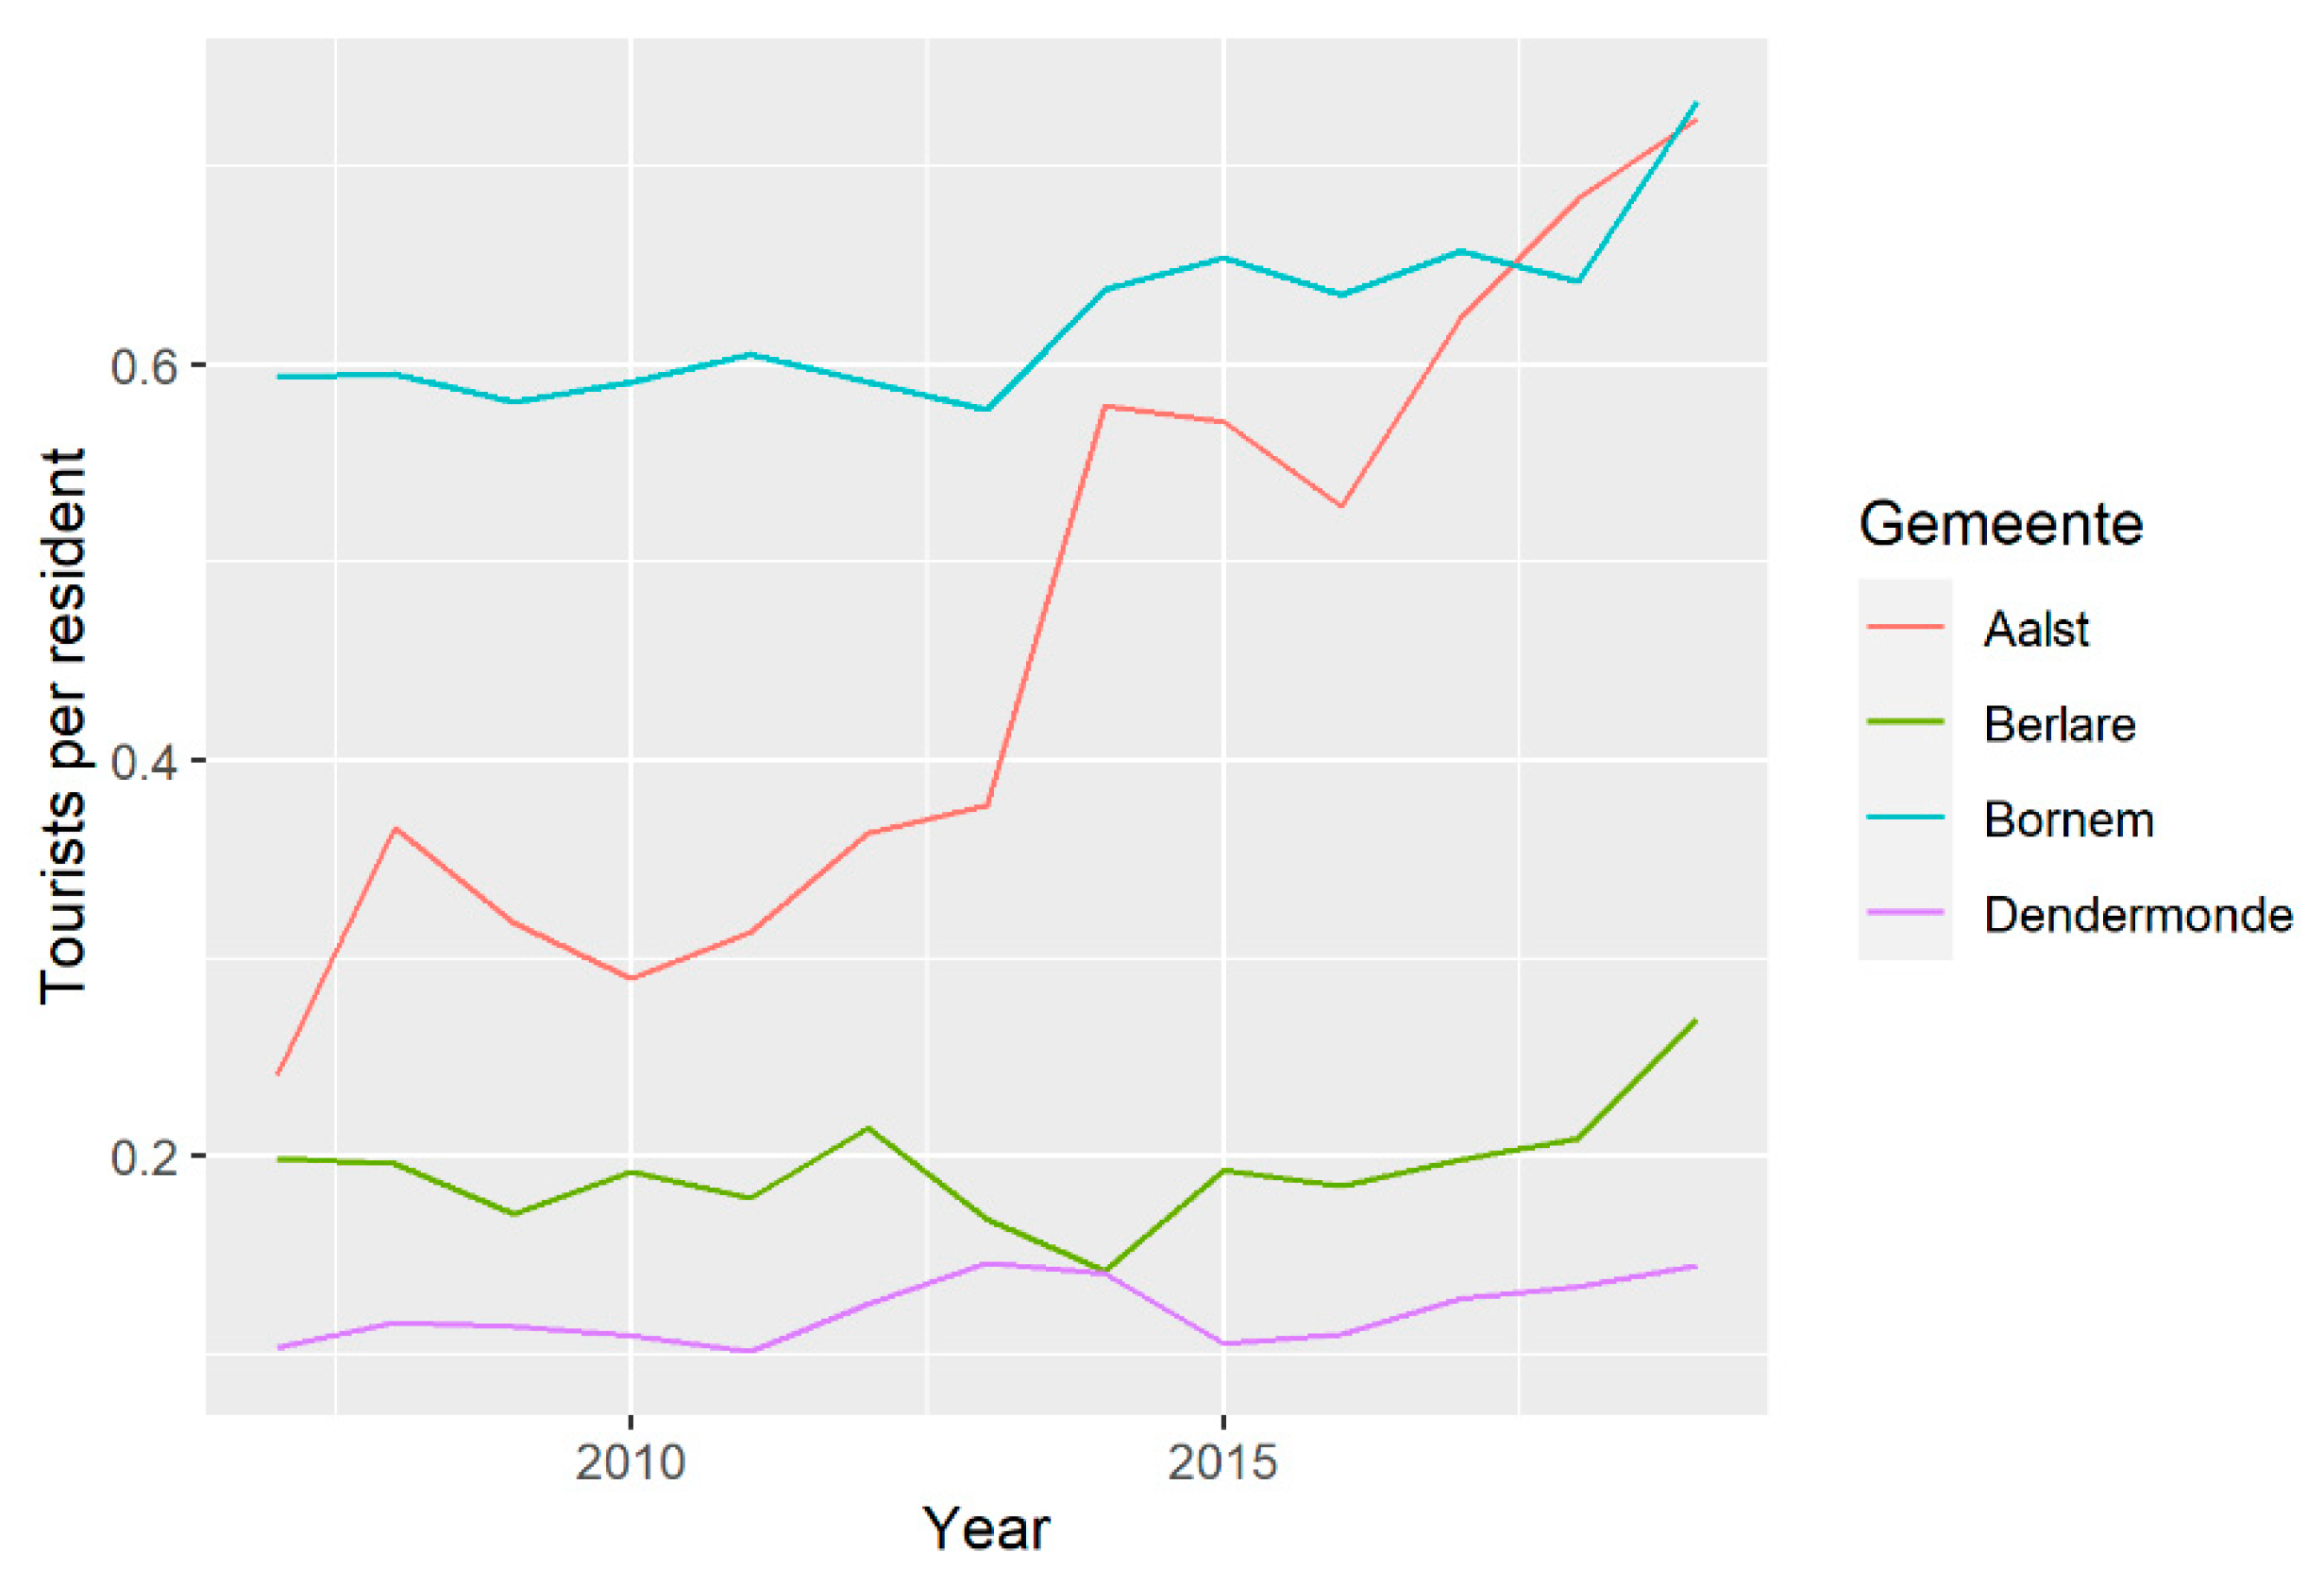
2.1. Study Area

Empirical data was collected in seven study areas in Flanders (Belgium), as seen in Figure 2.: the municipalities of Aalst, Berlare, Bornem, Denderleeuw, Dendermonde, Puurs-Sint-Amands, and Willebroek. Aalst (86,445 inhabitants) and Dendermonde (45,769 inhabitants) are modestly sized cities, while Puurs-Sint-Amands (25,882), Bornem (21,366), Berlare (14,958), Denderleeuw (20,338), and Willebroek (26,462) are more rural communities in the urban fringe. These municipalities are part of the larger tourist region of Scheldeland. This region is located within a triangle connecting the important (tourist) cities of Ghent, Antwerp, and Brussels. Geographically conveniently located in the hinterland of these three cities, the region is nonetheless somewhat lagging in economic development, with a GDP per capita between €24,947 and €26,534 being significantly lower than the Flemish average of €38,317. Focusing on tourism, the seven municipalities accounted for a total of 96,358 known tourist arrivals in 2019, 0.67% of the Flemish total. In comparison, the nearby city of Ghent received 374,702 tourists, while Antwerp accounted for 682,587 tourists and Brussels received 2,519,705 visitors.
Table 1 describes a number of general tourism characteristics: total tourist arrivals; tourists per km2; the ratio of tourists to locals; the number of cultural jobs; jobs in hotels; restaurants, and bars (both scaled per 1000 inhabitants); and the percentage of these tourism-related jobs in total local employment. From the table, we can see that Aalst and Bornem were at a higher level of tourism development than the other five municipalities. Aalst received 62,628 arrivals and had a tourist to local ratio of 0.724, while Bornem received 15,660 arrivals and had a tourist to local ratio of 0.733. Both cases also exhibited stronger employment effects, with tourism contributing respectively 3.71% (in Aalst) and 5.23% (in Bornem) to local employment. At the other end of the scale, we found the municipality of Denderleeuw. Due to a lack of accommodation options, tourist arrivals could not be achieved and could be considered minimal. This was also reflected in tourism’s contribution to local employment, providing just 0.69% of jobs. While indicators such as the tourist-to-local ratio provide a useful comparative overview of the general state of tourism development and have often been linked to the calculation of local carrying capacity, it has to be noted that calculations on a municipal level can lead to misleading conclusions in cases where tourism is strongly concentrated in particular neighborhoods. Considering the characteristics of the municipalities under investigation, this potential zonal issue is less prevalent as in other, often larger, cities but cannot be negated completely given that tourism will always be centered around touristic resources.
Therefore, notwithstanding its advantageous location near main tourist catchment areas, the study region did not receive significant tourist attention at the time. At the same time, the region could bank on some potentially interesting attractions. Following the basins of the Scheldt, Dender, and Rupel rivers, the area offered interesting walking and cycling trails and was littered with distinct historic industrial heritage, a fortress (the Fortress of Liezele, early 20th century), and multiple medieval castles and sites (such as the Castle Marnix de Sainte Aldegonde, originally of the 10th–11th century, and the Belfry of Dendermonde). Moreover, the region hosted a significant number of events, of which the Carnival in Aalst was probably the best known as well as some iconic companies that had ties to tourism and recreation, the famous beer brand Duvel being one of them.
In order to also account for evolutions in tourism development, Figure 3 plots the tourist–resident ratio (thus controlling for size difference) over the 2007–2019 period. Denderleeuw and Willebroek are missing from the figure due to their lack of accommodation options, leading to missing data. For the purpose of this exercise, the number of tourist arrivals in these two municipalities could be considered insignificant. Of the four available municipalities, we could clearly see a strong rise in Aalst, with Bornem exhibiting a relatively stable pattern followed by a slow rise since 2014. In terms of tourist arrivals, Bornem saw an increase of 30.3% between 2007 and 2019, while Aalst saw an increase of 233.9% in this same period. In comparison, both Berlare and Dendermonde—given some modest fluctuations—remained relatively stable in their tourist to local ratio.
With two out of the seven municipalities thus showing a growing trend in tourist arrivals, the impression remains that there is room for more substantial tourism and recreational development in the region, particularly focusing on the cultural and natural heritage sites. The Scheldeland region forms part of the wider Flemish–Dutch Scheldt Delta, which is in the process of acquiring the status of UNESCO Global Geopark, and Rivierpark Scheldevallei, which has applied for recognition as a National Park, has entrances to the park at the Castle Marnix de Sainte Aldegonde in Bornem and Dendermonde. These initiatives might lead to increased exposure of the area, and it was therefore relevant to identify the current local perceptions on potential tourism development.

2.2. Survey Procedure and Questionnaire Layout

The study distributed an online questionnaire, enlisting the support of the regional Destination Management Organization Visit Scheldeland as well as the respective local governments of the participating municipalities. From November 6th to December 8th 2020, a questionnaire link was sent via online and social media channels—primarily Facebook, but also Instagram, Twitter and regular websites—of all these stakeholders. Messages to encourage participation were reposted at least three times to ensure adequate sample selection. In three municipalities—Bornem, Dendermonde, and Denderleeuw—standard posts on social media did not suffice to reach a representative dataset, and prepaid Facebook advertisements were used to increase responses, leading to an additional 50 to 200 new responses per municipality. Ultimately, a total of 2,058 respondents were reached.
The questionnaire itself consisted of socio–demographic characteristics of the respondents and respondents’ attitudes towards tourism. Socio–demographic questions related to age, place of residence, gender, education level, and origin of the respondents. Furthermore, length of residence within the municipality was collected as well as data regarding yearly travel frequency—collected for a ‘normal’ year prior to the Covid-19 pandemic. The core of the study and questionnaire identifying respondents’ attitudes toward tourism was based on a simplified version of the Resident Empowerment through Tourism Scale (RETS) [8]. The scale links four drivers—personal economic benefit, psychological empowerment, social empowerment, and political empowerment—and two mediating variables—negative and positive impacts of tourism—to support for tourism. In the original study, these 7 latent constructs were measured by a total of 37 ordinal measurement items. While the theoretical factorial relationships were maintained, our study simplified the number of scale items measuring each construct, as is summarized in Table 2.
The simplification of answer scales had three main goals: to (a) decrease the response burden for respondents, (b) test a formative conceptual model to simplify modeling needs, and (c) remove unnecessary duplicates for the sake of construct modeling. As an example of the latter, the dimension of ‘personal economic benefits’ was originally measured by 4 Likert scale ordinal items, a relative necessity for reflective factor construction. However, the underlying consideration was quite simple: did people have a (partial) income that is linked to tourism? This was essentially a binary question, which was unnecessarily complicated if measured through multi-item ordinal variables.

2.3. Socio–Demographic Sample Characteristics

Table 3 offers an overview of sample socio–demographics for each individual municipality. When we investigated these details for the total combined sample (n = 2058), we recognized a slight overrepresentation of women (52.9%) as compared to men (46.6%) and people identifying as non-binary (0.5%). The average age across the sample was slightly higher, with respondents between 18 and 34 years comprising 25.0% of the sample, people between 35 and 55 making up the majority with 43.4%, and the age group of 55–80 years represented by 31.6%. A total of 10.1% had at most primary education, with 33.4% having completed secondary education and 56.5% having a higher education degree, signifying a rather highly educated sample of respondents. A majority, 70.7%, were professionally active, while the remaining 29.3% were currently inactive, either being unemployed, studying, or retired.

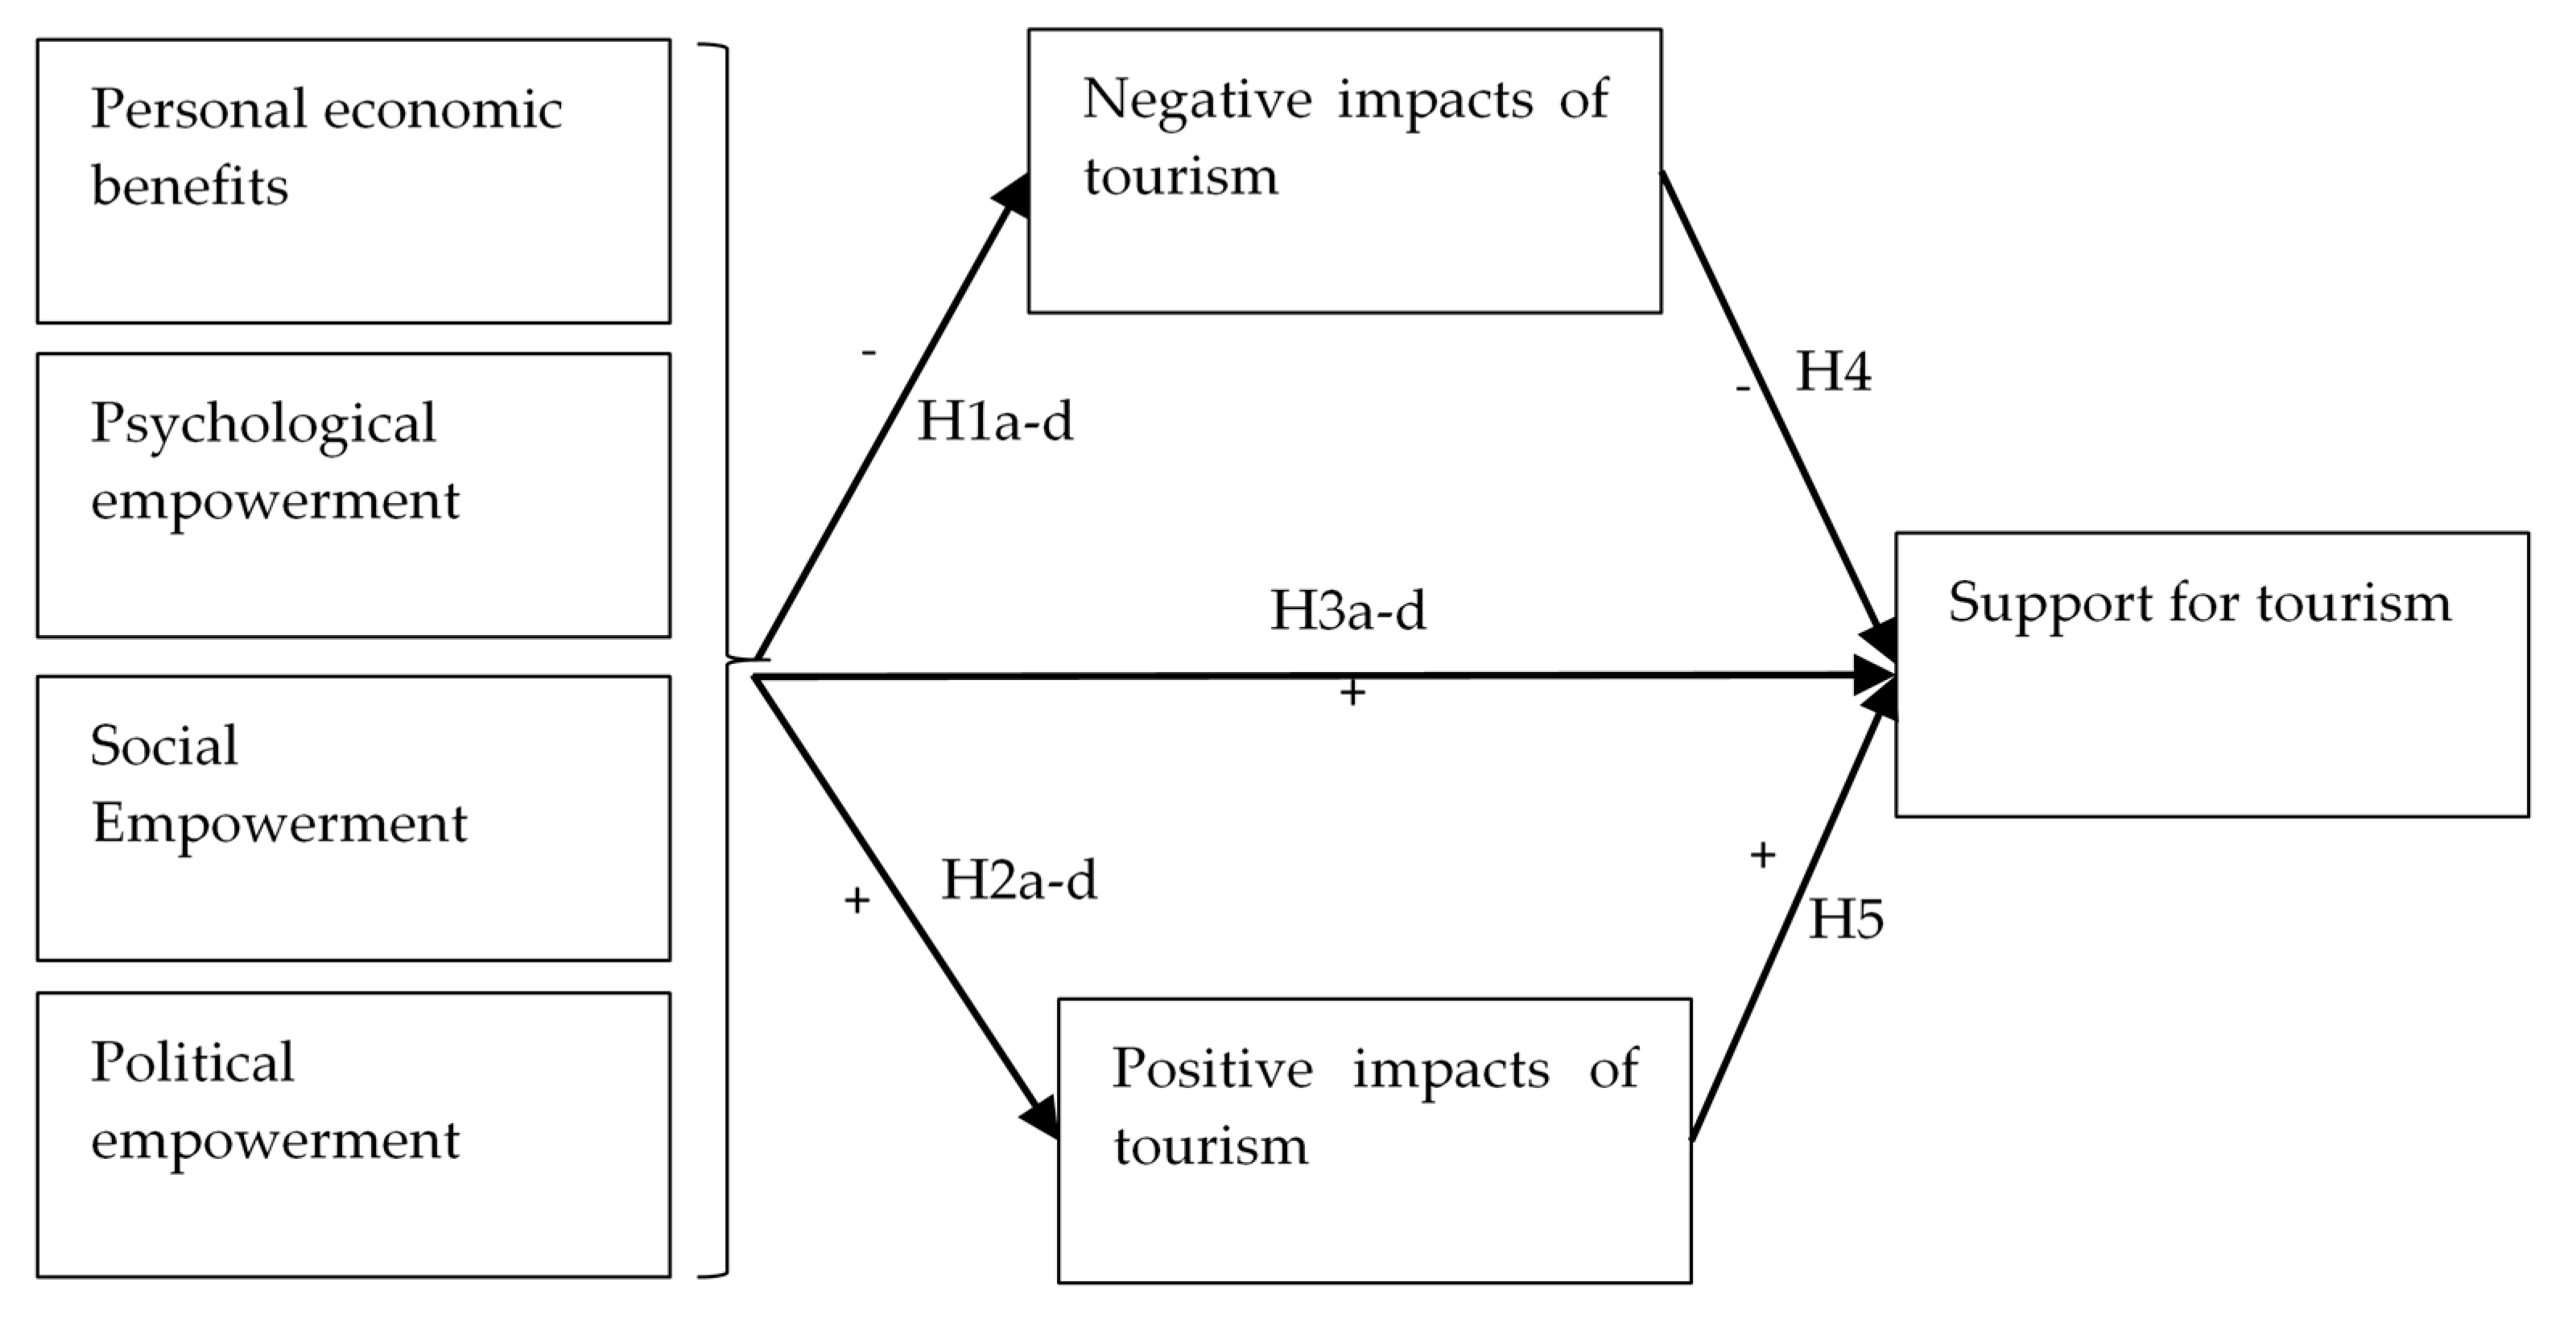
2.4. Statistical Modeling via Partial Least Squares SEM

In order to test the conceptual model of Figure 1 on the effects of perception on tourism support, a structural equation modeling (SEM) approach was followed. More specifically, this paper adopted a partial least squares-based (PLS-SEM) approach rather than the covariance-based (CB-SEM) method. PLS-SEM is preferred in cases where at least part of the structural model is based on formative constructs [42]. Formative constructs have the advantage of potentially including diverse, minimally-correlated items as opposed to CB-SEM, where construct validity requires highly correlated items [43]. The constructs in SEM-PLS should therefore be considered as an index rather than a scale. Four sets of criteria were proposed to inform the choice between formative versus reflective indicators: (a) direction of causality between constructs and indicators, (b) interchangeability, (c) covariance, and (d) similarity in antecedents and consequences [44].
Analyzing these criteria for the specifics of our study—see Table 1 for an overview of constructs and indicators—we could make the argument that indicators within the same construct were not all interchangeable. For instance, under ‘social empowerment’, the question whether ‘tourism creates nice encounters with visitors’ measured a different aspect than ‘tourism ensures that we are more connected to each other in our municipality’, the former being outward-focused toward the visitor and the latter being inward-focused toward the community. Similarly, indicators could have different antecedents. Under ‘negative impacts of tourism’, aspects that increased the cost of living in a neighborhood were not often related to traffic issues. As a result, these indicators could combine to form a higher-level construct in an additive fashion rather than being observed from a common, unique underlying factor.
Choosing a PLS-SEM approach, it is important to note that the methodology aims at maximizing explained variance of a dependent variable or construct, therefore being more akin to a multivariate regression with latent variables [45]. PLS-SEM consists of two components: the inner—or structural—model, and the outer—or measurement—model. The inner model is comparable to a regular regression analysis and investigates causal relationships between the constructs, written as:
ε j = β 0 j + q : ε q ε j β q j ε q + ξ j
where εj (j = 1, …, J) are the endogenous latent variables—i.e. the seven latent constructs mentioned in Table 1. βqj is the generic path coefficient between the exogenous latent variable q and its endogenous (or explanatory) latent variables j. For instance, following the conceptual model of Figure 1, ‘personal economic benefits’, ‘psychological empowerment’, ‘social empowerment’, and ‘political empowerment’ were explanatory variables of the constructs ‘negative impacts of tourism’ and ‘positive impacts of tourism’, while all six of these constructs could be considered explanatory for the dependent variable ‘support for tourism’. Finally, ξj is the error term.
The outer model focuses on the relationships between the observed indicators and their latent constructs and in the case of formative constructs are called outer loadings, as opposed to outer weights, for reflective constructs. Because a formative model does not assume homogeneity or unidimensionality, it can be represented by the function:
ε q = p = 1 p q ω p q x p q + δ q
where ωpq represents the coefficient of each indicator on its respective latent construct q, and the error term σq represents the random part of the latent construct not accounted for by the measured indicators. The conceptual model was estimated with the semPLS-package in R 3.4.0 [46].

3. Results

3.1. Perceived Impacts and Local Tourism Support

Table 4 analyses the study results of the resident survey by simple descriptive statistics per item. Two general patterns seemed to emerge: (a) negative impacts were generally perceived to be less common than positive impacts, the latter receiving higher average scores across the items; and (b) Denderleeuw and Willebroek generally scored lower in both negative and positive impact perceptions.
In terms of negative impacts, on average across all seven municipalities, the effect of tourism on traffic issues (NEG2) scored highest, with a mean of 2.91, followed by an increased cost of living due to tourism (NEG1), with a mean of 2.90. Both problems seemed to be comparatively more recognized in Aalst, Berlare, and Bornem. Importantly, residents did not generally feel limited in their comfort due to visitors (NEG3, mean = 2.44) or perceive tourists as a nuisance (NEG4, mean = 2.15).
At the other end of the spectrum, the most-recognized positive effect of tourism was its contribution to the improvement of the physical appearance of the municipality (POS1), scoring 3.49 across the full sample and relatively important in each of the 7 individual municipalities. Other high-scoring factors were increased liveliness (POS6, mean = 3.38), improvements in quality of life (POS3, mean = 3.28), and improvements in the standard of living (POS4, mean = 3.20). Effects that were somewhat less perceived were the proper maintenance of the tourism infrastructure (POS5, mean = 3.06)—which might, in itself, have less of an effect on local residents—and the increase in shopping and recreational opportunities through tourism (POS2, mean = 2.88). This last item only scored relatively high in Aalst, a larger city.
Given the fact that positive impacts seemed to outweigh the negative aspects of tourism in the perception of respondents, we might have expected moderately high levels of support for tourism. We indeed saw confirmation of this hypothesis, with respondents generally agreeing that the positive benefits of tourism outweighed any negative impacts (SUP1, mean = 3.47). The residents in the seven municipalities supported tourism (SUP2, mean = 3.88) and liked remaining a tourism destination (SUP3, mean = 3.93). Furthermore, there was strong support for the further promotion of tourism (SUP4, mean = 4.01), indicating that respondents still saw a margin for the sustainable growth of tourism. Similar to the observations on positive and negative impacts, Denderleeuw and Willebroek registered somewhat lower average scores on support for tourism. One caveat that has to be noted is that ‘support for tourism’ is a quite generic statement that makes abstraction of the fact that tourism development can take a multitude of forms, ranging from a sustainable, slow-growth model grounded in local culture with respect for the environment to large-scale development projects that significantly alter the fabric of the community. The level of support noted here in Table 4 should therefore primarily be seen as supportive to the current state and similar future development, but cannot be seen as an approval for all sorts of tourism projects.
As could be learned from these results, residents within the seven municipalities perceived more positive than negative impacts of tourism and there was, in general, relatively strong support for the further development of tourism.

3.2. Deconstructing Resident Attitudes towards Tourism

The previous paragraph indicates general positive attitudes towards tourism, driven by recognized positive effects and a limited amount of negative externalities. We therefore already implicitly hypothesized that positive impacts positively affected support while negative impacts detracted from the local support for tourism. Next, we tried to explicitly model this relationship via PLS-SEM, also introducing the effects of personal economic benefits, psychological empowerment, social empowerment, and political empowerment into the model. This paragraph therefore served as the validation of the simplified RETS model [8] and research hypotheses H1a-d, H2a-d, H3a-d, H4, and H5. The model was run on the combined data of all seven municipalities.
First of all, the measurement, or outer, model evaluated the contribution of individual items to their formative constructs, as found in Table 5. Given that indicators of constructs could potentially be independent and were assumed to be error-free, traditional quality criteria from CB-SEM literature could not be used and instead, Hair et al. [42] suggested using indicator weights as a measure of relative importance and loadings as measure of absolute importance, testing their significance via a bootstrapping approach. Furthermore, there was a need to check for multicollinearity and potential cross-loadings across factors [43]. Ultimately, the decision whether to retain particular indicators needed to be based on an integral analysis of weights, of loadings (including cross-loadings), of significance levels, and of theoretical insights.
With one exception for item SUP3 (VIF = 5.091), all items had a variance inflation factor (VIF) less than 5. In order to estimate a 95% confidence interval, a 500-sample bootstrap was used. Two out of 21 indicators (NEG3, NEG4) combined relatively small loadings with non-significant weights. Cross-loading was not a problem for any of the indicators. Given that NEG3 and NEG4 were theoretically important elements of potentially negative impacts, and no cross-loadings or multicollinearity issues occurred, we decided to include all items for further analysis of the structural model.
The loadings of the outer model were then used to construct latent factors, for which structural relations were tested. This analysis, the inner model, allowed for a discussion on contributing factors to local support for tourism. The model included both direct and indirect effects, as can be seen in Figure 1. For the indirect effects, positive and negative impacts of tourism acted as mediators between personal economic benefits, psychological empowerment, social empowerment, and political empowerment on the one hand and support for tourism on the other hand.
Table 6 focuses on direct effects and supports 7 out of 14 hypotheses. First of all, there was one significant negative direct effect between social empowerment and negative impacts of tourism (H1c; −0.083), meaning that respondents who felt more socially empowered were less likely to perceive negative impacts of tourism. Furthermore, there were three significant positive direct effects between psychological empowerment (H2b; 0.312), social empowerment (H2c; 0.327), and political empowerment (H2d; 0.159) on the positive impacts of tourism. Supporting the hypotheses, people who felt more strongly empowered on these dimensions likely perceived stronger benefits of tourism. Finally, there were three dimensions that significantly explained local support for tourism: people who experienced strong psychological empowerment (H3b; 0.287) and respondents who perceived more positive impacts of tourism (H5; 0.384) were more likely to support tourism, while respondents who perceived more negative impacts (H4; −0.232) were less likely to show support for local tourism development. Interestingly, whether or not people had personal economic benefits from tourism did not seem to matter in terms of being supportive or experiencing more positive or less negative impacts. The findings, therefore, did not support basic SET and seemed to imply that non-economic effects of tourism could act as stronger determinants in the tourist exchange rather than a purely economic rationale.
To complete the conceptual model regarding the indirect effects of personal economic benefits, psychological empowerment, social empowerment, and political empowerment—via the positive and negative impacts of tourism acting as mediators—the procedure suggested by Nitzl et al. [47] was followed in order to test significance of the indirect paths through the 500 bootstrapped estimates. The personal economic benefits neither had a direct, nor an indirect effect. Political empowerment had a significant positive indirect effect on the support for tourism via positive impacts of tourism (0.061). Therefore, while political empowerment did not directly affect support for tourism, there was still a noticeable indirect effect present. Social empowerment had significant indirect effects via both negative impacts (0.017) and positive impacts (0.120). Similar observations could be made for social empowerment, which had a significant indirect effect via both negative (0.019) and positive impacts (0.125). In both these cases, the indirect effects via the perception of positive contributions to tourism were markedly stronger, leading to positive total effects on the support for tourism.

4. Discussion

As could be deduced from Table 1, the seven Flemish municipalities included in this study are still at the earlier stages of tourism development, whereby even the comparatively strong growth destinations of Aalst and Bornem lag behind more mature destinations elsewhere in Flanders. Potentially as a result of this situation, we found what seemed to be a positive relationship between tourist pressure/intensity and the support for tourism whereby, combining the findings of Table 1 and Table 2, the touristically less developed municipalities of Denderleeuw (SUP1 = 3.06; SUP2 = 3.55) and Willebroek (SUP1 = 3.07; SUP2 = 3.69) registered somewhat lower average scores on support for tourism. This might be due to the fact that tourism had not been developed enough to register significant local positive effects, adding to the uncertainty of potential benefits. In contrast, the developing destinations of Aalst (SUP1 = 3.59; SUP2 = 3.94) and Bornem (SUP1 = 3.62; SUP2 = 3.97), where tourist arrivals and the tourist–resident ratio had been growing, showed the highest general support. These findings complemented the results found by Liu and Li [48] that residents who perceived tourism to be in a development stage more strongly agreed on the beneficial employment and cultural effects, while respondents who viewed a destination as being in an early stage of tourism development showed more concern about environmental pollution and other associated negative impacts. We might thus expect this relationship to follow a curvature similar to Butler’s Tourism Area Lifecycle model. whereby support for tourism development in destinations at early stages of the lifecycle—such as Denderleeuw and Willebroek—is more modest, eventually exponentially increasing with growth in development and associated benefits—such as Aalst and Bornem. Ultimately, we would then expect this relationship to become concave, whereby additional development over and above a certain capacity limit might detract from tourism support—as in the case of destinations that had been suffering from overtourism prior to the COVID-19 outbreak. Within the seven municipalities, this critical point has not been reached and there seems to be potential for tourism to sustainably contribute to local quality of life. It is, therefore, important to note that resident attitude surveys in tourism destinations need to pay sufficient attention to both attitudes and perceptions as objective local effects because lower support for tourism might originate from underdevelopment as much as from overdevelopment.
Results of the analysis on support for tourism have to be treated with some caution, however. Tourism development can take many forms, and the results do not allow distinguishing between the types of development that are supported by the local community. It seems reasonable to assume that respondents reflect on future development through their historic understanding and therefore see this future in light of the situation ‘as is’. Results could potentially be very different if the study gauged support for a specific development project with clearer and larger impacts.
With regard to the drivers of tourism support, somewhat surprisingly, notwithstanding the longstanding theories behind SET, no relationships between personal economic benefits and support for tourism were statistically supported. This might potentially result from the simplification of the answer scale, uniquely measuring the tourist contribution to personal income. Looking at the patterns between the individual municipality data of Table 1 and their respective scores on tourism support indicators in Table 2, there did seem to be a—albeit non-statistical—relationship between the level of economic dependence on tourism and the support for tourism, whereby the more touristic areas of Aalst and Bornem—with between 3.5 and 5.5% of the workforce linked to tourism—had comparatively more positive sentiments towards tourism than the municipalities where a relatively small amount of employment was supported through tourism. This relationship was, however, not uncovered from the perspectives of individual respondents. The lack of effects of the economic dimension was similar to the results of Strzelecka et al. [31], who similarly focused on a lesser-developed rural region. In that case, as well, tourism support was driven by psychological empowerment, not by a rational economical transaction.
The three factors covering substantive rationality were more impactful in contribution to local support for tourism. Particularly for destinations similar to the studied municipalities, where tourism is currently not a large contributor to the economy—with a percentage of total employment attributable to tourism between 0.69% and 5.23%—these findings are of importance. It appears that residents can already be motivated and supportive of tourism, not through economic incentives, but through cultural pride and social networks. It also entails that, for currently less developed destinations, an application of SET—as has been the historically most-prevalent theoretical model—might fail to understand the existing basis of resident support for tourism.
For Scheldeland, in particular, the results mean that local residents could therefore act as stewards and local ambassadors, with initiatives such as the potential UNESCO Global Geopark or National Park Rivierpark Scheldevallei potentially adding to the general quality of life of its citizens. Such support is then not only linked to representatives of the tourism sector (i.e., employees of tourist enterprises), but is shared more generally in the community. This might, in turn, improve visitor satisfaction because contacts with local members of the community form an important factor in the quality of the tourist experience.

5. Conclusions

For reasons that were already mentioned before, local residents and entrepreneurs have been given a prominent role in many tourism development strategies that aim to be sustainable. Understanding the attitude of residents and entrepreneurs with respect to tourism development has thus become an essential ingredient of concretizing their role in the tourism development process. The objective of this paper was to study the level of support for tourism development and the drivers for such support among locals in seven municipalities in the Scheldeland Region in Flanders, Belgium using the RETS model. The Scheldeland Region has been touched only marginally by tourism development, but certainly needs a boost to its rather-weak economic base compared to the rest of Flanders. Tourism might very well provide this decisive boost because the Scheldeland not only seems to have enough critical mass in its offer of natural and cultural tourism products, but it is also strategically located in the Antwerp, Brussels, and Ghent triangle and close enough to the city of Bruges.
As noted by Egusquiza et al. [15] in their comparative study on heritage-led rural regeneration, natural landscape, historic assets, and traditions were primary drivers for success in their case studies, closely followed by human resources, traditional skills, agriculture, and local products. Considering the characteristics of the Scheldeland municipalities with their combination of a river landscape, castles, and fortresses as well as some typical local food products such as asparagus and a variety of beers, there seems to be an important opportunity for sectoral linkages. This will be important in order to support development that respects the resource base and leads to a balanced region whereby tourism can be one factor of a diversified local economy contributing to the well-being of locals. Right now, the role of tourism in local employment is rather modest—with an average of 2.62%. In comparison, in 2019, the average contribution of tourism to salaried employment for the entirety of Flanders was 5.22%. As such, particularly in Scheldeland, there ought to be room for sustainable growth without leading to crowding out effects in other sectors.
The positive attitudes of the locals of the seven municipalities involved in the study regarding further development of tourism in general, and in particular, investing more strongly in the Region’s tourism offer and intensifying tourism marketing efforts, is clearly an invitation for the agencies that are involved in tourism development at various territorial levels to strengthen their current efforts. Given the fact that the study concerns a relatively underdeveloped area of Flanders in terms of tourism development, the risk that these efforts will lead to an excessive exposure of the Scheldeland Region to tourism is therefore remote. Moreover, the strong and positive relationship between the attitude and the different types of empowerment of the locals should be embedded explicitly in the governance structure of the tourism development strategy. Today, this is not always the case. Especially in the future, particularly if tourism pressure is expected to increase, and negative feelings toward tourism might, as a result, grow in importance, locals ought to be involved in the tourism development strategy of the Scheldeland Region. Only when this particular challenge is dealt with in an explicit and strong manner will the efforts to develop the Scheldeland Region touristically lead to a stronger economic base, a better quality of life, and a significantly improved quality of the experience of the Region’s visitors.
On a methodological note, an area for further research pertains to the integration of attitudinal data with more objective, quantitative data on the state of the destination, particularly via a multilevel modeling approach. This is important considering the effects of both under- and overdevelopment on tourism support and to also improve model complexity by integrating macro-economic, tourism-related factors rather than pure personal benefits and perceptions. Such analysis might also help to understand the link—or sometimes lack thereof—between reality and perception because there is some anecdotal evidence of more negative perceptions on tourism development, particularly in the earlier stages, potentially driven by media attention more than by the actual state of the local destination. This would, however, require a larger cross-sectional and/or longitudinal dataset.

Author Contributions

Conceptualization and statistical analysis, B.N.; methodology, B.N. and S.K.; investigation, S.K.; writing—original draft preparation, B.N., S.K. and J.v.d.B. All authors have read and agreed to the published version of the manuscript.

Funding

This article is based on research done in the context of the SmartCulTour project that has received funding from the European Union’s Horizon 2020 Research and Innovation Programme under grant agreement No. 870708. The authors of the article are solely responsible for the information, denominations, and opinions contained in it, which do not necessarily express the point of view of all the project partners and do not commit them.

Institutional Review Board Statement

The study was conducted according to the guidelines of the Declaration of Helsinki, and approved by the Institutional Review Board of Lapland University Consortium (on 29/05/2020).

Informed Consent Statement

Informed consent was obtained from all subjects involved in the study.

Data Availability Statement

The data presented in this study are openly available in Zenodo at 10.5281/zenodo.4993486 (accessed on 10 May 2021).

Conflicts of Interest

The authors declare no conflict of interest.

References

  1. Brida, J.G.; Cortes-Jimenez, I.; Pulina, M. Has the tourism-led growth hypothesis been validated? A literature review. Curr. Issues Tour. 2016, 19, 394–430. [Google Scholar] [CrossRef]
  2. Pourzakarya, M.; Bahramjerdi, S.F.N. Towards developing a cultural and creative quarter: Culture-led regeneration of the historical district of Rasht Great Bazaar, Iran. Land Use Policy 2019, 89, 104218. [Google Scholar] [CrossRef]
  3. Rogerson, C.M. Urban tourism, economic regeneration and inclusion: Evidence from South Africa. Local Econ. J. Local Econ. Policy Unit 2012, 28, 188–202. [Google Scholar] [CrossRef]
  4. Wise, N.; Jimura, T. Tourism, Cultural Heritage and Urban Regeneration: Changing Spaces in Historical Places; Springer International Publishing: Cham, Switzerland, 2020. [Google Scholar]
  5. Dodds, R.; Butler, R. Overtourism: Issues, Realities and Solutions; De Gruyter: Berlin, Germany, 2019. [Google Scholar]
  6. Deery, M.; Jago, L.; Fredline, L. Rethinking social impacts of tourism research: A new research agenda. Tour. Manag. 2012, 33, 64–73. [Google Scholar] [CrossRef]
  7. European Commission. ETIS toolkit for sustainable destination management. In The European Tourism Indicator System; European Commission Publication Office: Brussels, Belgium, 2016. [Google Scholar]
  8. Boley, B.B.; McGehee, N.G.; Perdue, R.R.; Long, P. Empowerment and resident attitudes toward tourism: Strengthening the theoretical foundation through a Weberian lens. Ann. Tour. Res. 2014, 49, 33–50. [Google Scholar] [CrossRef]
  9. OECD. The Impact of Culture on Tourism; Organisation of Economic Co-operation and Development: Paris, France, 2009. [Google Scholar]
  10. Richards, G. Creativity and tourism. Ann. Tour. Res. 2011, 38, 1225–1253. [Google Scholar] [CrossRef]
  11. Richards, G. Cultural tourism: A review of recent research and trends. J. Hosp. Tour. Manag. 2018, 36, 12–21. [Google Scholar] [CrossRef]
  12. Timothy, D.J. Contemporary Cultural Heritage and Tourism: Development Issues and Emerging Trends. Public Archaeol. 2014, 13, 30–47. [Google Scholar] [CrossRef]
  13. Maitland, R. Everyday Tourism in a World Tourism City: Getting backstage in London. Asian J. Behav. Stud. 2016, 1, 13. [Google Scholar] [CrossRef] [Green Version]
  14. Egusquiza, A.; Zubiaga, M.; Gandini, A.; de Luca, C.; Tondelli, S. Systemic Innovation Areas for Heritage-Led Rural Regeneration: A Multilevel Repository of Best Practices. Sustainability 2021, 13, 5069. [Google Scholar] [CrossRef]
  15. Job, H.; Becken, S.; Lane, B. Protected Areas in a neoliberal world and the role of tourism in supporting conservation and sustainable development: An assessment of strategic planning, zoning, impact monitoring, and tourism management at natural World Heritage Sites. J. Sustain. Tour. 2017, 25, 1697–1718. [Google Scholar] [CrossRef]
  16. Mihalic, T. Conceptualising overtourism: A sustainability approach. Ann. Tour. Res. 2020, 84, 103025. [Google Scholar] [CrossRef]
  17. WCED. Our Common Future; Oxford University Press: Oxford, UK, 1987.
  18. Saarinen, J. Traditions of sustainability in tourism studies. Ann. Tour. Res. 2006, 33, 1121–1140. [Google Scholar] [CrossRef]
  19. Bertocchi, D.; Camatti, N.; Giove, S.; van der Borg, J. Venice and Overtourism: Simulating Sustainable Development Scenarios through a Tourism Carrying Capacity Model. Sustainability 2020, 12, 512. [Google Scholar] [CrossRef] [Green Version]
  20. Nunkoo, R.; Ramkissoon, H. Applying the means-end chain theory and the laddering technique to the study of host attitudes to tourism. J. Sustain. Tour. 2009, 17, 337–355. [Google Scholar] [CrossRef]
  21. Cole, S. Information and Empowerment: The Keys to Achieving Sustainable Tourism. J. Sustain. Tour. 2006, 14, 629–644. [Google Scholar] [CrossRef]
  22. Doxey, G.V. A causation theory of visitor resident irritants: Methodology and research inferences. In Proceedings of the 6th Annual Conference Proceedings of the Travel Research Association, San Diego, CA, USA, 8–11 September 1975; Travel Research Association, Ed.: New York, NY, USA, 1975; pp. 195–198. [Google Scholar]
  23. Nunkoo, R.; Smith, S.L.J.; Ramkissoon, H. Residents’ attitudes to tourism: A longitudinal study of 140 articles from 1984–2010. J. Sustain. Tour. 2013, 21, 5–25. [Google Scholar] [CrossRef]
  24. Snaith, T.; Haley, A. Residents’ opinions of tourism development in the historic city of York, England. Tour. Manag. 1999, 20, 595–603. [Google Scholar] [CrossRef]
  25. Pérez, E.A.; Nadal, J.R. Host community perceptions a cluster analysis. Ann. Tour. Res. 2005, 32, 925–941. [Google Scholar] [CrossRef]
  26. Pavlić, I.; Portolan, A.; Puh, B. Segmenting local residents by perceptions of tourism impacts in an urban World Heritage Site: The case of Dubrovnik. J. Heritage Tour. 2019, 15, 398–409. [Google Scholar] [CrossRef]
  27. Woosnam, K.M.; Norman, W.C.; Ying, T. Exploring the Theoretical Framework of Emotional Solidarity between Residents and Tourists. J. Travel Res. 2009, 48, 245–258. [Google Scholar] [CrossRef] [Green Version]
  28. McGehee, N.G.; Andereck, K.L. Factors Predicting Rural Residents’ Support of Tourism. J. Travel Res. 2004, 43, 131–140. [Google Scholar] [CrossRef]
  29. Andereck, K.L.; Valentine, K.M.; Knopf, R.C.; Vogt, C.A. Residents’ perceptions of community tourism impacts. Ann. Tour. Res. 2005, 32, 1056–1076. [Google Scholar] [CrossRef]
  30. Kalberg, S. Max Weber’s Types of Rationality: Cornerstones for the Analysis of Rationalization Processes in History. Am. J. Sociol. 1980, 85, 1145–1179. [Google Scholar] [CrossRef] [Green Version]
  31. Strzelecka, M.; Boley, B.B.; Strzelecka, C. Empowerment and resident support for tourism in rural Central and Eastern Europe (CEE): The case of Pomerania, Poland. J. Sustain. Tour. 2017, 25, 554–572. [Google Scholar] [CrossRef]
  32. Fleishman, L.; Feitelson, E.; Salomon, I. Behavioral Adaptations to Crowding Disturbance: Evidence from Nature Reserves in Israel. Leis. Sci. 2007, 29, 37–52. [Google Scholar] [CrossRef]
  33. Namberger, P.; Jackisch, S.; Schmude, J.; Karl, M. Overcrowding, Overtourism and Local Level Disturbance: How Much Can Munich Handle? Tour. Plan. Dev. 2019, 16, 452–472. [Google Scholar] [CrossRef]
  34. Jaakson, R. Beyond the Tourist Bubble? Cruiseship Passengers in Port. Ann. Tour. Res. 2004, 31, 44–60. [Google Scholar] [CrossRef]
  35. Ioannides, D.; Röslmaier, M.; Van Der Zee, E. Airbnb as an instigator of ‘tourism bubble’ expansion in Utrecht’s Lombok neighbourhood. Tour. Geogr. 2019, 21, 822–840. [Google Scholar] [CrossRef] [Green Version]
  36. Frey, B.S. Overcoming Overtourism. Creating Revived Originals; Springer: Cham, Switzerland, 2021. [Google Scholar]
  37. Smith, M.K.; Sziva, I.P.; Olt, G. Overtourism and Resident Resistance in Budapest. Tour. Plan. Dev. 2019, 16, 376–392. [Google Scholar] [CrossRef]
  38. Toerisme Vlaanderen. Toerisme in Cijfers (Gegevens Verblijfstoerisme). Available online: https://www.toerismevlaanderen.be/toerisme-cijfers-gegevens-verblijfstoerisme (accessed on 10 May 2021).
  39. Statistiek Vlaanderen. Tewerkstelling in de Culturele en Creatieve Sector. Available online: https://vorigeversie.gemeente-stadsmonitor.be/tewerkstelling-in-de-culturele-en-creatieve-sector (accessed on 10 May 2021).
  40. Guidea. Available online: https://www.guidea.be/Statistieken (accessed on 10 May 2021).
  41. Statbel. Bevolingsdichtheid. Available online: https://statbel.fgov.be/nl/themas/bevolking/bevolkingsdichtheid#figures (accessed on 10 May 2021).
  42. Hair, J.F.; Ringle, C.M.; Sarstedt, M. PLS-SEM: Indeed a Silver Bullet. J. Mark. Theory Pr. 2011, 19, 139–152. [Google Scholar] [CrossRef]
  43. Cenfetelli, R.T.; Bassellier, G. Interpretation of Formative Measurement in Information Systems Research. MIS Q. 2009, 33, 689. [Google Scholar] [CrossRef]
  44. Jarvis, C.B.; MacKenzie, S.B.; Podsakoff, P.M. A Critical Review of Construct Indicators and Measurement Model Misspecification in Marketing and Consumer Research. J. Consum. Res. 2003, 30, 199–218. [Google Scholar] [CrossRef]
  45. Vinzi, V.E.; Chin, W.W.; Henseler, J.; Wang, H. Handbook of Partial Least Squares: Concepts, Methods and Applications; Springer: Berlin, Germany, 2010. [Google Scholar]
  46. Monecke, A.; Leisch, F. semPLS: Structural Equation Modeling Using Partial Least Squares. J. Stat. Softw. 2012, 48, 1–32. [Google Scholar] [CrossRef] [Green Version]
  47. Nitzl, C.; Roldan, J.L.; Cepeda, G. Mediation analysis in partial least squares path modeling: Helping Researchers Discuss more Sophisticated Models. Ind. Manag. Data Syst. 2016, 116, 1849–1864. [Google Scholar] [CrossRef]
  48. Liu, X.; Li, J. Host Perceptions of Tourism Impact and Stage of Destination Development in a Developing Country. Sustainability 2018, 10, 2300. [Google Scholar] [CrossRef] [Green Version]
Figure 1. Conceptual model based on the Resident Empowerment Through Tourism Scale. (Reprinted with permission from ref. [8]. Copyright 2014 Elsevier.)
Sustainability 13 06934 g001
Figure 2. Map of research area.
Sustainability 13 06934 g002
Figure 3. Evolution in tourism intensity (2007–2019). Source: Statbel [41], Toerisme Vlaanderen [38].
Sustainability 13 06934 g003
Table 1. General tourism characteristics of seven municipalities.
MunicipalityTotal Number of Tourist Arrivals (2019)Daily Number of Tourists per km2 (2019)Ratio of Tourists to Locals (2019)Number of Cultural Jobs per 1000 Population (2018)Number of Jobs in Hotels, Restaurants, and Bars per 1000 Inhabitants (2018)% of Cultural Jobs and Jobs in Hotels, Restaurants, and Bars in Total Employment (2018)
Aalst62,62821950.724424712.0523.71%
Berlare40200.2910.2690.94378121.89%
Bornem15,6600.9380.73313.64110.2435.23%
DenderleeuwNANANA134417430.69%
Dendermonde66320.3260.145354765902.26%
Puurs-Sint-Amands74180.4150.287192865561.83%
WillebroekNANANA572058732.74%
Source: Toerisme Vlaanderen [38], Statistiek Vlaanderen [39], Guidea [40].
Table 2. Measurement items included in questionnaire.
Latent ConstructItems in RETSItems in SurveyQuestions (Measurement Level)
Personal economic benefits41ECO1. Is part of your (family) income linked to tourism in … ? (binary)
Psychological empowerment53PSY1. I consider … as a tourist destination. (ordinal)
PSY2. Tourism makes me proud to be a resident of … (ordinal)
PSY3. Tourism makes me want to tell others about what we have to offer in … (ordinal)
Social empowerment32SOC1. Tourism creates nice encounters with visitors (ordinal)
SOC2. Tourism ensures that we are more connected to each other in our municipality (ordinal)
Political empowerment42POL1. I can be heard in my ideas about tourism development in … (ordinal)
POL2. I have an outlet where I can share my concerns about the tourism development in … (ordinal)
Negative impacts of tourism64NEG1. Tourism results in an increase of the cost of living in … (ordinal)
NEG2. Because of tourism there are more traffic issues in … (ordinal)
NEG3. In some districts I feel limited in my comfort because of tourists (ordinal)
NEG4. Tourists in … are a nuisance (ordinal)
Positive impacts of tourism106POS1. Tourism development improves the physical appearance of … (restoration of historical buildings, maintenance and development of parks, streets and squares, etc.) (ordinal)
POS2. Tourism offers more shopping and recreational opportunities (ordinal)
POS3. Tourism improves the quality of life in … (ordinal)
POS4. Tourism improves the standard of living in … (ordinal)
POS5. The tourist infrastructure of … is well-maintained (ordinal)
POS6. Tourism brings more liveliness in my municipality (ordinal)
Support for tourism54SUP1. In general, the positive benefits of tourism in … outweigh the negative impacts (ordinal)
SUP2. I support tourism and want to see it remain important in … (ordinal)
SUP3. … should remain a tourist destination (ordinal)
SUP4. … should support the promotion of tourism (ordinal)
RETS: Resident Empowerment Through Tourism Scale.
Table 3. Descriptive statistics of socio–demographic data for the seven municipalities.
Aalst
n = 420
(Valid %)
Berlare
n = 216
(Valid %)
Bornem
n = 235
(Valid %)
Denderleeuw
n = 186
(Valid %)
Dendermonde
n = 343
(Valid %)
Puurs-Sint-Amands
n = 379
(Valid %)
Willebroek
n = 279
(Valid %)
Gender
Male200 (47.7%)96 (44.4%)115 (48.9%)88 (47.3%)152 (44.3%)192 (50.7%)117 (41.9%)
Female218 (51.9%)119 (55.1%)118 (50.2%)95 (51.1%)190 (55.4%)186 (49.1%)162 (58.1%)
Non-binary2 (0.5%)1 (0.5%)2 (0.9%)3 (1.6%)1 (0.3%)1 (0.3%)0 (0.0%)
Age
18–34125 (29.8%)54 (25.0%)47 (20.0%)40 (21.5%)85 (24.8%)70 (18.5%)94 (33.7%)
35–55194 (46.2%)94 (43.5%)103 (43.8%)88 (47.3%)152 (44.3%)157 (41.4%)105 (37.6%)
55–80101 (24.0%)68 (31.5%)85 (36.2%)58 (31.2%)106 (30.9%)152 (40.1%)80 (28.7%)
Education
Low30 (7.1%)29 (13.4%)26 (11.1%)18 (9.7%)41 (12.0%)32 (8.4%)31 (11.1%)
Middle138 (32.9%)88 (40.7%)74 (31.5%)71 (38.2%)119 (34.7%)106 (28.0%)92 (33.0%)
High252 (60.0%)99 (45.8%)135 (57.4%)97 (52.2%)183 (53.4%)241 (63.6%)156 (55.9%)
Profession
Not Working103 (24.5%)68 (31.5%)63 (26.8%)48 (25.8%)96 (28.0%)141 (37.2%)85 (30.5%)
Working317 (75.5%)148 (68.5%)172 (73.2%)138 (74.2%)247 (72.0%)238 (62.8%)194 (69.5%)
Table 4. Perceived impacts and local tourism support (scale 1–5).
ItemsAalst
Mean (sd)
Berlare
Mean (sd)
Bornem
Mean (sd)
Denderleeuw
Mean (sd)
Dendermonde
Mean (sd)
Puurs-Sint-Amands
Mean (sd)
Willebroek
Mean (sd)
NEG13.00 (0.93)3.11 (0.89)3.03 (0.89)2.65 (1.03)2.90 (0.95)2.92 (0.85)2.62 (0.95)
NEG23.06 (1.11)3.29 (1.03)3.01 (1.07)2.54 (1.12)2.78 (1.04)3.01 (1.01)2.61 (1.04)
NEG32.31 (1.11)3.06 (1.18)2.59 (1.13)2.12 (1.06)2.27 (1.03)2.64 (1.15)2.18 (1.07)
NEG42.04 (1.03)2.79 (1.16)2.23 (1.12)1.91 (1.05)1.90 (0.82)2.31 (1.08)1.98 (0.99)
POS13.70 (1.03)3.41 (1.15)3.65 (1.06)3.01 (1.25)3.60 (1.11)3.52 (1.10)3.22 (1.20)
POS23.30 (1.05)2.89 (1.08)3.00 (1.08)2.48 (1.24)2.84 (1.16)2.85 (1.13)2.49 (1.16)
POS33.36 (0.96)3.17 (1.06)3.30 (1.00)3.21 (1.19)3.37 (1.02)3.28 (1.01)3.19 (1.19)
POS43.35 (0.98)3.06 (1.06)3.32 (0.96)3.02 (1.21)3.25 (1.07)3.16 (1.04)3.11 (1.12)
POS53.12 (0.92)3.35 (0.91)3.34 (0.83)2.61 (1.05)3.06 (1.04)3.22 (0.95)2.58 (0.98)
POS63.50 (0.97)3.77 (0.86)3.64 (0.86)2.85 (1.19)3.40 (1.14)3.48 (0.99)2.86 (1.16)
SUP13.59 (0.95)3.57 (0.95)3.62 (0.98)3.06 (1.09)3.60 (0.99)3.59 (0.96)3.07 (1.09)
SUP23.94 (0.87)3.86 (0.94)3.97 (0.92)3.55 (1.08)4.11 (0.82)3.85 (0.91)3.69 (0.99)
SUP34.04 (0.89)3.92 (1.01)4.02 (0.96)3.46 (1.12)4.19 (0.87)3.91 (0.98)3.68 (1.05)
SUP44.07 (0.94)3.87 (1.05)3.98 (1.01)3.84 (1.15)4.24 (0.87)3.95 (1.01)3.97 (1.06)
Neg: Negative impacts of tourism; POS: Positive impacts of tourism; SUP: Support for tourism.
Table 5. Overview of outer model.
Factors and Measurement ItemsLatent Variable TypeOuter WeightStd. ErrorLoading
Personal economic benefitsFormative
ECO110.0000.78
Psychological empowermentFormative
PSY10.134 *0.0650.87
PSY20.173 *0.0650.83
PSY30.755 *0.0570.96
Social empowermentFormative
SOC10.724 *0.0560.97
SOC20.334 *0.0610.87
Political empowermentFormative
POL10.256 *0.0880.88
POL20.788 *0.0760.97
Negative impacts of tourismFormative
NEG1−0.425 *0.2030.52
NEG21.371 *0.1370.92
NEG30.0650.1700.36
NEG4−0.2530.0360.30
Positive impacts of tourismFormative
POS10.113 *0.0360.56
POS20.248 *0.0520.79
POS30.141 *0.0380.77
POS40.073 *0.0360.65
POS50.290 *0.0360.77
POS60.396 *0.0350.83
Support for tourismFormative
SUP10.460 *0.0520.82
SUP2−0.1160.0640.74
SUP30.319 *0.0730.86
SUP40.478 *0.0680.85
Note: * significant at 95% Confidence Interval.
Table 6. Structural relations of the inner model.
FromToRegression WeightStd. Error
Personal economic benefitsNegative impacts of tourism−0.0440.028
Positive impacts of tourism0.0110.020
Support for tourism0.0210.017
Psychological empowermentNegative impacts of tourism−0.0730.040
Positive impacts of tourism0.312 *0.029
Support for tourism0.287 *0.028
Social empowermentNegative impacts of tourism−0.083 *0.036
Positive impacts of tourism0.327 *0.030
Support for tourism0.0440.029
Political empowermentNegative impacts of tourism−0.0470.029
Positive impacts of tourism0.159 *0.022
Support for tourism0.0220.021
Negative impacts of tourismSupport for tourism−0.232 *0.028
Positive impacts of tourismSupport for tourism0.384 *0.027
Note: * significant at 95% Confidence Interval.
Publisher’s Note: MDPI stays neutral with regard to jurisdictional claims in published maps and institutional affiliations.

