
Benefit Segmentation of Tourists to Geosites and Its Implications for Sustainable Development of Geotourism in the Southern Lake Tana Region, Ethiopia

 ,
,  ,
,  ,
,  ,
,  , ,
, , 
Abstract
:1. Introduction
2. Literature Review
2.1. Market Segmentation and Its Application in Tourism
2.2. Segmenting Tourists to Geosites
2.3. Benefit Segmentation in (Geo)Tourism
3. Methodology
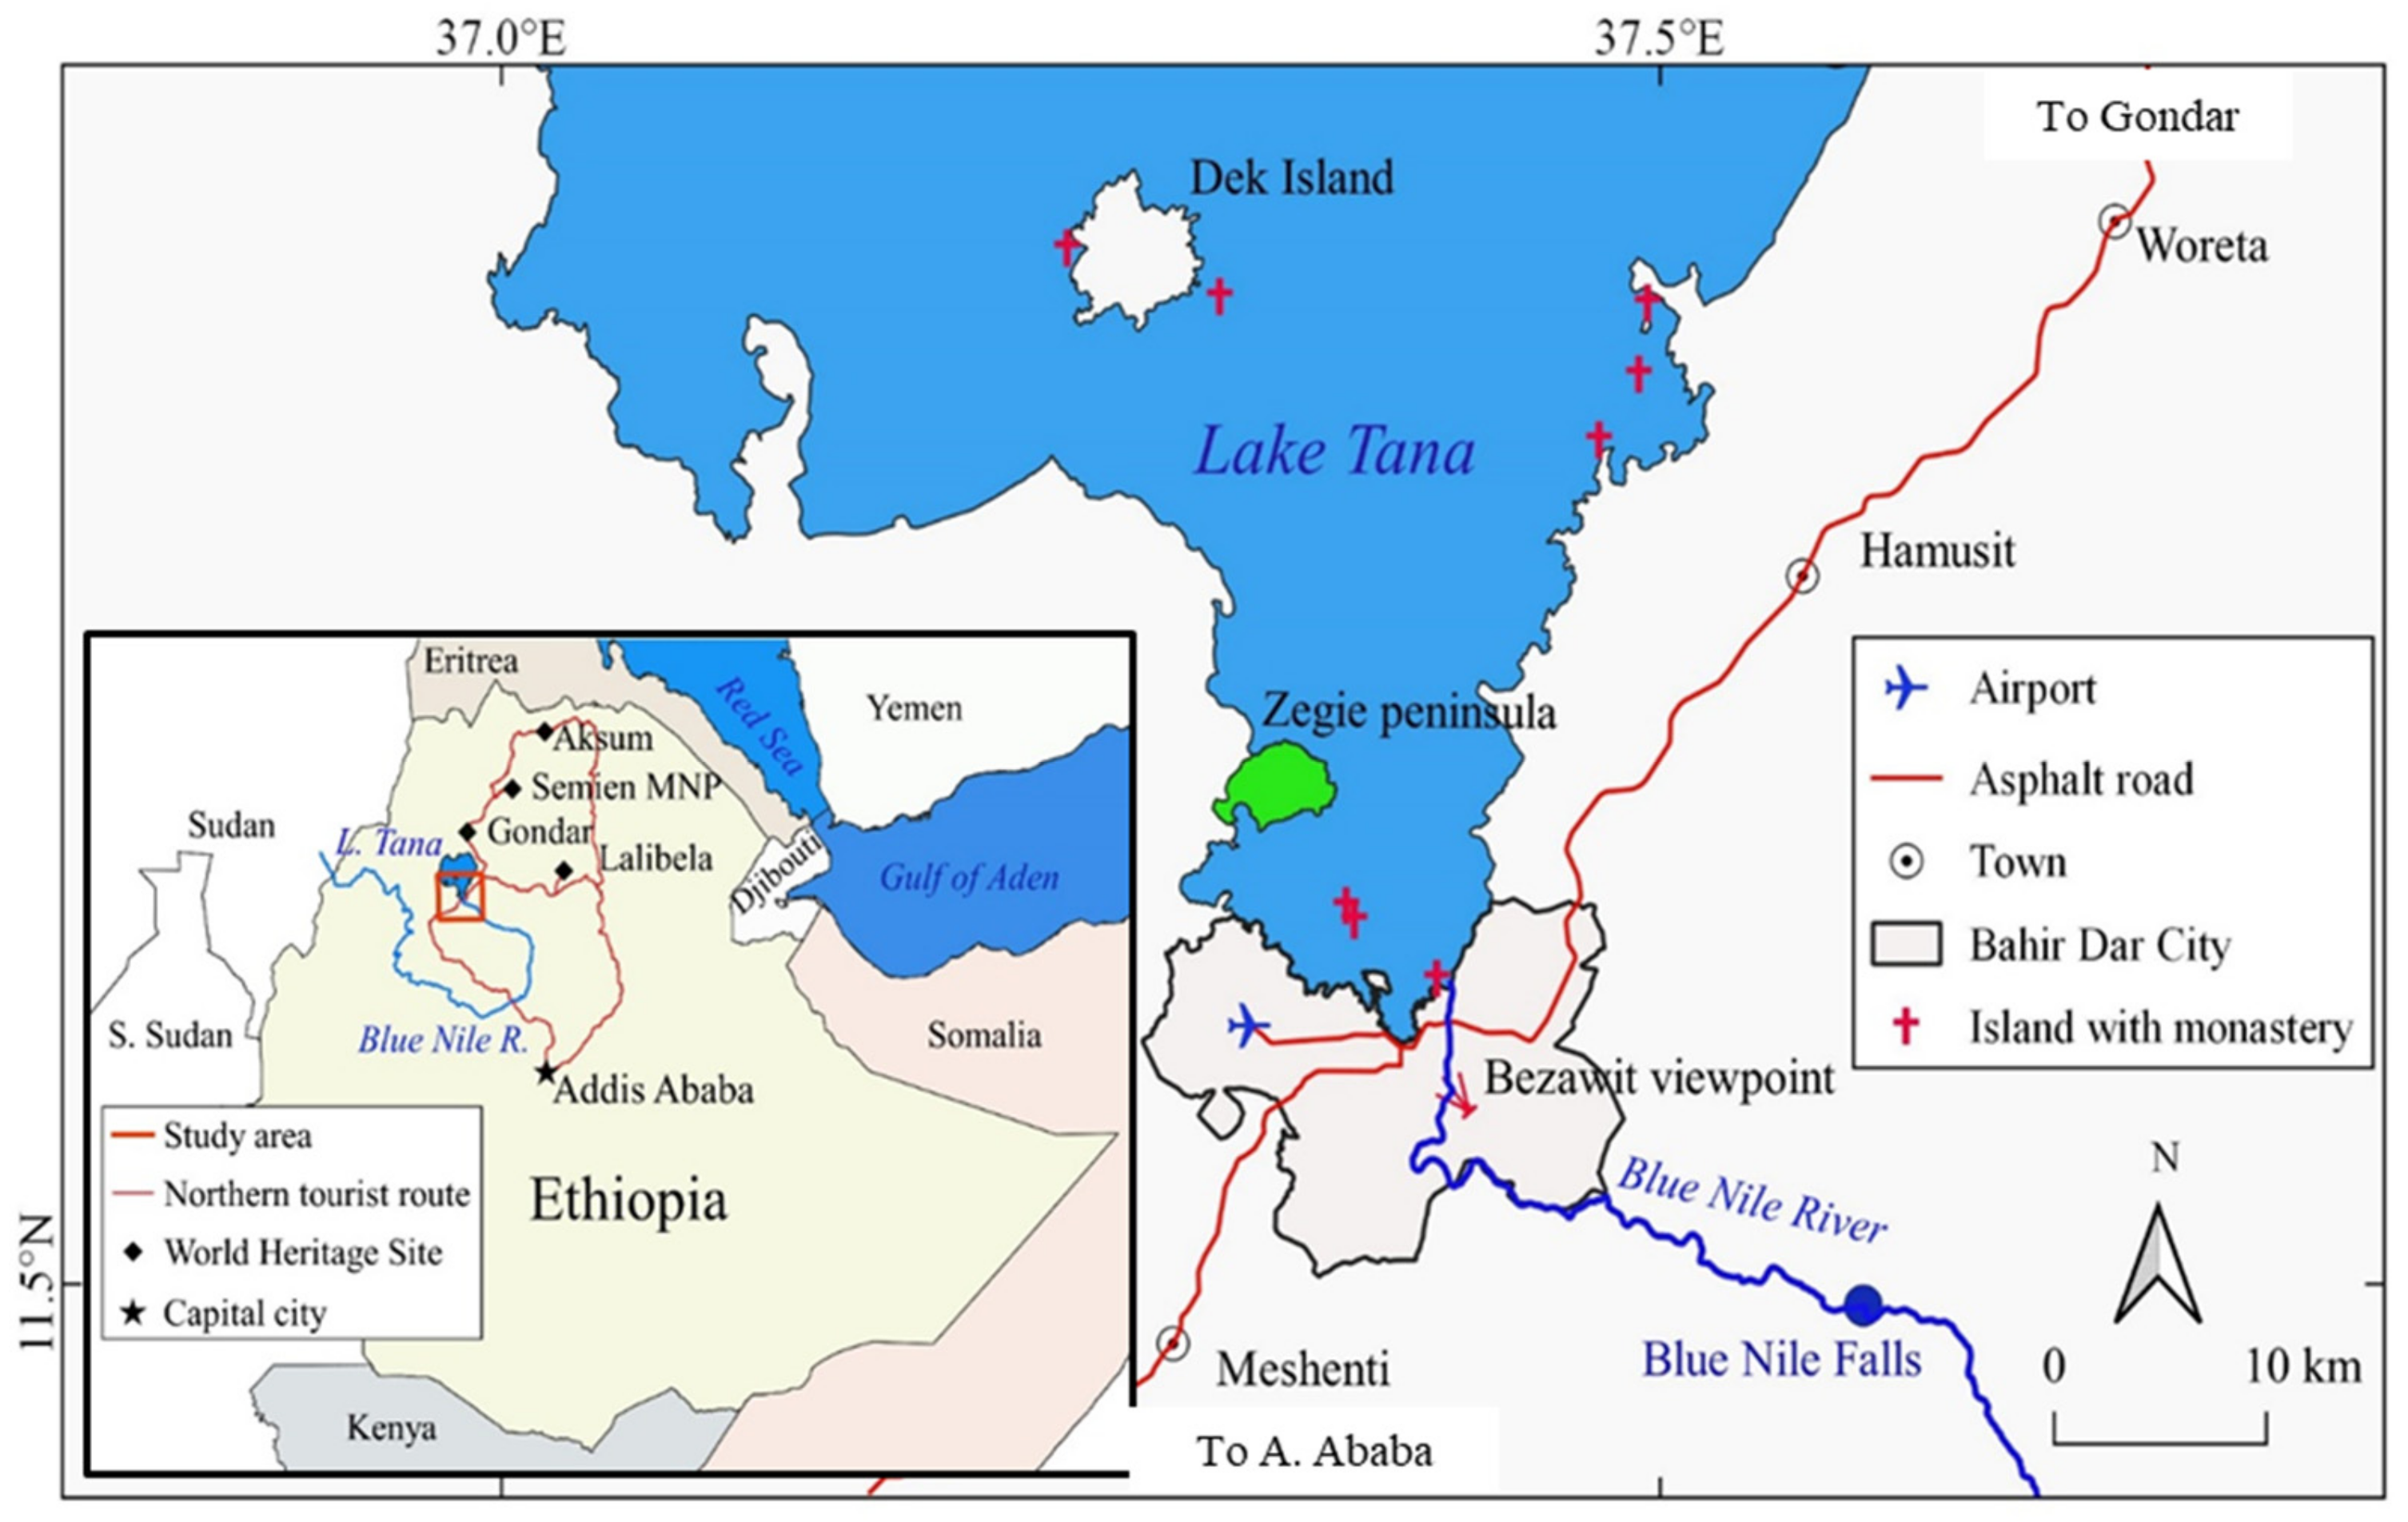
3.1. Study Area
3.2. Data Collection
3.2.1. Questionnaire Design
3.2.2. Data Collection
3.3. Exploratory Factor Analysis
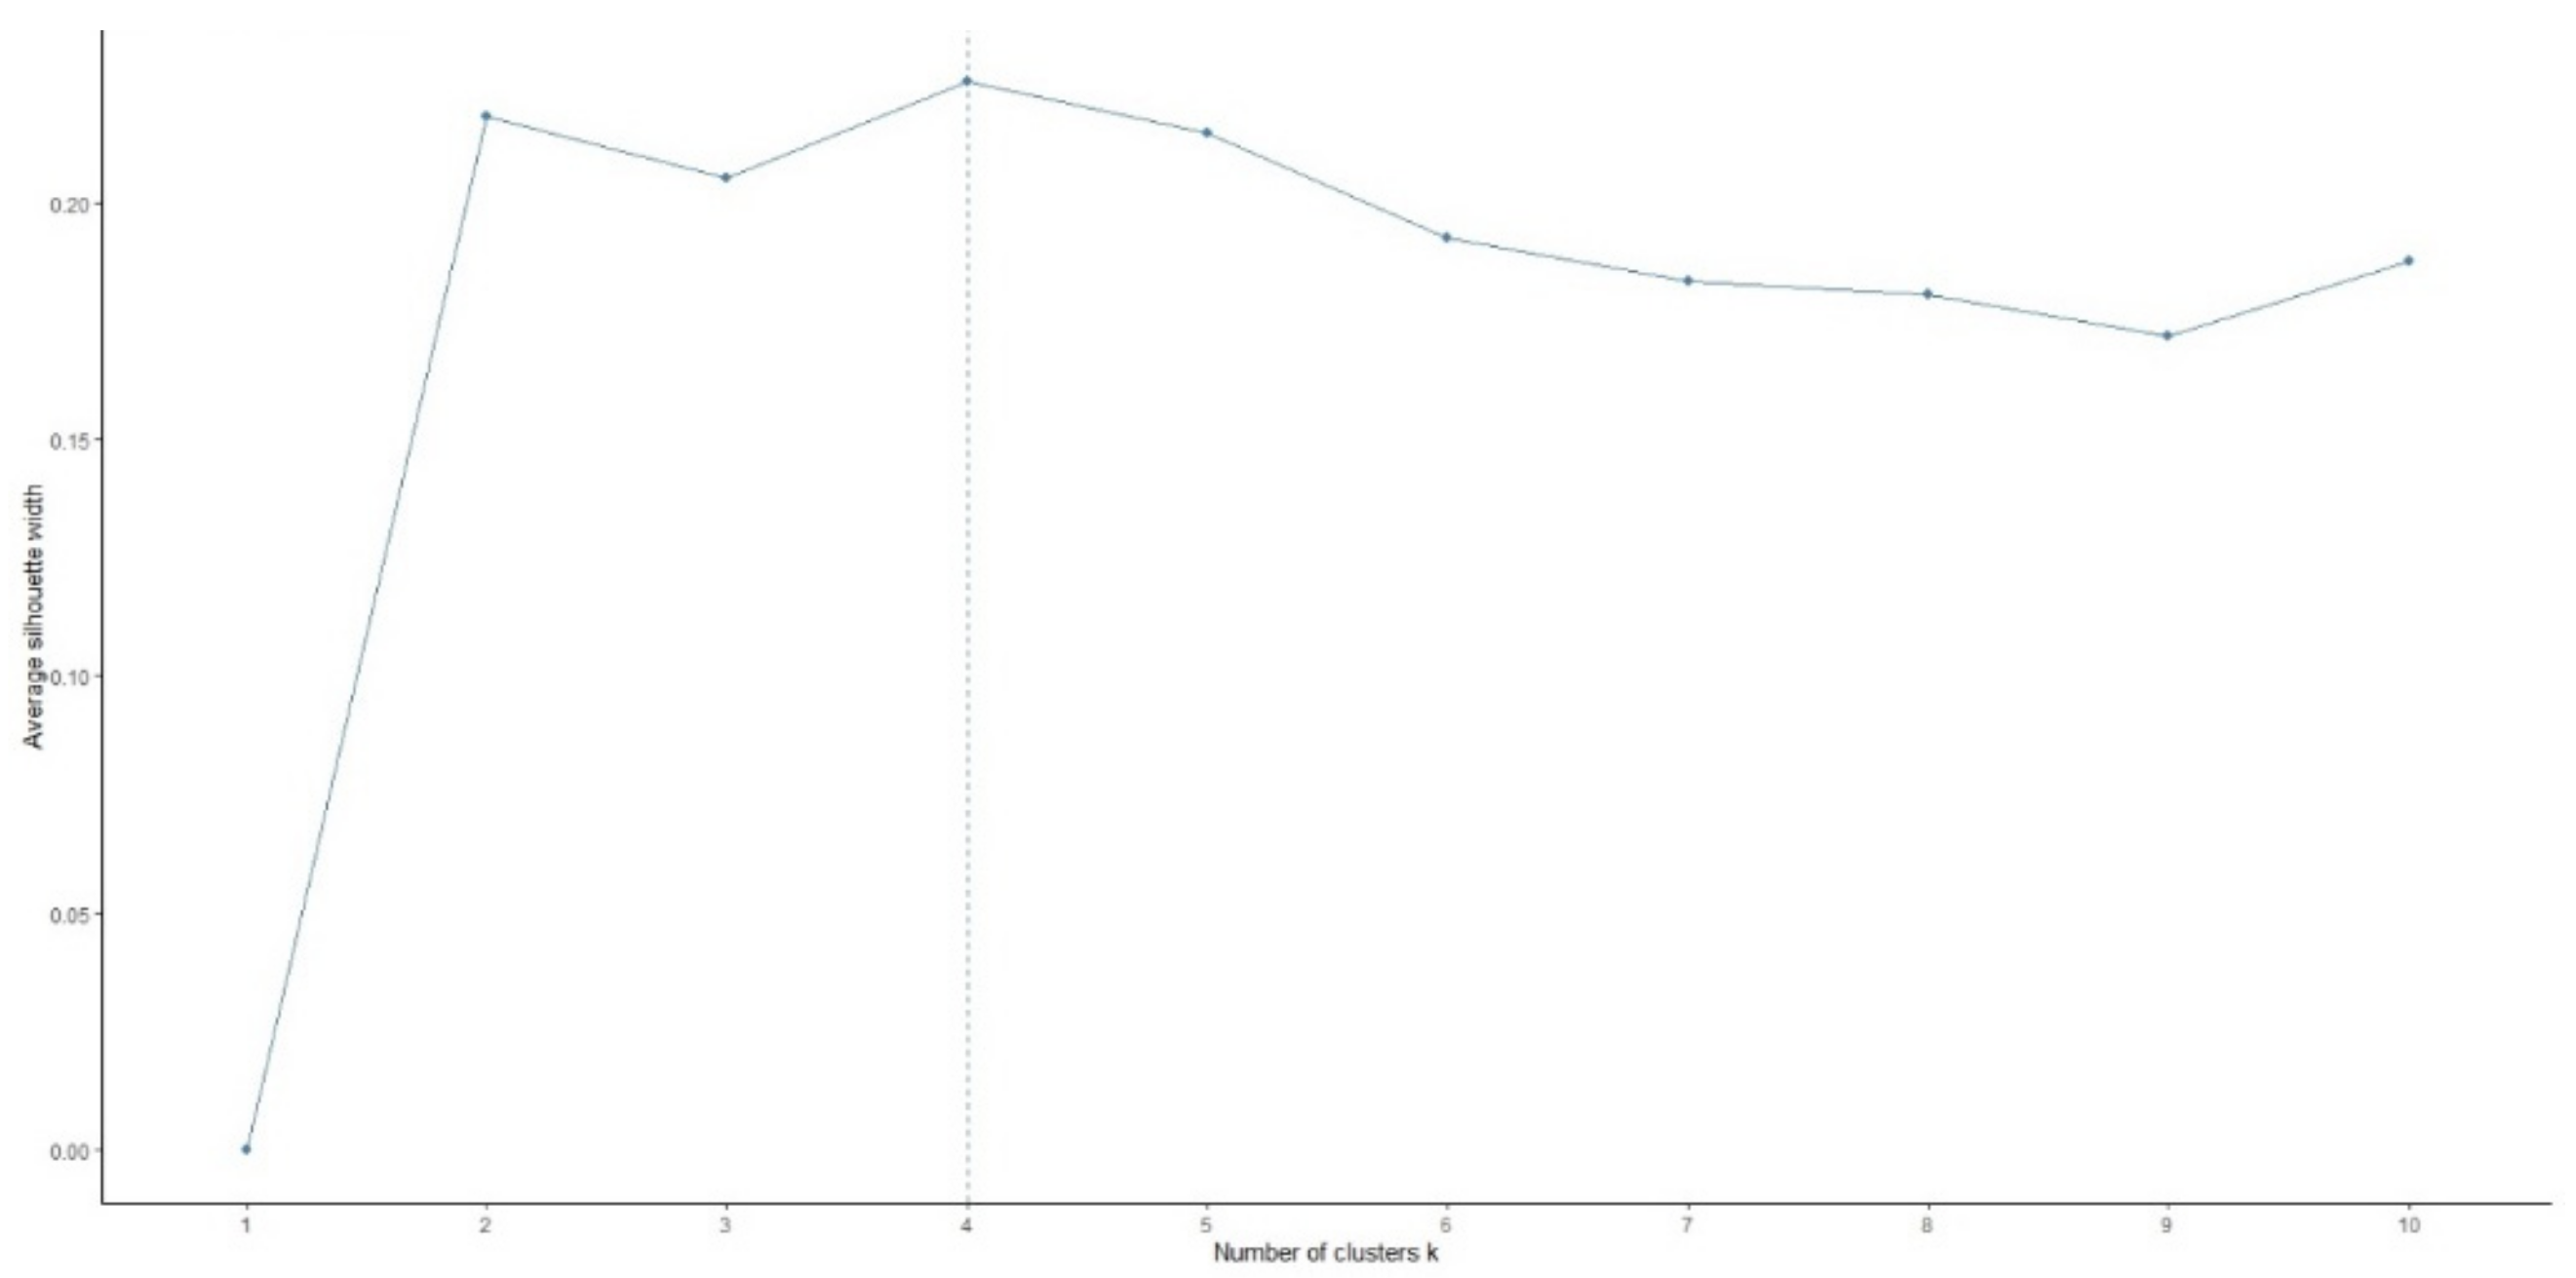
3.4. Cluster Analysis
4. Results
4.1. Profiles of the Respondents
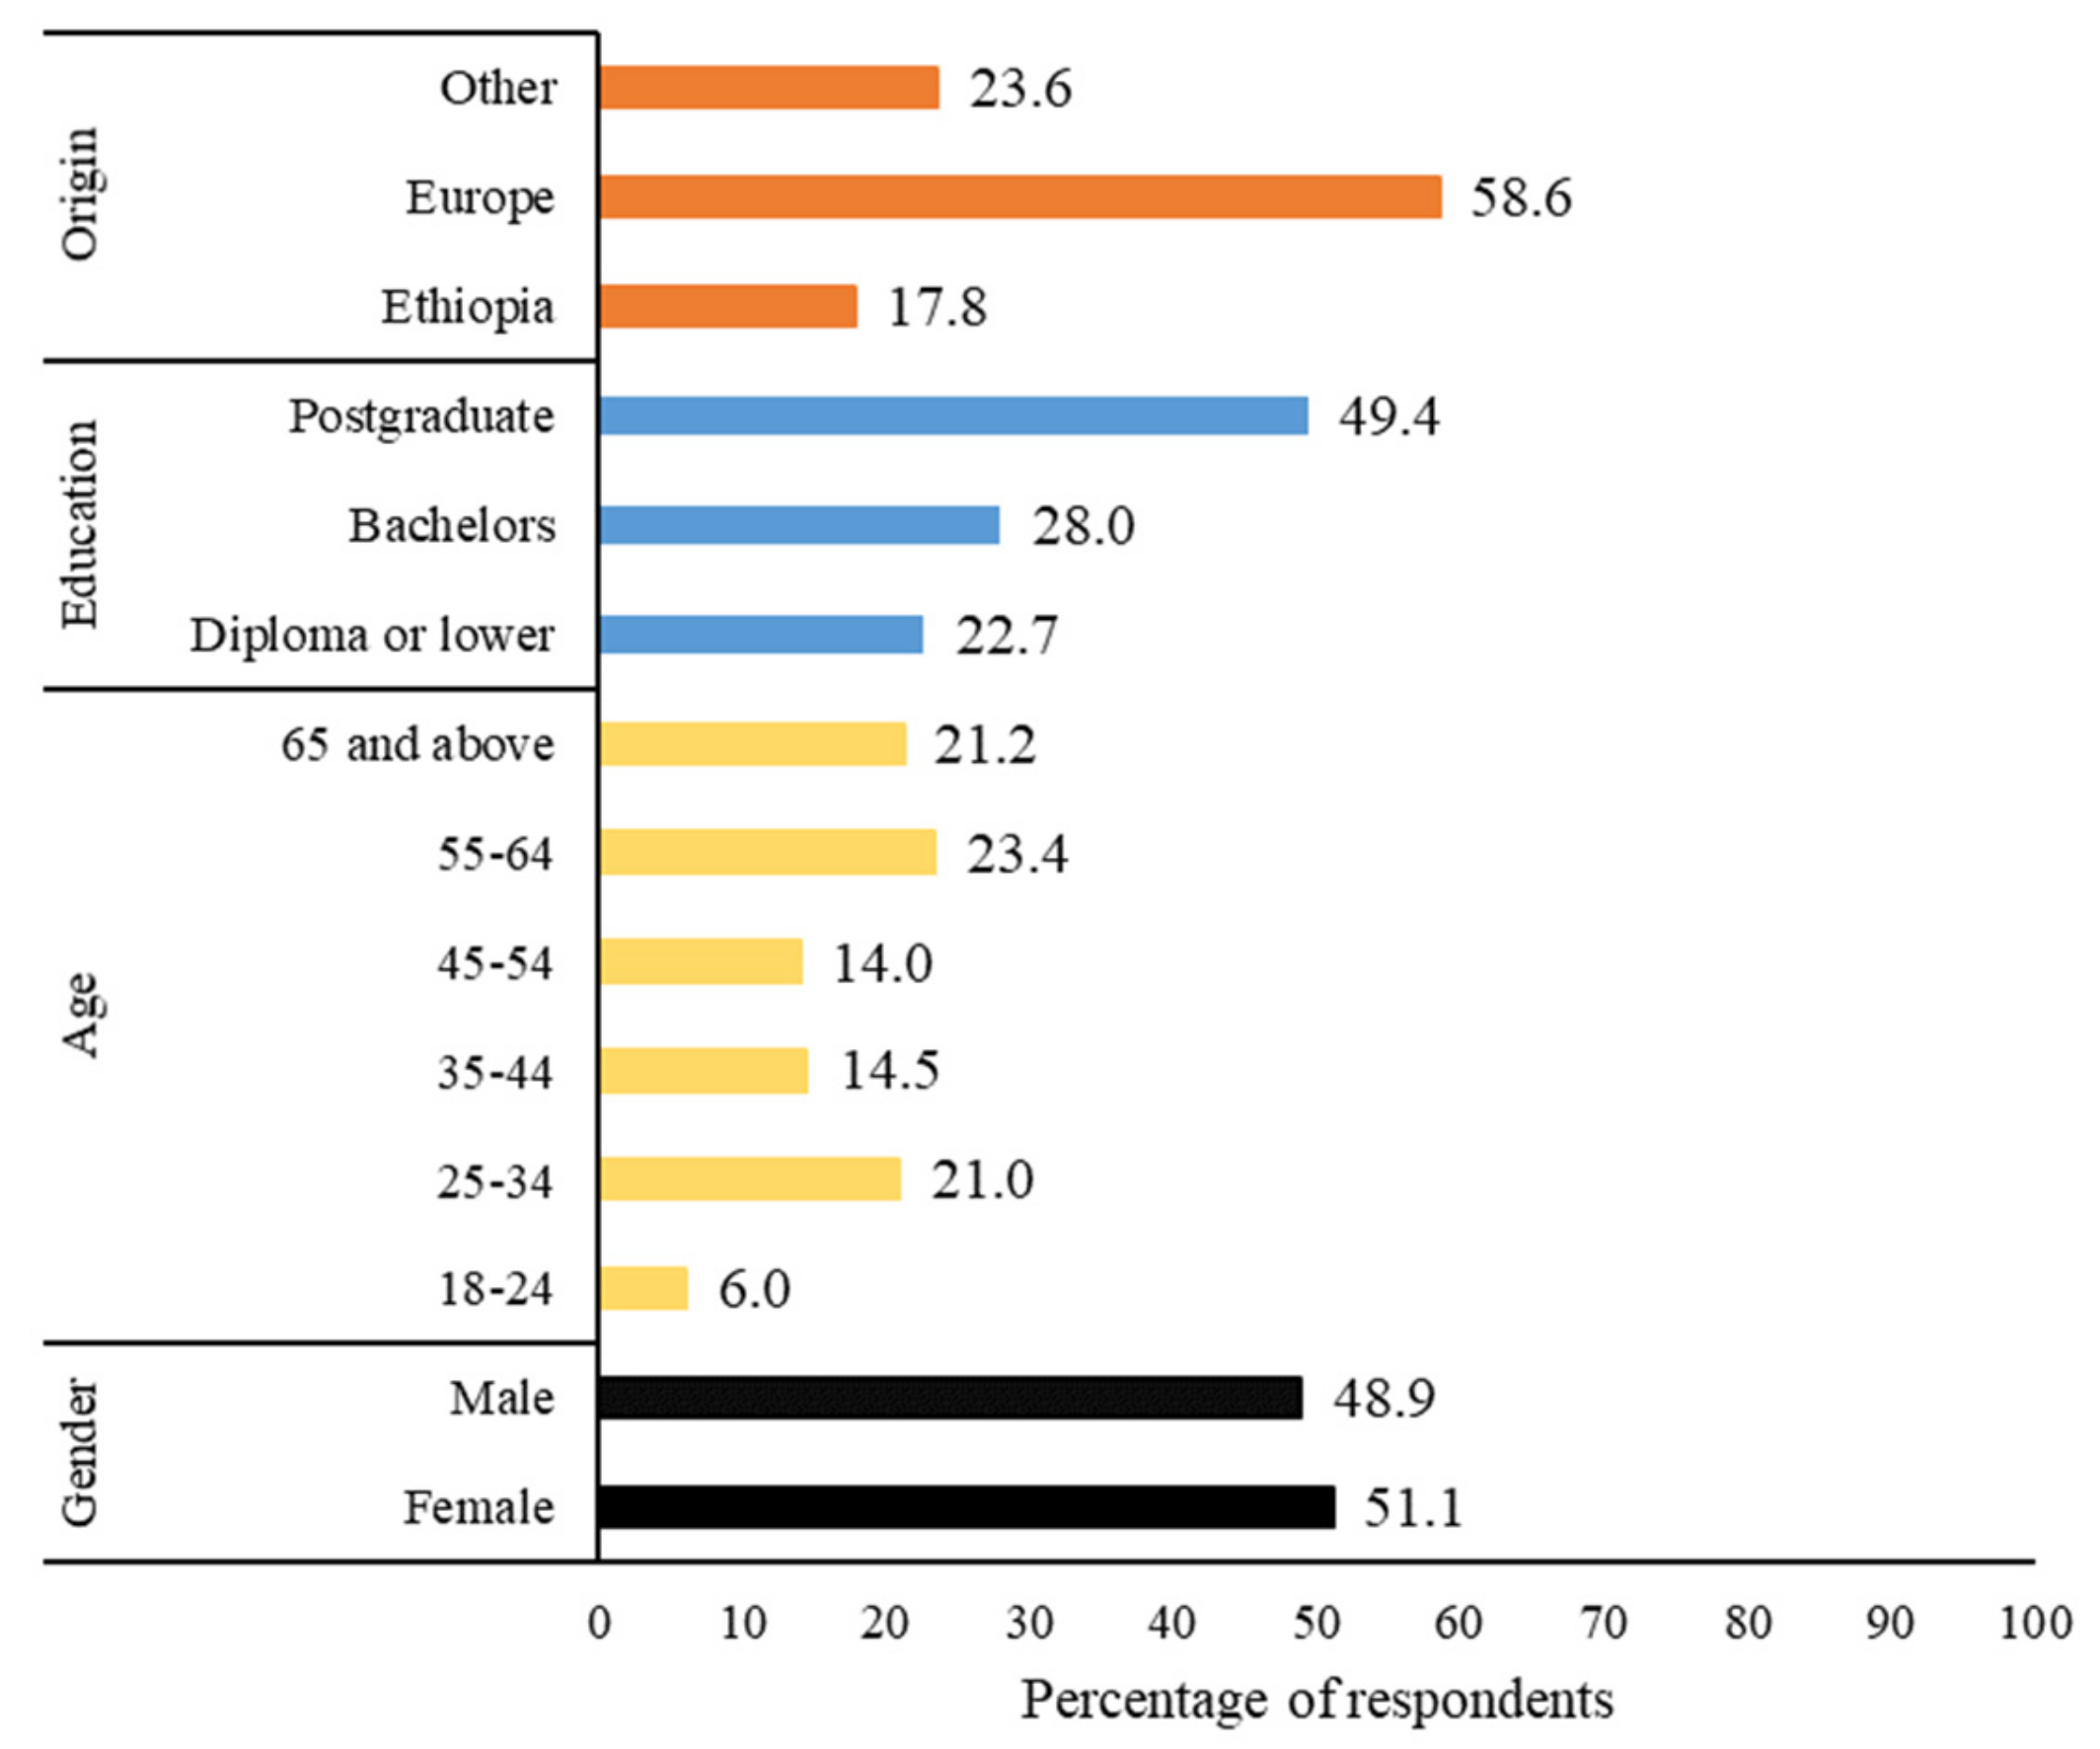
4.1.1. Demographic Profile of the Respondents
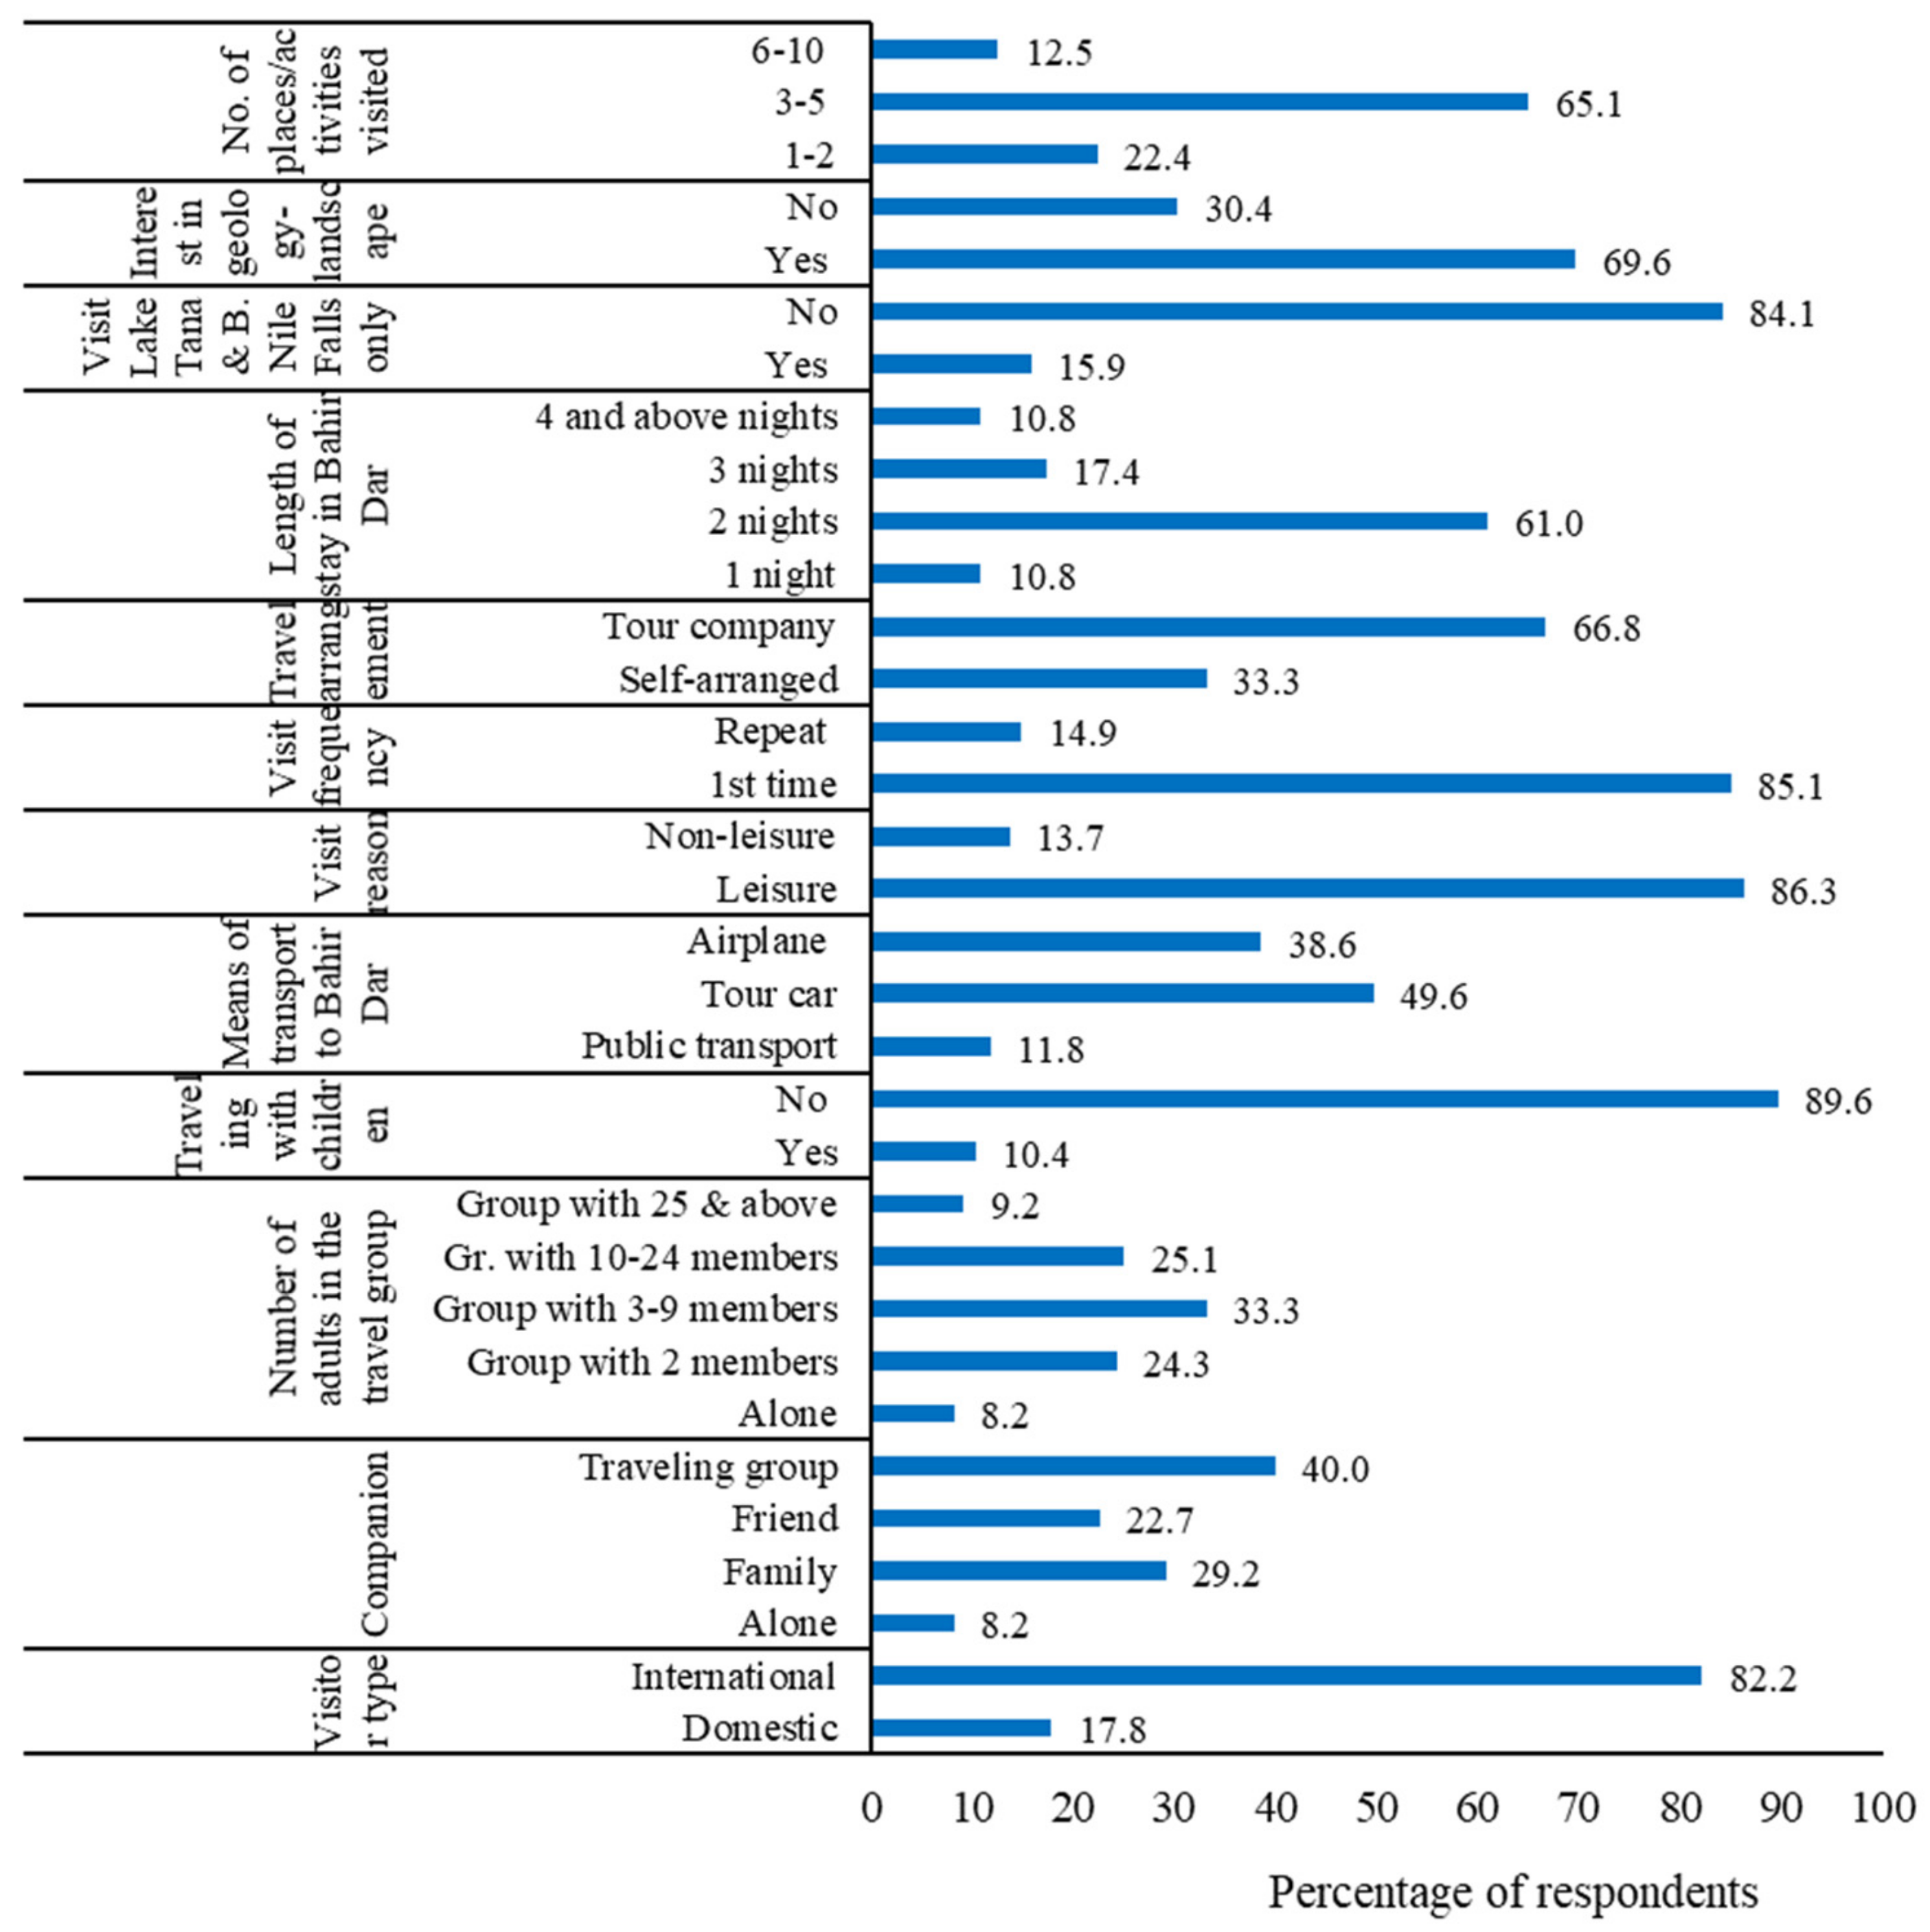
4.1.2. Trip Profile of the Respondents
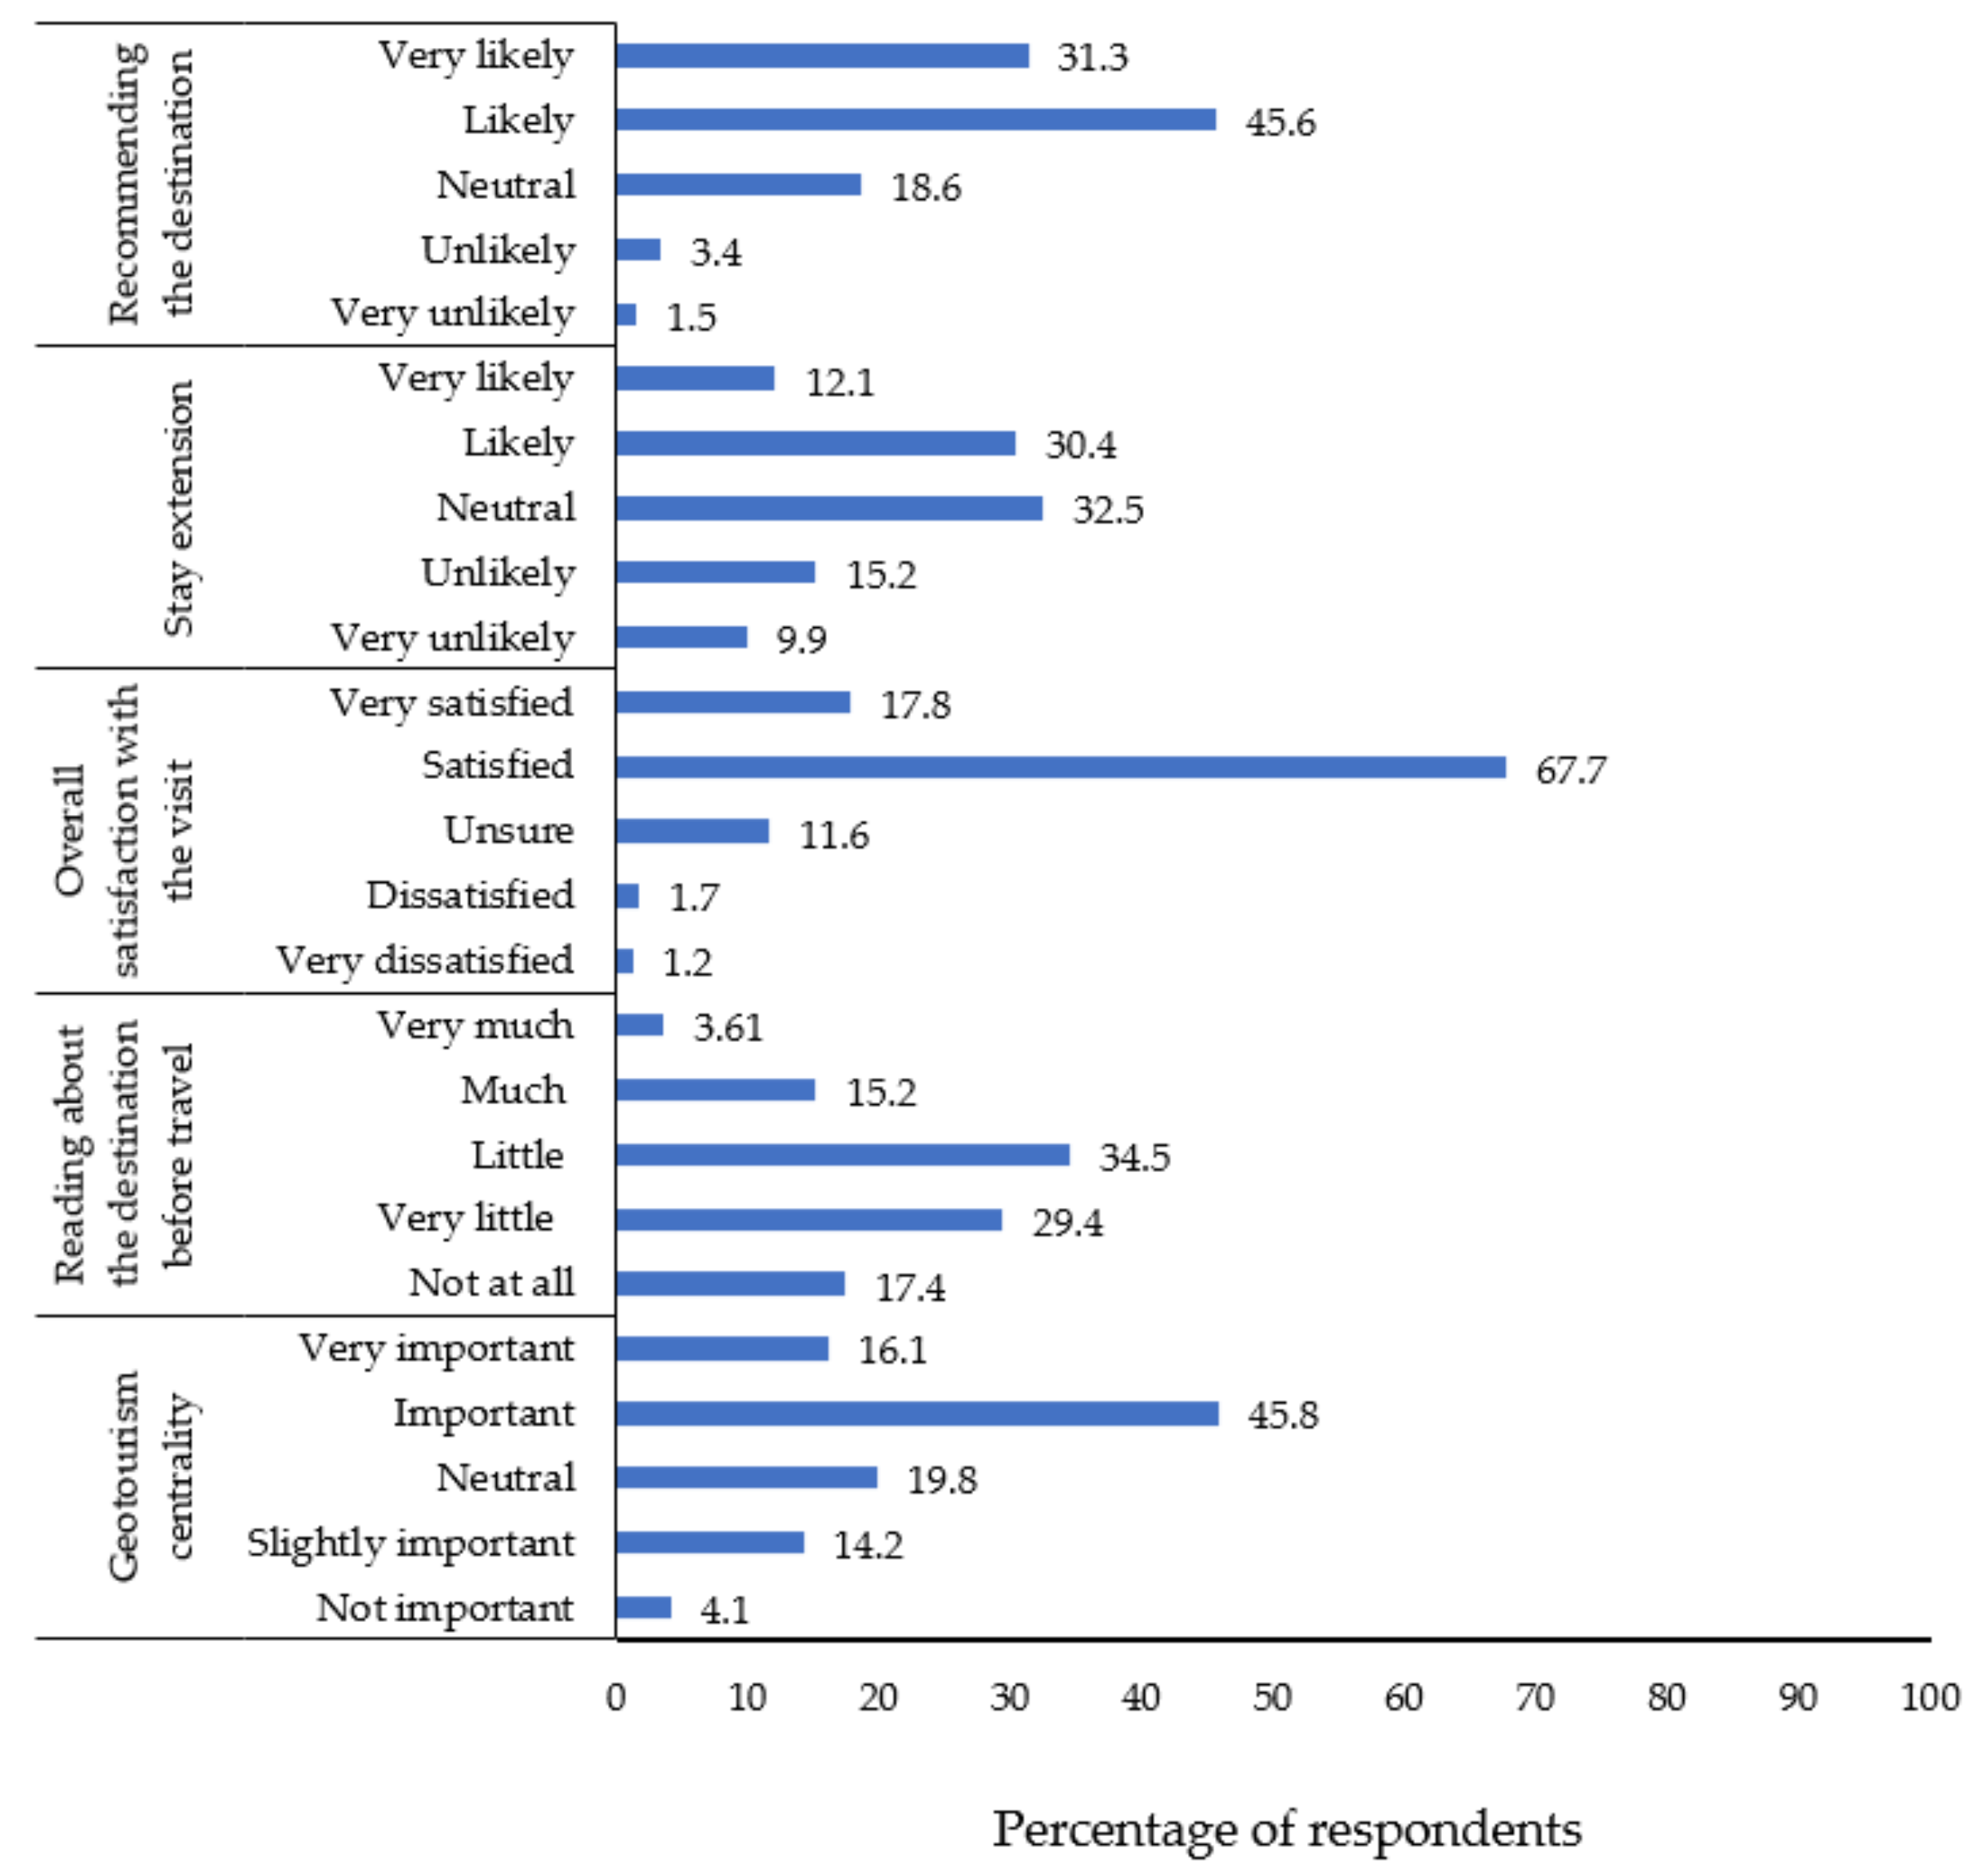
4.1.3. Behavioral Profile of the Respondents
4.2. Exploratory Factor Analysis (EFA) Results

| Factors (Reliability) and Benefit Attributes/Items | Mean a | Factor Loadings | Eigenvalue | Variance Explained (%) | Communalities |
|---|---|---|---|---|---|
| Factor 1: Activities (alpha = 0.81) | 2.63 | 5.97 | 14.40 | ||
| Adventure activities (e.g., mountain climbing, paragliding) | 2.54 | 0.88 | 0.85 | ||
| Cave exploration/visiting caves | 2.63 | 0.83 | 0.75 | ||
| Horse/mule riding | 2.17 | 0.66 | 0.62 | ||
| Hiking/biking | 3.18 | 0.52 | 0.37 | ||
| Factor 2: Relaxation (alpha = 0.79) | 3.60 | 2.02 | 14.00 | ||
| Places to sit and rest around attraction sites | 3.46 | 0.62 | 0.47 | ||
| Overall cleanliness of the destination | 3.69 | 0.61 | 0.50 | ||
| Shopping opportunities (souvenirs and others) | 3.55 | 0.60 | 0.66 | ||
| Boat trip (quality of boats and their service) | 3.58 | 0.52 | 0.43 | ||
| Variety of local food and drink | 3.68 | 0.51 | 0.41 | ||
| Calm and peaceful atmosphere | 3.71 | 0.50 | 0.53 | ||
| Climate conditions | 3.55 | 0.46 | 0.27 | ||
| Factor 3: Nature (alpha = 0.72) | 3.91 | 1.62 | 12.50 | ||
| Scenic beauty of landscape | 4.28 | 0.71 | 0.54 | ||
| Unspoiled nature | 4.13 | 0.71 | 0.58 | ||
| Diversity of geosites/attractions (e.g., waterfalls, lake, islands, viewpoints) | 4.21 | 0.64 | 0.47 | ||
| Fauna and flora (diversity and uniqueness) | 3.65 | 0.53 | 0.31 | ||
| Waterfall | 3.28 | 0.38 | 0.32 | ||
| Factor 4: Culture (alpha = 0.67) | 3.49 | 1.30 | 8.60 | ||
| Special festivals and events | 3.07 | 0.62 | 0.51 | ||
| Human–environment interaction, local/rural village life | 4.00 | 0.61 | 0.42 | ||
| Religious, cultural, and historical heritage (diversity and uniqueness) | 4.13 | 0.59 | 0.41 | ||
| Entertainment (e.g., traditional cultural clubs) | 2.76 | 0.42 | 0.50 | ||
| Total % of variance explained | 49.50 |
4.3. Cluster Analysis Results
4.4. Profiling the Segments
4.4.1. Activity–Nature Lovers
4.4.2. Culture Lovers
4.4.3. Nature–Culture Lovers
4.4.4. Want-It-Alls
5. Discussion
6. Implications
6.1. Theoretical Implications
6.2. Managerial Implications for Sustainable Development of Geotourism
7. Conclusions
Author Contributions
Funding
Institutional Review Board Statement
Informed Consent Statement
Data Availability Statement
Acknowledgments
Conflicts of Interest
Appendix A


| Segment | Factor 1 Activities | Factor 2 Relaxation | Factor 3 Nature | Factor 4 Culture | Number of Respondents (n = 415) | % of Segments in Total Sample |
|---|---|---|---|---|---|---|
| Segment 1: Activity–Nature Lovers | 0.42 | −0.63 | 0.09 | −0.79 | 103 | 24.82 |
| Segment 2: Culture Lovers | −0.36 | −0.21 | −1.10 | 0.24 | 57 | 13.73 |
| Segment 3: Nature–Culture Lovers | −0.94 | 0.12 | 0.061 | 0.16 | 142 | 34.22 |
| Segment 4: Want-It-Alls | 0.83 | 0.68 | 0.40 | 0.43 | 113 | 27.23 |
| ANOVA results (F statistic) | 187.46 *** | 89.09 *** | 145.81 *** | 50.60 *** |
References
- Ólafsdóttir, R.; Tverijonaite, E. Geotourism: A Systematic Literature Review. Geosciences 2018, 8, 234. [Google Scholar] [CrossRef] [Green Version]
- Tessema, G.A.; van der Borg, J.; Minale, A.S.; Van Rompaey, A.; Adgo, E.; Nyssen, J.; Asrese, K.; Van Passel, S.; Poesen, J. Inventory and Assessment of Geosites for Geotourism Development in the Eastern and Southeastern Lake Tana Region, Ethiopia. Geoheritage 2021, 13, 43. [Google Scholar] [CrossRef]
- Ruban, D.A. Geotourism—A geographical review of the literature. Tour. Manag. Perspect. 2015, 15, 1–15. [Google Scholar] [CrossRef]
- Rocha, D.; Duarte, A. The Management of Arouca Geopark’s Route of Geosites: A Strategic Geologically Based Product in a Geotourism Destination. In Economics and Management of Geotourism; Braga, V., Duarte, A., Marques, C.S., Eds.; Springer: Cham, Switzerland, 2022; pp. 87–104. [Google Scholar] [CrossRef]
- Dowling, R.K. Global Geotourism—An Emerging Form of Sustainable Tourism. Czech J. Tour. 2013, 2, 59–79. [Google Scholar] [CrossRef] [Green Version]
- Aquino, R.S.; Schänzel, H.A.; Hyde, K.F. Unearthing the geotourism experience: Geotourist perspectives at Mount Pinatubo, Philippines. Tour. Stud. 2018, 18, 41–62. [Google Scholar] [CrossRef] [Green Version]
- Gorman, C.E. Landscape and Geotourism: Market typologies and visitor needs. In Proceedings of the European Tourism and the Environment Conference: Promotion and Protection, Achieving the Balance, Dublin, Ireland, 11–12 October 2007; pp. 1–12. [Google Scholar]
- Rivero, M.S.; Rangel, M.C.R.; Martín, J.M.S. Geotourist Profile Identification Using Binary Logit Modeling: Application to the Villuercas-Ibores-Jara Geopark (Spain). Geoheritage 2019, 11, 1399–1412. [Google Scholar] [CrossRef]
- Allan, M.; Dowling, R.K.; Sanders, D. The motivations for visiting geosites: The case of crystal cave, Western Australia. Geoj. Tour. Geosites 2015, 16, 142–153. [Google Scholar]
- Vasiljević, Đ.A.; Vujičić, M.D.; Božić, S.; Jovanović, T.; Marković, S.B.; Basarin, B.; Lukić, T.; Čarkadžić, J. Trying to underline geotourist profile of National park visitors: Case study of NP Fruška Gora, Serbia (Typology of potential geotourists at NP Fruška Gora). Open Geosci. 2018, 10, 222–233. [Google Scholar] [CrossRef]
- Thomas, M.F.; Asrat, A. The Potential Contribution of Geotourism in Africa. In Handbook of Geotourism; Dowling, R., D, N., Eds.; Edward Elgar Publishing: Cheltenham, UK, 2018; pp. 168–191. [Google Scholar]
- Newsome, D.; Dowling, R. The Scope and Nature of Geotourism. In Geotourism; Dowling, R., Newsome, D., Eds.; Elsevier Butterworth Heinemann: Oxford, UK, 2006; pp. 3–25. [Google Scholar]
- Palacio, V. Identifying Ecotourists in Belize Through Benefit Segmentation: A Preliminary Analysis. J. Sustain. Tour. 1997, 5, 234–243. [Google Scholar] [CrossRef]
- Foedermayr, E.K.; Diamantopoulos, A. Market Segmentation in Practice: Review of Empirical Studies, Methodological Assessment, and Agenda for Future Research. J. Strat. Mark. 2008, 16, 223–265. [Google Scholar] [CrossRef]
- Kotler, P.; Bowen, J.T.; Baloglu, S. Marketing for Hospitality and Tourism; Global Edition (8th Global); Pearson Education: Harlow, UK, 2021. [Google Scholar]
- McKercher, B.; Tolkach, D.; Eka Mahadewi, N.M.; Byomantara, D.G.N. Choosing the Optimal Segmentation Technique to Understand Tourist Behaviour. J. Vacat. Mark. 2022. [Google Scholar] [CrossRef]
- Hajibaba, H.; Grün, B.; Dolnicar, S. Improving the stability of market segmentation analysis. Int. J. Contemp. Hosp. Manag. 2019, 32, 1393–1411. [Google Scholar] [CrossRef]
- Ernst, D.; Dolnicar, S. How to Avoid Random Market Segmentation Solutions. J. Travel Res. 2018, 57, 69–82. [Google Scholar] [CrossRef] [Green Version]
- Dolnicar, S.; Grün, B.; Leisch, F. Market Segmentation Analysis: Understanding It, Doing It, and Making It Useful; Springer: New York, NY, USA, 2018. [Google Scholar]
- Dolničar, S. Beyond “Commonsense Segmentation”: A Systematics of Segmentation Approaches in Tourism. J. Travel Res. 2004, 42, 244–250. [Google Scholar] [CrossRef] [Green Version]
- Dolnicar, S.; Grün, B. Methods in Segmentation. In Segmentation in Social Marketing: Process, Methods and Application; Dietrich, T., Rundle-Thiele, S., Kubacki, K., Eds.; Springer: Singapore, 2017; pp. 93–107. ISBN 9789811018350. [Google Scholar]
- Dolnicar, S. Market Segmentation Approaches in Tourism. In The Routledge handbook of tourism marketing; McCabe, S., Ed.; Routledge: London, UK, 2014; pp. 197–208. [Google Scholar]
- Hose, T.A. Geotourism in Almeria Province, southeast Spain. Tourism 2007, 55, 259–276. [Google Scholar]
- Kim, S.S.; Kim, M.; Park, J.; Guo, Y. Cave Tourism: Tourists’ Characteristics, Motivations to Visit, and the Segmentation of Their Behavior. Asia Pac. J. Tour. Res. 2008, 13, 299–318. [Google Scholar] [CrossRef]
- Dowling, R.K. Geotourism’s Global Growth. Geoheritage 2011, 3, 1–13. [Google Scholar] [CrossRef]
- Kim, A.K.; Brown, G. Understanding Tourist Perspectives on Geotourism Experience: Implications for Destination Development. Tour. Rev. Int. 2012, 16, 45–57. [Google Scholar] [CrossRef]
- Hurtado, H.; Dowling, R.; Sanders, D. An Exploratory Study to Develop a Geotourism Typology Model. Int. J. Tour. Res. 2014, 16, 608–613. [Google Scholar] [CrossRef]
- Timčák, M.G.; Jablonská, J.; Jaremko, M. Wellness and Relaxation in Geotourism. In Proceedings of the GEOTOUR & IRSE, Miskolc, Hungary, 16–18 October 2014; Štrba, Ľ., Ed.; Technical University of Košice: Miskolc, Hungary, 2014; pp. 63–71. [Google Scholar]
- Prendivoj, S.M. Tailoring Signs to Engage Two Distinct Types of Geotourists to Geological Sites. Geosciences 2018, 8, 329. [Google Scholar] [CrossRef] [Green Version]
- Allan, M.; Shavanddasht, M. Rural geotourists segmentation by motivation in weekends and weekdays. Tour. Hosp. Res. 2019, 19, 74–84. [Google Scholar] [CrossRef]
- Newsome, D.; Dowling, R.K. Setting an agenda for geotourism. In Geotourism: The Tourism of Geology and Landscape; Goodfellow: Oxford, UK, 2010; pp. 1–12. [Google Scholar] [CrossRef]
- Frochot, I.; Morrison, A.M. Benefit Segmentation: A Review of Its Applications to Travel and Tourism Research. J. Travel Tour. Mark. 2000, 9, 21–45. [Google Scholar] [CrossRef]
- Haley, R.I. Benefit Segmentation: A Decision-Oriented Research Tool. J. Mark. 1968, 32, 30–35. [Google Scholar] [CrossRef]
- Frochot, I. A benefit segmentation of tourists in rural areas: A Scottish perspective. Tour. Manag. 2005, 26, 335–346. [Google Scholar] [CrossRef]
- Li, M.; Huang, Z.; Cai, L.A. Benefit segmentation of visitors to a rural community-based festival. J. Travel Tour. Mark. 2009, 26, 585–598. [Google Scholar] [CrossRef]
- Koh, S.; Yoo, J.J.-E.; Boger, C.A. Importance-performance analysis with benefit segmentation of spa goers. Int. J. Contemp. Hosp. Manag. 2010, 22, 718–735. [Google Scholar] [CrossRef] [Green Version]
- Pesonen, J.; Laukkanen, T.; Komppula, R. Benefit segmentation of potential wellbeing tourists. J. Vacat. Mark. 2011, 17, 303–314. [Google Scholar] [CrossRef]
- Dryglas, D.; Salamaga, M. Applying destination attribute segmentation to health tourists: A case study of Polish spa resorts. J. Travel Tour. Mark. 2017, 34, 503–514. [Google Scholar] [CrossRef]
- Zečević, B.; Kovačević, I. Benefit Segmentation of Outbound Summer Package Tourists. Facta Univ. Ser. Econ. Organ. 2017, 13, 401–414. [Google Scholar] [CrossRef] [Green Version]
- Nduna, L.T.; Van Zyl, C. A benefit segmentation framework for a nature-based tourism destination: The case of Kruger, Panorama and Lowveld areas in Mpumalanga Province. Int. J. Tour. Cities 2020, 6, 953–973. [Google Scholar] [CrossRef]
- Perera, G.; Sprechmann, M.; Bourel, M. Benefit segmentation of a summer destination in Uruguay: A clustering and classification approach. J. Tour. Anal. 2020, 27, 185–206. [Google Scholar] [CrossRef]
- Benevolo, C.; Spinelli, R. Benefit segmentation of pleasure boaters in Mediterranean marinas: A proposal. Int. J. Tour. Res. 2021, 23, 134–145. [Google Scholar] [CrossRef]
- Derek, M.; Woźniak, E.; Kulczyk, S. Clustering nature-based tourists by activity. Social, economic and spatial dimensions. Tour. Manag. 2019, 75, 509–521. [Google Scholar] [CrossRef]
- Huang, R.; Sarigollu, E. Benefit Segmentation of Tourists to the Caribbean. J. Int. Consum. Mark. 2008, 20, 67–83. [Google Scholar] [CrossRef]
- Kastenholz, E.; Davis, D.; Paul, G. Segmenting Tourism in Rural Areas: The Case of North and Central Portugal. J. Travel Res. 1999, 37, 353–363. [Google Scholar] [CrossRef]
- Sangpikul, A. A factor-cluster analysis of tourist motivations: A case of U.S. senior travelers. Tourism 2008, 56, 23–40. [Google Scholar]
- Vijverberg, J.; Sibbing, F.A.; Dejen, E. Lake Tana: Source of the Blue Nile. In The Nile: Origin, Environments, Limnology and Human Use; Dumont, H.J., Ed.; Springer Science & Business Media: Dordrecht, The Nertherlands, 2009; Volume 89, pp. 163–192. [Google Scholar]
- Cho, B.-H. Segmenting the Younger Korean Tourism Market: The Attractiveness of Australia as a Holiday Destination. J. Travel Tour. Mark. 1998, 7, 1–19. [Google Scholar] [CrossRef]
- Almeida, A.M.M.; Correia, A.; Pimpão, A. Segmentation by benefits sought: The case of rural tourism in Madeira. Curr. Issues Tour. 2014, 17, 813–831. [Google Scholar] [CrossRef]
- Sung, Y.-K.; Chang, K.-C.; Sung, Y.-F. Market Segmentation of International Tourists Based on Motivation to Travel: A Case Study of Taiwan. Asia Pac. J. Tour. Res. 2016, 21, 862–882. [Google Scholar] [CrossRef]
- Varmazyari, H.; Babaei, M.; Vafadari, K.; Imani, B. Motive-based segmentation of tourists in rural areas: The case of Maragheh, East Azerbaijan, Iran. Int. J. Tour. Sci. 2017, 17, 316–331. [Google Scholar] [CrossRef]
- Mgxekwa, B.B.; Scholtz, M.; Saayman, M. A typology of memorable experience at Nelson Mandela heritage sites. J. Heritage Tour. 2019, 14, 325–339. [Google Scholar] [CrossRef]
- Hair, J.F.; Black, W.C.; Babin, B.J.; Anderson, R.E. Multivariate Data Analysis, 8th ed.; Cengage Learning: Andover, UK, 2019. [Google Scholar]
- Brown, T.A. Confirmatory Factor Analysis for Applied Research, 2nd ed.; Guilford Press: New York, NY, USA, 2006. [Google Scholar]
- Korkmaz, S.; Goksuluk, D.; Zararsiz, G. MVN: An R Package for Assessing Multivariate Normality. R J. 2014, 6, 151–162. [Google Scholar] [CrossRef] [Green Version]
- Watkins, M.W. A Step-by-Step Guide to Exploratory Factor Analysis with R and RStudio; Routledge: New York, NY, USA, 2020. [Google Scholar] [CrossRef]
- Santos, F. Modern methods for old data: An overview of some robust methods for outliers detection with applications in osteology. J. Archaeol. Sci. Rep. 2020, 32, 102423. [Google Scholar] [CrossRef]
- Watkins, M.W. Exploratory Factor Analysis: A Guide to Best Practice. J. Black Psychol. 2018, 44, 219–246. [Google Scholar] [CrossRef]
- Baglin, J. Improving your exploratory factor analysis for ordinal data: A demonstration using FACTOR. Pract. Assess. Res. Eval. 2014, 19, 5. [Google Scholar]
- Garrido, L.E.; Abad, F.J.; Ponsoda, V. A new look at Horn’s parallel analysis with ordinal variables. Psychol. Methods 2013, 18, 454–474. [Google Scholar] [CrossRef] [Green Version]
- Holgado–Tello, F.P.; Chacón–Moscoso, S.; Barbero–García, I.; Vila–Abad, E. Polychoric versus Pearson correlations in exploratory and confirmatory factor analysis of ordinal variables. Qual. Quant. 2010, 44, 153–166. [Google Scholar] [CrossRef]
- Şimşek, G.G.; Noyan, F. Structural equation modeling with ordinal variables: A large sample case study. Qual. Quant. 2012, 46, 1571–1581. [Google Scholar] [CrossRef]
- Fabrigar, L.R.; Wegener, D.T.; MacCallum, R.C.; Strahan, E.J. Evaluating the use of exploratory factor analysis in psychological research. Psychol. Methods 1999, 4, 272–299. [Google Scholar] [CrossRef]
- Revelle, W. How to: Use the Pysch Packkage for Factor Analysys and Data Reduction. 2020. Available online: https://cran.r-project.org/web/packages/psychTools/vignettes/factor.pdf (accessed on 22 September 2021).
- Sugawara, E.; Nikaido, H. Properties of AdeABC and AdeIJK efflux systems of Acinetobacter baumannii compared with those of the AcrAB-TolC system of Escherichia coli. Antimicrob. Agents Chemother. 2014, 58, 7250–7257. [Google Scholar] [CrossRef] [Green Version]
- Fabrigar, L.R.; Wegener, D.T. Exploratory Factor Analysis; Oxford University Press: New York, NY, USA, 2012. [Google Scholar]
- Gaskin, C.J.; Happell, B. On exploratory factor analysis: A review of recent evidence, an assessment of current practice, and recommendations for future use. Int. J. Nurs. Stud. 2014, 51, 511–521. [Google Scholar] [CrossRef]
- Patel, A.; Singh, P. New Approach for K-Mean and K-Medoids Medoids Algorithm. Int. J. Comput. Appl. Technol. Res. 2013, 2, 1–5. [Google Scholar] [CrossRef]
- Lopes, H.E.G.; Gosling, M.D.S. Cluster Analysis in Practice: Dealing with Outliers in Managerial Research. Rev. Adm. Contemp. 2021, 25, 1–19. [Google Scholar] [CrossRef]
- Pham, D.T.; Dimov, S.S.; Nguyen, C.D. Selection of K in K-means clustering. Proc. Inst. Mech. Eng. Part C J. Mech. Eng. Sci. 2005, 219, 103–119. [Google Scholar] [CrossRef] [Green Version]
- Kassambara, A. Practical Guide to Cluster Analysis in R: Unsupervised Machine Learning; STHDA: Montpellier, France, 2017; Volume 1. [Google Scholar]
- Almahri, F.A.A.J.; Bell, D.; Arzoky, M. Personas Design for Conversational Systems in Education. Informatics 2019, 6, 46. [Google Scholar] [CrossRef] [Green Version]
- Hung, P.D.; Ngoc, N.D.; Hanh, T.D. K-Means Clustering Using R A Case Study of Market Segmentation. In Proceedings of the 2019 5th International Conference on E-Business and Applications, Bangkok, Thailand, 25–28 February 2019; pp. 100–104. [Google Scholar] [CrossRef]
- Kovács, L.; Iantovics, L.B.; Iakovidis, D.K. IntraClusTSP-An Incremental Intra-Cluster Refinement Heuristic Algorithm for Symmetric Travelling Salesman Problem. Symmetry 2018, 10, 663. [Google Scholar] [CrossRef] [Green Version]
- Charrad, M.; Ghazzali, N.; Boiteau, V.; Niknafs, A. NbClust: An R Package for Determining the Relevant Number of Clusters in a Data Set. J. Stat. Softw. 2014, 61, 1–36. [Google Scholar] [CrossRef] [Green Version]
- Lang, C.T.; O’Leary, J.T. Motivation, participation, and preference: A multi -segmentation approach of the Australian nature travel market. J. Travel Tour. Mark. 1997, 6, 159–180. [Google Scholar] [CrossRef]
- Galloway, G. Psychographic segmentation of park visitor markets: Evidence for the utility of sensation seeking. Tour. Manag. 2002, 23, 581–596. [Google Scholar] [CrossRef]
- Konu, H.; Kajala, L. Segmenting Protected Area Visitors Based on Their Motivations; Nature Protection Publications of Metsähallitus. Series A 194 (Issue Series A 194). 2012. Available online: https://julkaisut.metsa.fi/assets/pdf/lp/Asarja/a194.pdf (accessed on 14 April 2021).
- Smith, A.J.; Tuffin, M.; Taplin, R.H.; Moore, S.A.; Tonge, J. Visitor segmentation for a park system using research and managerial judgement. J. Ecotourism 2014, 13, 93–109. [Google Scholar] [CrossRef]
- Beh, A.; Bruyere, B.L. Segmentation by visitor motivation in three Kenyan national reserves. Tour. Manag. 2007, 28, 1464–1471. [Google Scholar] [CrossRef]
- Fung, C.K.W.; Jim, C.Y. Segmentation by motivation of Hong Kong Global Geopark visitors in relation to sustainable nature-based tourism. Int. J. Sustain. Dev. World Ecol. 2015, 22, 76–88. [Google Scholar] [CrossRef]
- Drápela, E.; Boháč, A.; Böhm, H.; Zágoršek, K. Motivation and Preferences of Visitors in the Bohemian Paradise Unesco Global Geopark. Geosciences 2021, 11, 116. [Google Scholar] [CrossRef]
- Tan, A.Y.F.; Lo, A.S.Y. A Benefit-Based Approach To Market Segmentation: A Case Study of an American Specialty Coffeehouse Chain in Hong Kong. J. Hosp. Tour. Res. 2008, 32, 342–362. [Google Scholar] [CrossRef]
- Williams, F. Safeguarding Geoheritage in Ethiopia: Challenges Faced and the Role of Geotourism. Geoheritage 2020, 12, 31. [Google Scholar] [CrossRef]
- Gardiner, S.; Scott, N. Destination Innovation Matrix: A framework for new tourism experience and market development. J. Destin. Mark. Manag. 2018, 10, 122–131. [Google Scholar] [CrossRef]
- Benur, A.M.; Bramwell, B. Tourism product development and product diversification in destinations. Tour. Manag. 2015, 50, 213–224. [Google Scholar] [CrossRef]


| Author/s, Year a | Research Objective (and Method/Data Source) | Segmentation Variables/Base | Segments |
|---|---|---|---|
| Gorman [7] | Landscape and geotourism: market typologies and visitor needs (conceptual) | Duration of stay, level of involvement and experience |
|
| Hose [23] | Analyzing geotourism provision and management issues in Almeria (perhaps conceptual typology) | Not clearly mentioned |
|
| Kim et al. [24] | Characterizing and segmenting cave tourists (survey of 537 tourists) | Motivation |
|
| Grant, 2010, as cited in Dowling [25] | Toward a typology of visitors to geosites (details about the methodology could not be found) | Relationship between entertainment and complexity of interpretative tools; interest and previous knowledge; goal of geosite visits |
|
| Kim and Brown [26] | Examining the profile of visitors traveling to a geotourism destination (164 domestic and international visitors) | The preferred demand for potential geotourism activities |
|
| Hurtado et al. [27] | Developing a geotourist typology model with a case study of cave visitors (119 visitors, on-site self-administered survey) | Motivation (low to very high) and experience outcomes (negative versus positive) |
|
| Timčák et al. [28] | Wellness and relaxation in geotourism (conceptual typology) | Based on operational definition of geotourism b |
|
| Prendivoj [29] | Tailoring signs to engage two distinct types of geotourists to geological sites (conceptual) | Experience sought, characteristics, involvement, (un)organized group/independent travel, time spent |
|
| Vasiljević et al. [10] | Analyzing attitudes and behavior of visitors of National Park Fruška Gora (196 visitors, online survey) | Attitude (and habit) |
|
| Allan and Shavanddasht [30] | Segmenting rural geotourists by motivation on weekends and weekdays (300 weekday and 300 weekend visitors; on-site, self-administered questionnaire) | Motivation (pull and push) |
|
| Variable | Variable Class | Code | Variable | Variable Class | Code |
|---|---|---|---|---|---|
| Gender | Male | 0 | Length of stay in Bahir Dar | 1 night | 1 |
| Female | 1 | 2 nights | 2 | ||
| Age | 18–24 | 1 | 3 nights | 3 | |
| 25–34 | 2 | 4 or more nights | 4 | ||
| 35–44 | 3 | Primary interest in geology/landscape | No | 0 | |
| 45–54 | 4 | Yes | 1 | ||
| 55–64 | 5 | No. of places visited | Numeric | 1–10 | |
| 65 and above | 6 | ||||
| Education | Diploma or below | 1 | Visited Lake Tana and Blue Nile Falls only | No | 0 |
| Bachelors | 2 | Yes | 1 | ||
| Postgraduate | 3 | Geotourism centrality | Not important | 1 | |
| Origin | Other | 1 | Slightly important | 2 | |
| Europe | 2 | Neutral | 3 | ||
| Ethiopia | 3 | Important | 4 | ||
| Visitor type | Domestic | 0 | Very important | 5 | |
| International | 1 | Read about the destination before travel | Not at all | 1 | |
| Companion | Alone | 1 | Very little | 2 | |
| Family | 2 | Little | 3 | ||
| Friend | 3 | Much | 4 | ||
| Traveling group | 4 | Very much | 5 | ||
| Number of adults in the travel group | Alone | 1 | Overall satisfaction with the visit | Very dissatisfied | 1 |
| Group with 2 members | 2 | Dissatisfied | 2 | ||
| Gr. with 3–9 members | 3 | Unsure | 3 | ||
| Gr. with 10–24 members | 4 | Satisfied | 4 | ||
| Gr. with 25 and above | 5 | Very satisfied | 5 | ||
| Traveling with children | No | 0 | Stay extension | Very unlikely | 1 |
| Yes | 1 | Unlikely | 2 | ||
| Transport mode to Bahir Dar | Public transport | 1 | Neutral | 3 | |
| Tour car | 2 | Likely | 4 | ||
| Airplane | 3 | Very likely | 5 | ||
| Visit reason | Nonleisure | 0 | Recommend that other people visit the destination | Very unlikely | 1 |
| Leisure | 1 | Unlikely | 2 | ||
| Visit frequency | 1st time | 0 | Neutral | 3 | |
| Repeat | 1 | Likely | 4 | ||
| Travel arrangement | Self-arranged | 0 | Very likely | 5 | |
| Tour company | 1 |
| Author/s a, Year | Segmentation b; and Its Base | Segment Found | Similar Segment in Our Study | Similarity |
|---|---|---|---|---|
| Lang and O’Leary [76] | 850 Australian nature travelers; motivations, activity participation, and destination preferences | Physical-challenge seekers | Activity–Nature Lovers | Physical challenge, nature and related activities |
| Galloway [77] | 9495 tourists to parks in Ontario, Canada; motivations | Active enjoyment of nature | Motivation | |
| Konu & Kajala [78] | 34,868 tourists to protected areas in Finland; motivations | Nature-oriented relaxation seekers | Motivation (nature experiences, scenery, relaxation) | |
| Smith et al. [79] | 3610 tourists to 33 parks in Western Australian protected area; psychographic and behavioral variables | Nature-experience seekers | Purpose of visit and activities undertaken | |
| Lang and O’Leary [76] | 850 Australian nature travelers; motivations, activity participation, and destination preferences | Culture and entertainment seekers | Culture Lovers | Interest in cultural attractions and entertainment |
| Lang and O’Leary’s [76] | 850 Australian nature travelers; motivations, activity participation, and destination preferences | Nature tourists | Nature–Culture Lovers | Natural and cultural attractions |
| Beh and Bruyere [80] | 465 tourists to national reserves in Kenya; motivation | Learners | Interest (culture and nature) | |
| Allan and Shavanddasht [30] | 300 rural weekday geotourists; motivation | Historical and geological-attraction seekers | Interest in historical and geological attractions | |
| Nduna and van Zyl [40] | 400 tourists to a nature-based destination in South Africa; benefits sought | Cultured–naturist | Interest (culture and nature) | |
| Kastenholz et al. [45] | 200 tourists to rural areas in Portugal; benefits | Want-It-All ruralists | Want-It-Alls | Interest in various benefits, young |
| Frochot [34] | 734 tourists to rural areas in Scotland; benefits sought | Actives | All benefits at the destination, younger | |
| Almeida et al. [49] | 170 rural tourists in Madeira, Portugal; benefits sought | Want-It-Alls | Interest in all activities | |
| Fung and Jim [81] | 647 Hong Kong Global Geopark visitors; motivations | Want-It-Alls | Motivated by all benefits | |
| Drápela et al. [82] | 556 tourists to a UNESCO Global Geopark; preferences for different types of attractions | Cluster 2 | Interest in all attractions |
Publisher’s Note: MDPI stays neutral with regard to jurisdictional claims in published maps and institutional affiliations. |
© 2022 by the authors. Licensee MDPI, Basel, Switzerland. This article is an open access article distributed under the terms and conditions of the Creative Commons Attribution (CC BY) license (https://creativecommons.org/licenses/by/4.0/).
Share and Cite
Tessema, G.A.; van der Borg, J.; Van Rompaey, A.; Van Passel, S.; Adgo, E.; Minale, A.S.; Asrese, K.; Frankl, A.; Poesen, J. Benefit Segmentation of Tourists to Geosites and Its Implications for Sustainable Development of Geotourism in the Southern Lake Tana Region, Ethiopia. Sustainability 2022, 14, 3411. https://doi.org/10.3390/su14063411
Tessema GA, van der Borg J, Van Rompaey A, Van Passel S, Adgo E, Minale AS, Asrese K, Frankl A, Poesen J. Benefit Segmentation of Tourists to Geosites and Its Implications for Sustainable Development of Geotourism in the Southern Lake Tana Region, Ethiopia. Sustainability. 2022; 14(6):3411. https://doi.org/10.3390/su14063411
Chicago/Turabian StyleTessema, Getaneh Addis, Jan van der Borg, Anton Van Rompaey, Steven Van Passel, Enyew Adgo, Amare Sewnet Minale, Kerebih Asrese, Amaury Frankl, and Jean Poesen. 2022. "Benefit Segmentation of Tourists to Geosites and Its Implications for Sustainable Development of Geotourism in the Southern Lake Tana Region, Ethiopia" Sustainability 14, no. 6: 3411. https://doi.org/10.3390/su14063411
APA StyleTessema, G. A., van der Borg, J., Van Rompaey, A., Van Passel, S., Adgo, E., Minale, A. S., Asrese, K., Frankl, A., & Poesen, J. (2022). Benefit Segmentation of Tourists to Geosites and Its Implications for Sustainable Development of Geotourism in the Southern Lake Tana Region, Ethiopia. Sustainability, 14(6), 3411. https://doi.org/10.3390/su14063411