

Urban Scale Monitoring Approach for the Assessment of Rising Damp Effects in Venice

Department of Environmental Sciences, Informatics, Statistics, Università Ca’ Foscari, 30123 Venice, Italy
*
Author to whom correspondence should be addressed.
Sustainability 2023, 15(7), 6274; https://doi.org/10.3390/su15076274
Submission received: 17 February 2023
/
Revised: 31 March 2023
/
Accepted: 3 April 2023
/
Published: 6 April 2023
(This article belongs to the Special Issue New Sustainable Advances in Cultural Heritage Conservation and Archaeometry)
Abstract
:In coastal areas, the rising damp of salty water is a well-known degradation factor of historical masonries, leading to visible features such as crusts, masonry erosion, and plaster loss. Venetian masonries are strongly affected by decay caused by rising damp exacerbated by direct contact with salty water. Recurrent flooding due to high tides and an increase in the frequency of flooding events, also related to climate change, raises concern about the impacts. Although several studies have been carried out on probable future scenarios, a valuation of the decay risk due to rising damp at the urban level still needs to be implemented. This paper proposes a non-invasive and economically sustainable approach for evaluating rising damp effects at an urban scale. The approach includes a collection of archive images of masonries affected by rising damp dating back to the 1990s; a visual survey of the actual conservation state of masonries; a classification based on significant descriptors; and a discussion on exposure conditions and conservation states. The descriptors chosen are rising damp levels, biological growth, plaster loss, efflorescence, and brick erosion. The evaluation was implemented in a georeferenced system suitable for future comparisons, thus providing a management tool for the city’s preservation.
1. Introduction
Monitoring is one of the most important instruments for preserving architectural heritage. The evaluation of a building’s conservation state, the durability of restoration and maintenance interventions, through a reliable and easy-to-use scientific methodology is doubtless crucial for the future preservation of buildings and for a cost-effective strategy. Generally, monitoring of building façades focuses on single case studies, often related to specific aspects (e.g., evaluation of surface permeability, discoloration, intervention durability). The results are therefore difficult to be applied to other assets. Our approach proposes a broader perspective connected to the urban scale and the surrounding environment for defining early-warning decay indicators that can be applied to coastal areas.
In coastal areas, the rising effect of salty water is a well-known decay factor that affects masonries, leading to visible features such as masonry erosion, plaster loss, and biological growth [1,2,3,4,5]. Rising damp is a process characterized by a complex dynamic wherein the height reached by the waterfront depends on the equilibrium between rising damp and water evaporation from the surface. Both aspects are determined by numerous intrinsic factors (e.g., porosity and composition) and extrinsic environmental factors [6,7,8,9]. Commonly, salty water carries soluble salts through the wet lower part of the wall to the evaporation area where the equilibrium between capillary flux from the underneath water reservoir and evaporation flux from the masonry surface is responsible for salt precipitation. Soluble salt crystallization causes powdering; crumbling; detachments of brick elements and plasters; low durability of conservation interventions; and, consequently, high maintenance costs.
Historical Venetian buildings represent a significant case study to develop a sustainable methodology for monitoring rising damp effects based on the definition of materials behavior models at the urban level [10,11,12,13]. The recrudescence of high water due to city subsidence and marine eustatism, in relation also to global climate change, further raises concerns about the impact of rising damp on Venetian buildings [14,15,16,17]. Despite many studies on possible future scenarios on rising sea levels and flooding risks in terms of socio-economic relevance, a comprehensive risk assessment focused on seawater and its impacts on historical architectural surfaces still needs to be defined for Venice at an urban scale [11,12,18,19,20,21,22,23,24,25]. The impact and extension of rising damp on Venetian buildings have been traditionally assessed using invasive methodologies such as drilling powders from bricks at different heights, whose moisture content is then determined using the ponderal method [2,3,4]. The collection of a dataset of historical quantitative moisture content (MC%) in Venetian masonries and its statistical analysis was carried out by Falchi, et al. [2]. In Venice, an inverse relationship between MC% and height was found in respect to the local altimetric reference highlighting: the presence of wet masonries up to a high at 150–200 cm, an evaporation zone from 200 cm to 300 cm, and lower MC% values above 300 cm. The results pointed out a possible relation among the buildings’ altitude on the lagoon level and their distance from water. The moisture content is, nevertheless, also influenced by unpredictable and non-documented factors such as masonry structure and other decay phenomena. The MC% quantitative data available are, however, limited, and this approach is scarcely feasible for repeated monitoring considering its invasiveness.
Conservation authorities and stakeholders in Venice lack an easy and non-invasive methodology for mapping, at an urban scale, the rising damp impact and trend over time. An urban-scale approach is crucial for investing and implementing lagoon control strategies, such as the MOSE Dam and local barriers (e.g., in San Marco’s square) [24,26,27].
For architectural surfaces, a common approach for defining their conservation states consist of the production of decay maps based on visual surveys in accordance with specific norms [28,29]. Decay indexes are then associated based on an empirical parameterization of observed decay features [30,31,32,33,34]. This approach is quite convenient for investigating single or small groups of buildings, but it is difficult to apply at an urban scale due to issues related to time and available resources. Moreover, as this approach identifies decay patterns at a given time, it is trivial to extrapolate degradation trends. Nevertheless, the comparison between old and new pictures with deterioration maps could be a valuable system to evaluate decay trends on masonry. Camuffo and collaborators [35] proposed, for example, to evaluate the subsidence of Venetian buildings by comparing ancient paintings to their current state.
This research, developed within the Venezia 2021 Scientific Research Program for a Regulated Lagoon project led by Corila [36], evaluates the decay features caused by rising damp over 20 years (from 2000 to 2020) on Venetian buildings by comparing images belonging to a private archive. The conservation state of a few Venetian masonries selected from the archive is compared with current images considering decay features such as visible damp sharp fronts, presence of biological growth, plaster loss, efflorescence, and brick erosion. Within the archive, pictures of external full brick masonries were preferred; their position and altimetry were also acquired through open databases [37,38]. The evidence of maintenance intervention on the buildings was also considered. The comparison of recent and past images offered the possibility to evaluate the rising damp process over time, the impacts of interventions such as flood and embankments raising [9], and the entry into operation of the MOSE barriers [26,39].
2. Materials and Methods
Pictures belonging to the private archive of Mr. Giuseppe Pasqucci were employed to evaluate the impact and evolution of rising damp on Venetian buildings’ surfaces. The archive contains a miscellanea of pictures collected since the 1990s of Venetian buildings, images found in magazines, newspapers, and anecdotes about Venice divided according to sestieri (districts) and civic number. From the archive, only images of masonries showing visible decay patterns linked to rising damp were considered; images possibly showing building position (i.e., facing a calle or the water canal) were also considered.
Images were digitized with an HP Laser Jet Pro M428fdw multifunction printer at 300 dpi in full color. The digitized photos were compared with images of the same buildings taken between 2019 and 2022 with a Canon Power Shot 12 camera. The photos were taken in automatic mode, paying attention to capturing images as closely as possible to the ones of the archive to facilitate their comparison. The pictures were collected both on sunny and cloudy days. Rainy days were avoided since rising damp features, such as waterfront of rising damp and salt efflorescence, are not visible on such days. An on-site survey was conducted by heritage scientists and building conservators. The pictures were integrated with annotations including general observations such as classification of materials in terms of bricks, mortars, plasters, and their extension on the façade. Brick dimensions, masonry length, the height of the visible wet front due to rising damp, extension of eroded areas on the surfaces, and plaster detachments were noted with a measuring tape where this was possible. A scale was included in the pictures to be used for comparison.
Visual monitoring was performed on the same masonries after dry or wet periods to assess the visible variations due to climatic conditions. A set of pictures was taken after the exceptional flooding of November 2019 [40] and repeated in September 2022 after a long drought period that started in January 2022 [41].
A new dataset was then created with the archive and the recent pictures including masonry position (civic number, district, and geo-referenced data), altimetry (height based on local sea level as reference), the distance of the masonry from adjacent canals, and climatic information [37,42]. Exposure to direct sunlight and winds, as well as the masonries’ positions, might influence rising damp level. These factors can impact the water evaporation rate from the surfaces and the equilibrium reached by the damp front [8,9]. Altimetry and distance from canals might influence rising damp levels too. The major source affecting rising damp in Venice is, in fact, the lagoon water in the canals. Its presence and level impact the water uptake by capillarity and the entire rising damp process. Since the buildings rise at different heights on water, the altimetry level of each masonry was recorded according to the Ramses database created by Insula S.p.A [37]. The altimetry was based on a local sea level reference called “ZMPS”, i.e., the mean sea level on Punta della Salute measured in 1897. The ZMPS system was also used for calculating the local tidal height. For masonries facing canals, the altimetry was considered equal to 0 cm ZMPS. Regarding the location of the buildings, three main situations were described: directly in contact with the lagoon water, near channels over the embankment located 3–5 m from water, and in the internal area of Venice without direct contact with the lagoon
As previously stated, variations in the rising damp profile were assessed by comparing archive images with recent ones. To organize a significant description and comparison of current and past decay features, specific decay descriptors were defined and qualitatively evaluated. In the first phase of the research, five decay descriptors were chosen:
- Height of the rising damp sharp front on the masonry surface individuated according to differences in color saturation of the wet and dry areas of the wall. This was assessed first in situ in different points on the masonries with a measuring tape and then, by comparison, on the old pictures. In the old pictures, architectural features (columns, stone slabs, windows, etc.) present on the building helped with estimating the corresponding heights;
- Presence and distribution of salt efflorescences on masonries related to seawater;
- Plaster loss, either eroded or detached, due to the action of soluble salts whose extension were evaluated by in situ measurements of the façade and proportionally scaled on the old pictures;
- Height, extension, and distribution of brick erosion on the evaporation band due to salts. Erosion depth measurements were possible only for the on-site survey. The actual eroded area on the masonry surfaces was considered for comparison with old pictures.
- Height of the algal colonization, visible as a greenish band when low tides occur.
- Algal height, which is strictly affected by the increase in the mean sea level and, consequently, of the water reservoir.
These descriptors were qualitatively evaluated through heritage scientist and building conservators’ elicitation according to the following scale: increase (+, + +, + + +), decrease (−, − −, − − −), or stable situation (=); if a descriptor was non-comparable, the symbol / was used (e.g., if an algal band was not visible in a historical picture). The descriptors are all related to well-recognized effects of seawater rising damp processes. For this reason, all the descriptors were initially considered to gain a comprehensive vision of the phenomenon, further evaluated, and eventually discharged based on their evident relevance.
The dataset was integrated into a georeferenced system by using the QGIS software in order to obtain a dedicated tool for rising-damp-phenomenon management [43]. The masonries were located on a virtual Open Street map of Venice [38], and the altimetry curves collected as open data from the SMU website of the Municipality of Venice were also included as a polyline layer along with a layer for each descriptor. A recent picture of each building was also uploaded at the corresponding site points. The marks given to the descriptors’ variations were converted into a color system, e.g., red = major variation, yellow = minor variation, and green = no variation. Thus, a single map combined the altimetry of the masonry, the pictures collected, and the results of the comparison between old and new images. The maps are freely accessible online in the SOLVE system for a regulated Lagoon by CORILA [44], the entity for the coordination of the research regarding the lagoon of Venice, and are now at the disposal of the Municipality of Venice.
Finally, Statistica 8 software [45] was employed to statistically evaluate the dataset. ANOVA and regression tree analyses [46,47] aided in understanding possible data variations in relation to building altimetry (classes 0; 100–110; 110–120; 121–130; 131–140; and >140 cm on ZMPS) and building distance from water (0 = directly in contact; 1 = 1–5 m away; and 2 = >5 m from water). In the trees, built of leaves and branches, the leaves represent specific subsets of variable values and branches represent segments that connect the leave nodes. To estimate the regression tree model, leaves were created by recursively splitting the data on the predictor variables. In the regression tree built for the rising front variation, each branch connects nodes reporting the variation and the number of observations in that range.
3. Results
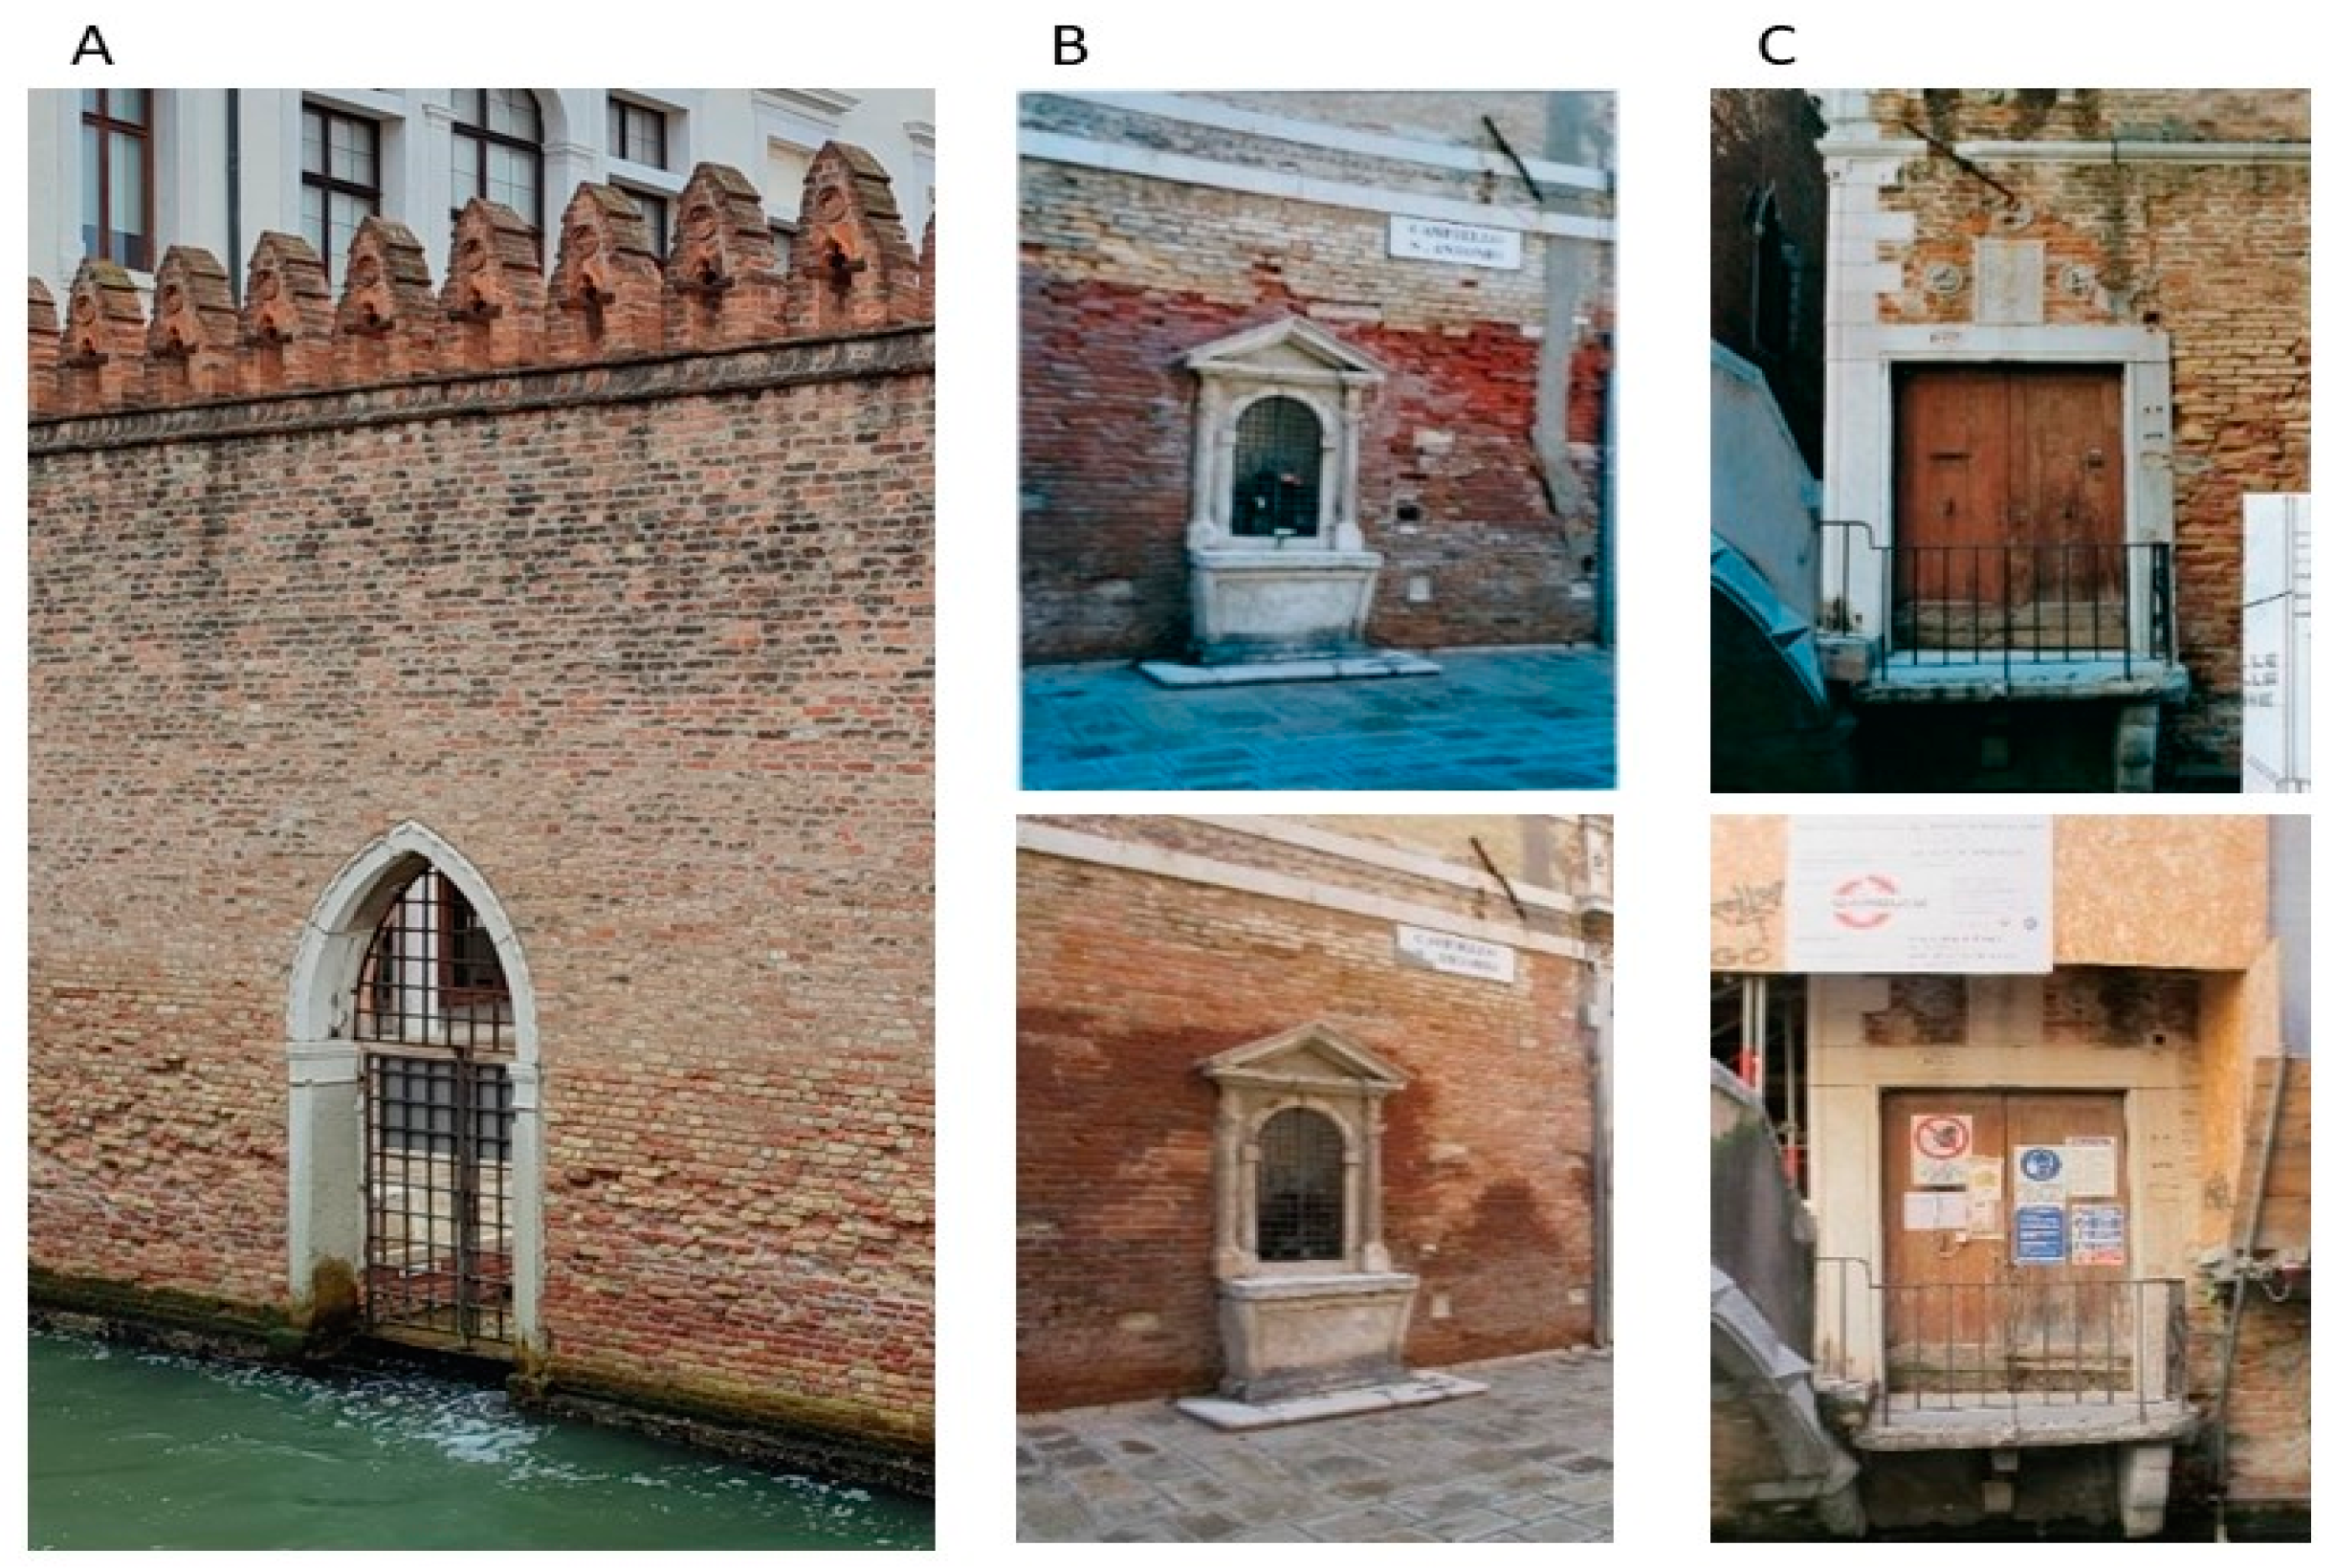
Out of 9475 sites described in the archive pages, only 575 cases have pictures of masonries where rising damp is clearly visible on masonries; the others report architectonical elements not useful or comprise low-quality photos. A recent building site inspection highlighted how several masonries were restored between the 1990s and 2020s (application of covering plasters, brick replacement, insertion of methods against rising damp, or covering with scaffolds). Thus, the rising damp phenomenon was perturbed and those buildings were discharged, reducing the number of feasible sites to 179. Figure 1 illustrates an example of masonry subjected to rising damp (Figure 1A) and some examples of buildings that were not considered.
Figure 1B,C are two examples of cases where the visual comparison with past pictures is impaired due to unknown restoration interventions; in Figure 1B, eroded bricks have been topped by new ones, and in Figure 1C, a new plaster covers the masonry.
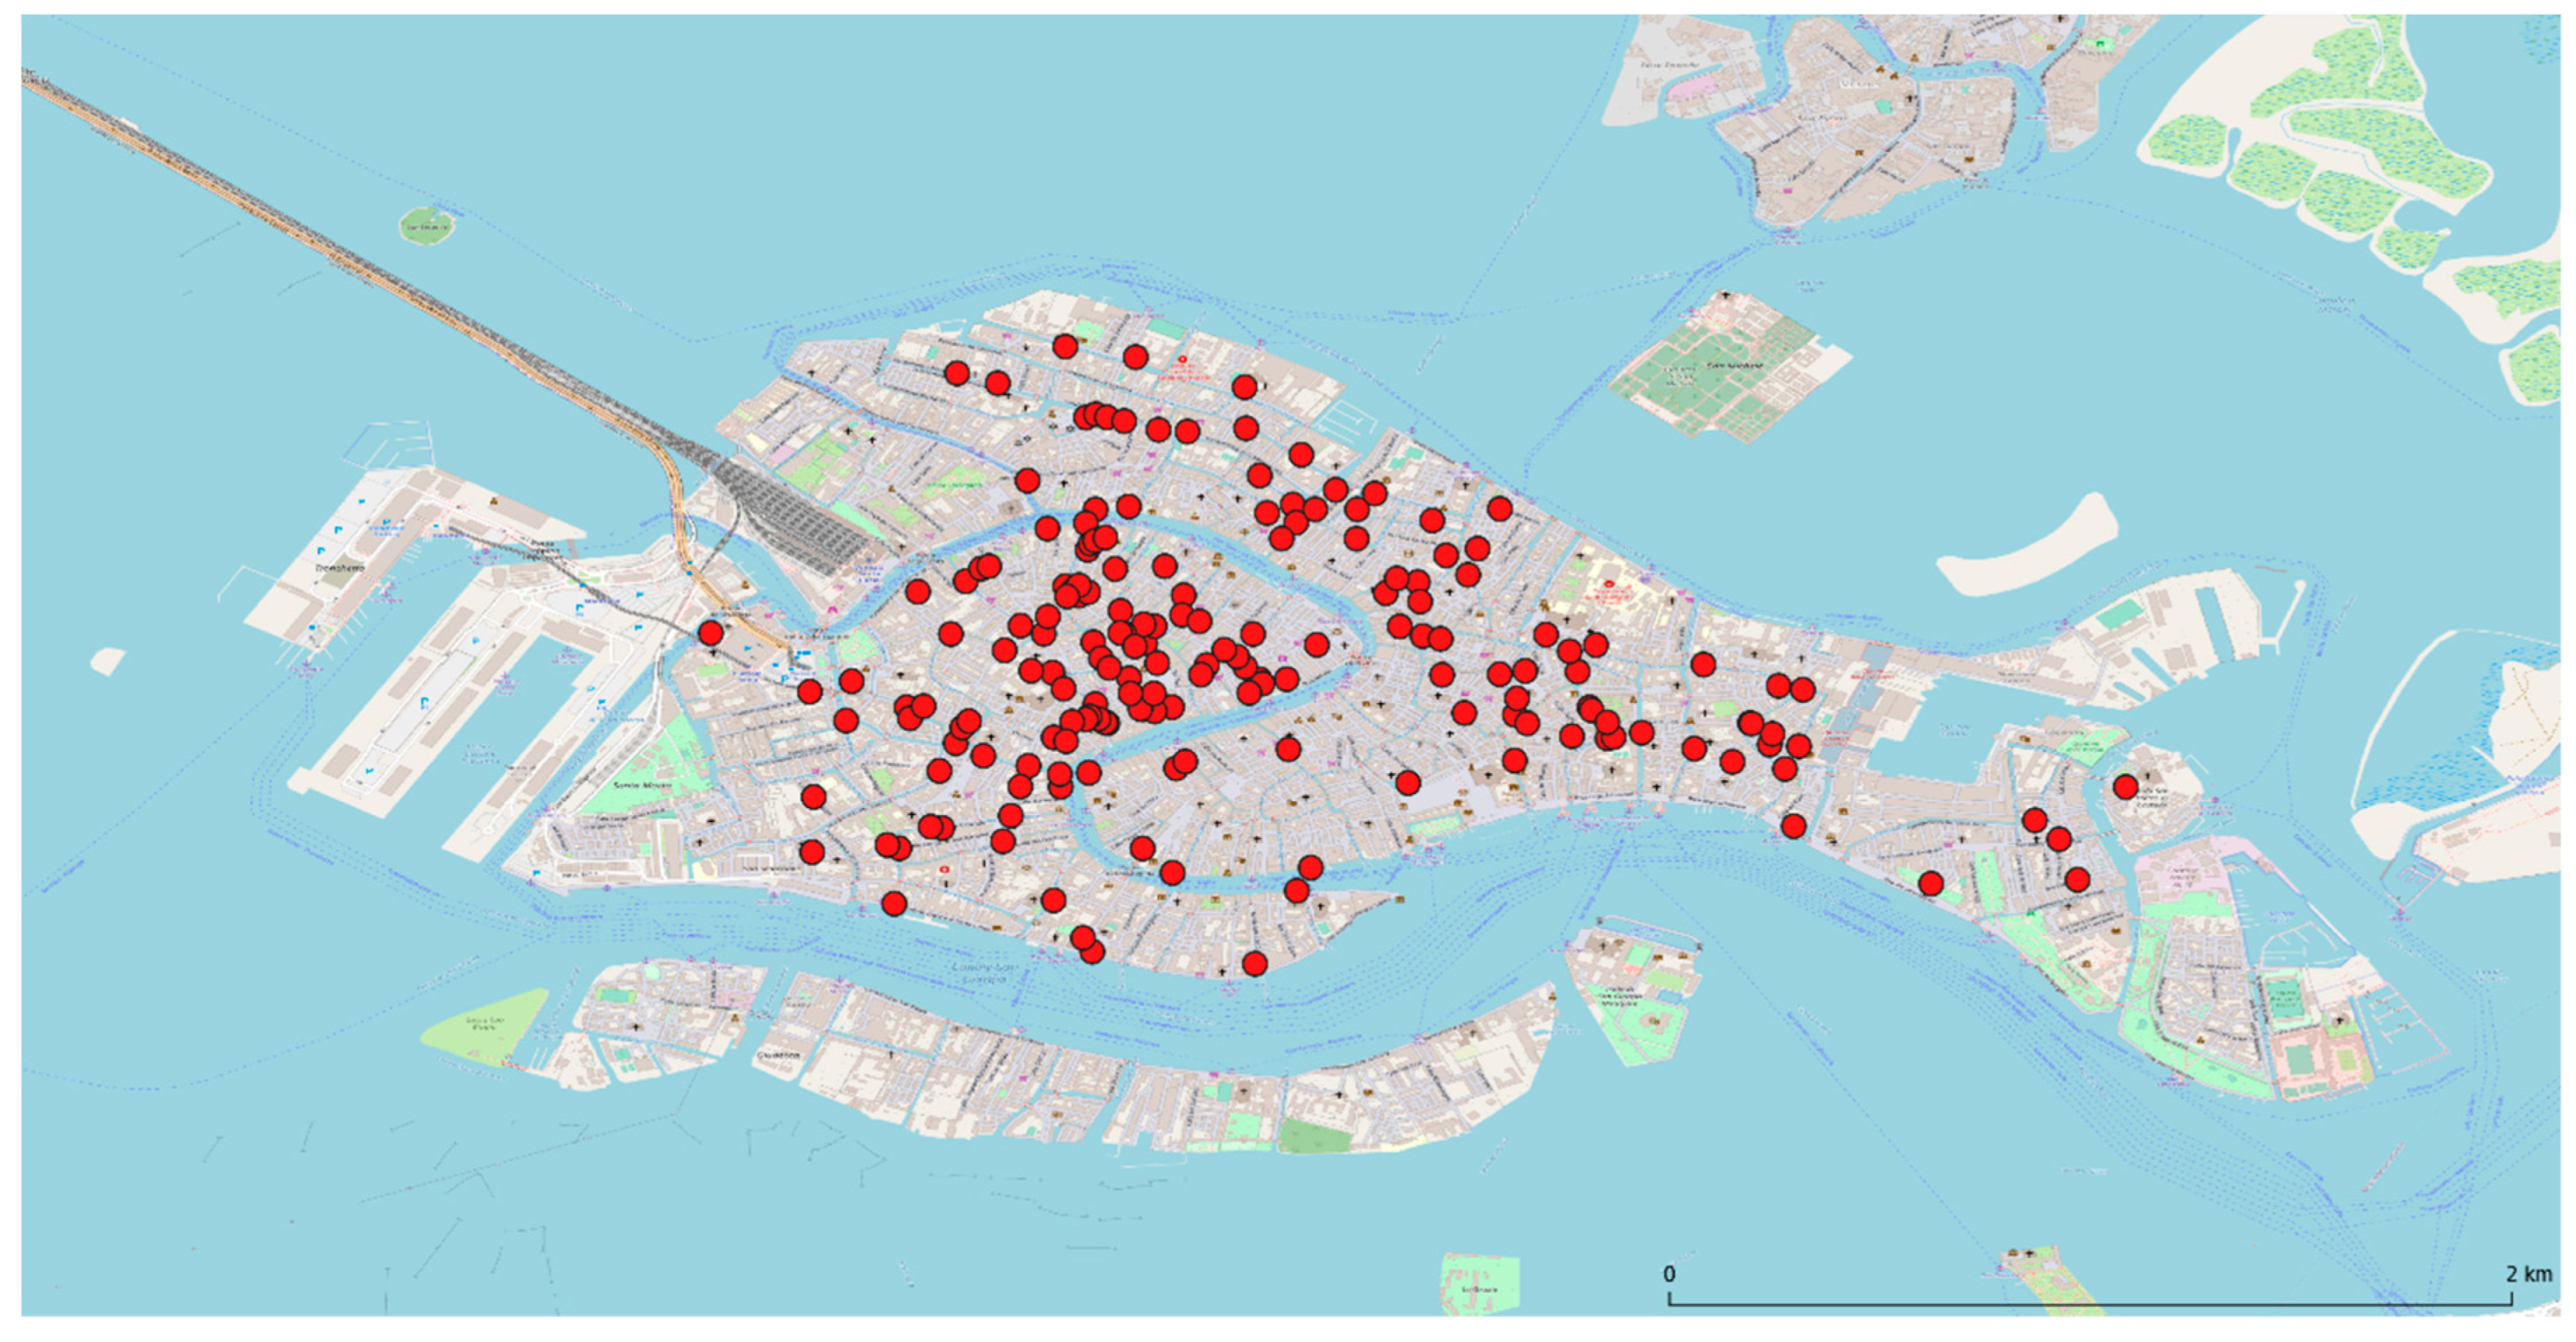
Figure 2 reports the position within the city of the feasible sites that were considered for the visual survey. The photos coming from this private archive did not homogenously cover all the city areas but were mainly concentrated in the historical districts of Dorsoduro and Santa Croce. Archive pictures of the main islands Giudecca (south), Murano (north), Tronchetto-San Basilio (west), Sant’ Elena (extreme east), and near San Marco square are unavailable or under-represented. Despite their possible relevance, these areas are characterized by newly constructed buildings (i.e., late 20th century constructions, as in Sant’Elena) often realized with non-permeable basements or membranes extensively affecting raising damp and far beyond the scope of the present work.
3.1. Descriptor Validation
The examination of the pictures collected in situ allowed for the identification of five relevant decay descriptors. As expected, the atmospheric conditions during photo shooting and the monitoring frequency might have affected the evaluation of the descriptors.
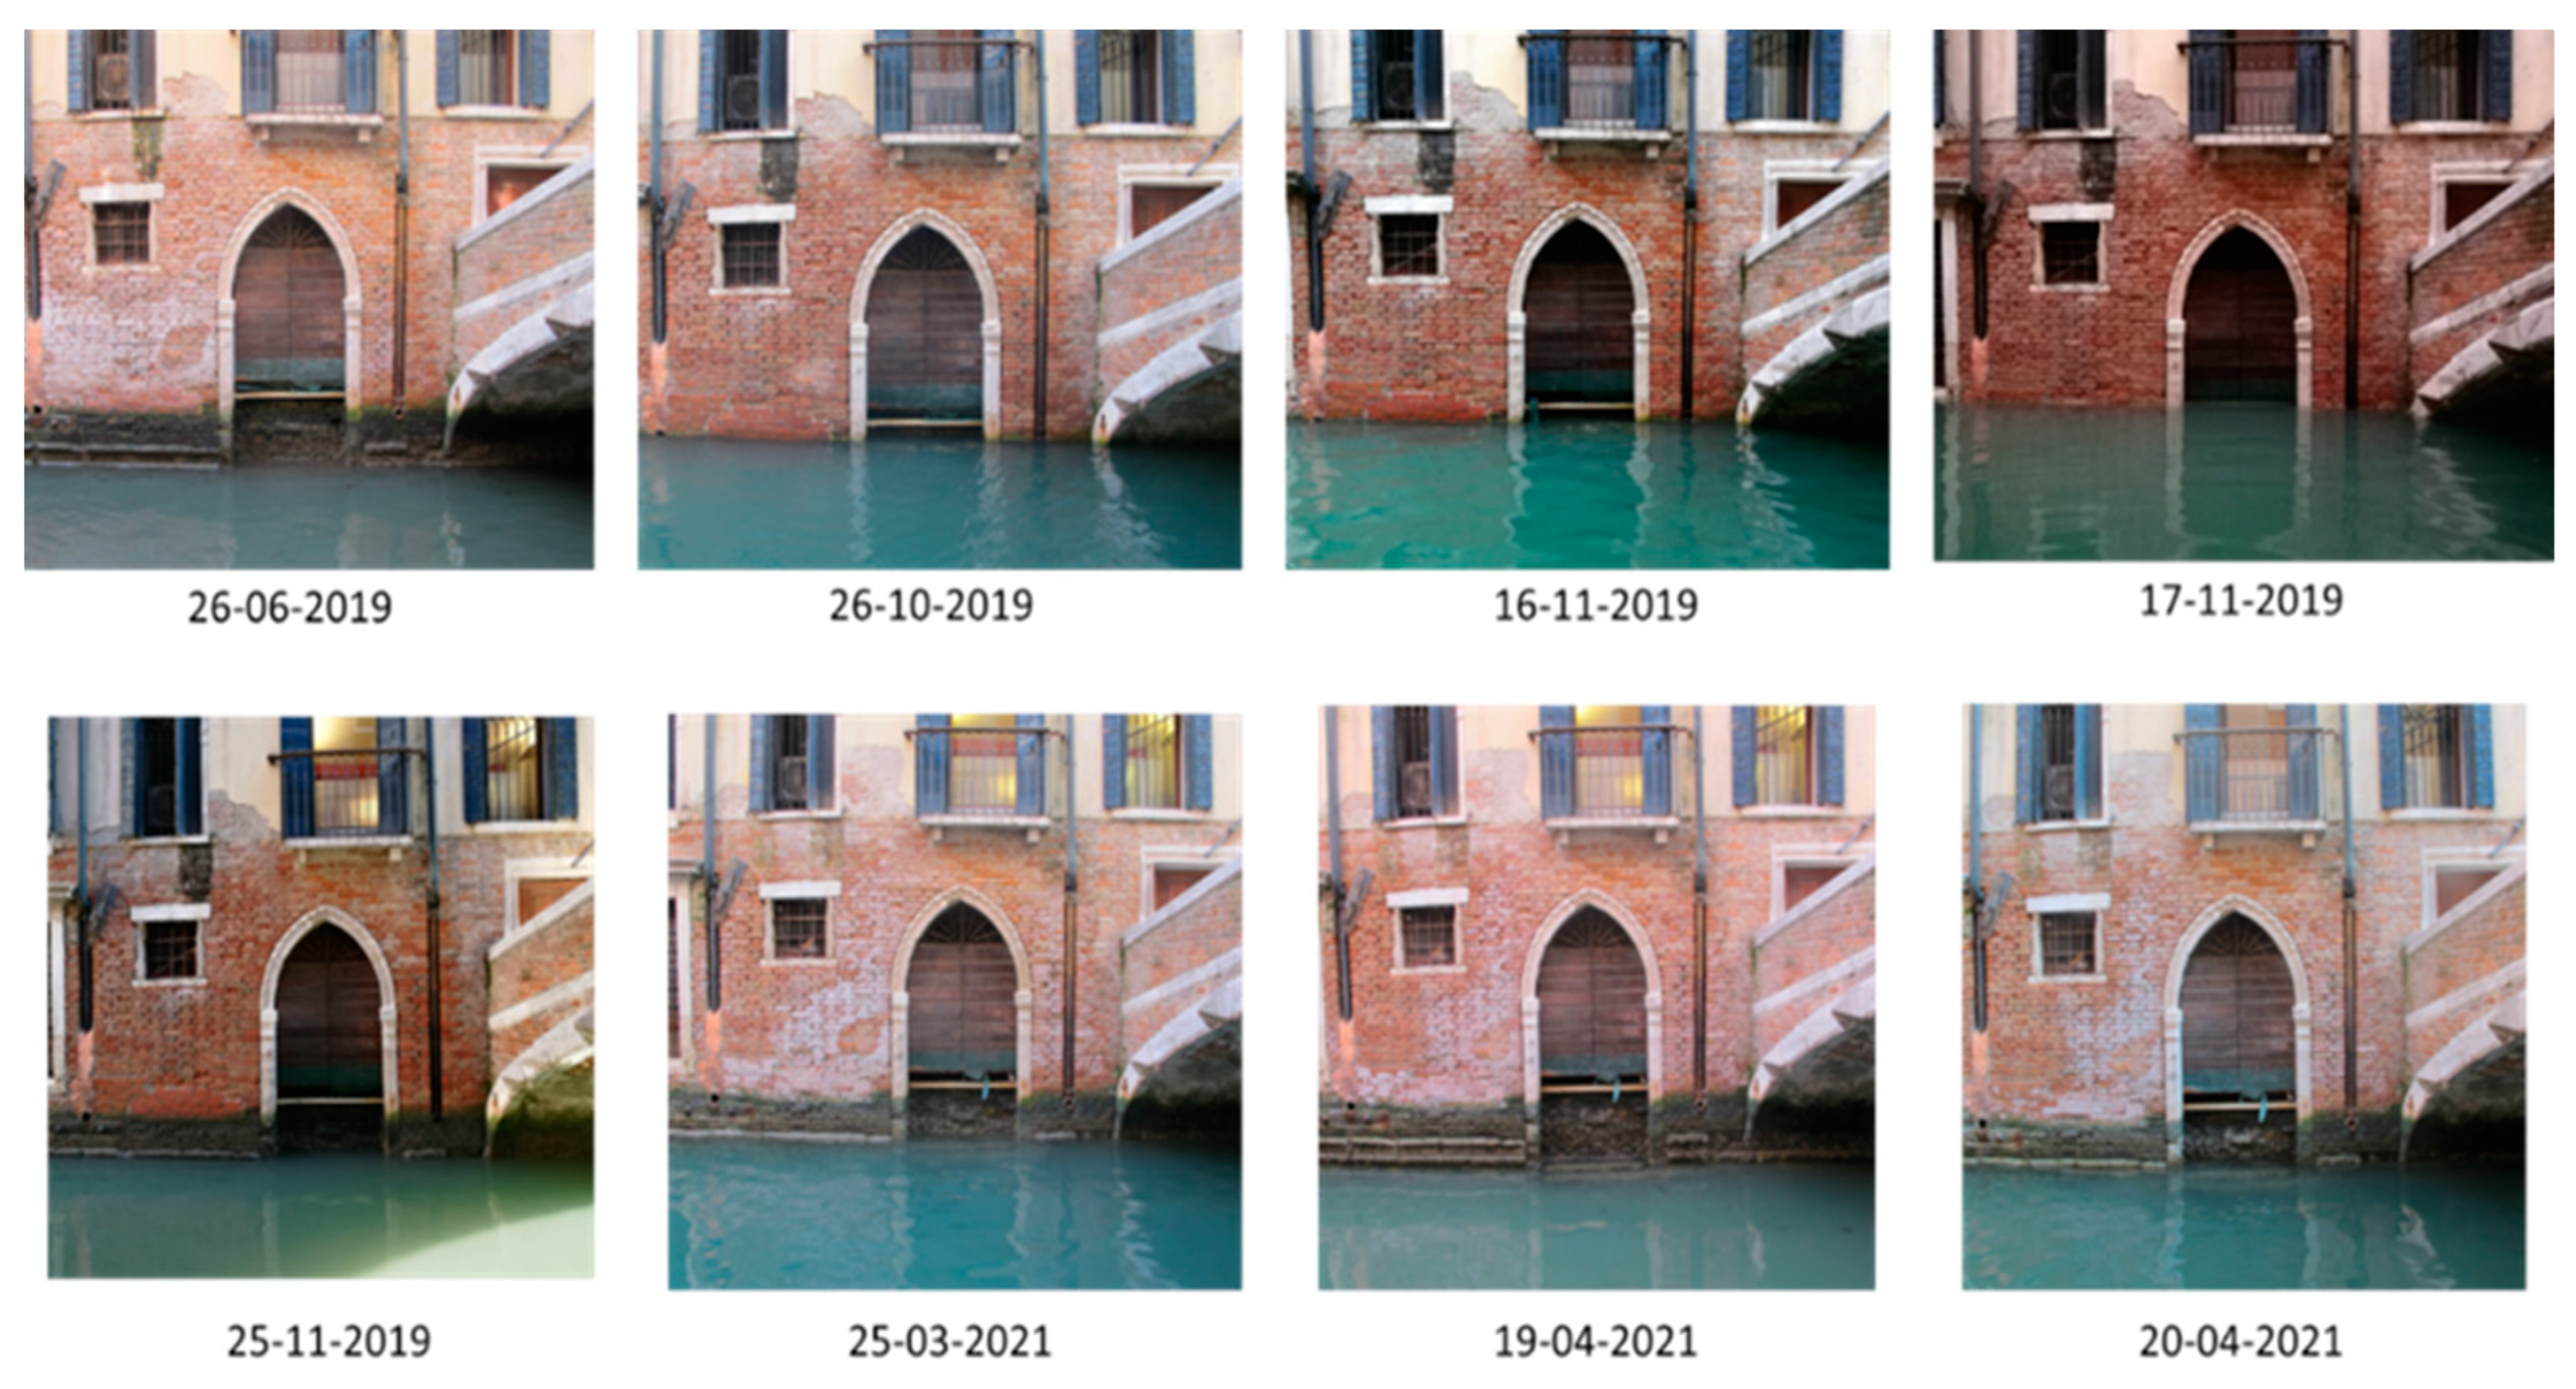
For example, the presence and extension of efflorescences were discovered to be subjective and variable. The visibility of salt efflorescences was influenced by concomitant atmospheric and thermo-hygrometric conditions. On wet or rainy days, hygroscopic and deliquescent salt crusts became transparent, but they were more visible in dry periods. Furthermore, efflorescence positions changed over time, caused by salts being easily transported by water. Figure 3 shows, as an example, a masonry in Rio dei Bareteri- San Marco depicting the variation in salt efflorescence visibility over time. In particular, the photos before (26 June 2019, 26 October 2019) and after (16, 17, 25 November 2019) the exceptional flooding of 2019, compared to the following spring and after a drought period, depict how the efflorescence visibility was variable and sensitive. For this reason, the presence and distribution of salt efflorescence was discharged as a significant descriptor for rising damp monitoring.
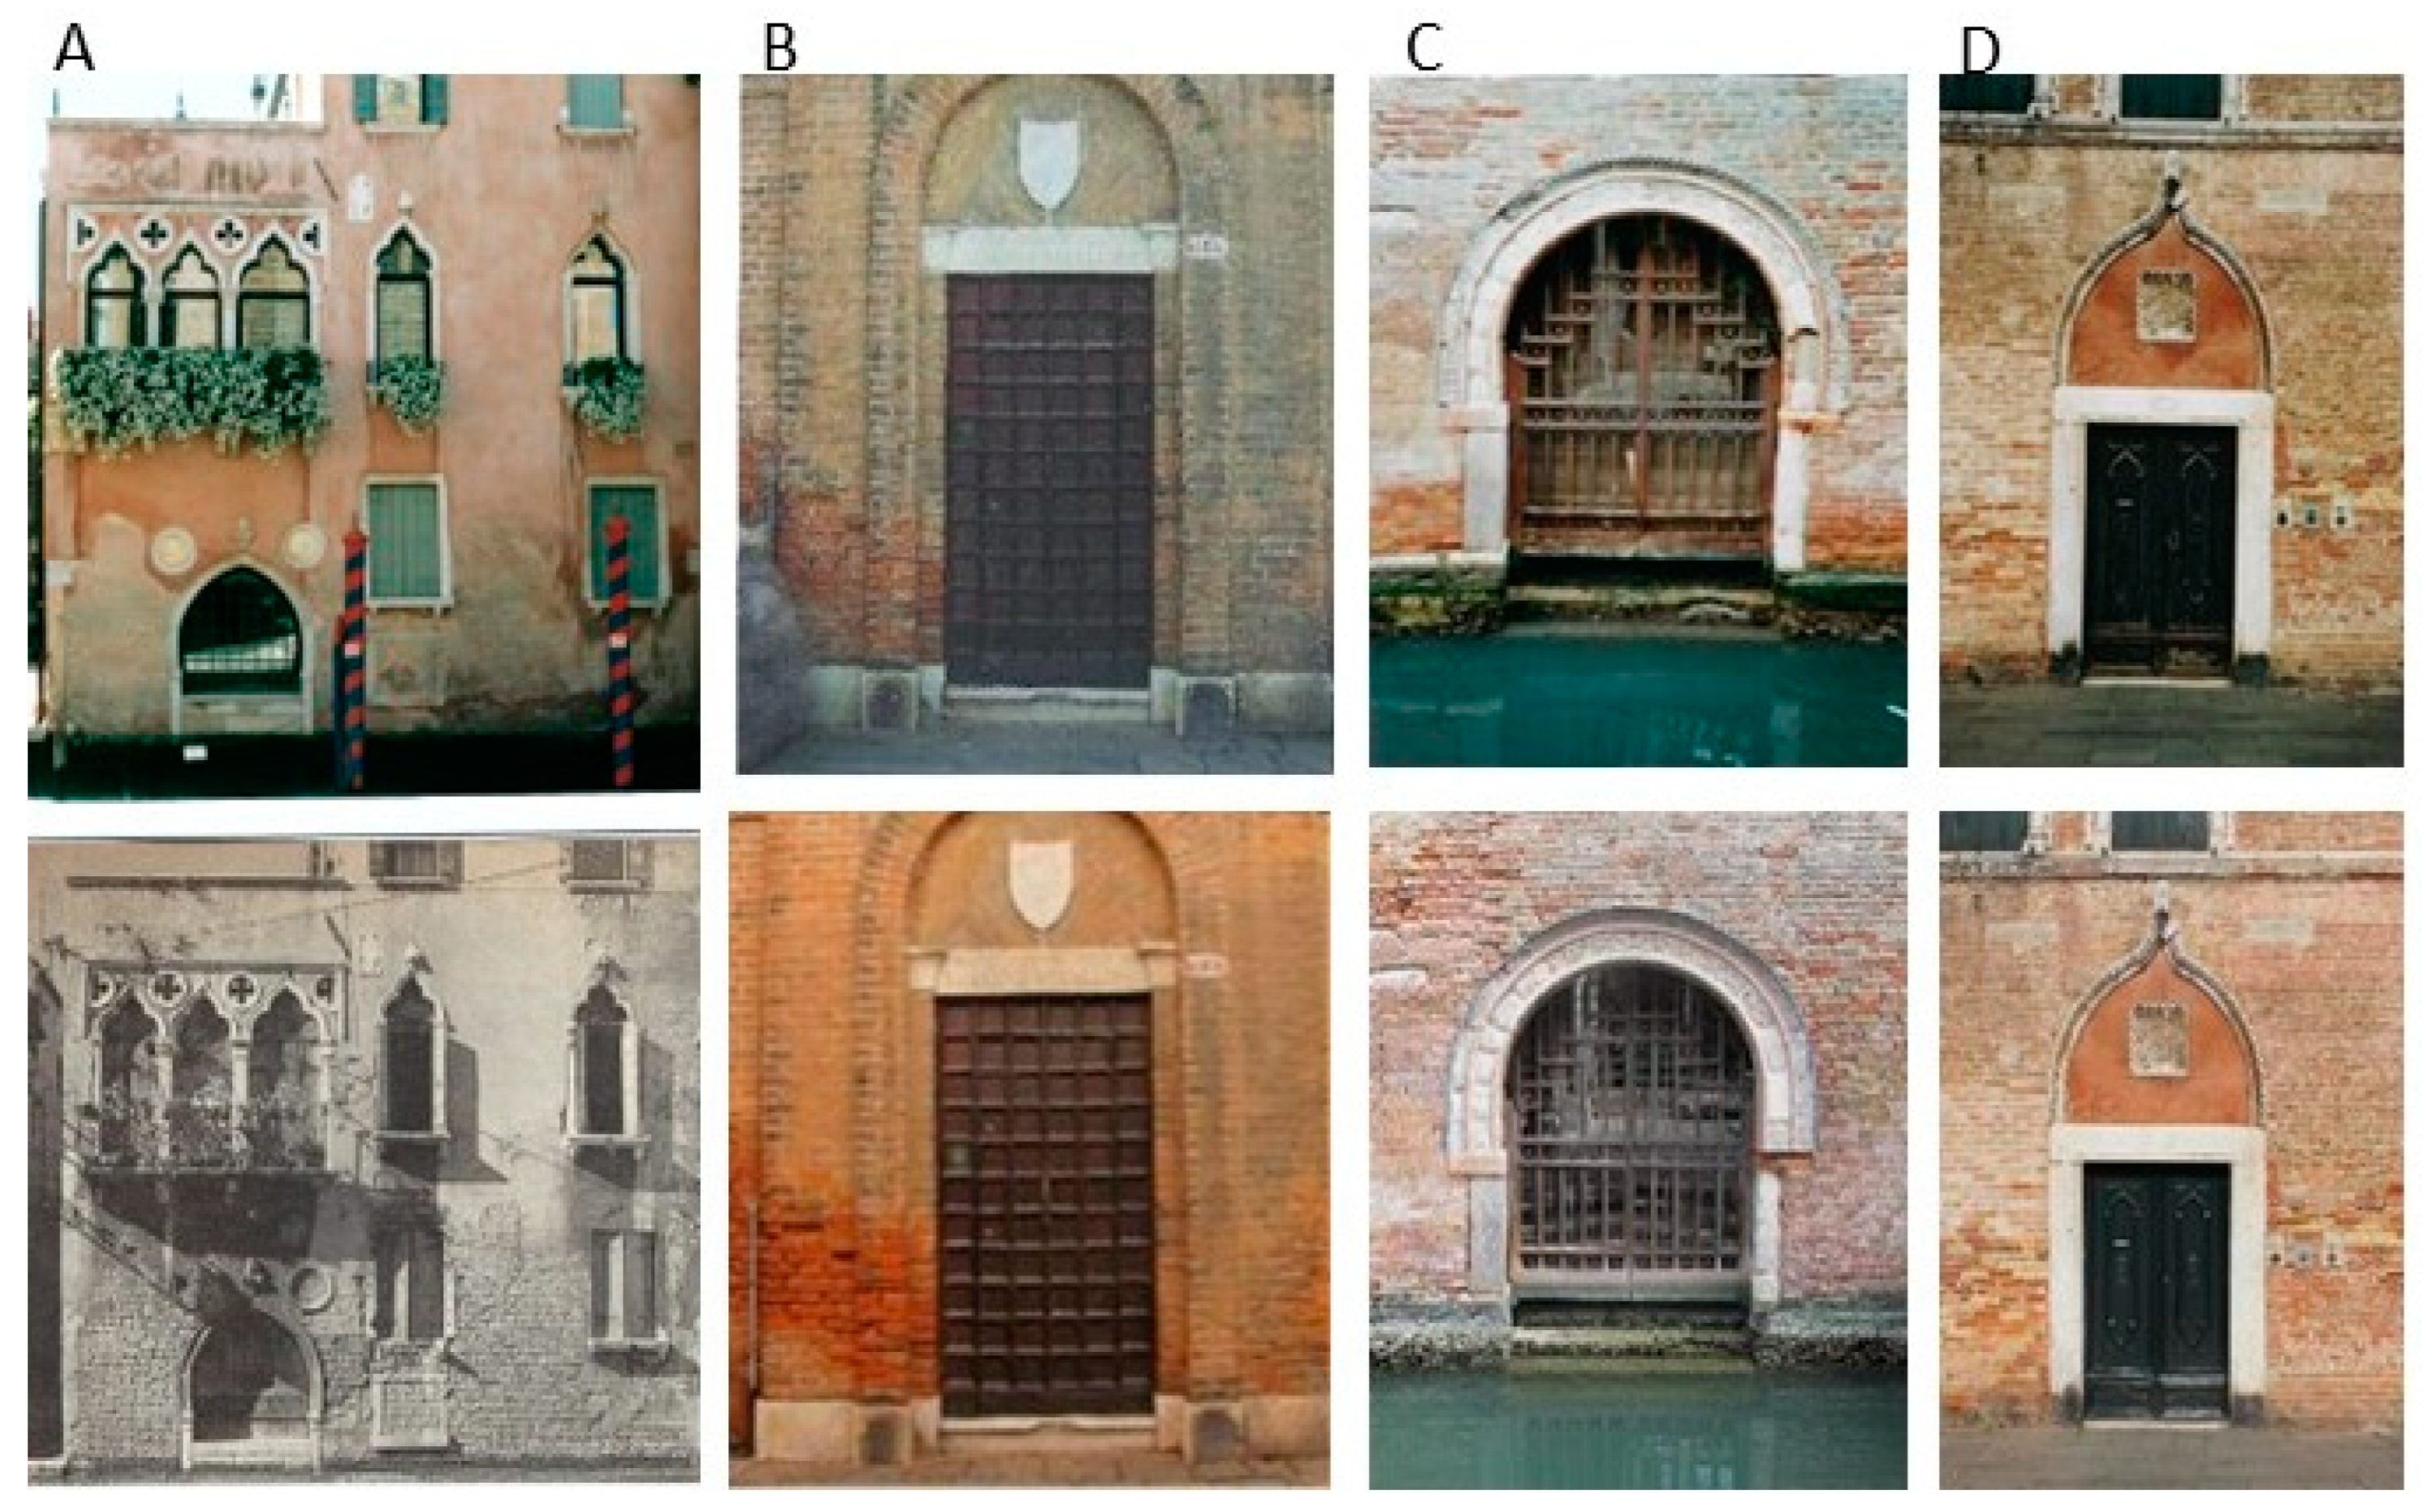
The extension of plaster detachments or erosion cannot, as well, be considered a solid descriptor directly correlated to the action of rising damp on an urban scale (Figure 4A). Building’s plaster loss, erosion, or detachment are, in fact, strictly affected by the materials and the technologies used for their application and by the masonry status (e.g., the presence of bricks already loaded with salts).
The level reached by capillary rise, i.e., the sharp front visible as the limit between dry and wet areas (different in color saturation), proved to be the most reliable descriptor for assessing the rising damp extension (Figure 4B). We also observed that the level reached by capillary rise change in a short time, mainly in autumn or spring. These seasonal changes consisted, usually, of no more than the height of a single brick (10–20 cm). Larger variations of the sharp front could therefore be considered significant regarding the evolution of the rising damp phenomenon in that masonry.
In Figure 4C, the position and extension of a band of more significantly damaged bricks, due to salts carried by rising damp, is clearly visible on the masonries. In many façades, this band seems to shift in height over time. The shift is most probably related to an increment in the sea level and was associated with an increase in rising damp. As the crumbling and degradation of bricks occur over years, the variations of the upper part of the erosion band are crucial for monitoring the impact of rising damp phenomena in the long term.
In the case of masonries directly facing the canal, the presence of an algal band is another visible and reliable descriptor of the average sea level variation and is possibly related to rising damp levels (Figure 4D).
The reduction of meaningful decay descriptors from five to three may affect masonry classification, and it is possible that information on specific buildings could be missed. On the other hand, few well-defined descriptors ensure less personal evaluation, providing more objective and reliable information on rising damp trends and decay effects.
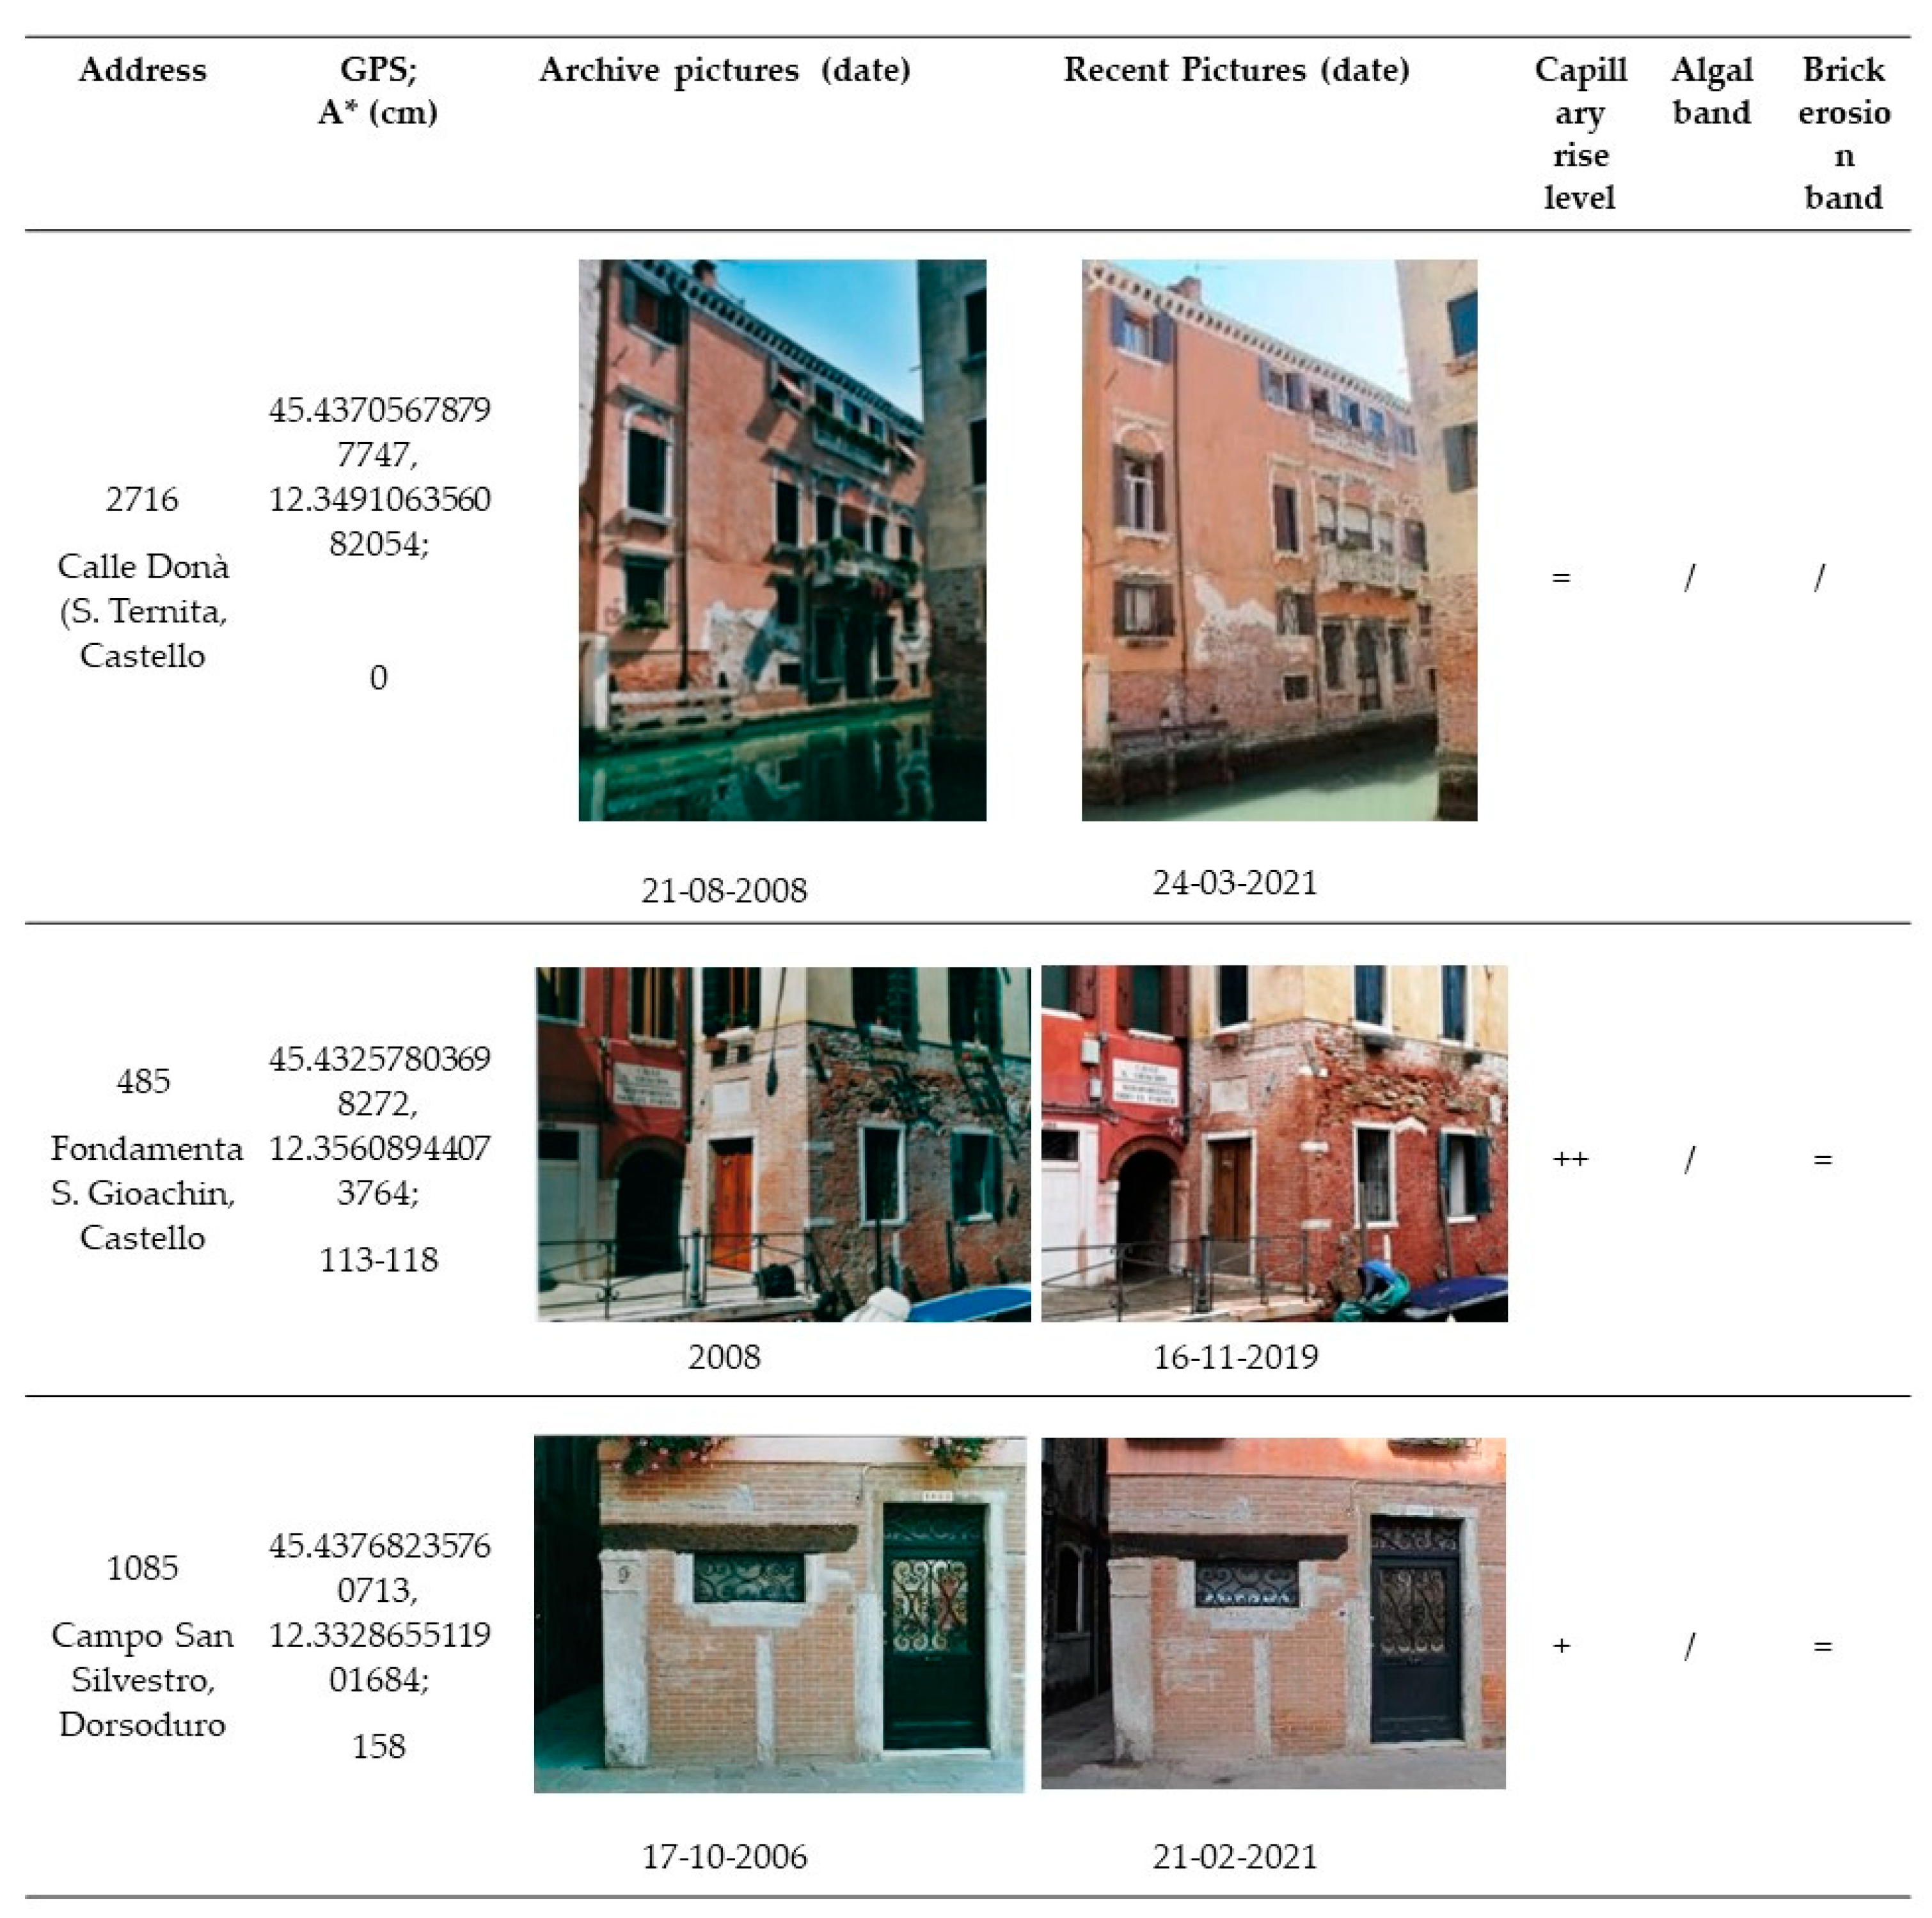
The initial evaluation scale consisting of six levels was also revised and simplified considering that the monitored timespan is limited to a few decades and the variations observed were (happily) smaller than expected. Only four evaluation levels were maintained: ++ remarkable increase, + significant increase, = similar level, − decrease, and / non comparable. A simplified scale allows us to obtain a more congruent evaluation among observers. Four expert observers, aware of the typical degradation phenomenology of rising damp in Venice (i.e., powdering, crumbling, detachments, algae growing, and efflorescence), evaluated the collected pictures by applying the proposed scale. Figure 5 shows an example of the implemented dataset.
3.2. Evaluation of the Sharp-Front Level
The 179-case dataset was queried, in relation to their altimetric data and their positions, to evaluate the variation in the sharp front level due to rising damp (Table 1). A main division among the cases was made possible by considering masonry at 0 cm ZMPS, i.e., masonries directly in contact with water, and masonries at higher altimetry, i.e., not in direct contact with the lagoon water. For masonries not directly in contact with canals, the minimum altimetry value among the 179 cases studied was +100 cm above the local sea level reference ZMPS, while the maximum was + 174 cm. To process the data, 10 cm intervals of altimetry were considered. Masonries at elevations > 161 cm were considered in a single interval as they are rarely reached by tidal water. The data highlight how the rising damp level increased in relation to altimetry from the early 2000s to the 2020s. Masonries at 0 cm showed a constant or slight variation (30% of total cases) of capillary fronts, while for those over +111 cm, a significant or remarkable increase was registered in several cases (50–60%). Descriptive statistics performed on the data can be found in the Supplementary Materials section (Tables S1 and S2, Figure S1).
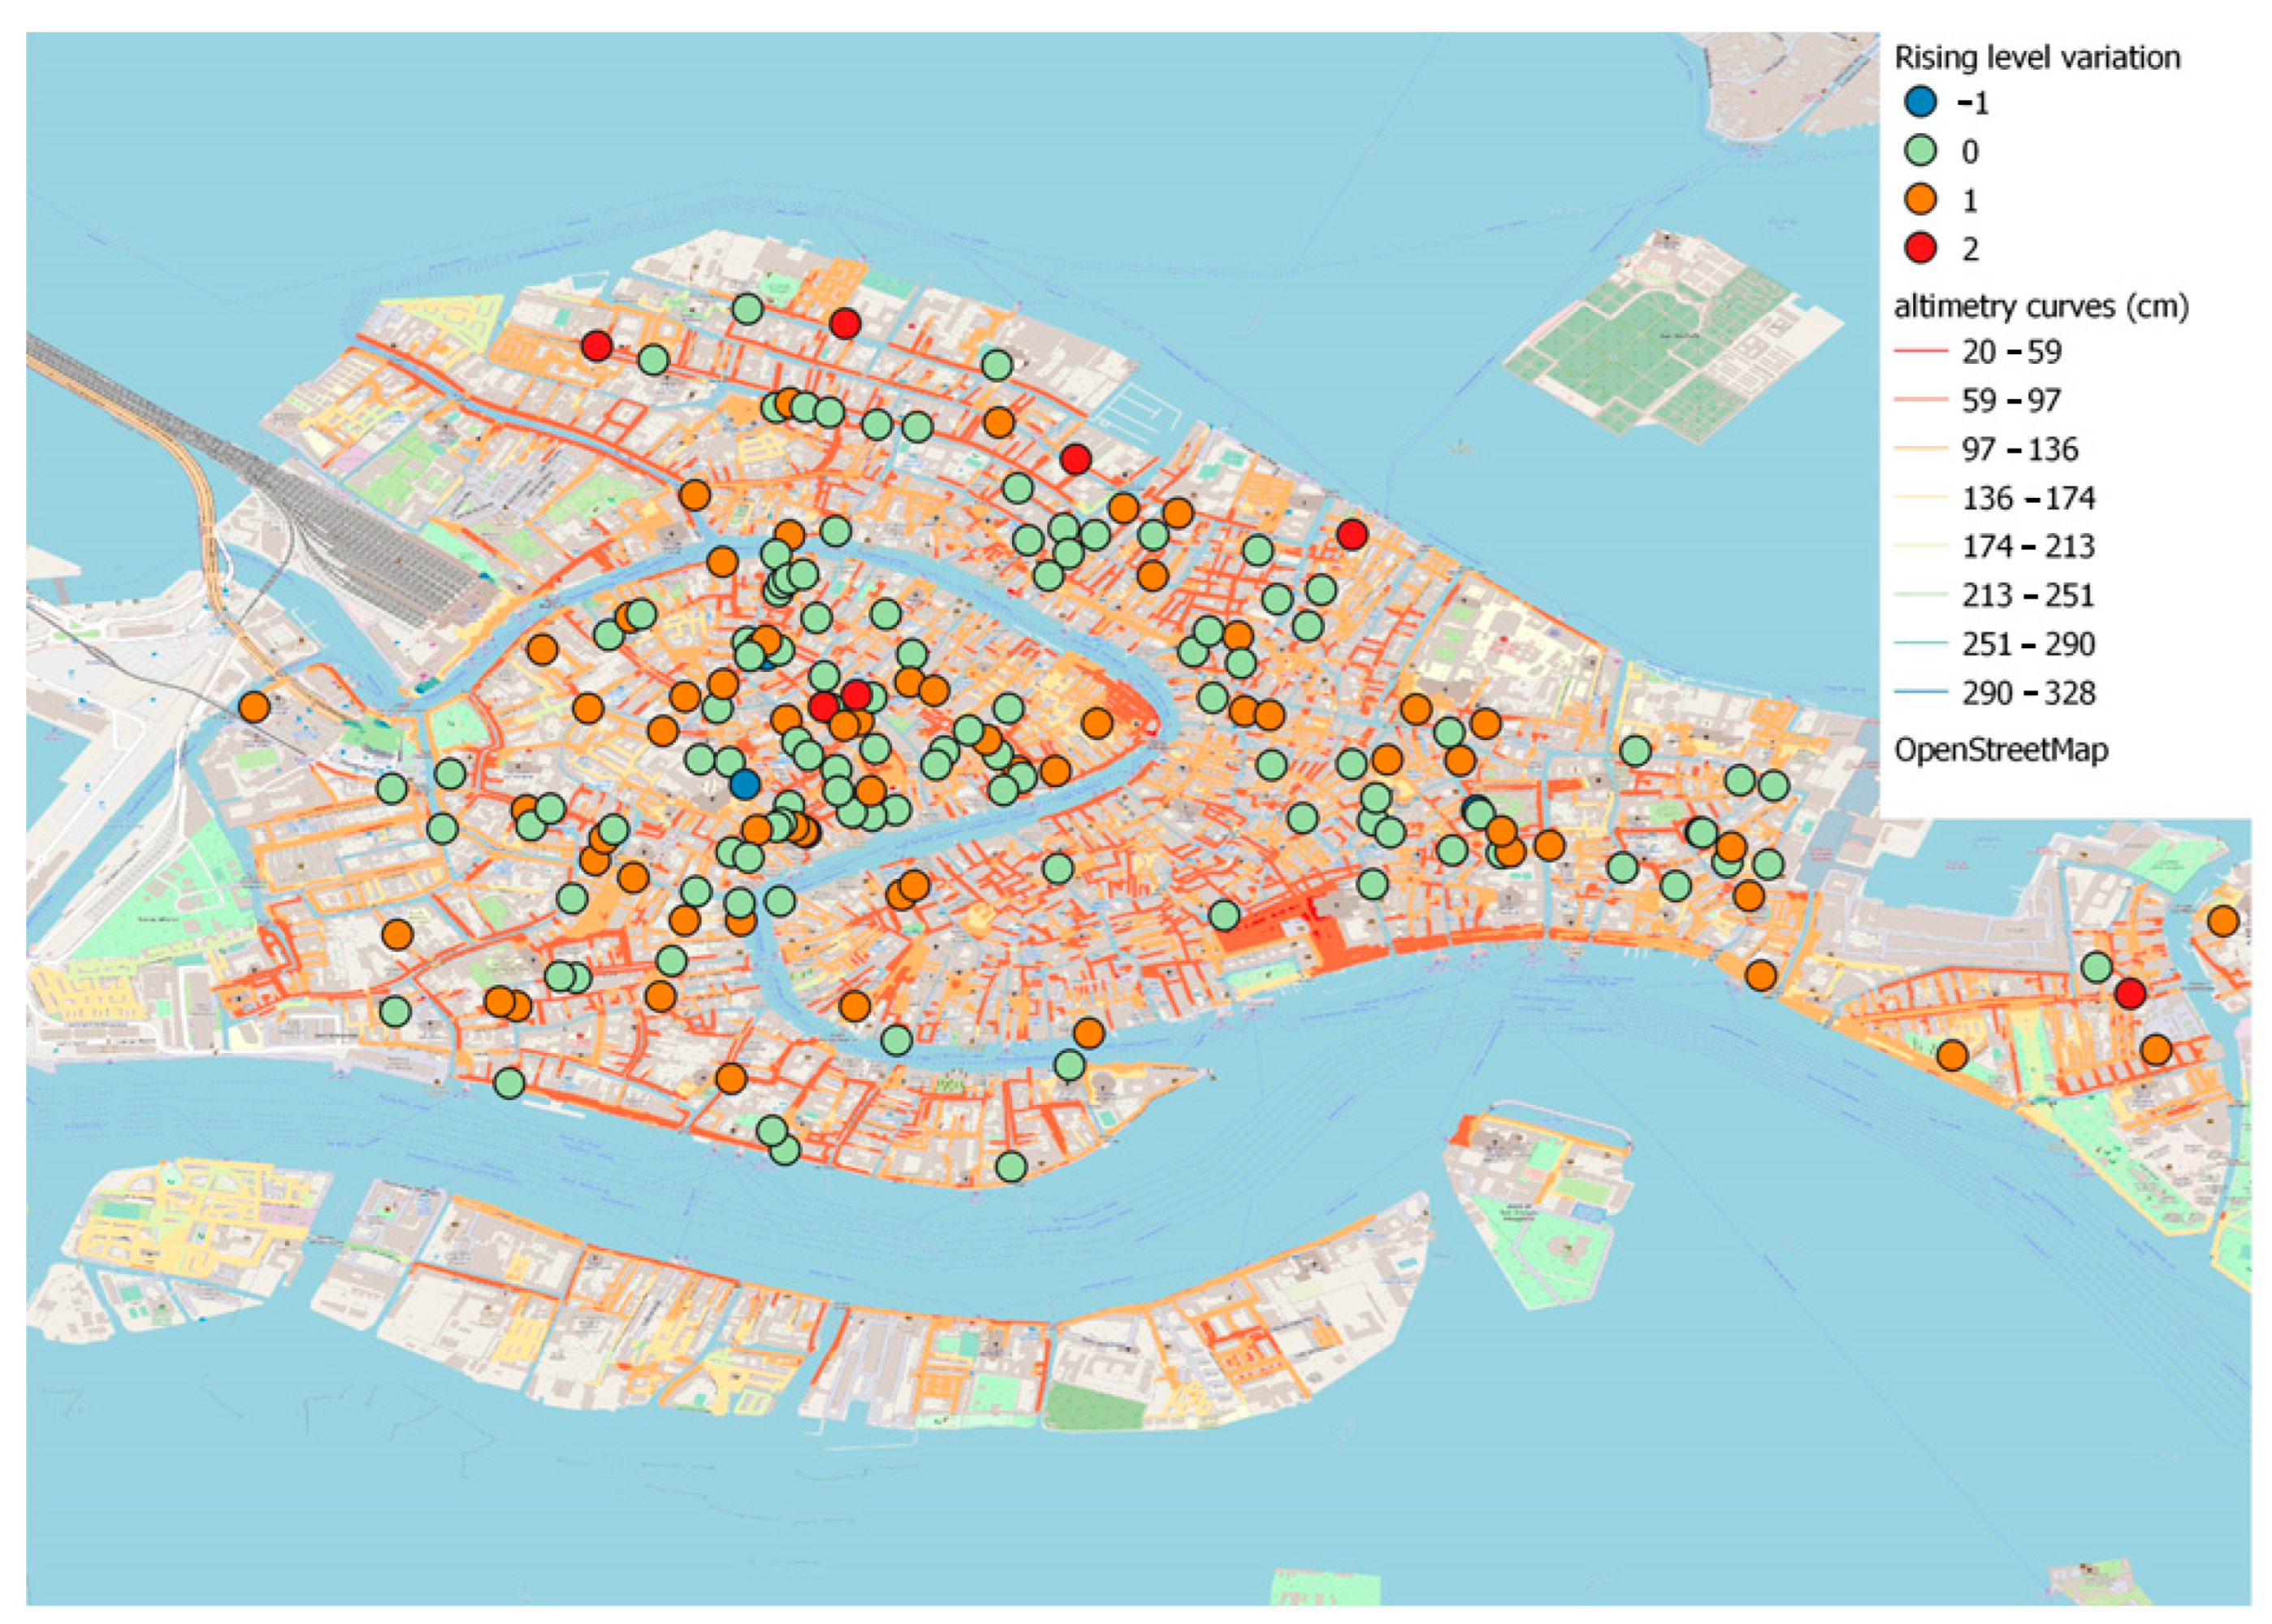
The cross-comparison between the altimetry map and the georeferenced cases (Figure 6) highlights how unchanged cases were homogeneously distributed over the city.
A worsening situation is observed, on the other hand, in the central and northern parts of the city where a few of the buildings are restored.
3.3. Degraded Brick Band
The evaluation of the degraded brick band was only possible for 127 cases out of 179. In the archive pictures, only one specific shot for each building was often available and sometimes even with poor resolution, a lack of focus, shadowed façades, etc. Table 2; Tables S1 and S2; and Figure S1 in the Supplementary Materials section report the variation percentages observed for this descriptor in accordance to building altimetry and distance from water. None of the cases showed a decrease in the extension of eroded bricks since erosion is a non-reversible process. The ideal situation is one in which no further damage is observed.
Restored masonries, where brick substitution intervention occurred, should be considered highly negative cases since brick substitution is often a signal of a previous highly compromised wall. However, as intervention circumstances are mainly unknown and images taken immediately before the intervention are rarely available, these cases were excluded from the dataset.
For buildings directly in contact with seawater (altimetry = 0 cm), a slight extension of decayed brick fronts was observed, in line with the capillary rise level trend. The two processes seem to evolve with the same intensity, as shown by the percentages of the “+” and “=” cases.
For buildings fitting in altimetry intervals between +100 and 160 cm (Table 2), the number of cases with worsened bricks increased, in particular for the interval of 111–150 cm. In the range between 121 and 130 cm, the number of buildings with highly damaged bricks exceeded the unchanged situations. Over +160 cm, only two cases were available, which was not significant amount of data for a general evaluation.
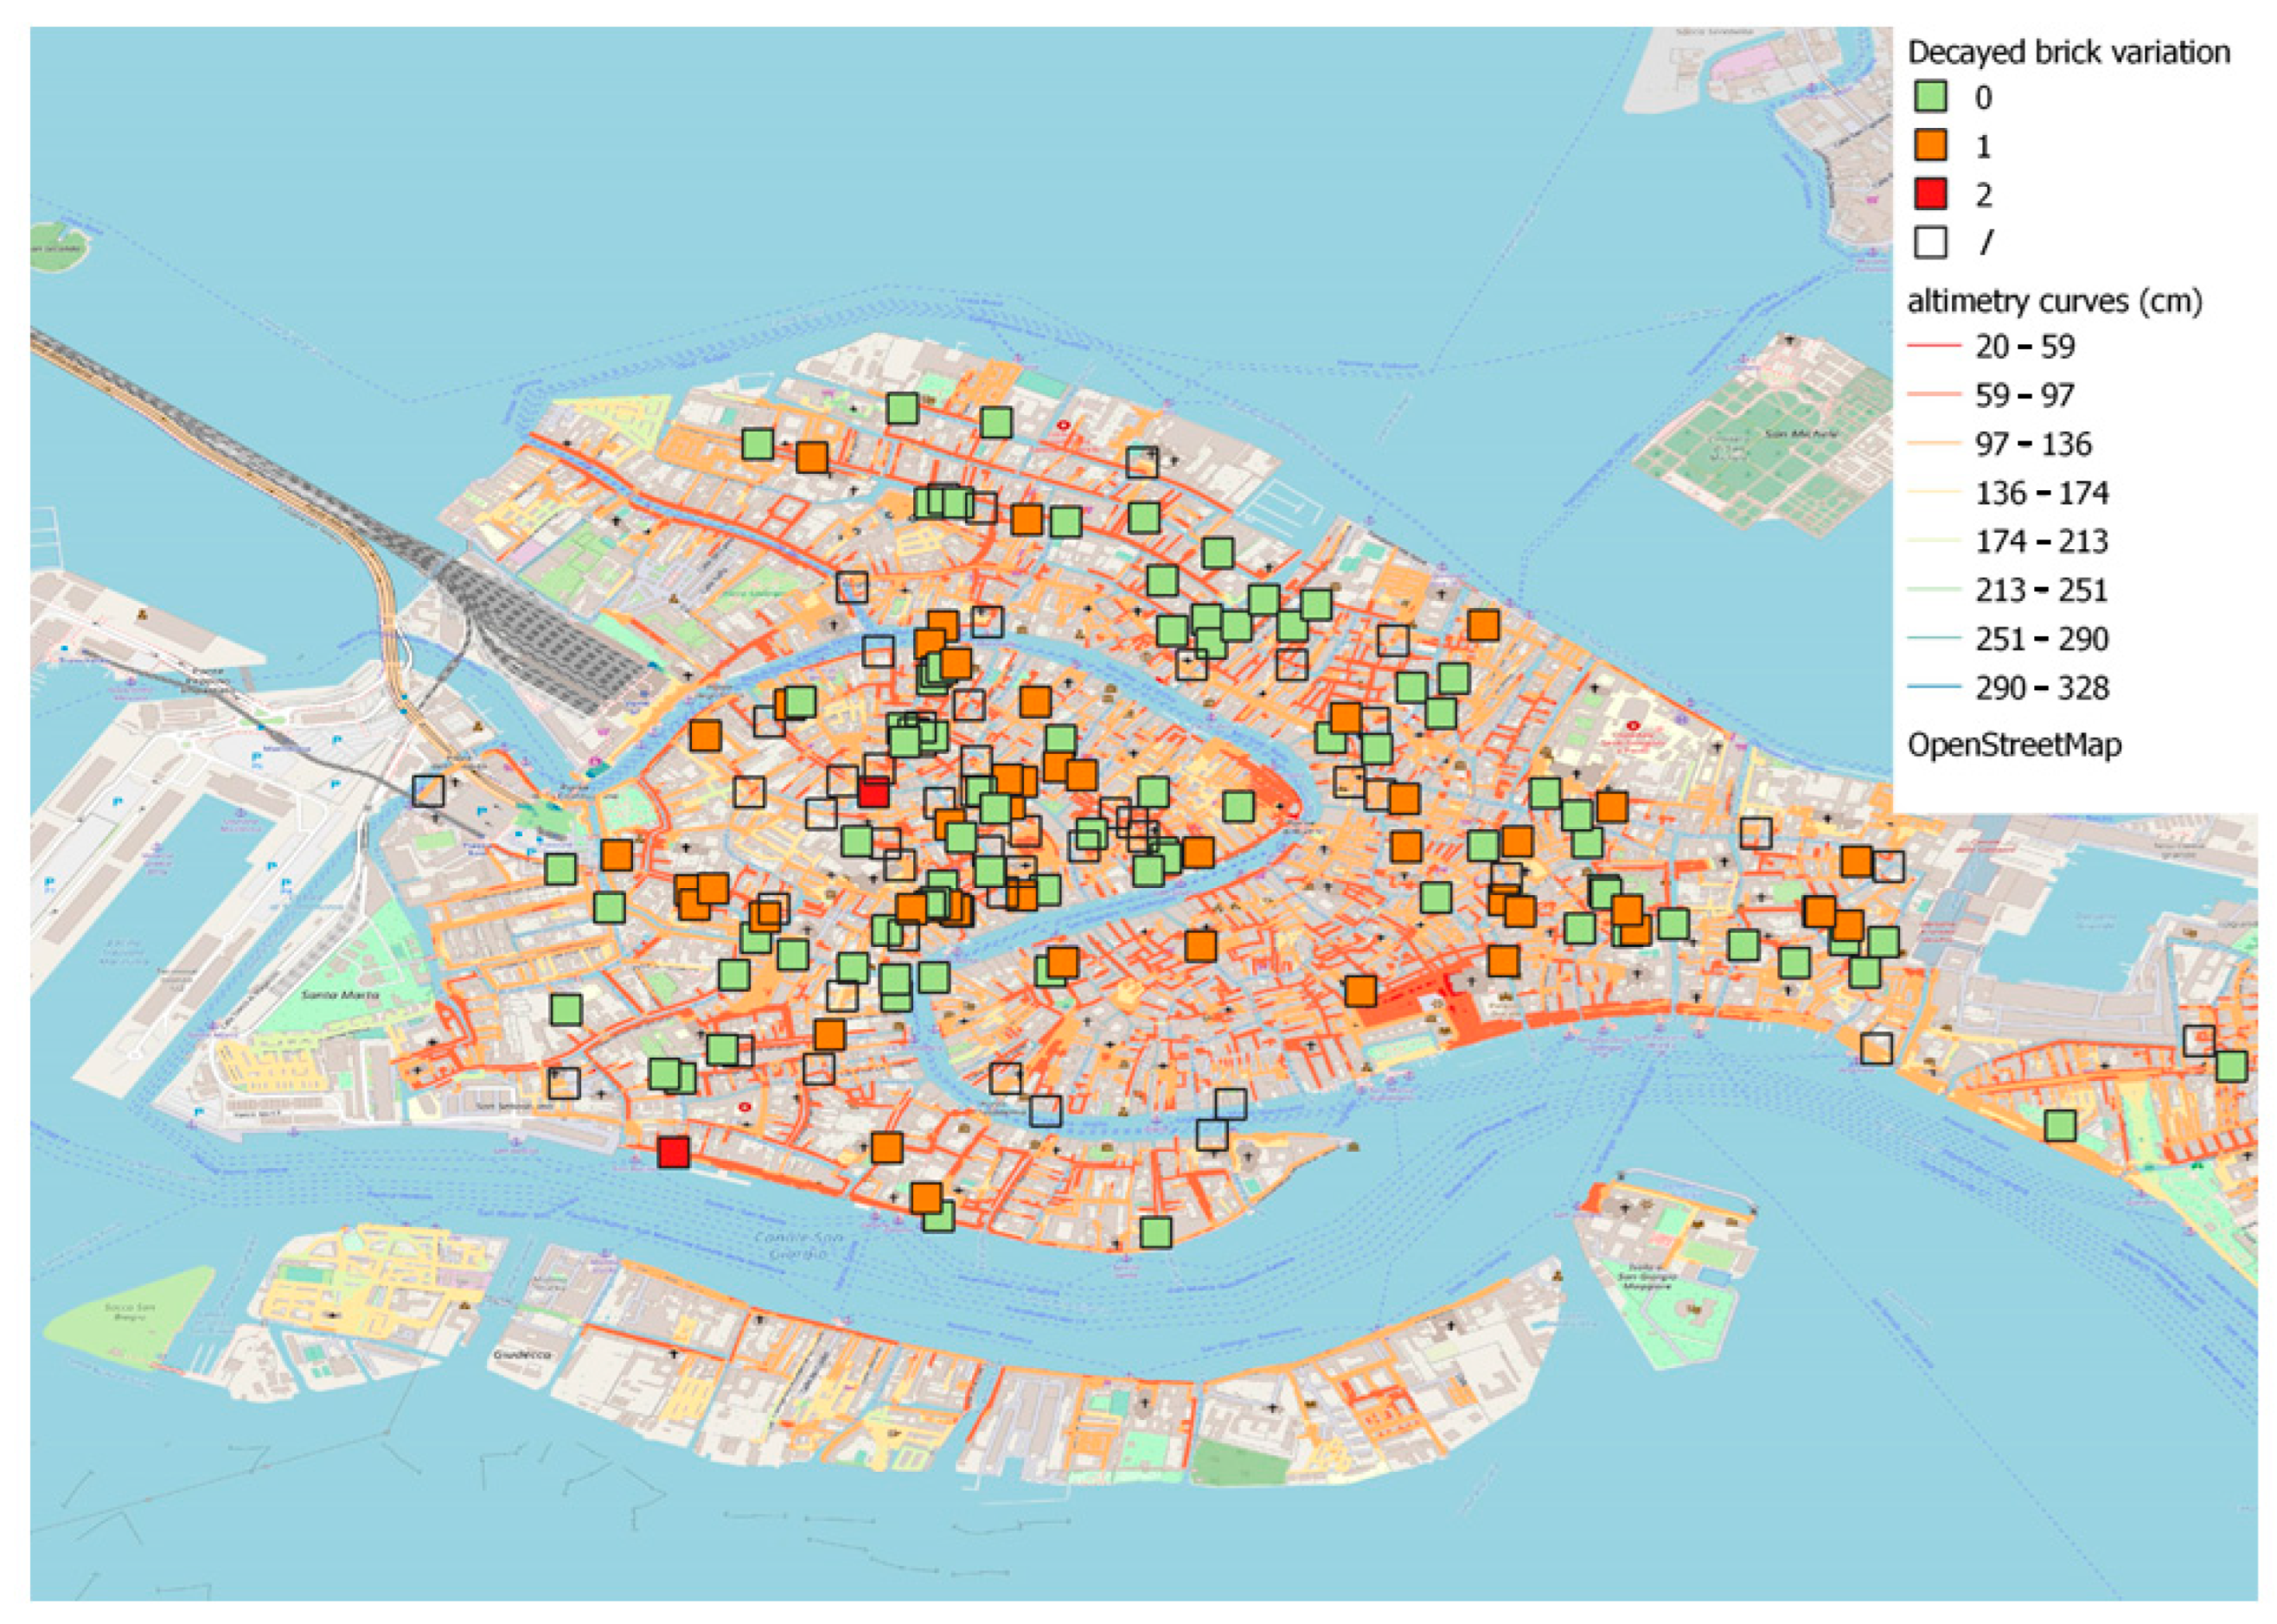
The observation of GIS data in Figure 7 also shows, in this case, a homogeneous distribution of non-variated cases; degraded masonries were observed mainly in the central and east parts of the city, corresponding to the districts of Dorsoduro, Castello, and San Marco. A comparison with the previous map on rising damp levels (Figure 6) revealed that brick decay was not always directly linked to rising damp increase as the altimetry of the considered area may have played a role. Lower areas of the city have, probably, been subjected for longer times to higher rising damp levels and accumulation of salts leading to brick decay and eroded surfaces. The San Marco district presented the highest percentage of worsened situations with an increase in extension and height of damaged brick bands. San Marco generally has a low altimetry and is often flooded by high tides. Unfortunately, it is also the district where less-suitable cases were individuated, and therefore further surveys are needed for a complete analysis.
3.4. Algal Band Level
The level reached by the algae band was evaluated as indicative of the average sea level in contact with masonries directly facing the canal. Out of the 74 available case studies, only 48 masonries could be selected, considering the possibility of clearly identifying the algae bands in the old pictures. Additional details on data variability for the algae band descriptor are displayed in Table S1 in the Supplementary Materials section.
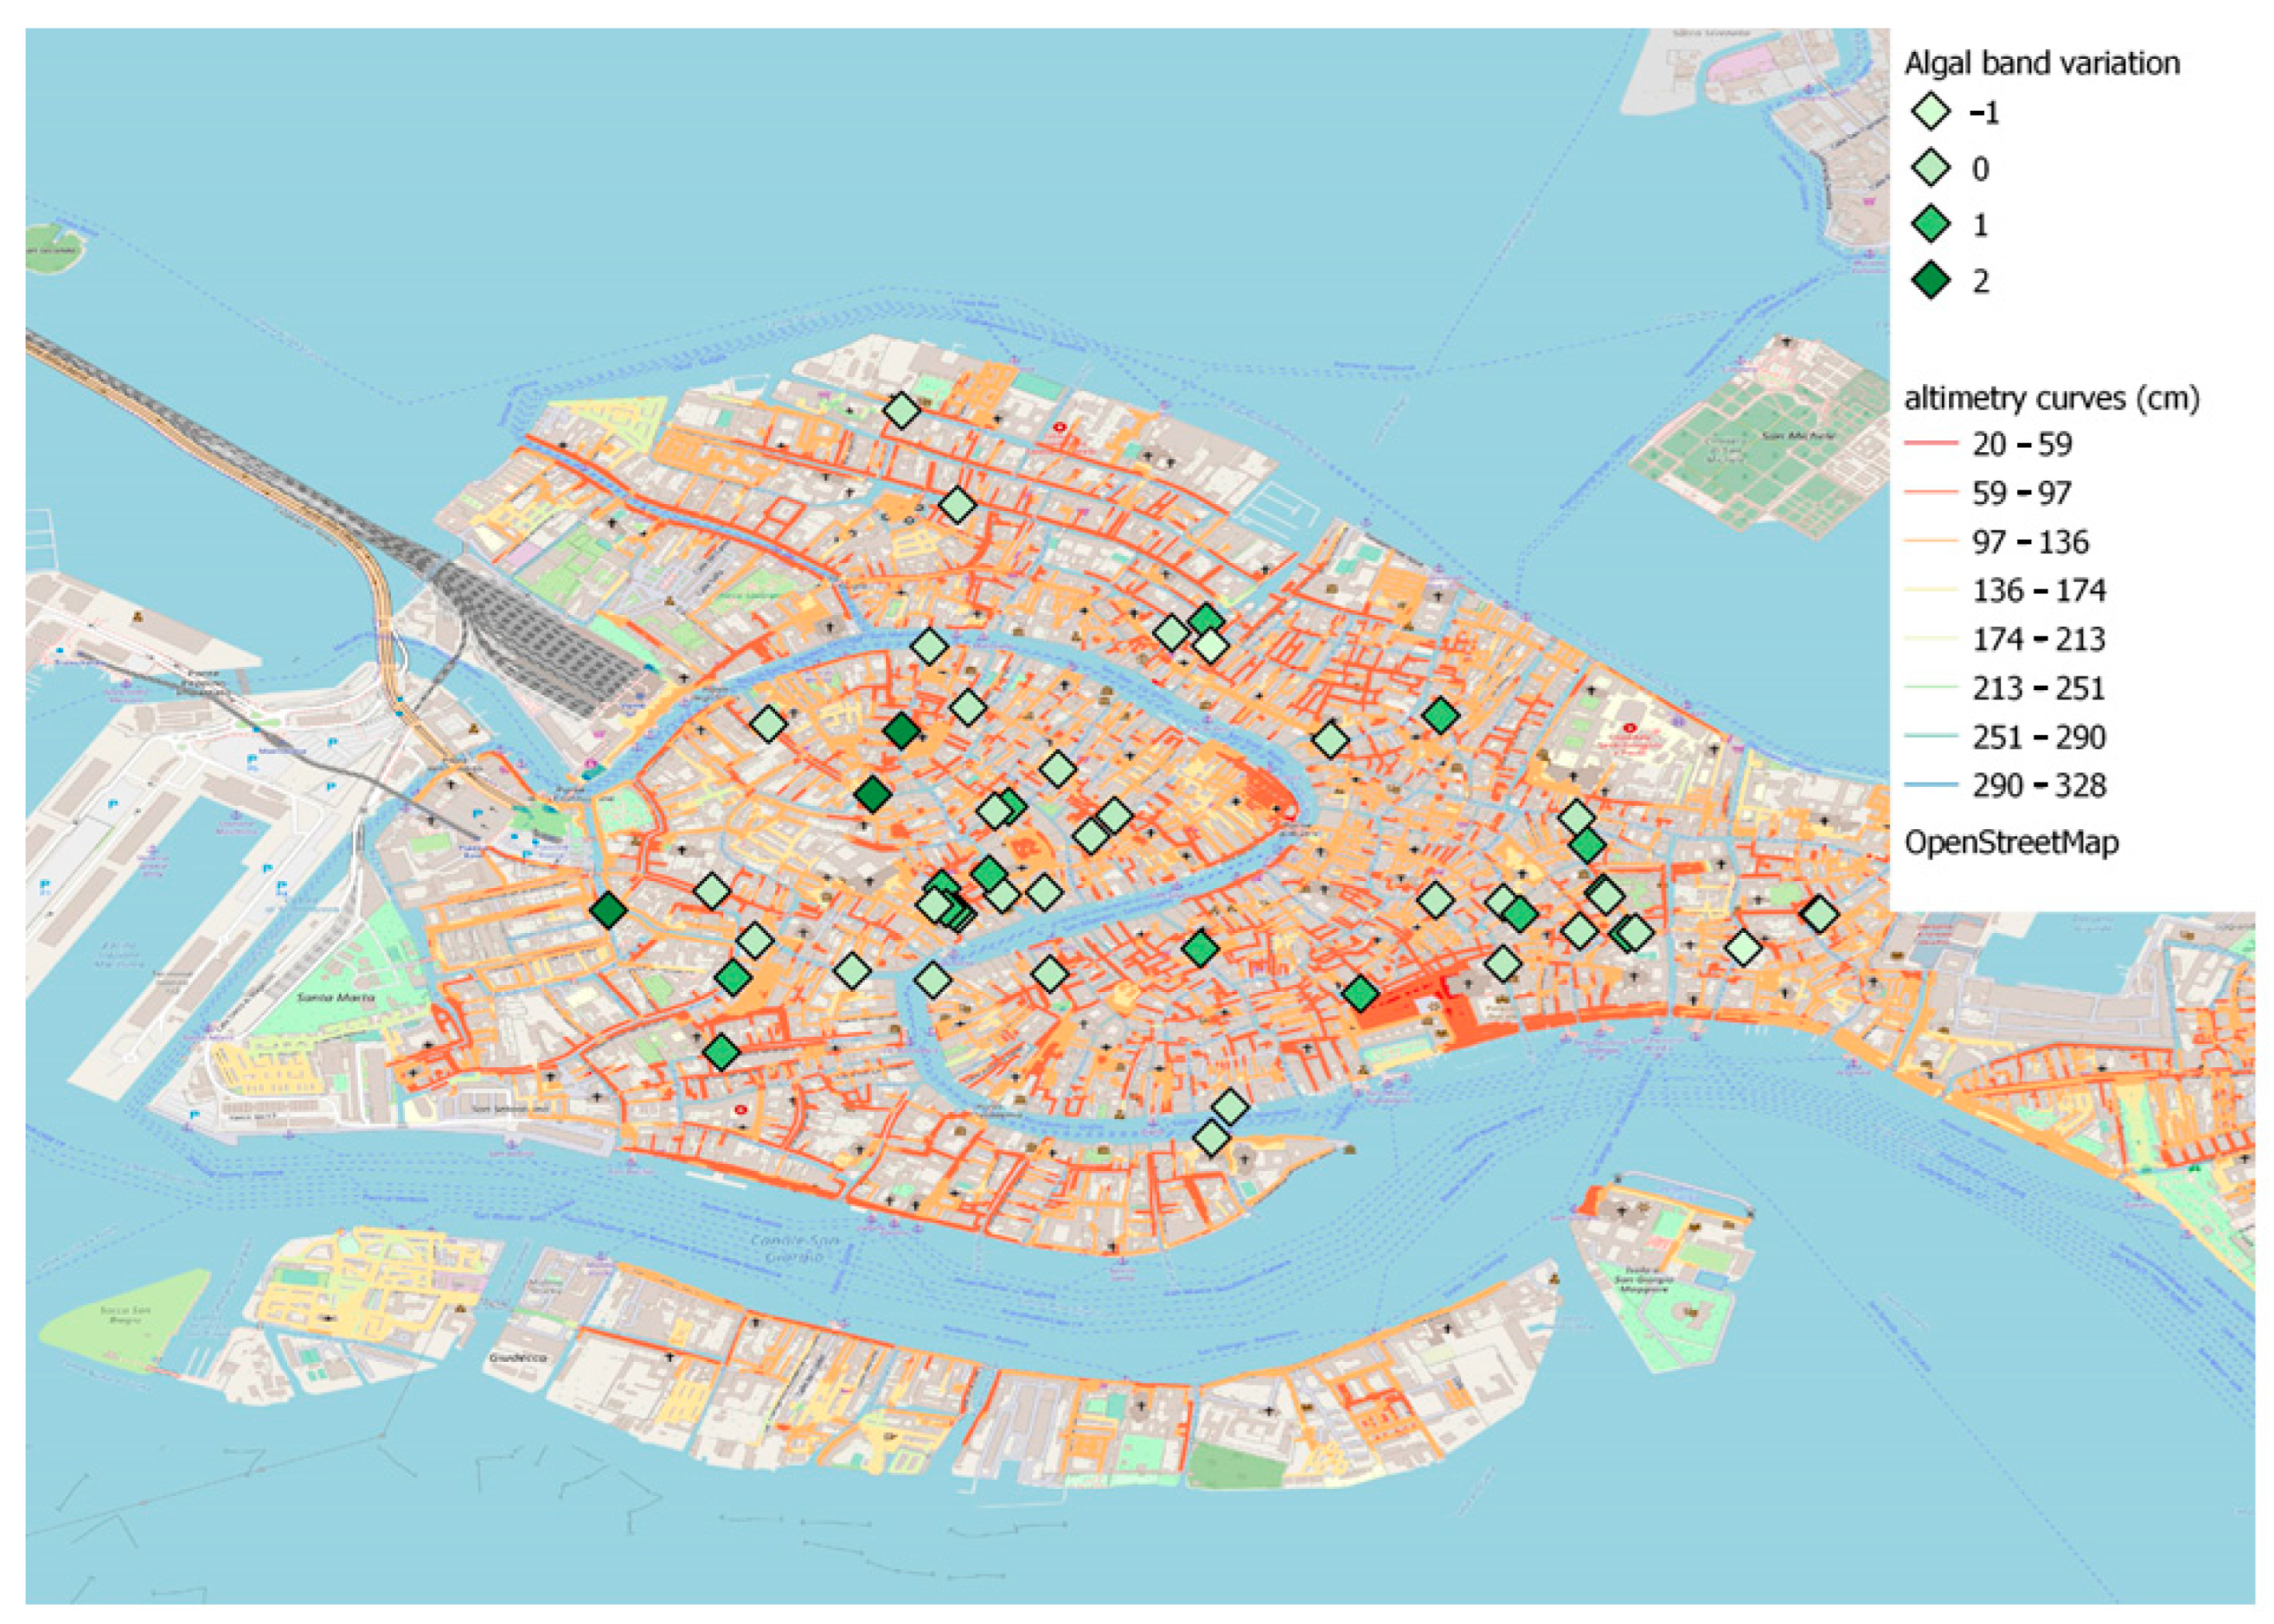
Whether we consider the cases subdivided by city district or as a whole, the algae level growth did not show relevant variation over the considered years (Figure 8). In only one case, the level of algae appears to have decreased, possibly due to cleaning actions or to a partial silting of the canal resulting in lower water accessibility. In the last twenty years, local erosion phenomena and sinking due to structural failures of individual buildings may have influenced the algal band level more than the relative sea level rise [48].
4. Discussion
This research aims to propose a non-invasive visual methodology for understanding rising damp on Venetian buildings at an urban scale. Past and current pictures have been employed to define visual descriptors strictly linked to rising damp useful for describing its impact and evolution on masonries.
Thermo-hygrometric conditions, building construction materials and technology, and site-specific history have an influence on descriptors such as salt efflorescence distribution. Thus, these parameters cannot be considered reliable. On the contrary, visual descriptors such as the level of capillary rise front, algae band position, and extension of brick erosion can be objectively assessed and employed. Moreover, the application of a simplified rating scale (+ +, +, −, and =) allow for a more objective and reliable assessment of the rising damp evolution.
The non-invasive approach based on visual observation does not claim to completely describe the rising damp phenomenon in Venice, but contributes to understanding the incidence and trend of this phenomenon at an urban scale. The GIS maps and visual inspection could help in easily monitoring the evolution and suggesting when and where it is necessary to perform quantitative surveys such as determination of ponderal water content.
Next to other picture archives (i.e., municipal archives and instruments such as Google Maps or Google Earth), other venetian buildings might be considered and registered for implementing the evaluation. Moreover, the dataset could be discussed in relation to environmental conditions specific to particular decades for evaluating the effects of specific conservation strategies.
4.1. Relation between Observed Trends, Altimetry and Distance from Water
Lagoon water penetrates via capillarity from canals to the internal parts of isles. The altimetry of buildings and their distances from the free water of canals may therefore impact the rising phenomenon. To better understand this relation, the variation in the descriptors was linked to building altimetry and distance from canals using statistical tools: descriptive statistics, ANOVA, and regression trees (see Supplementary Materials) [46,47].
The statistical significance of ANOVA was rather low (Table S3 in the Supplementary Materials); nevertheless, a higher variation in decay for buildings at higher altimetry and located in the inner part of the city was confirmed.
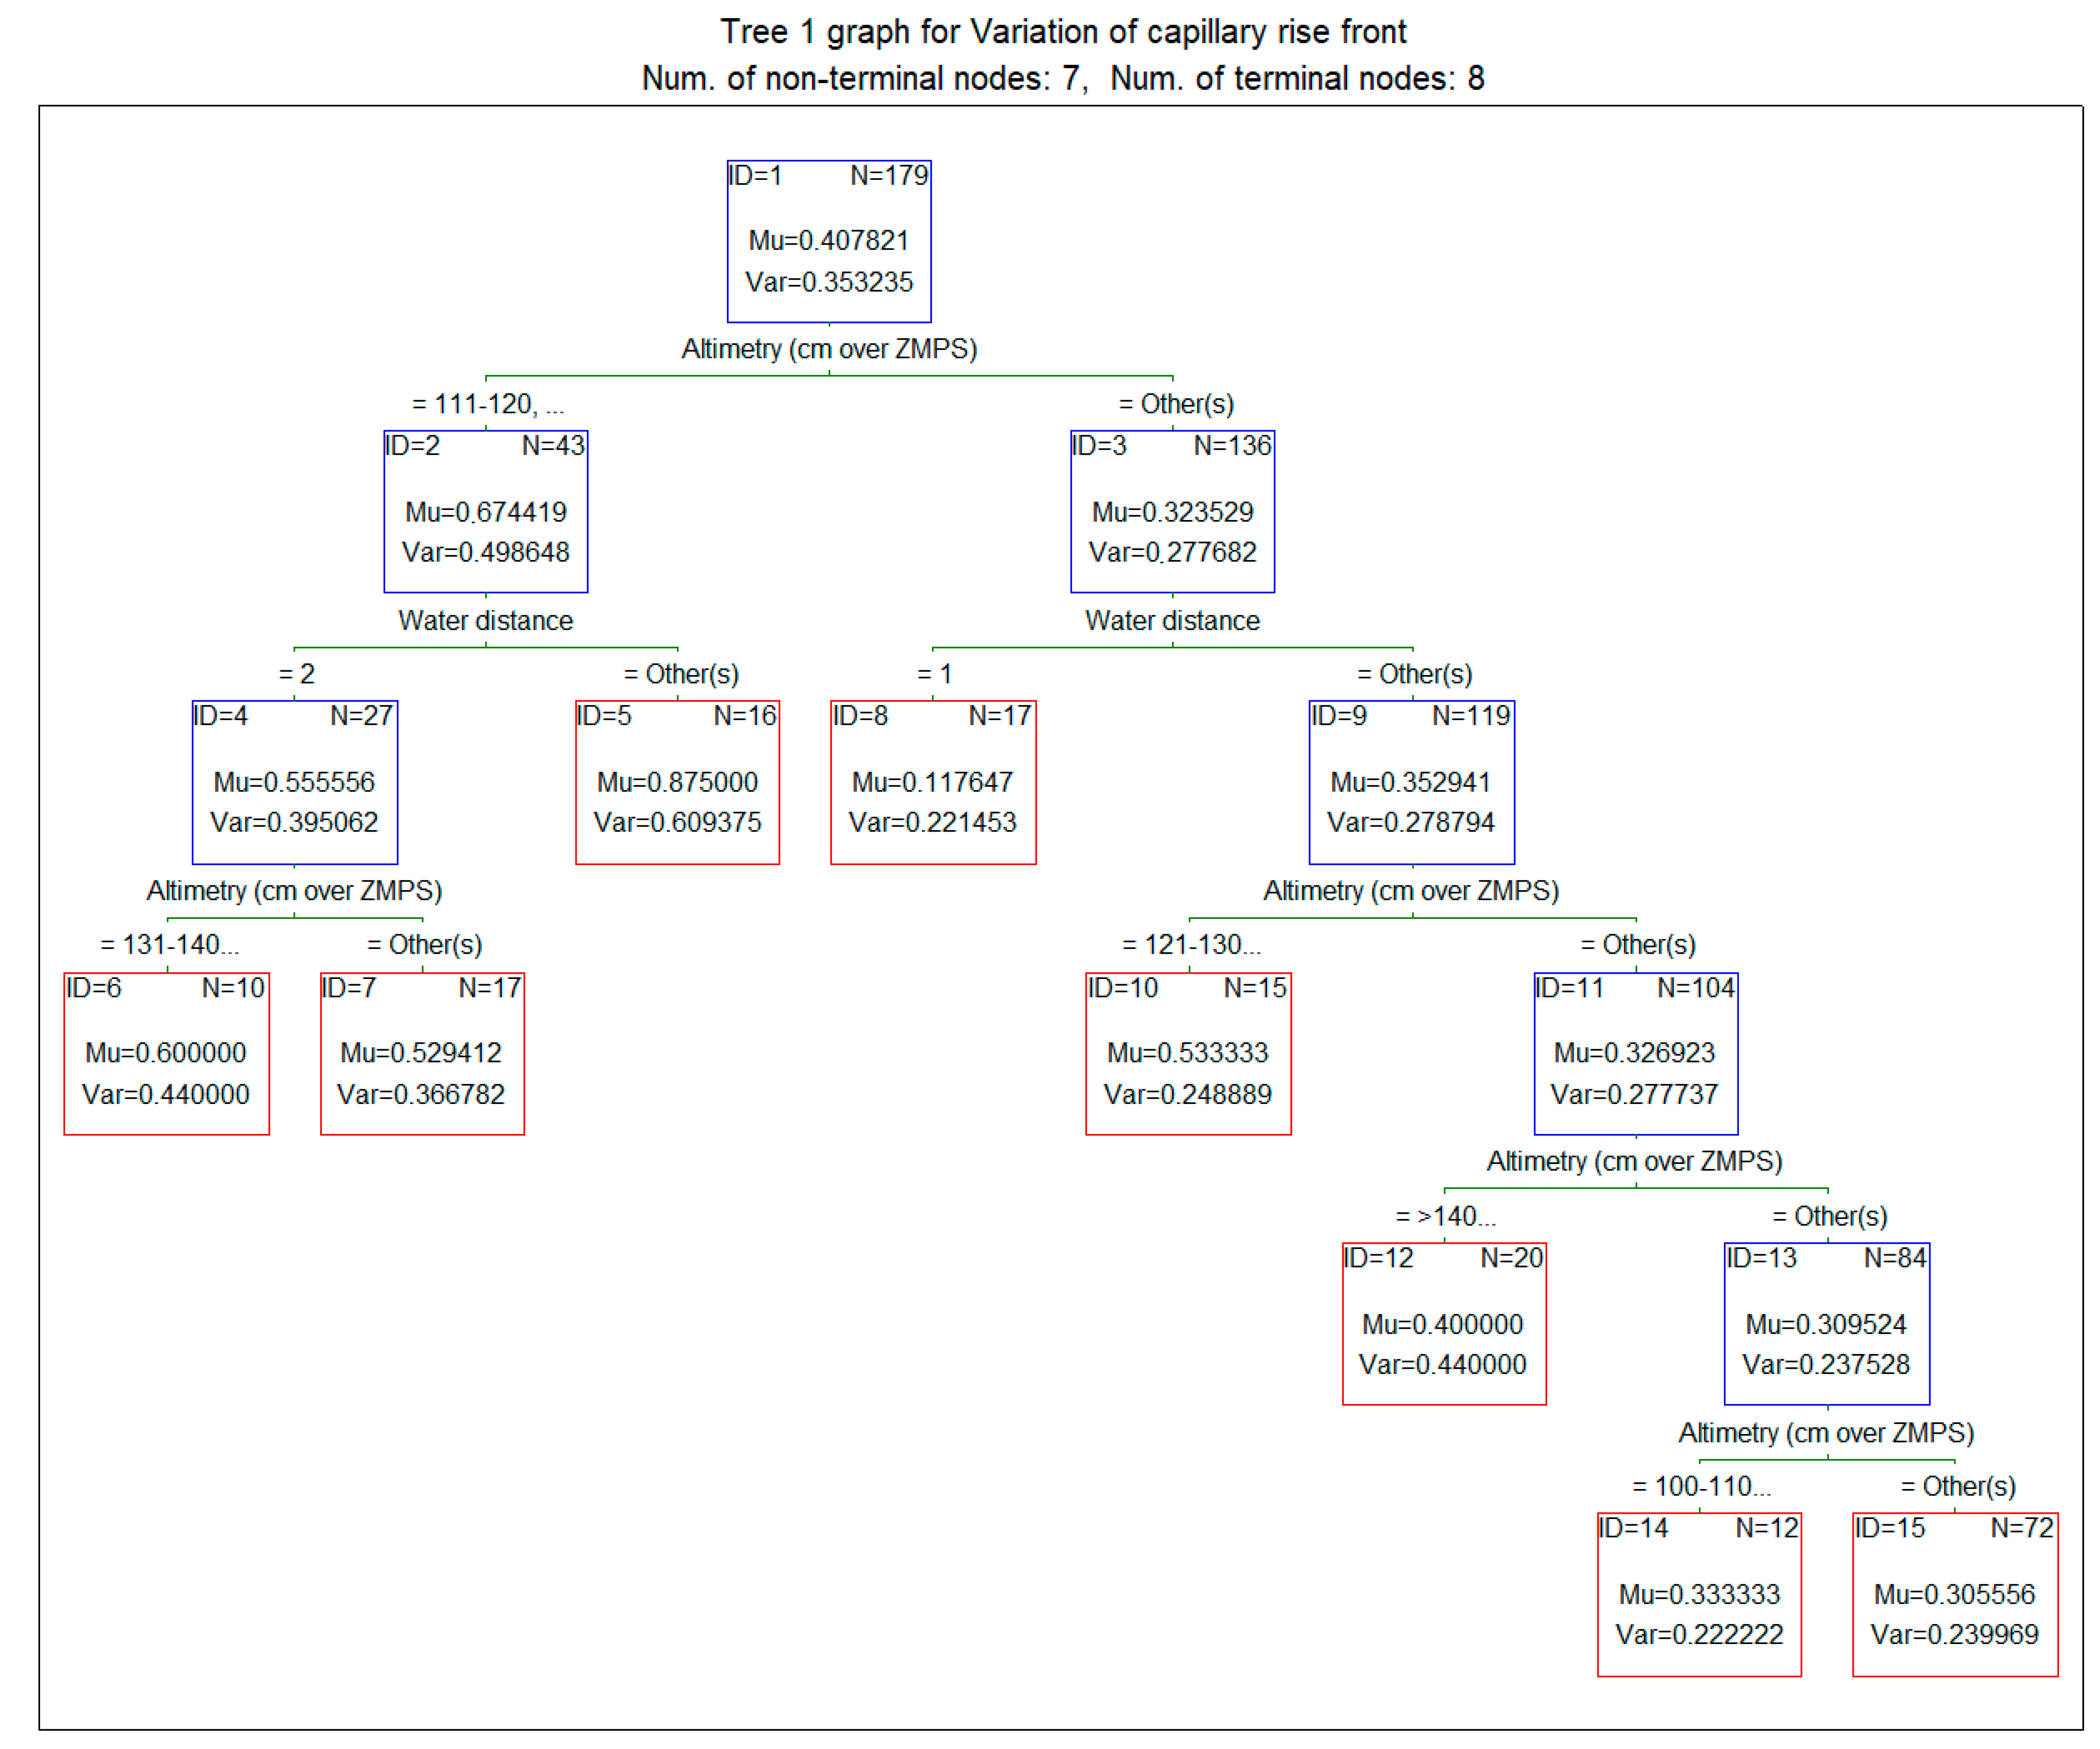
The regression tree analysis (Figure 9) partially explains the data variation (cost = 0.362). The tree shows an initial division determined according to altimetry; the altimetric classes between 111–120 and 131–140 cm on ZMPS are separated from the others. Next to this, for both groups, the water distance determined a second separation with a marked difference for buildings far from canals (over 5 m) and nearby canals (1–5 m of distance). From group ID9, a further separation is determined according to altimetry (120–130 cm class and then the 140 cm class). ID10 and ID12 show a Mu value higher than ID11 and ID13, indicating a worsening situation for buildings at 110–120 cm ZMPS.
Previous studies, with similar statistical approaches and based on quantitative data of MC%, were unable, due to scarcity of data, to evaluate the rising damp variation over time [2], but gave interesting results regarding the distribution of rising damp within a typical brick masonry. Similar results were also obtained in theoretical studies regarding the model of rising damp processes in Venetian masonries [49]. These studies confirmed an inverse relationship between MC% and height, with masonries soaked with water up to 150–200 cm over ZMPS and evaporation areas from 200 cm to 300 cm over ZMPS. Other studies showed, on the other hand, that rising damp processes are not linked to the position of a building within the city but more likely to its altitude and distance from water. This is in accordance with what has been observed in the present study.
4.2. Influence of Climatic Forcing on Rising Damp
In Venice, rising damp is affected by the surrounding environment and climatic factors such as water availability (underground or directly in contact with masonry) and evaporation. These are mainly controlled by lagoon water level and tidal movements, precipitation, and thermo-hygrometric conditions.
Seawater is the common water reservoir leading to rising damp in Venetian masonries, particularly for façades directly in contact with canals. Due to global climate change and local subsidence, the average relative sea level increased for Venice approximately +7 cm from year 2000 to 2020 (from +25 cm ZMPS to +31 cm ZMPS) [48]. This sea-level increase corresponds to an increase in the rising damp level and, consequently, to an expansion of damaged brick lines, as observed in the collected data.
Local conditions acting on water evaporation and different physical characteristics of building materials might change the level gap from one building to another along with seasonal and climatic fluctuations until ±10 cm respect to the associated ZMPS height.
The data based on the visual survey need to be discussed by considering the frequency and duration of high tides, too. The actual level of sea water is, in fact, linked to tidal phases and climatic factors, impacting in a different way masonries overlooking canals and masonries that are normally dry but in contact with pathways that are flooded during high tides.
Table 3 reports the number and duration of tides recorded in the years spanning 2000–2009 and 2010–2019 [48], providing an idea of the event rate. Events were mainly concentrated in wet seasons (autumn–spring), where it was possible to observe two events in a few days and none throughout the rest of the year. The frequency and permanence of high tides in Venice is gradually increasing over time. The number and duration of tides events has at least doubled in the last decade for all the altimetry considered. According to the presented data, masonries at +120 cm and +130 cm showed significant variations of rising damp level and degraded brick area, which can be seen in the light of more frequent flooding and direct contact with water.
Until the middle of the 21st century, a further minor increase in the mean sea level and prolonged high tides are expected in the Adriatic region [14]. In response to this, the MOSE [39], a system of mobile dams, has been built to protect Venice. Since 2020, the mobile dams of MOSE have reduced the occurrence of tides expected to be higher than 120–130 cm [26]. Direct contact between water and buildings over +120 cm stops, and the increase in rising levels may also be affected by underlying water reservoirs. In the future, masonries over +120 cm are expected to dry, possibly partially causing salt deposition on the surfaces and within the porosity of material.
Under +120 cm, an increasing number of high tides will probably cause prolonged contact with masonries not overlooking canals, impacting masonry decay.
The presence of MOSE and of current climate changes suggests the necessity of starting continuous monitoring of the city during the 2020s to understand future evolutions.
Precipitation and thermo-hygrometric conditions mainly impact evaporation from masonry surfaces [8,9]. Only in a few cases, rain water contribute to the rise of the buildings water reservoir, since, in Venice, rainwater drains into adjacent canals. The climate in Venice is characterized by cold, moist winters and hot, sultry summers [50,51]. The mean precipitation of 750 mm/year is not evenly distributed over the year but concentrated in spring and autumn. A high relative humidity—over 70%—persists most of the year (see Table S4). In the 2000–2022 period, the average temperature rose, maintaining a rather stable upward trend in recent years, especially in the months of April, May, June, and August. The trend of rainfall has changed over the years with November and September being the rainiest months [15,50,52].
The high relative humidity and the frequent precipitations in autumn and spring impairs evaporation from masonries and enhances the rising damp front, as observed during repeated surveys. A physiological variation up to 10 cm of the rising front was observed during our research in spring/autumn vs. the summer, as reported in Section 3.1: Descriptors Validation.
Since 2020, a severe drought has been affecting the entire Veneto region [51]. An increased and prolonged evaporation from the masonry surfaces may lead to sub-efflorescence salt crystallization and increased damage in terms of powdering and flacking from the bricks. Further monitoring is therefore necessary to understand the evolution in relation to a changing climate.
5. Conclusions
In this research, visual comparisons of old and recent pictures enabled the possibility of monitoring the impact over time of capillary rise of Venetian buildings. Evident feature decay visible on masonries were considered meaningful parameters (e.g., efflorescence, plaster loss, damp front level, and degraded bricks) and rated through expert elicitation according to an evaluation scale.
The application of our methodology on case studies revealed that salt efflorescence distribution and plaster loss are not significant parameters. Efflorescence visibility depends on thermo-hygrometric conditions and plaster loss is influenced by constituent material technology and site-specific history. On the contrary, the level of capillary rise front, the level of algae band, and the extension of brick erosion are significant parameters for describing this phenomenon.
The integration of the dataset on GIS maps helped evaluate the incidence and trend of rising damp at an urban scale. The GIS maps highlighted how capillary rise levels remained substantially unchanged between 2000 and 2020 for masonry in direct contact with canal water under +120 cm. The rising damp level on buildings fluctuated of an height equal to a brick line depending on the season.
For buildings with altimetry between +120 and +140 cm, an increase in rising damp level was observed for half of the cases. This was probably correlated with a period with reduced tidal flooding (1990s and 2000s) followed by a period of frequent floodings (2010–2019). For cases with altimetries between +111 and +120 cm ZMPS, brick decay extension increased in half of the cases, too.
- About 60% of the considered buildings showed a constant level of algae band over time (less than 10 cm);
- Brick decay extension was constant over time for 63% of the considered cases, and half of this percentage was related to buildings at an elevation of 0 cm facing canals.
The increased frequency of low and medium tides (<+120 cm) and the evidence of long-term effects of rising damp on masonries may indicate the need to enforce conservation interventions, in particular, on the lower part of masonries.
A visual observation methodology could be also integrated with data from traditional quantitative and other non-invasive approaches in order to have a comprehensive understanding of the rising damp phenomenon at the urban scale.
Biannual monitoring and the selection of new buildings is now under consideration to expand the dataset for assessing the impact of the MOSE system and climate changes. Moreover, the dataset could be discussed in relation to environmental conditions of the decades for evaluating the effects of specific conservation strategies.
Supplementary Materials
The following supporting information can be downloaded at: https://www.mdpi.com/article/10.3390/su15076274/s1. Table S1. Frequency table of variation in rising damp height; erosion extension; algal band; 0 = no significant variation; 1 = slight variation; 2 = significant variation; / = non assessable; Figure S1. Histogram of frequency of masonries cases categorized according to their altimetry (0; 100–110; 110–120; 121–130; 131–140; >140 cm on ZMPS) and distance from water (0 = directly in contact; 1 = 1–5 m away; 2 = >5 m from water); Table S2. Number of observations visualized as histograms categorized according to altimetry (0; 100–110; 110–120; 121–130; 131–140; >140 cm on ZMPS) and distance from water (0 = directly in contact; 1 = 1–5 m away; 2 = >5 m from water); Table S3. ANOVA results on variation in capillary front (blue line) and erosion extension (red line) in reference to water distance and altimetry; Table S4 Yearly cumulative precipitation and temperature 2000–2022 (left); monthly mean precipitation, relative humidity and average temperature during the 2000–2022 periods in Venice. Data freely available since 2000 on ARPAV Regional Agency of Veneto for the environmental protection and prevention and the Centro previsione e segnalazione maree, Municipality of Venice sites (www.Arpa.veneto.it; www.comune.venezia.it).
Author Contributions
Conceptualization, E.Z. and L.F.; methodology, E.Z., L.F. and E.B.; software, M.C.; validation, L.F., M.C., E.Z. and E.B.; investigation, L.F. and M.C.; resources, E.Z.; data curation, E.B.; writing—original draft preparation, L.F.; writing—review and editing, L.F., E.B. and E.Z.; supervision, E.Z.; project administration, E.Z. and L.F.; funding acquisition, E.Z. All authors have read and agreed to the published version of the manuscript.
Funding
Scientific activity performed in the Research Programme Venezia 2021, coordinated by CORILA, with the contribution of the Provveditorato for the Public Works of Veneto, Trentino Alto Adige and Friuli Venezia Giulia, Government of Italy.
Institutional Review Board Statement
Not applicable for studies not involving humans or animals.
Data Availability Statement
The GPS maps were implemented in the public resource of SOLVE’s website including the information on the dataset: https://geonode.corila.it/maps/193/embed#/ (accessed on 14 February 2023).
Acknowledgments
The authors would like to thank the Patto per lo Sviluppo della Città di Venezia (Comune di Venezia) for their support in this research.
Conflicts of Interest
The authors declare no conflict of interest. The funders had no role in the design of the study; in the collection, analyses, or interpretation of data; in the writing of the manuscript; or in the decision to publish the results.
References
- Camuffo, D. Rising Damp Treatment and Prevention. In Microclimate for Cultural Heritage, 3rd ed.; Camuffo, D., Ed.; Elsevier Science: London, UK, 2019; pp. 153–166. [Google Scholar]
- Falchi, L.; Slanzi, D.; Balliana, E.; Driussi, G.; Zendri, E. Rising Damp in Historical Buildings: A Venetian Perspective. Build Environ. 2018, 131, 117–127. [Google Scholar] [CrossRef]
- Franzoni, E. Rising Damp Removal from Historical Masonries: A Still Open Challenge. Constr. Build Mater. 2014, 54, 123–136. [Google Scholar] [CrossRef]
- Lubelli, B.; van Hees, R.P.J.; Bolhuis, J. Effectiveness of Methods against Rising Damp in Buildings: Results from the EMERISDA Project. J. Cult. Herit. 2018, 31, 15–22. [Google Scholar] [CrossRef] [Green Version]
- Lubelli, B.; Van Hees, R.P.J.; Groot, C.J.W.P. The Role of Sea Salts in the Occurrence of Different Damage Mechanisms and Decay Patterns on Brick Masonry. Constr. Build Mater. 2004, 18, 119–124. [Google Scholar] [CrossRef]
- Guolo, E.; Romagnoni, P.; Dalla Mora, T.; Peron, F. The Rising Damp in Venetian Masonry: Preliminary Results Comparing Laboratory Tests and Dynamic Simulations. Sustainability 2022, 15, 76. [Google Scholar] [CrossRef]
- Congedo, P.M.; Baglivo, C.; Quarta, G.; Di Gloria, P.; D’agostino, D. Definition of a Protocol for the Experimental Monitoring of Rising Damp in Three Different Masonry Models with Tuff, Carparo, and Lecce Stone. Energies 2022, 15, 892. [Google Scholar] [CrossRef]
- Hall, C.; Hoff, W.D. Water Transport in Brick, Stone and Concrete, 1st ed.; CRS Press: London, UK, 2002. [Google Scholar]
- Hall, C.; Hoff, W.D. Rising Damp: Capillary Rise Dynamics in Walls. Proc. R. Soc. A Math. Phys. Eng. Sci. 2007, 463, 1871–1884. [Google Scholar] [CrossRef]
- Bakolas, A.; Biscontin, G.; Zendri, E. The Effect of Sea Tides on Historical Brickwork in Venice. Mater. Struct. 1994, 27, 353–358. [Google Scholar] [CrossRef]
- Camuffo, D.; Bertolin, C.; Schenal, P. Climate Change, Sea Level Rise and Impact on Monuments in Venice. In Science, Technology and Cultural Heritage, 1st ed.; Rogerio-Candelera, A., Ed.; CRC Press: Boca Raton, FL, USA, 2014; pp. 13–30. [Google Scholar]
- Paolo Faccio the Lagoon Building and Water, Scientific Research and Safeguarding of Venice; CORILA: Venice, Italy, 2001.
- Biscontin, G.; Driussi, G. Indagini Sull’ Umidità Di Risalita a Venezia. Recuperare 1988, 33, 79–86. [Google Scholar]
- Zanchettin, D.; Bruni, S.; Raicich, F.; Lionello, P.; Adloff, F.; Androsov, A.; Antonioli, F.; Artale, V.; Carminati, E.; Ferrarin, C.; et al. Sea-Level Rise in Venice: Historic and Future Trends. Nat. Hazards Earth Syst. Sci. 2021, 21, 2643–2678. [Google Scholar] [CrossRef]
- Rubinetti, S.; Taricco, C.; Alessio, S.; Rubino, A.; Bizzarri, I.; Zanchettin, D. Robust Decadal Hydroclimate Predictions for Northern Italy Based on a Twofold Statistical Approach. Atmosphere 2020, 11, 671. [Google Scholar] [CrossRef]
- Trincardi, F.; Barbanti, A.; Bastianini, M.; Benetazzo, A.; Cavaleri, L.; Chiggiato, J.; Papa, A.; Pomaro, A.; Sclavo, M.; Tosi, L. The 1966 Flooding of Venice: What Time Taught Us for the Future. Oceanography 2016, 29, 178–186. [Google Scholar] [CrossRef] [Green Version]
- Cavaleri, L.; Bajo, M.; Barbariol, F.; Bastianini, M.; Benetazzo, A.; Bertotti, L.; Chiggiato, J.; Ferrarin, C.; Trincardi, F.; Umgiesser, G. The 2019 Flooding of Venice and Its Implications for Future Predictions. Oceanography 2020, 33, 42–49. [Google Scholar] [CrossRef] [Green Version]
- Berto, L.; Talledo, D.A.; Bruschi, G.; Zamboni, I.; Lazzarini, E.; Zofrea, C.; Faccio, P.; Saetta, A. A Multidisciplinary Approach for the Vulnerability Assessment of a Venetian Historic Palace: High Water Phenomena and Climate Change Effects. Buildings 2022, 12, 431. [Google Scholar] [CrossRef]
- Carbognin, L.; Teatini, P.; Tomasin, A.; Tosi, L. Global Change and Relative Sea Level Rise at Venice: What Impact in Term of Flooding. Clim. Dyn. 2010, 35, 1055–1063. [Google Scholar] [CrossRef]
- Indirli, M.; Knezic, S.; Borg, R.P.; Kaluarachchi, Y.; Ranguelov, B.; Romagnoli, F.; Rochas, C. The ANDROID Case Study; Venice and Its Territory: A General Overview. Procedia. Econ. Financ. 2014, 18, 837–848. [Google Scholar] [CrossRef] [Green Version]
- Samiolo, R. Commensuration and Styles of Reasoning: Venice, Cost–Benefit, and the Defence of Place. Account. Organ. Soc. 2012, 37, 382–402. [Google Scholar] [CrossRef] [Green Version]
- Cian, F.; Giupponi, C.; Marconcini, M. Integration of Earth Observation and Census Data for Mapping a Multi-Temporal Flood Vulnerability Index: A Case Study on Northeast Italy. Natl. Hazards 2021, 106, 2163–2184. [Google Scholar] [CrossRef]
- Gallina, V.; Torresan, S.; Zabeo, A.; Critto, A.; Glade, T.; Marcomini, A. A Multi-Risk Methodology for the Assessment of Climate Change Impacts in Coastal Zones. Sustainability 2020, 12, 3697. [Google Scholar] [CrossRef]
- Vergano, L.; Umgiesser, G.; Nunes, P.A.L.D. An Economic Assessment of the Impacts of the MOSE Barriers on Venice Port Activities. Transp. Res. D Transp. Env. 2010, 15, 343–349. [Google Scholar] [CrossRef] [Green Version]
- Hernández-Montes, E.; Hdz-Gil, L.; Coletti, C.; Dilaria, S.; Germinario, L.; Mazzoli, C. Prediction Model for the Evolution of the Deterioration of Bricks in Heritage Buildings in Venice Caused by Climate Change. Heritage 2023, 6, 483–491. [Google Scholar] [CrossRef]
- MOSE the Project. Available online: https://www.mosevenezia.eu/project/?lang=en (accessed on 20 March 2023).
- Anna Somers Cocks Venice Erects Glass Barriers around St Mark’s Basilica to Fight Flooding. 2022. Available online: https://www.theartnewspaper.com/2022/11/28/st-marks-basilica-now-surrounded-by-a-glass-wall-against-flooding (accessed on 20 March 2023).
- Erkomaishvili, N.; Kublashvili, N.; Ninoshvili, L.; Gotsadze, T.; Kobakhidze, G. Llustrated Glossary on Stone Deterioration Patterns, English/German Version, 2010th ed.; ICOMOS: Paris, France, 2008; Volume XV, Available online: https://www.icomos.org/en/component/content/article/116-english-categories/resources/publications/261-monumentsasites-xv (accessed on 20 March 2023).
- CEN/TC 346 EN 16096:2012. Conservation of Cultural Property—Condition Survey and Report of Built Cultural. Available online: https://standards.iteh.ai/catalog/tc/cen/782ad083-d5d4-4d4f-ac6d-36572d262c15/cen-tc-346 (accessed on 20 March 2023).
- Randazzo, L.; Collina, M.; Ricca, M.; Barbieri, L.; Bruno, F.; Arcudi, A.; La Russa, M.F. Damage Indices and Photogrammetry for Decay Assessment of Stone-Built Cultural Heritage: The Case Study of the San Domenico Church Main Entrance Portal (South Calabria, Italy). Sustainability 2020, 12, 5198. [Google Scholar] [CrossRef]
- Kamh, G.M.; Oguchi, C.T. Weathering Processes and Mapping of Rock’s Damage Category Using GIS at Yoshimi Region, Japan. Arab. J. Geosci. 2021, 14, 743–756. [Google Scholar] [CrossRef]
- Ertemir, D.Y.; Edis, E. Sustaining Modern Heritage Buildings: Visual Defect Categorisation Guides for the General Condition Survey of Rendered-Painted Facades. Int. J. Build Pathol. Adapt. 2022; ahead-of-print. [Google Scholar] [CrossRef]
- Gaddi, R.; Cacace, C.; Di Menno di Bucchianico, A. The Risk Assessment of Surface Recession Damage for Architectural Buildings in Italy. J. Cult. Herit. 2022, 57, 118–130. [Google Scholar] [CrossRef]
- Fitzner, B.H.K.L.B.D. Damage Index for Stone Monuments. In Proceedings of the 5th International Symposium on the Conservation of Monuments in the Mediterranean Basin, Sevilla, Spain, 5–8 April 2000; pp. 315–326. [Google Scholar]
- Camuffo, D. Canaletto’s Paintings Open a New Window on the Relative Sea-Level Rise in Venice. J. Cult. Herit. 2001, 2, 277–281. [Google Scholar] [CrossRef]
- Venezia 2021. 2023. Available online: http://venezia2021.corila.it/home_ve2021/ (accessed on 20 March 2023).
- Insula Spa Tecap Studio Srl Innova Technology Solutions Spa; RAMSES (Rilievo Altimetrico, Modellazione Spaziale E Scansione3D—Altimetric Survey, Spatial Modeling and 3D Scan. Available online: http://smu.insula.it/index.php@option=com_content&view=article&id=114&Itemid=81&lang=it.html (accessed on 20 March 2023).
- OpenStreetMap Contributors. Available online: https://www.openstreetmap.org/#map=5/42.088/12.564 (accessed on 18 March 2023).
- Spitz, E. Effetto Mose Le Sfide Di Un Progetto per Il Futuro; Marsilio Ed: Padova, Italy, 2021. [Google Scholar]
- Ferrarin, C.; Bajo, M.; Benetazzo, A.; Cavaleri, L.; Chiggiato, J.; Davison, S.; Davolio, S.; Lionello, P.; Orlić, M.; Umgiesser, G. Local and Large-Scale Controls of the Exceptional Venice Floods of November 2019. Prog. Oceanogr. 2021, 197, 102628. [Google Scholar] [CrossRef]
- Available online: https://Www.Arpa.Veneto.It/Notizie/in-Primo-Piano/Il-Meteo-Nel-2022-in-Veneto-Un-Anno-Da-Record-per-Caldo-e-Deficit-Di-Precipitazioni (accessed on 20 March 2023).
- Centro Previsioni e Segnalazioni Maree Municipality of Venice Altimetric Reference for Venice. Available online: https://www.comune.venezia.it/it/content/centro-previsioni-e-segnalazioni-maree (accessed on 20 March 2023).
- QGIS Development Team QGIS Geographic Information System. Available online: https://www.qgis.org/it/site/ (accessed on 20 March 2023).
- Falchi, L.; Rosina, A.; Corradini, M.; Zendri, E. A GIS Tool for Highlighting the Rising Damp Phenomenon in Venice. Available online: https://geonode.corila.it/maps/193/embed (accessed on 23 March 2023).
- Weiß, C.H. StatSoft, Inc., Tulsa, OK.: STATISTICA, Version 8. AStA Adv. Stat. Anal. 2007, 91, 339–341. [Google Scholar] [CrossRef]
- Cao, D.S.; Huang, J.H.; Liang, Y.Z.; Xu, Q.S.; Zhang, L.X. Tree-Based Ensemble Methods and Their Applications in Analytical Chemistry. TrAC Trends Anal. Chem. 2012, 40, 158–167. [Google Scholar] [CrossRef]
- Breiman, L.; Friedman, J.H.; Olshen, R.A.; Stone, C.J. Classification and Regression Trees, 1st ed.; Routledge: New York, NY, USA, 2017. [Google Scholar]
- Dati e Statistiche|Comune Di Venezia. Available online: https://www.comune.venezia.it/it/content/dati-e-statistiche (accessed on 1 July 2022).
- Guolo, E.; Romagnoni, P.; Peron, F. Capillary Rising Damp in Venetian Context: State of the Art and Numerical Simulation. J. Phys. Conf. Ser. 2021, 2069, 012046. [Google Scholar] [CrossRef]
- Qualità Dell’aria—Arpa Veneto. Available online: https://www.arpa.veneto.it/arpavinforma/indicatori-ambientali/indicatori_ambientali/atmosfera/qualita-dellaria (accessed on 1 July 2022).
- ARPAV Veneto Regional Agency for Environmental Protection and Prevention Annual Precipitation in Venice. 2022. Available online: https://www.arpa.veneto.it/arpavinforma/pubblicazioni/arpav-regional-agency-for-environmental-protection-and-prevention-of-the-veneto (accessed on 20 March 2023).
- Bertolin, C. Preservation of Cultural Heritage and Resources Threatened by Climate Change. Geosciences 2019, 9, 250. [Google Scholar] [CrossRef] [Green Version]
Figure 1.
(A) Dorsoduro 3246: external wall of Ca’ Foscari (15 September 2022) is an example of a suitable picture for visual analysis of a palace directly in contact with the lagoon water. (B) Cannareggio 4925: Ca’ Zen (up 18 July 2010; down 27 January 2021) showing a rejected site due to unknown intervention of replacement of bricks is an example of a building far from the water. (C) Santa Croce 1033: Ca’ Talenti “delle Oche” was a rejected site due to works in progress covering the façade.

Figure 2.
Map depicting the position (indicated as red circle) of the feasible sites selected for this study within the city of Venice.
Figure 2.
Map depicting the position (indicated as red circle) of the feasible sites selected for this study within the city of Venice.

Figure 3.
San Marco 556 A Rio dei Bareteri (calle Erizzo). Pictures taken in different times and climatic conditions.
Figure 3.
San Marco 556 A Rio dei Bareteri (calle Erizzo). Pictures taken in different times and climatic conditions.

Figure 4.
(A) Example of different extensions of plaster on the same wall in different periods (above: 1990, below: 1970). (B) Evidence of rising damp front (5115 Calle Larga dei Botteri, above: 2003, below: 2021). (C) Example of algal band variation (2802 Ponte San Tomà, above: 2006, below: 2021). (D) Example of decayed bricks (6123 Campo S. Maria Formosa, Ca’ Donà, above: 2004, below: 2021).

Figure 5.
Three notable examples of comparison and of evaluation of the descriptors: Variation in height of capillary rise front, variation in algal band, and variation in brick-erosion area. GPS= georeferenced location latitude–longitude; A* = altimetry on the local reference level ZMPS; ++ remarkable increase, + significant increase, = similar level, and / non comparable.

Figure 6.
Map of Venice depicting variations in the sharp front levels of rising damp. Dots represent the evaluated cases: −1 blue = decrease in sharp front level; 0 green = no variation; 1 orange = increase; and 2 red= remarkable increase. The colored lines on the background identify altimetry curves (see legend).

Figure 7.
Map of Venice depicting variation in decayed brick extensions. Squares represent the evaluated cases and their colors identify the following marks: green = no variation; orange = increase in sharp front level; red = remarkable increase; and uncolored = / non comparable. The colored lines identify altimetry curves (see legend).

Figure 8.
Map of Venice depicting variation in algal band levels. Diamonds represent the evaluated cases: light green (−1, 0) = negative or no variation; green (1) = slight increase in height of algal band; and dark green (2) = significant variation in the algal band level. The colored lines identify altimetry curves (see legend).

Figure 9.
Tree graph for variation in rising damp fronts in relation to altimetry and distance from water. Within each square, the leaf number ID, the number of observations for that leaf N, the mean value Mu, and the variance Var are given. For each branch, the factors leading to the division (altimetry or water distance) and the respective altimetry classes of 0, 100–110, 111–120, 121–130, 131–140, and <140 and 0 = on water, 1 = nearby water, and 2 = far from water are given.


Table 1.
Evaluation of rising damp front increase as nr of cases and corresponding percentages on total cases at a given masonry altimetry. ++ remarkable increase, + significant increase, = similar level, and − = decrease.
Table 1.
Evaluation of rising damp front increase as nr of cases and corresponding percentages on total cases at a given masonry altimetry. ++ remarkable increase, + significant increase, = similar level, and − = decrease.
| Altimetry on ZMPS (cm) | ++ | + | = | − |
|---|---|---|---|---|
| 0 | 0/74 (0%) | 23/74 (31.1%) | 50/74 (67.6%) | 1/74 (1.3%) |
| +100–110 | 0/14 (0%) | 3/14 (21.4%) | 11/14 (78.6%) | 0/14 (0%) |
| +111–120 | 5/32 (15.6%) | 11/32 (34.4%) | 16/32 (50%) | 0/32 (0%) |
| +121–130 | 0/21 (0%) | 12/21 (57.1%) | 9/21 (42.9%) | 0/21 (0%) |
| +131–140 | 1/12 (8.3%) | 5/12 (41.7%) | 6/12 (50%) | 0/12 (0%) |
| +141–150 | 1/13 (7.7%) | 2/13 (15.4%) | 8/13 (61.5%) | 2/13 (15.4%) |
| +151–160 | 0/9 (0%) | 5/9 (55.6%) | 4/9 (44.4%) | 0/9 (0%) |
| >+161 | 0/4 (0%) | 2/4 (50%) | 2/4 (50%) | 0/4 (0%) |
| Total | 7/179 (3.9%) | 63/179 (35.2%) | 106/179 (59.2%) | 3/179 (1.7%) |
Table 2.
Evaluation of damaged brick band extension as number of cases and corresponding percentages on total cases at a given masonry altimetry. ++ remarkable increase, + significant increase, = similar level, and − = decrease.
Table 2.
Evaluation of damaged brick band extension as number of cases and corresponding percentages on total cases at a given masonry altimetry. ++ remarkable increase, + significant increase, = similar level, and − = decrease.
| Altimetry on ZMPS (cm) | ++ | + | = | − |
|---|---|---|---|---|
| 0 | 2/61 (3.3%) | 15/61 (24.6%) | 44/61 (72.1%) | 0/61 (0%) |
| 100–110 | 1/10 (10%) | 3/10 (30%) | 6/10 (60%) | 0/10 (0%) |
| 111–120 | 0/19 (0%) | 9/19 (47.4%) | 10/19 (52.6%) | 0/19 (0%) |
| 121–130 | 0/13 (0%) | 8/13 (61.5%) | 5/13 (38.5%) | 0/13 (0%) |
| 131–140 | 0/8 (0%) | 3/8 (37.5%) | 5/8 (62.5%) | 0/8 (0%) |
| 141–150 | 0/7 (0%) | 3/7 (42.9%) | 4/7 (57.1) | 0/7 (0%) |
| 151–160 | 0/7 (0%) | 2/7 (28.6%) | 5/7 (71.4%) | 0/7 (0%) |
| >161 | 0/2 (0%) | 1/2 (50%) | 1/2 (50%) | 0/2 (0%) |
Table 3.
Number of total tides and tidal time for each altimetry in the periods between 2000–2009 and 2010–2019.
Table 3.
Number of total tides and tidal time for each altimetry in the periods between 2000–2009 and 2010–2019.
| Altimetry (cm on ZMPS) | Nr. of Tides Events Higher than Altimetry (#) | Contact with Salty Water: Duration (h, min) | ||
|---|---|---|---|---|
| 2000–2009 | 2010–2019 | 2000–2009 | 2010–2019 | |
| 0 | / | / | / | / |
| 100–110 | 141 | 234 | 362.05 | 642.55 |
| 111–120 | 52 | 95 | 133.10 | 260.50 |
| 121–130 | 20 | 40 | 54.55 | 106.25 |
| 131–140 | 9 | 16 | 25.0 | 48.40 |
| 141–150 | 5 | 11 | 11.05 | 22.10 |
| 151–160 | 1 | 4 | 1.20 | 3.55 |
| >161 | 0 | 3 | 0 | 2.35 |
Disclaimer/Publisher’s Note: The statements, opinions and data contained in all publications are solely those of the individual author(s) and contributor(s) and not of MDPI and/or the editor(s). MDPI and/or the editor(s) disclaim responsibility for any injury to people or property resulting from any ideas, methods, instructions or products referred to in the content. |
© 2023 by the authors. Licensee MDPI, Basel, Switzerland. This article is an open access article distributed under the terms and conditions of the Creative Commons Attribution (CC BY) license (https://creativecommons.org/licenses/by/4.0/).
Share and Cite
MDPI and ACS Style
Falchi, L.; Corradini, M.; Balliana, E.; Zendri, E. Urban Scale Monitoring Approach for the Assessment of Rising Damp Effects in Venice. Sustainability 2023, 15, 6274. https://doi.org/10.3390/su15076274
AMA Style
Falchi L, Corradini M, Balliana E, Zendri E. Urban Scale Monitoring Approach for the Assessment of Rising Damp Effects in Venice. Sustainability. 2023; 15(7):6274. https://doi.org/10.3390/su15076274
Chicago/Turabian StyleFalchi, Laura, Martina Corradini, Eleonora Balliana, and Elisabetta Zendri. 2023. "Urban Scale Monitoring Approach for the Assessment of Rising Damp Effects in Venice" Sustainability 15, no. 7: 6274. https://doi.org/10.3390/su15076274
Note that from the first issue of 2016, this journal uses article numbers instead of page numbers. See further details here.