
Sediment Contamination by Heavy Metals and PAH in the Piombino Channel (Tyrrhenian Sea)

 ,
,  , ,
, ,
Abstract
:1. Introduction
2. Materials and Methods
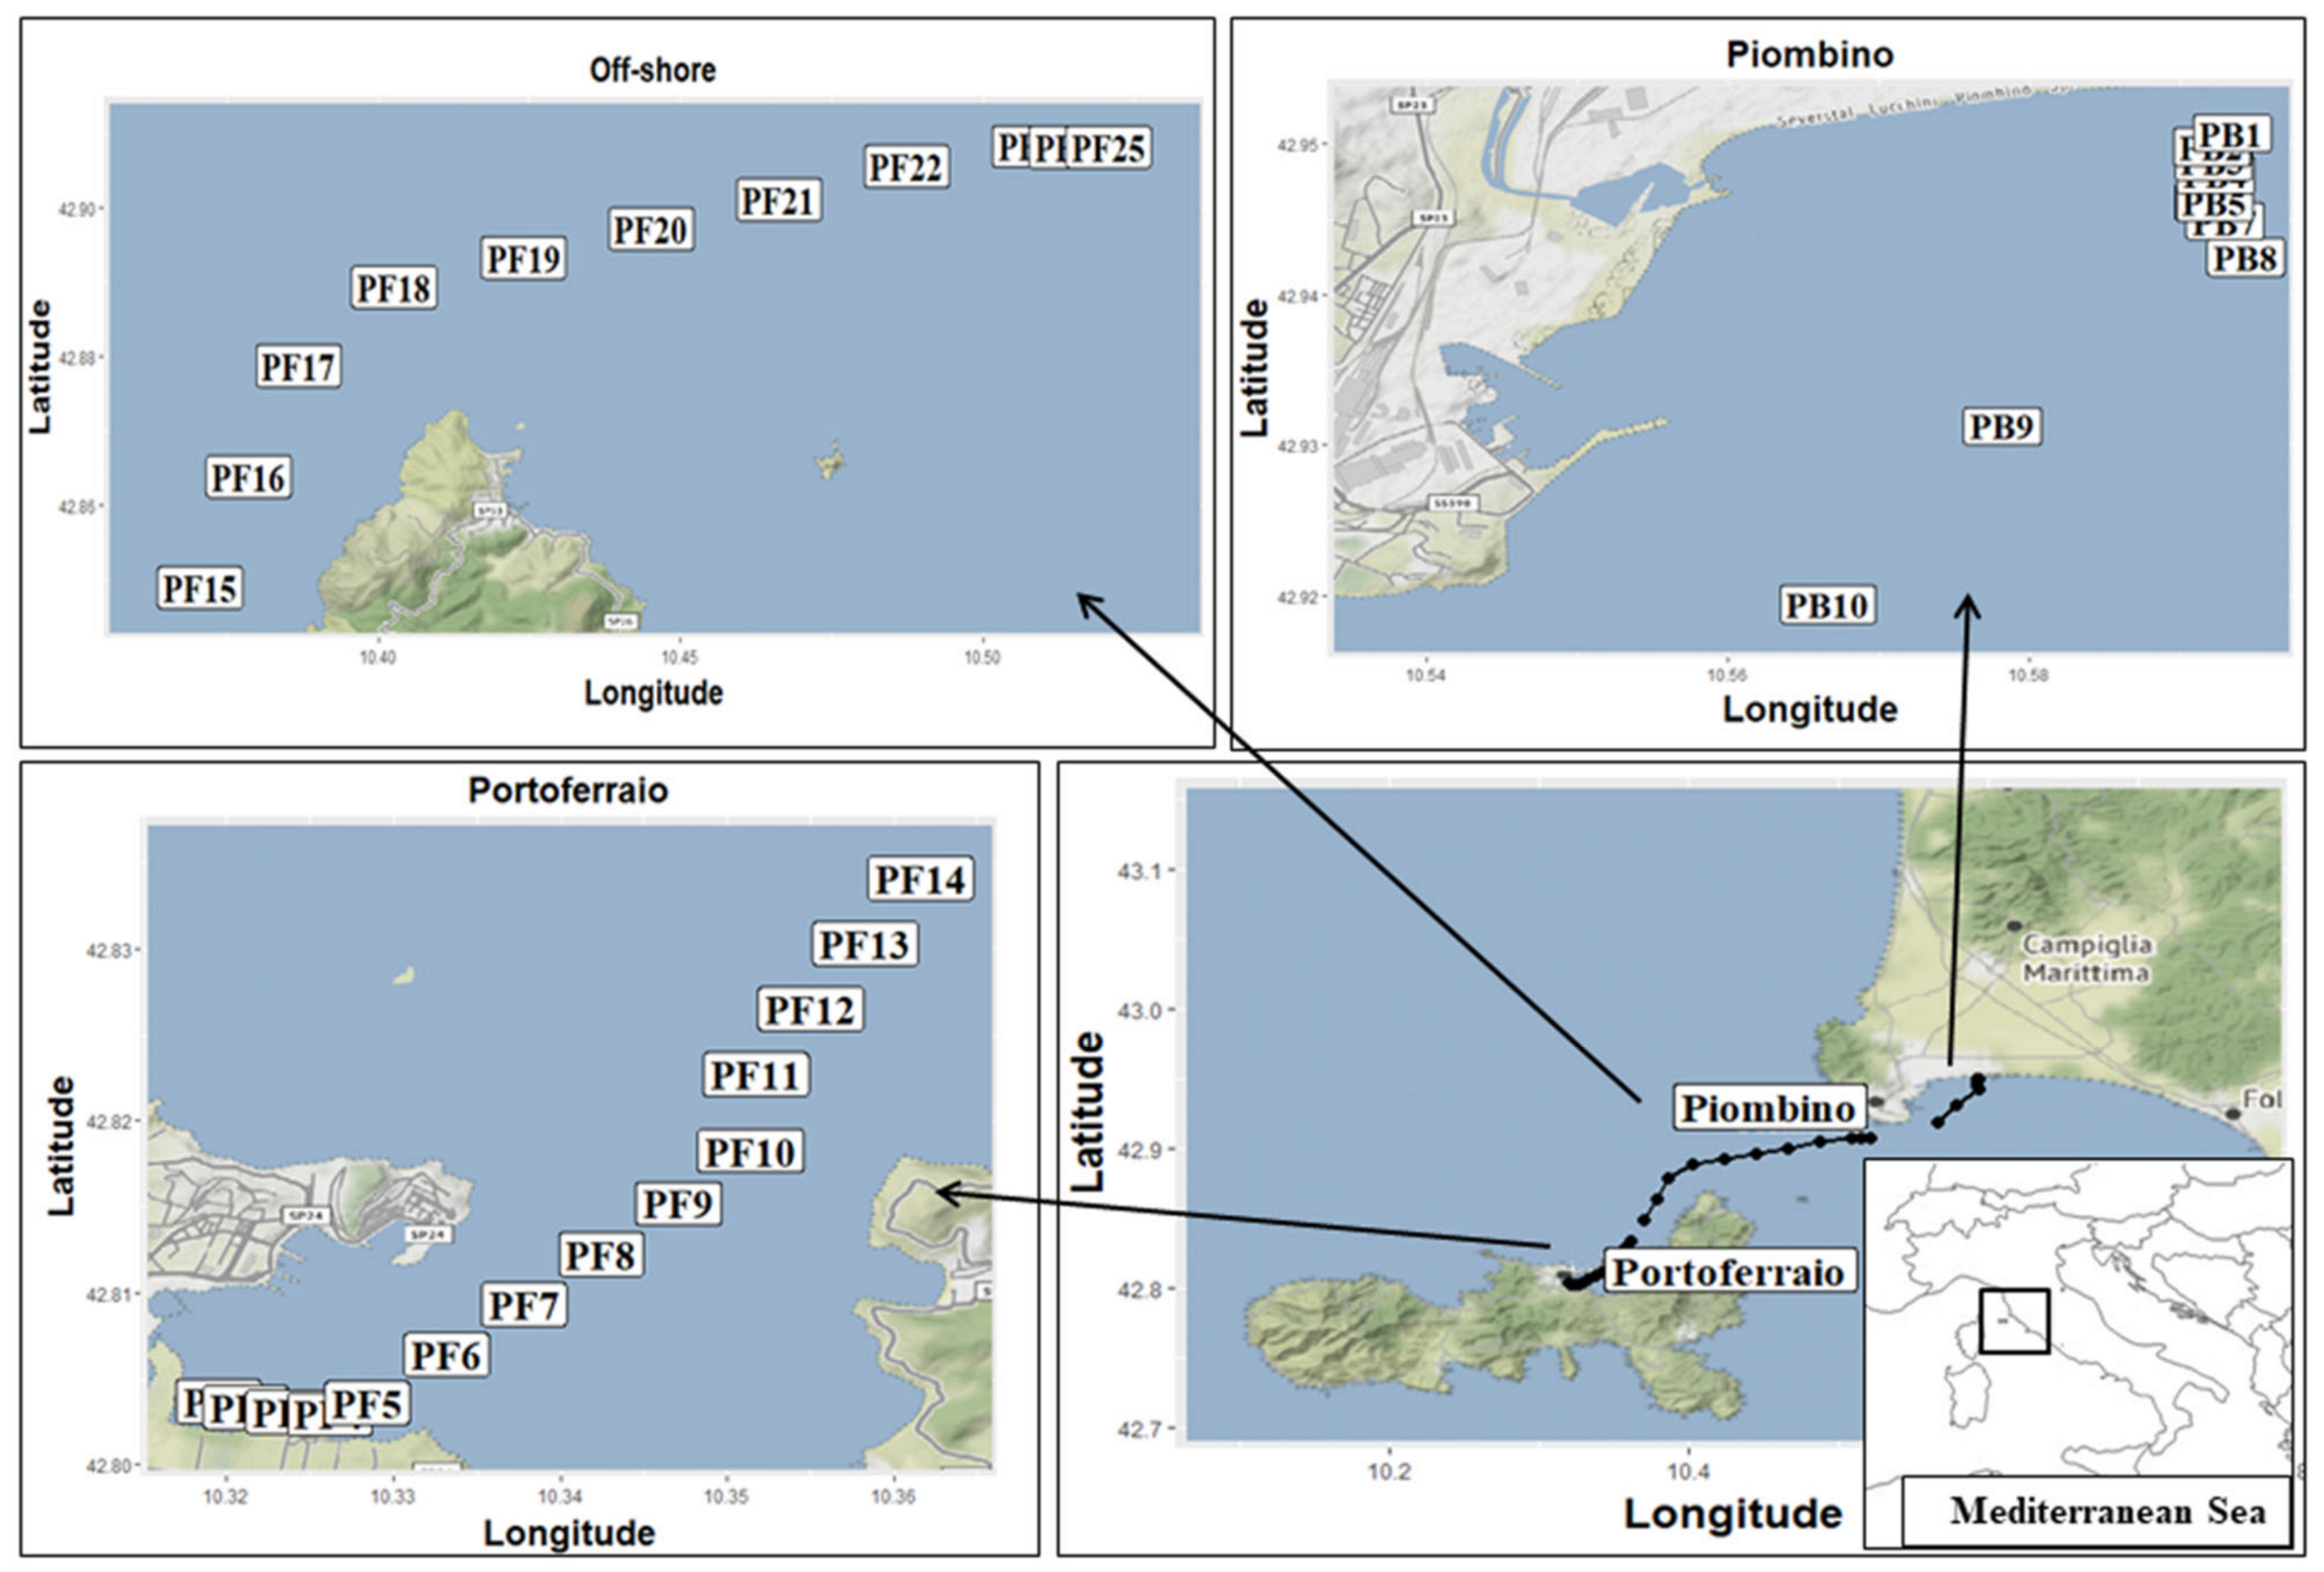
2.1. Study Area
2.2. Sample Collection and Chemical Analysis Methods
2.3. Data Analyses
3. Results
4. Discussion
Author Contributions
Funding
Institutional Review Board Statement
Informed Consent Statement
Data Availability Statement
Acknowledgments
Conflicts of Interest
Appendix A

| Longitude (E) | Latitude (N) | Depth | Gravel | Sand | Silt | Clay | % Water | Ptot | Ntot | TOC | ||
|---|---|---|---|---|---|---|---|---|---|---|---|---|
| Portoferraio | PF1 | 10°19′10.21″ | 42°48′13.33″ | 1 | 1.1 | 13 | 42.1 | 43.9 | 59.9 | 233.4 | 237.7 | 4.4 |
| PF2 | 10°19′15.95″ | 42°48′12.09″ | 2 | 0 | 12.5 | 46.6 | 40.9 | 55.7 | 258.1 | 284.5 | 4.7 | |
| PF3 | 10°19′25.22″ | 42°48′11.11″ | 2.7 | 1.3 | 9.5 | 46.3 | 42.9 | 52.7 | 251.7 | 267.5 | 4.9 | |
| PF4 | 10°19′34.19″ | 42°48′10.62″ | 2.9 | 14.5 | 40.4 | 27.3 | 17.9 | 43.5 | 172.2 | 131.2 | 3.6 | |
| PF5 | 10°19′42.25″ | 42°48′12.92″ | 4.3 | 7 | 41.2 | 37.7 | 14.1 | 55.6 | 264.6 | 171.0 | 4.2 | |
| PF6 | 10°19′42.25″ | 42°48′12.92″ | 12.4 | ND | ND | ND | ND | 56.4 | 198.8 | 151.0 | 4.1 | |
| PF7 | 10°20′16.16″ | 42°48′33.57″ | 28 | ND | ND | ND | ND | 56.5 | 268.2 | 246.7 | 4.2 | |
| PF8 | 10°20′32.81″ | 42°48′44.10″ | 31 | 6.2 | 31.3 | 44.8 | 17.7 | 41.1 | 196.8 | 152.9 | 2.4 | |
| PF9 | 10°20′49.50″ | 42°48′54.67″ | 36 | ND | ND | ND | ND | 21.0 | 129.1 | 138.5 | 0.3 | |
| PF10 | 10°21′05.02″ | 42°49′05.71″ | 40.5 | ND | ND | ND | ND | 20.1 | 127.3 | 151.6 | 0.3 | |
| PF11 | 10°21′06.21″ | 42°49′21.71″ | 55 | 15.7 | 46 | 23.7 | 14.6 | 31.6 | 251.5 | 152.6 | 0.7 | |
| PF12 | 10°21′18.09″ | 42°49′35.41″ | 54.5 | ND | ND | ND | ND | 25.2 | 289.9 | 135.3 | 0.6 | |
| PF13 | 10°21′29.84″ | 42°49′49.05″ | 62 | ND | ND | ND | ND | 24.5 | 230.4 | 156.9 | 0.3 | |
| PF14 | 10°21′41.72″ | 42°50′02.68″ | 65 | 4.7 | 43.8 | 32.8 | 18.7 | 28.9 | 222.8 | 151.2 | 0.7 | |
| Off-shore | PF15 | 10°22′14.01″ | 42°50′56.34″ | 71.5 | 4.1 | 36.4 | 31.3 | 28.1 | 40.2 | 567.8 | 106.5 | 0.96 |
| PF16 | 10°22′42.92″ | 42°51′50.07″ | 71.5 | 2.8 | 46 | 25 | 26.1 | 36.0 | 538.6 | 128.7 | 0.9 | |
| PF17 | 10°23′12.63″ | 42°52′43.59″ | 70.5 | 7.7 | 58.4 | 15.6 | 18.3 | 31.2 | 548.1 | 150.7 | 0.5 | |
| PF18 | 10°23′12.63″ | 42°52′43.59″ | 68.5 | 1.8 | 83.2 | 6.8 | 8.2 | 35.4 | 474.5 | 94.1 | 1.2 | |
| PF19 | 10°25′26.55″ | 42°53′35.76″ | 64.5 | 1.4 | 90.5 | 3.1 | 5 | 29.7 | 450.1 | 91.4 | 0.2 | |
| PF20 | 10°26′42.53″ | 42°53′49.65″ | 53 | 17.7 | 73.1 | 4.4 | 4.7 | 28.3 | 438.5 | 84.2 | 1.5 | |
| PF21 | 10°27′58.62″ | 42°54′03.76″ | 46 | 12 | 79.6 | 4 | 4.4 | 32.8 | 381.5 | 22.4 | 0.2 | |
| PF22 | 10°29′14.67″ | 42°54′19.76″ | 38.5 | 11.4 | 78.2 | 4.5 | 5.9 | 28.0 | 362.5 | 64.5 | 1.4 | |
| PF23 | 10°30′30.97″ | 42°54′29.46″ | 38 | 20.1 | 69.2 | 5.8 | 4.9 | 23.5 | 324.8 | 63.7 | 0.2 | |
| PF24 | 10°30′52.71″ | 42°54′29.14″ | 31.5 | 28.3 | 65.2 | 3.2 | 3.3 | 18.1 | 298.8 | 99.1 | 0.3 | |
| PF25 | 10°31′14.63″ | 42°54′29.24″ | 31 | 9.7 | 80.3 | 5.3 | 4.6 | 26.2 | 334.1 | 106.4 | 0.3 | |
| Piombino | PB10 | 10°33′59.84″ | 42°55′09.93″ | 26 | 0 | 18.9 | 46.4 | 34.7 | 39.5 | 439.1 | 147.6 | 1.6 |
| PB9 | 10°34′41.51″ | 42°55′52.54″ | 21.2 | 0 | 3.6 | 44 | 52.4 | 37.9 | 203.2 | 131.7 | 1.5 | |
| PB8 | 10°35′39.73″ | 42°56′32.97″ | 14.5 | 0 | 1.4 | 48.1 | 50.5 | 45.5 | 323.8 | 135.7 | 1.2 | |
| PB7 | 10°35′34.70″ | 42°56′41.53″ | 11.1 | 0 | 3.1 | 60.7 | 36.2 | 41.0 | 283.7 | 132.5 | 1.9 | |
| PB6 | 10°35′32.08″ | 42°56′46.11″ | 10.5 | 0.4 | 43.9 | 30.5 | 25.2 | 30.0 | 162.8 | 58.5 | 0.7 | |
| PB5 | 10°35′32.21″ | 42°56′46.11″ | 9 | 0 | 89.8 | 4.1 | 6.1 | 24.6 | 116.4 | 143.2 | 1.1 | |
| PB4 | 10°35′32.43″ | 42°56′52.65″ | 7 | 4 | 86 | 5.6 | 4.5 | 16.9 | 103.0 | 45.0 | 0.2 | |
| PB3 | 10°35′31.98″ | 42°56′55.87″ | 5.6 | 0.4 | 59.7 | 37.2 | 2.6 | 19.1 | 73.7 | 58.0 | 0.2 | |
| PB2 | 10°35′31.59″ | 42°56′59.31″ | 4.2 | 11.8 | 83.6 | 1.7 | 2.9 | 17.8 | 63.0 | 185.4 | 0.2 | |
| PB1 | 10°35′36.48″ | 42°57′02.61″ | 3.7 | 2.8 | 92.6 | 2.4 | 2.3 | 15.0 | 56.7 | 174.6 | <0.08 |
| N | Ant | Phe | Acy | Ace | Fl | Flu | Py | BaA | Chry | BbjFlu | BaP | BkFlu | IndPy | BPI | DBA | BeP | |||
|---|---|---|---|---|---|---|---|---|---|---|---|---|---|---|---|---|---|---|---|
| NT | 35 | 45 | − | − | − | − | 110 | − | − | − | − | 30 | 20 | 70 | 55 | − | − | ||
| ERL | 160 | 85,3 | 240 | 44 | 16 | 19 | 600 | 665 | 261 | 384 | − | 430 | − | − | − | − | − | ||
| ERM | 2100 | 1100 | 1500 | 640 | 500 | 540 | 5100 | 2600 | 1600 | 2800 | − | 1600 | − | − | − | − | − | ||
| Portoferraio | PF1 | avg | 1.4 | 320.2 | 190.1 | 137.6 | 3.5 | 20.2 | 2409.9 | 1773.3 | 1567.9 | 2176.1 | 2139.2 | 115.0 | 695.6 | 67.3 | 50.6 | 22.5 | 565.2 |
| sd | 0.4 | 535.2 | 318.1 | 225.1 | 5.6 | 29.8 | 4081.1 | 2987.4 | 2631.4 | 3653.1 | 3546.8 | 187.1 | 1148.1 | 114.8 | 87.3 | 37.9 | 945.2 | ||
| PF2 | avg | 11.4 | 125.3 | 68.9 | 120.7 | 1.7 | 6.1 | 959.3 | 838.4 | 583.6 | 940.4 | 1326.1 | 64.4 | 431.8 | 45.7 | 36.1 | 14.3 | 354.0 | |
| sd | 18.7 | 205.6 | 112.4 | 198.1 | 1.4 | 6.0 | 1610.7 | 1403.9 | 964.3 | 1566.0 | 2195.7 | 102.8 | 710.5 | 78.7 | 62.1 | 24.4 | 591.6 | ||
| PF3 | avg | 0.3 | 49.7 | 32.7 | 46.6 | 0.6 | 3.0 | 383.7 | 336.0 | 269.7 | 433.3 | 605.3 | 31.6 | 204.6 | 22.0 | 17.2 | 7.2 | 108.1 | |
| sd | 0.1 | 77.2 | 51.8 | 71.8 | 0.7 | 4.9 | 620.3 | 544.7 | 426.6 | 696.9 | 948.7 | 47.2 | 319.1 | 35.4 | 28.6 | 11.4 | 168.6 | ||
| PF4 | avg | 3.6 | 9.7 | 5.2 | 12.9 | 0.8 | 2.2 | 68.3 | 63.6 | 48.3 | 71.0 | 115.0 | 7.2 | 39.3 | 3.1 | 2.0 | 1.2 | 23.2 | |
| sd | 5.8 | 10.7 | 4.3 | 18.1 | 0.5 | 1.8 | 98.7 | 90.3 | 69.0 | 106.1 | 177.0 | 9.0 | 58.8 | 5.0 | 3.2 | 1.7 | 33.1 | ||
| PF5 | avg | 46.8 | 120.6 | 72.3 | 102.0 | 12.0 | 20.7 | 613.5 | 569.4 | 413.9 | 640.9 | 767.9 | 44.1 | 258.6 | 28.7 | 24.1 | 9.5 | 162.3 | |
| sd | 9.4 | 151.2 | 66.0 | 112.2 | 12.0 | 16.5 | 627.1 | 612.0 | 439.9 | 777.3 | 928.9 | 50.2 | 306.0 | 39.3 | 33.8 | 12.4 | 190.0 | ||
| PF6 | avg | <0.2 | 5.6 | 6.2 | 3.8 | 1.2 | 1.6 | 21.1 | 19.5 | 16.7 | 24.7 | 37.1 | 3.6 | 14.0 | 0.8 | 0.2 | 0.4 | 9.0 | |
| sd | ND | 6.3 | 8.2 | 4.8 | 1.8 | 2.4 | 30.3 | 29.7 | 23.4 | 38.0 | 56.4 | 2.8 | 19.5 | 1.0 | 0.0 | 0.3 | 11.3 | ||
| PF7 | avg | 0.3 | 47.7 | 32.1 | 35.6 | 5.6 | 9.4 | 237.8 | 212.0 | 181.4 | 315.6 | 324.2 | 19.4 | 121.4 | 20.2 | 15.6 | 6.3 | 72.3 | |
| sd | 0.2 | 75.9 | 48.8 | 55.3 | 5.9 | 11.4 | 378.8 | 336.3 | 280.0 | 501.7 | 493.3 | 28.1 | 185.0 | 24.7 | 19.1 | 7.8 | 110.0 | ||
| PF8 | avg | <0.2 | 2.9 | 1.8 | 2.3 | 0.3 | 0.4 | 12.2 | 10.7 | 10.6 | 15.9 | 16.5 | 2.3 | 6.6 | <0.2 | <0.2 | <0.2 | 7.4 | |
| sd | ND | 1.5 | 1.0 | 1.7 | 0.2 | 0.3 | 11.2 | 9.6 | 8.8 | 14.1 | 14.0 | 1.1 | 4.7 | ND | ND | ND | 6.3 | ||
| PF9 | avg | 6.2 | 2.6 | 2.1 | 1.4 | 0.8 | 1.7 | 5.4 | 7.3 | 4.5 | 13.2 | 5.9 | 1.2 | 2.8 | <0.2 | <0.2 | <0.2 | 2.5 | |
| sd | 10.4 | 3.1 | 2.5 | 1.9 | 0.1 | 1.6 | 8.1 | 9.5 | 6.3 | 17.3 | 9.0 | 0.6 | 3.5 | ND | ND | ND | 2.9 | ||
| PF10 | avg | <0.2 | 2.8 | 3.5 | 1.2 | 1.0 | 1.1 | 10.0 | 12.2 | 6.4 | 22.3 | 10.3 | 1.4 | 3.3 | <0.2 | <0.2 | <0.2 | 2.9 | |
| sd | ND | 3.0 | 4.5 | 1.6 | 0.4 | 0.5 | 16.1 | 17.0 | 10.0 | 7.6 | 13.8 | 0.6 | 4.1 | ND | ND | ND | 3.3 | ||
| PF11 | avg | 20.8 | 35.8 | 22.2 | 18.5 | 2.2 | 4.8 | 125.0 | 115.1 | 93.0 | 141.0 | 141.1 | 9.1 | 47.2 | 4.3 | 3.3 | 1.5 | 34.5 | |
| sd | 19.7 | 57.8 | 34.0 | 27.6 | 0.1 | 0.6 | 207.5 | 189.0 | 153.9 | 234.4 | 232.9 | 12.6 | 75.7 | 7.1 | 5.4 | 2.2 | 54.1 | ||
| PF12 | avg | 0.7 | 1.6 | 1.8 | 0.8 | 0.4 | 1.0 | 2.6 | 2.1 | 2.6 | 2.7 | 3.1 | 1.4 | 1.9 | <0.2 | <0.2 | <0.2 | 1.9 | |
| sd | 0.6 | 0.9 | 0.3 | 0.0 | 1.0 | 2.4 | 2.4 | 2.5 | 2.3 | 3.3 | 0.5 | 1.3 | ND | ND | ND | 1.1 | |||
| PF13 | avg | 0.3 | 1.3 | 2.0 | 0.6 | 0.6 | 1.5 | 0.9 | 0.3 | 0.8 | 1.1 | 0.6 | 1.3 | 1.1 | <0.2 | <0.2 | <0.2 | 1.2 | |
| sd | 0.0 | 0.2 | 0.1 | 0.2 | 0.6 | 1.8 | 0.2 | 0.0 | 0.2 | 0.1 | 0.1 | 0.3 | 0.2 | ND | ND | ND | 0.2 | ||
| PF14 | avg | 11.4 | 33.7 | 95.5 | 5.5 | 2.0 | 12.6 | 210.2 | 164.7 | 110.6 | 107.0 | 90.5 | 6.5 | 31.7 | 2.3 | 1.5 | 0.9 | 22.0 | |
| sd | 15.1 | 55.3 | 161.6 | 7.8 | 1.4 | 14.0 | 357.5 | 281.0 | 186.1 | 181.6 | 152.2 | 8.6 | 51.5 | 3.6 | 2.3 | 1.2 | 33.1 | ||
| Off-shore | PF15 | avg | 26.9 | 59.0 | 67.3 | 25.1 | 6.6 | 13.4 | 265.5 | 212.1 | 168.8 | 218.3 | 229.7 | 13.8 | 79.3 | 7.6 | 4.9 | 2.3 | 58.6 |
| PF16 | avg | 29.9 | 18.0 | 14.5 | 10.2 | 4.8 | 6.6 | 73.7 | 61.9 | 51.9 | 74.1 | 81.6 | 5.4 | 28.9 | 1.7 | 0.5 | 0.7 | 22.1 | |
| PF17 | avg | 4.1 | 7.3 | 6.3 | 5.7 | 1.3 | 4.1 | 30.2 | 25.7 | 24.1 | 32.3 | 41.7 | 3.3 | 15.6 | <0.2 | <0.2 | <0.2 | 11.7 | |
| PF18 | avg | 30.5 | 2.0 | 2.2 | 2.0 | 1.9 | 4.4 | 4.0 | 3.0 | 3.0 | 3.3 | 5.4 | 1.7 | 3.0 | <0.2 | <0.2 | <0.2 | 2.6 | |
| PF19 | avg | 30.5 | 1.6 | 1.7 | 1.4 | 0.9 | 2.7 | 2.9 | 2.4 | 2.6 | 2.4 | 4.1 | 1.4 | 2.3 | <0.2 | <0.2 | <0.2 | 2.1 | |
| PF20 | avg | 5.3 | 1.3 | 1.4 | 0.9 | <0.2 | 1.8 | 1.6 | 0.9 | 1.1 | 0.9 | 1.8 | 1.2 | 1.5 | <0.2 | <0.2 | <0.2 | 1.5 | |
| PF21 | avg | 38.4 | 1.9 | 1.9 | 1.7 | 1.9 | 5.1 | 2.1 | 1.0 | 1.3 | 1.1 | 1.5 | 1.7 | 1.7 | <0.2 | <0.2 | <0.2 | 1.7 | |
| PF22 | avg | 9.1 | 1.3 | 1.4 | 1.2 | 1.4 | 3.8 | 1.8 | 1.0 | 1.3 | 1.2 | 2.0 | 1.2 | 1.5 | <0.2 | <0.2 | <0.2 | 1.5 | |
| PF23 | avg | 2.0 | 2.2 | 2.7 | 1.2 | 0.4 | 2.2 | 7.1 | 5.5 | 5.3 | 6.5 | 7.0 | 1.4 | 3.1 | <0.2 | <0.2 | <0.2 | 2.8 | |
| PF24 | avg | <0.2 | 1.4 | 0.9 | 0.8 | <0.2 | <0.2 | 4.5 | 3.3 | 4.3 | 4.3 | 6.0 | 1.3 | 2.6 | <0.2 | <0.2 | <0.2 | 2.4 | |
| PF25 | avg | 0.4 | 1.6 | 1.9 | 1.1 | <0.2 | 1.5 | 5.9 | 5.1 | 4.0 | 4.4 | 5.9 | 1.4 | 2.9 | <0.2 | <0.2 | <0.2 | 2.5 | |
| Piombino | PB10 | avg | 27.6 | 38.1 | 77.0 | 17.1 | 7.6 | 15.2 | 178.1 | 149.6 | 128.1 | 169.1 | 248.8 | 13.8 | 83.2 | 14.9 | 11.0 | 4.2 | 40.9 |
| sd | 38.2 | 43.8 | 105.8 | 21.5 | 10.1 | 18.5 | 230.6 | 192.2 | 164.3 | 220.7 | 318.8 | 17.0 | 108.1 | 9.4 | 7.0 | 2.4 | 50.6 | ||
| PB9 | avg | 18.2 | 3.6 | 5.6 | 1.8 | 1.5 | 3.0 | 19.3 | 21.4 | 12.6 | 17.0 | 18.0 | 2.3 | 6.1 | <0.2 | <0.2 | <0.2 | 5.8 | |
| sd | 24.5 | 4.2 | 7.2 | 1.7 | 1.0 | 2.5 | 36.1 | 35.9 | 21.8 | 30.5 | 31.7 | 1.8 | 9.6 | ND | ND | ND | 8.2 | ||
| PB8 | avg | 9.9 | 8.1 | 12.8 | 5.3 | 1.3 | 4.2 | 86.6 | 82.0 | 72.2 | 92.4 | 114.3 | 7.5 | 36.9 | 6.5 | 4.2 | 1.7 | 27.7 | |
| sd | 19.4 | 5.4 | 7.1 | 4.1 | 0.8 | 2.3 | 95.9 | 88.2 | 82.9 | 104.7 | 127.5 | 7.3 | 41.7 | 4.6 | 3.6 | 1.0 | 29.0 | ||
| PB7 | avg | 22.0 | 10.9 | 21.2 | 4.8 | 1.7 | 8.1 | 60.0 | 63.3 | 2.1 | 54.1 | 57.8 | 4.3 | 18.9 | 0.9 | 0.5 | 0.4 | 14.9 | |
| sd | 33.2 | 11.3 | 22.5 | 5.0 | 1.5 | 6.5 | 73.0 | 84.5 | 2.2 | 65.1 | 71.5 | 4.0 | 23.3 | 1.4 | 0.7 | 0.5 | 17.0 | ||
| PB6 | avg | 22.8 | 17.9 | 29.8 | 5.3 | 2.6 | 6.2 | 90.5 | 95.7 | 1.7 | 72.1 | 65.8 | 4.7 | 23.4 | 2.9 | 0.7 | 1.0 | 15.1 | |
| sd | 9.1 | 26.5 | 46.9 | 5.9 | 2.1 | 4.6 | 135.8 | 109.9 | 2.6 | 100.0 | 82.8 | 4.7 | 28.7 | 2.2 | 1.0 | 0.7 | 17.6 | ||
| PB5 | avg | 32.1 | 1.7 | 1.9 | 1.3 | 1.4 | 3.5 | 2.8 | 3.5 | 2.1 | 3.2 | 3.3 | 1.2 | 1.7 | <0.2 | <0.2 | <0.2 | 1.7 | |
| sd | 10.3 | 0.7 | 0.8 | 0.3 | 0.5 | 1.7 | 1.8 | 0.1 | 1.6 | 2.2 | 1.9 | 0.4 | 0.7 | ND | ND | ND | 0.7 | ||
| PB4 | avg | 39.7 | 1.0 | 0.9 | 0.7 | 1.3 | 0.5 | 1.0 | 0.8 | 0.7 | 1.3 | 1.2 | 1.0 | 1.1 | <0.2 | <0.2 | <0.2 | 1.1 | |
| sd | 47.3 | 0.2 | 0.3 | 0.3 | 0.6 | 0.2 | 0.4 | 0.2 | 0.4 | 0.6 | 1.0 | 0.2 | 0.4 | ND | ND | ND | 0.4 | ||
| PB3 | avg | 4.4 | 0.8 | 0.6 | 0.3 | 0.4 | 0.2 | 0.7 | 0.3 | 0.4 | 0.3 | 0.6 | 0.8 | 0.7 | <0.2 | <0.2 | <0.2 | 0.8 | |
| sd | 8.5 | 0.2 | 0.3 | 0.1 | 0.3 | 0.1 | 0.4 | 0.2 | 0.1 | 0.1 | 0.6 | 0.1 | 0.3 | ND | ND | ND | 0.3 | ||
| PB2 | avg | 10.4 | 1.2 | 1.1 | 0.8 | 1.5 | 2.6 | 0.9 | 0.3 | 0.7 | 0.3 | 0.6 | 1.2 | 1.0 | <0.2 | <0.2 | <0.2 | 1.1 | |
| sd | 11.8 | 0.1 | 0.1 | 0.4 | 0.6 | 1.4 | 0.3 | 0.2 | 0.1 | 0.1 | 0.4 | 0.1 | 0.1 | ND | ND | ND | 0.1 | ||
| PB1 | avg | 20.5 | 1.0 | 0.9 | 0.8 | 0.8 | 2.2 | 0.7 | 0.3 | 0.6 | 0.2 | 0.7 | 1.0 | 0.8 | <0.2 | <0.2 | <0.2 | 0.9 | |
| sd | 15.8 | 0.2 | 0.2 | 0.1 | 0.4 | 0.6 | 0.3 | 0.2 | 0.2 | 0.2 | 0.5 | 0.2 | 0.2 | ND | ND | ND | 0.2 |
| Al | As | Cd | Cr tot | Cu | Fe | Hg | Ni | Pb | V | Zn | |||
|---|---|---|---|---|---|---|---|---|---|---|---|---|---|
| NT | − | 12 | 0.3 | 50 | − | − | 0.3 | 30 | 30 | − | − | ||
| ERL | − | 8.2 | 1.2 | 81 | 34 | − | 0.15 | 20.9 | 46.7 | − | 150 | ||
| ERM | − | 70 | 9.6 | 370 | 270 | − | 0.71 | 51.6 | 218 | − | 410 | ||
| Portoferraio | PF1 | avg | 2.50 | 53.69 | 0.28 | 98.11 | 29.90 | 2.33 | 0.47 | 72.39 | 111.80 | 83.05 | 276.78 |
| sd | 0.66 | 9.56 | 0.40 | 7.17 | 18.01 | 0.46 | 0.62 | 5.66 | 144.60 | 12.72 | 380.91 | ||
| PF2 | avg | 2.31 | 49.10 | 0.19 | 111.56 | 26.76 | 2.42 | 0.68 | 85.62 | 90.47 | 85.92 | 223.16 | |
| sd | 0.57 | 4.21 | 0.27 | 12.39 | 10.89 | 0.68 | 1.01 | 8.02 | 124.96 | 3.59 | 310.57 | ||
| PF3 | avg | 2.47 | 52.95 | 0.25 | 107.63 | 30.41 | 2.44 | 0.39 | 78.53 | 147.12 | 89.34 | 320.95 | |
| sd | 0.63 | 5.53 | 0.31 | 22.07 | 15.49 | 0.74 | 0.35 | 13.74 | 176.62 | 6.53 | 397.61 | ||
| PF4 | avg | 1.40 | 51.16 | 0.05 | 65.81 | 17.20 | 1.62 | 0.21 | 46.71 | 43.54 | 70.24 | 82.77 | |
| sd | 1.11 | 22.36 | 0.03 | 38.52 | 13.99 | 0.98 | 0.29 | 29.11 | 61.66 | 22.82 | 112.94 | ||
| PF5 | avg | 1.67 | 72.06 | 0.08 | 85.04 | 37.87 | 2.36 | 0.76 | 64.38 | 104.47 | 75.43 | 248.91 | |
| sd | 0.81 | 16.71 | 0.05 | 31.15 | 34.03 | 0.77 | 0.90 | 15.37 | 115.96 | 19.08 | 296.86 | ||
| PF6 | avg | 1.35 | 59.81 | 0.04 | 70.07 | 16.61 | 1.59 | 0.09 | 54.91 | 15.32 | 86.66 | 36.46 | |
| sd | 0.59 | 3.51 | 0.00 | 20.69 | 4.12 | 0.31 | 0.06 | 14.49 | 9.70 | 7.75 | 16.17 | ||
| PF7 | avg | 1.64 | 50.72 | 0.05 | 105.29 | 25.94 | 2.27 | 0.34 | 88.64 | 66.51 | 76.90 | 105.49 | |
| sd | 0.37 | 8.13 | 0.04 | 18.95 | 9.07 | 0.51 | 0.42 | 14.76 | 75.19 | 3.67 | 98.58 | ||
| PF8 | avg | 1.13 | 56.44 | 0.03 | 80.55 | 13.38 | 1.69 | 0.08 | 60.12 | 12.35 | 52.16 | 36.56 | |
| sd | 0.49 | 3.63 | 0.00 | 20.41 | 4.37 | 0.37 | 0.08 | 25.20 | 4.89 | 13.58 | 11.98 | ||
| PF9 | avg | 0.74 | 34.57 | 0.03 | 71.41 | 11.15 | 1.32 | 0.03 | 35.62 | 9.30 | 31.22 | 33.13 | |
| sd | 0.38 | 15.48 | 0.01 | 28.94 | 7.21 | 0.49 | 0.03 | 22.45 | 5.83 | 7.51 | 11.79 | ||
| PF10 | avg | 0.68 | 36.87 | 0.01 | 63.74 | 8.69 | 1.38 | 0.02 | 26.07 | 6.27 | 30.16 | 29.55 | |
| sd | 0.15 | 14.51 | 0.01 | 13.16 | 1.68 | 0.32 | 0.02 | 4.79 | 3.95 | 7.54 | 10.68 | ||
| PF11 | avg | 1.36 | 37.87 | 0.03 | 64.87 | 11.09 | 1.83 | 0.04 | 38.63 | 6.64 | 43.72 | 41.40 | |
| sd | 0.27 | 13.12 | 0.01 | 9.71 | 0.99 | 0.17 | 0.02 | 4.98 | 2.68 | 11.99 | 4.10 | ||
| PF12 | avg | 1.59 | 36.70 | 0.03 | 89.61 | 14.34 | 1.98 | 0.05 | 43.36 | 14.35 | 47.70 | 43.54 | |
| sd | 0.30 | 13.59 | 0.01 | 19.37 | 4.64 | 0.44 | 0.03 | 7.54 | 8.87 | 7.27 | 15.73 | ||
| PF13 | avg | 1.60 | 30.80 | 0.04 | 108.61 | 12.59 | 1.63 | 0.02 | 46.02 | 6.23 | 45.46 | 32.19 | |
| sd | 0.91 | 5.09 | 0.02 | 27.13 | 0.95 | 0.31 | 0.01 | 10.54 | 0.98 | 11.86 | 9.34 | ||
| PF14 | avg | 1.36 | 44.46 | 0.02 | 75.21 | 10.52 | 1.93 | 0.09 | 37.65 | 45.44 | 91.32 | 55.30 | |
| sd | 0.27 | 12.31 | 0.02 | 21.05 | 4.57 | 0.51 | 0.08 | 8.00 | 42.36 | 85.30 | 24.42 | ||
| Off-shore | PF15 | avg | 1.74 | 39.74 | 0.05 | 81.47 | 28.63 | 3.12 | 0.25 | 61.49 | 40.91 | 67.19 | 124.96 |
| PF16 | avg | 1.38 | 50.87 | 0.04 | 109.47 | 20.85 | 2.81 | 0.18 | 50.29 | 25.91 | 59.12 | 89.05 | |
| PF17 | avg | 0.92 | 60.99 | 0.04 | 66.73 | 25.59 | 2.83 | 0.17 | 43.81 | 34.96 | 54.52 | 84.13 | |
| PF18 | avg | 0.36 | 54.25 | 0.02 | 37.77 | 8.46 | 1.84 | 0.04 | 19.08 | 10.89 | 39.77 | 44.82 | |
| PF19 | avg | 0.47 | 85.26 | 0.04 | 67.15 | 26.17 | 3.48 | 0.05 | 30.97 | 22.84 | 51.54 | 70.13 | |
| PF20 | avg | 0.42 | 73.67 | 0.02 | 28.47 | 11.47 | 1.57 | 0.06 | 14.75 | 10.97 | 43.69 | 31.03 | |
| PF21 | avg | 0.27 | 73.14 | 0.01 | 15.38 | 4.87 | 1.05 | 0.04 | 7.65 | 8.52 | 39.51 | 16.79 | |
| PF22 | avg | 0.48 | 63.50 | 0.02 | 28.13 | 4.60 | 1.13 | 0.06 | 16.68 | 10.89 | 43.74 | 18.57 | |
| PF23 | avg | 0.53 | 75.88 | 0.02 | 48.01 | 4.52 | 1.49 | 0.05 | 34.72 | 8.57 | 45.22 | 24.41 | |
| PF24 | avg | 0.73 | 66.44 | 0.02 | 76.02 | 5.80 | 1.50 | 0.13 | 37.25 | 8.64 | 50.98 | 32.07 | |
| PF25 | avg | 0.37 | 81.82 | 0.02 | 34.17 | 4.54 | 1.47 | 0.04 | 25.22 | 9.48 | 51.45 | 30.92 | |
| Piombino | PB10 | avg | 2.47 | 54.32 | 0.16 | 67.61 | 38.72 | 3.50 | 0.33 | 63.91 | 43.83 | 56.12 | 197.86 |
| sd | 0.32 | 12.09 | 0.09 | 7.44 | 2.86 | 0.17 | 0.22 | 9.80 | 44.20 | 14.61 | 123.26 | ||
| PB9 | avg | 1.46 | 41.87 | 0.07 | 51.70 | 20.82 | 2.02 | 0.18 | 35.34 | 4.29 | 36.33 | 62.59 | |
| sd | 0.88 | 17.59 | 0.05 | 8.01 | 15.19 | 1.10 | 0.13 | 11.17 | 3.53 | 19.37 | 49.05 | ||
| PB8 | avg | 2.22 | 44.85 | 0.10 | 54.11 | 30.04 | 2.66 | 0.32 | 43.86 | 23.23 | 46.42 | 93.56 | |
| sd | 0.79 | 4.94 | 0.03 | 4.69 | 11.90 | 0.74 | 0.12 | 12.76 | 14.17 | 9.49 | 41.75 | ||
| PB7 | avg | 2.20 | 54.36 | 0.14 | 59.28 | 30.77 | 2.73 | 0.22 | 43.52 | 19.37 | 56.90 | 102.91 | |
| sd | 1.18 | 13.66 | 0.11 | 10.38 | 19.85 | 1.01 | 0.16 | 15.03 | 17.57 | 11.27 | 75.60 | ||
| PB6 | avg | 1.01 | 29.21 | 0.05 | 63.78 | 13.05 | 1.51 | 0.11 | 27.01 | 10.31 | 26.81 | 50.99 | |
| sd | 0.54 | 4.94 | 0.02 | 10.10 | 8.23 | 0.58 | 0.02 | 7.73 | 10.35 | 9.42 | 38.21 | ||
| PB5 | avg | 1.18 | 25.96 | 0.04 | 89.23 | 11.23 | 1.52 | 0.05 | 32.08 | 4.09 | 29.52 | 42.41 | |
| sd | 1.16 | 4.87 | 0.02 | 13.87 | 11.07 | 1.02 | 0.03 | 16.95 | 3.22 | 17.36 | 26.47 | ||
| PB4 | avg | 0.31 | 20.94 | 0.02 | 49.21 | 2.94 | 0.70 | 0.02 | 13.50 | 1.82 | 12.95 | 13.06 | |
| sd | 0.10 | 6.18 | 0.01 | 25.56 | 1.28 | 0.27 | 0.01 | 5.68 | 0.86 | 3.88 | 10.75 | ||
| PB3 | avg | 0.38 | 30.99 | 0.02 | 60.94 | 2.69 | 0.86 | 0.02 | 17.88 | 1.69 | 14.09 | 16.34 | |
| sd | 0.16 | 14.01 | 0.00 | 31.96 | 1.15 | 0.31 | 0.01 | 4.16 | 1.22 | 4.84 | 11.11 | ||
| PB2 | avg | 0.42 | 26.51 | 0.03 | 62.68 | 2.84 | 0.79 | 0.02 | 18.72 | 1.93 | 15.61 | 13.33 | |
| sd | 0.12 | 8.57 | 0.01 | 21.73 | 1.32 | 0.30 | 0.01 | 4.34 | 1.12 | 4.58 | 9.36 | ||
| PB1 | avg | 0.39 | 20.07 | 0.02 | 39.38 | 2.91 | 0.75 | 0.02 | 13.35 | 2.39 | 13.60 | 12.76 | |
| sd | 0.14 | 10.12 | 0.00 | 13.35 | 1.60 | 0.35 | 0.01 | 2.71 | 0.62 | 3.08 | 9.69 |
References
- Merhaby, D.; Rabodonirina, S.; Net, S.; Ouddane, B.; Halwani, J. Overview of sediments pollution by PAHs and PCBs in mediterranean basin: Transport, fate, occurrence, and distribution. Mar. Pollut. Bull. 2019, 149, 110646. [Google Scholar] [CrossRef]
- Sciarrillo, R.; Zuzolo, D.; Cicchella, D.; Iannone, F.; Cammino, G.; Guarino, C. Contamination and ecological risk assessment of the seaport of Naples (Italy): Insights from marine sediments. J. Geochem. Explor. 2020, 210, 106449. [Google Scholar] [CrossRef]
- Valdelamar-Villegas, J.; Gomez, J.; de la Rosa, J.D.; Olivero-Verbel, J. Multi-elemental composition and toxicity of bottom sediments from Panama Canal watershed. Ocean Coast. Manag. 2021, 204, 105459. [Google Scholar] [CrossRef]
- Kelderman, P.; Kassie, D.B.; Bijlsma, M.; Okonkwo, L.C.; Doppenberg, A.A.T. Effect of external shipping traffic on the transport of polluted sediments into the inner city canals of Delft (The Netherlands). Water Sci. Technol. 1998, 37, 63–70. [Google Scholar] [CrossRef]
- Erm, A.; Soomere, T. The impact of fast ferry traffic on underwater optics and sediment resuspension. Oceanologia 2006, 48, 283–301. [Google Scholar]
- Roberts, D.A. Causes and ecological effects of resuspended contaminated sediments (RCS) in marine environments. Environ. Int. 2012, 40, 230–243. [Google Scholar] [CrossRef]
- Nayar, S.; Goh, B.P.L.; Chou, L.M. Environmental impact of heavy metals from dredged and resuspended sediments on phytoplankton and bacteria assessed in in situ mesocosms. Ecotoxicol. Environ. Saf. 2004, 59, 349–369. [Google Scholar] [CrossRef]
- Cailleaud, K.; Forget-Leray, J.; Souissi, S.; Hilde, D.; LeMenach, K.; Budzinski, H. Seasonal variations of hydrophobic organic contaminant concentrations in the water-column of the Seine Estuary and their transfer to a planktonic species Eurytemora affinis (Calanoïda, copepoda). Part 1: PCBs and PAHs. Chemosphere 2007, 70, 270–280. [Google Scholar] [CrossRef]
- Hsieh, H.-Y.; Huang, K.-C.; Cheng, J.-O.; Lo, W.-T.; Meng, P.-J.; Ko, F.-C. Environmental effects on the bioaccumulation of PAHs in marine zooplankton in Gaoping coastal waters, Taiwan: Concentration, distribution, profile, and sources. Mar. Pollut. Bull. 2019, 144, 68–78. [Google Scholar] [CrossRef]
- Sankhla, S.M.; Kumar, R.; Sonone, S.S.; Jadhav, S. Water Contamination by Heavy Metals and their Toxic Effect on Aquaculture and Human Health through Food Chain. Lett. Appl. Nanobioscience 2021, 10, 2148–2166. [Google Scholar]
- Sun, T.; Wu, H.; Wang, X.; Ji, C.; Shan, X.; Li, F. Evaluation on the biomagnification or biodilution of trace metals in global marine food webs by meta-analysis. Environ. Pollut. 2020, 264, 113856. [Google Scholar] [CrossRef]
- Countway, R.E.; Dickhut, R.M.; Canuel, E.A. Polycyclic aromatic hydrocarbon (PAH) distributions and associations with organic matter in surface waters of the York River, VA Estuary. Org. Geochem. 2003, 34, 209–224. [Google Scholar] [CrossRef]
- Syakti, A.D.; Hidayati, N.V.; Hilmi, E.; Piram, A.; Doumenq, P. Source apportionment of sedimentary hydrocarbons in the Segara Anakan Nature Reserve, Indonesia. Mar. Pollut. Bull. 2013, 74, 141–148. [Google Scholar] [CrossRef]
- Abdel-Shafy, H.I.; Mansour, M.S.M.M. A review on polycyclic aromatic hydrocarbons: Source, environmental impact, effect on human health and remediation. Egypt J. Pet. 2015, 25, 107–123. [Google Scholar] [CrossRef] [Green Version]
- IARC. Some non-Heterocyclic Polycyclic Aromatic Hydrocarbons and Some Related Exposures; WHO-IARC: Lyon, France, 2010; Volume 92. [Google Scholar]
- Neff, J. Polycyclic Aromatic Hydrocarbons. Fundamentals of Aquatic Toxicology: Methods and Applications; Hemisphere Publishing Corporation: Washington, DC, USA, 1985. [Google Scholar]
- Long, E.R.; Macdonald, D.D.; Smith, S.L.; Calder, F.D. Incidence of adverse biological effects within ranges of chemical concentrations in marine and estuarine sediments. Environ. Manag. 1995, 19, 81–97. [Google Scholar] [CrossRef]
- Depledge, M.H.; Galloway, T.S. Healthy Animals, Healthy Ecosystems. Front. Ecol. Environ. 2005, 3, 251–258. [Google Scholar] [CrossRef]
- Manoli, E.; Samara, C.; Konstantinou, I.; Albanis, T. Polycyclic aromatic hydrocarbons in the bulk precipitation and surface waters of Northern Greece. Chemosphere 2000, 41, 1845–1855. [Google Scholar] [CrossRef]
- Fabbri, D.; Baravelli, V.; Giannotti, K.; Donnini, F.; Fabbri, E. Bioaccumulation of cyclopenta[cd]pyrene and benzo[ghi]fluoranthene by mussels transplanted in a coastal lagoon. Chemosphere 2006, 64, 1083–1092. [Google Scholar] [CrossRef]
- Han, B.; Zheng, L.; Lin, F. Risk assessment and source apportionment of PAHs in surface sediments from Caofeidian Long Island, China. Mar. Pollut. Bull. 2019, 145, 42–46. [Google Scholar] [CrossRef]
- Guven, D.E.; Akinci, G. Heavy metals partitioning in the sediments of Izmir Inner Bay. J. Environ. Sci. 2008, 20, 413–418. [Google Scholar] [CrossRef]
- Hosono, T.; Su, C.-C.; Siringan, F.; Amano, A.; Onodera, S. Effects of environmental regulations on heavy metal pollution decline in core sediments from Manila Bay. Mar. Pollut. Bull. 2010, 60, 780–785. [Google Scholar] [CrossRef]
- Piazzolla, D.; Scanu, S.; Frattarelli, F.M.; Mancini, E.; Tiralongo, F.; Brundo, M.V.; Tibullo, D.; Pecoraro, R.; Copat, C.; Ferrante, M.; et al. Trace-Metal Enrichment and Pollution in Coastal Sediments in the Northern Tyrrhenian Sea, Italy. Arch. Environ. Contam. Toxicol. 2015, 69, 470–481. [Google Scholar] [CrossRef] [PubMed]
- Diagomanolin, V.; Farhang, M.; Ghazi-Khansari, M.; Jafarzadeh, N. Heavy metals (Ni, Cr, Cu) in the Karoon waterway river, Iran. Toxicol. Lett. 2004, 151, 63–67. [Google Scholar] [CrossRef] [PubMed]
- Amundsen, P.-A.; Staldvik, F.J.; Lukin, A.A.; Kashulin, N.A.; Popova, O.A.; Reshetnikov, Y.S. Heavy metal contamination in freshwater fish from the border region between Norway and Russia. Sci. Total Environ. 1997, 201, 211–224. [Google Scholar] [CrossRef]
- El-Moselhy, K.M.; Othman, A.I.; Abd El-Azem, H.; El-Metwally, M.E.A. Bioaccumulation of heavy metals in some tissues of fish in the Red Sea, Egypt. Egypt. J. Basic Appl. Sci. 2014, 1, 97–105. [Google Scholar] [CrossRef] [Green Version]
- Sprovieri, M.; Feo, M.L.; Prevedello, L.; Manta, D.S.; Sammartino, S.; Tamburrino, S.; Marsella, E. Heavy metals, polycyclic aromatic hydrocarbons and polychlorinated biphenyls in surface sediments of the Naples harbour (southern Italy). Chemosphere 2007, 67, 998–1009. [Google Scholar] [CrossRef] [PubMed]
- Montuori, P.; Triassi, M. Polycyclic aromatic hydrocarbons loads into the Mediterranean Sea: Estimate of Sarno River inputs. Mar. Pollut. Bull. 2012, 64, 512–520. [Google Scholar] [CrossRef] [Green Version]
- Tangherlini, M.; Corinaldesi, C.; Rastelli, E.; Musco, L.; Armiento, G.; Danovaro, R.; Dell’Anno, A. Chemical contamination can promote turnover diversity of benthic prokaryotic assemblages: The case study of the Bagnoli-Coroglio bay (southern Tyrrhenian Sea). Mar. Environ. Res. 2020, 160, 105040. [Google Scholar] [CrossRef]
- Montuori, P.; Aurino, S.; Garzonio, F.; Sarnacchiaro, P.; Nardone, A.; Triassi, M. Distribution, sources and ecological risk assessment of polycyclic aromatic hydrocarbons in water and sediments from Tiber River and estuary, Italy. Sci. Total Environ. 2016, 566–567, 1254–1267. [Google Scholar] [CrossRef] [Green Version]
- ISTAT Maritime transport (In Italian). Available online: https://www.istat.it/it/archivio/140422 (accessed on 3 July 2019).
- ASTM. Method D 422–63: Standard Test Method for Particle Size Analysis of Soil; ASTM International: West Conshohocken, PA, USA, 1998. [Google Scholar]
- CNR-IRSA. Metodi Analitici Per i Fanghi. Quaderno 64; CNR-IRSA: Rome, Italy, 1985; Volume 3. [Google Scholar]
- USEPA. Method 6010D (SW-846): Inductively Coupled Plasma-Atomic Emission Spectrometry, Revision 4; USEPA: Washington, DC, USA, 2014. [Google Scholar]
- USEPA. Method 3545A: Pressurized Fluid Extraction (PFE); USEPA: Washington, DC, USA, 2007. [Google Scholar]
- USEPA. Method 3630C: Silica Gel Cleanup; USEPA: Washington, DC, USA, 1996. [Google Scholar]
- USEPA. Method 8270D: Semivolatile Organic Compounds by Gas Chromatography/Mass Spectrometry (GC/MS); USEPA: Washington, DC, USA, 2007. [Google Scholar]
- Flemming, B.W. A revised textural classification of gravel-free muddy sediments on the basis of ternary diagrams. Cont. Shelf Res. 2000, 20, 1125–1137. [Google Scholar] [CrossRef]
- Spearman, C. Demonstration of Formule for True Measurement of Correlation. Am. J. Psychol. 1907, 18, 161–169. [Google Scholar] [CrossRef]
- Kruskal, W.H.; Wallis, W.A. Use of Ranks in One-Criterion Variance Analysis. J. Am. Stat. Assoc. 1952, 47, 583–621. [Google Scholar] [CrossRef]
- Perra, G.; Renzi, M.; Guerranti, C.; Focardi, S.E. Polycyclic aromatic hydrocarbons pollution in sediments: Distribution and sources in a lagoon system (Orbetello, Central Italy). Transit. Waters Bull. 2009, 3, 45–58. [Google Scholar] [CrossRef]
- Team R Development Core. A Language and Environment for Statistical Computing; R Found. Statical Computing: Vienna, Austria, 2018; Volume 2, Available online: https://www.R.–project.org. (accessed on 10 September 2020).
- Becker, F.; Eser, R.A.; Hoelzmann, P.; Schütt, B. The environmental impact of ancient iron mining and smelting on Elba Island, Italy—A geochemical soil survey of the Magazzini site. J. Geochem. Explor. 2019, 205, 106307. [Google Scholar] [CrossRef]
- Pistelli, L.; D’Angiolillo, F.; Morelli, E.; Basso, B.; Rosellini, I.; Posarelli, M.; Barbafieri, M. Response of spontaneous plants from an ex-mining site of Elba island (Tuscany, Italy) to metal(loid) contamination. Environ. Sci. Pollut. Res. 2017, 24, 7809–7820. [Google Scholar] [CrossRef]
- Bargagli, R.; Baldi, F.; Leonzio, C. Trace metal assessment in sediment, molluscs and reed leaves in the bay of follonica (Italy). Mar. Environ. Res. 1985, 16, 281–300. [Google Scholar] [CrossRef]
- Leoni, L.; Sartori, F. Heavy metal and arsenic distributions in sediments of the Elba-Argentario basin, southern Tuscany, Italy. Environ. Geol. 1997, 32, 83–92. [Google Scholar] [CrossRef]
- Leoni, L.; Sartori, F.; Damiani, V.; Ferretti, O.; Viel, M. Trace element distributions in surficial sediments of the northern Tyrrhenian Sea: Contribution to heavy-metal pollution assessment. Environ. Geol. Water Sci. 1991, 17, 103–116. [Google Scholar] [CrossRef]
- Sarti, G.; Sammartino, I.; Amorosi, A. Geochemical anomalies of potentially hazardous elements reflect catchment geology: An example from the Tyrrhenian coast of Italy. Sci. Total Environ. 2020, 714, 136870. [Google Scholar] [CrossRef]
- Baldi, F.; Bargagli, R.; Renzoni, A. The distribution of mercury in the surficial sediments of the northern Tyrrhenian sea. Mar. Pollut. Bull. 1979, 10, 301–303. [Google Scholar] [CrossRef]
- Lattanzi, P.; Rimondi, V.; Chiarantini, L.; Colica, A.; Benvenuti, M.; Costagliola, P.; Ruggieri, G. Mercury Dispersion through Streams Draining the Mt. Amiata District, Southern Tuscany, Italy. Procedia Earth Planet. Sci. 2017, 17, 468–471. [Google Scholar] [CrossRef]
- Leoni, L.; Sartori, F. Heavy metals and arsenic in sediments from the continental shelf of the Northern Tyrrhenian/Eastern Ligurian Seas. Mar. Environ. Res. 1996, 41, 73–98. [Google Scholar] [CrossRef]
- Bruland, K.W.; Donat, J.R.; Hutchins, D.A. Interactive influences of bioactive trace metals on biological production in oceanic waters. Limnol. Oceanogr. 1991, 36, 1555–1577. [Google Scholar] [CrossRef] [Green Version]
- Hogan, M.C. Heavy metal Encyclopedia of Earth; Monosson, E., Cleveland, C., Eds.; National Council for Science and the Environment: Washington, DC, USA, 2010. [Google Scholar]
- Neto, J.A.B.; Gingele, F.X.; Leipe, T.; Brehme, I. Spatial distribution of heavy metals in superrficial sediments from Guanabara Bay: Rio de Janeiro, Brazil. Environ. Geol. 2006, 49, 1051–1063. [Google Scholar] [CrossRef]
- USEPA. Integrated Risk Information System (IRIS); National Center for Environmental Assessment, Office of Research and Development: Washington, DC, USA, 1999. [Google Scholar]
- Gaion, A.; Scuderi, A.; Sartori, D.; Pellegrini, D.; Ligas, A. Trace metals in tissues of Galeus melastomus Rafinesque, 1810 from the northern Tyrrhenian sea (NW Mediterranean). Acta Adriat. 2016, 57, 165–172. [Google Scholar]
- Di Lena, G.; Casini, I.; Caproni, R.; Orban, E. Total mercury levels in crustacean species from Italian fishery. Food Addit. Contam. Part B 2018, 11, 175–182. [Google Scholar] [CrossRef]
- Okpala, C.O.R.; Sardo, G.; Vitale, S.; Bono, G.; Arukwe, A. Hazardous properties and toxicological update of mercury: From fish food to human health safety perspective. Crit. Rev. Food Sci. Nutr. 2018, 58, 1986–2001. [Google Scholar] [CrossRef]
- Windom, H.L.; Schropp, S.J.; Calder, F.D.; Ryan, J.D.; Smith, R.G.; Burney, L.C.; Lewis, F.G.; Rawlinson, C.H. Natural trace metal concentrations in estuarine and coastal marine sediments of the southeastern United States. Environ. Sci. Technol. 1989, 23, 314–320. [Google Scholar] [CrossRef]
- Baptista Neto, J.A.; Smith, B.J.; McAllister, J.J. Heavy metal concentrations in surface sediments in a nearshore environment, Jurujuba Sound, Southeast Brazil. Environ. Pollut. 2000, 109, 1–9. [Google Scholar] [CrossRef]
- Lin, S.; Hsieh, I.J.; Huang, K.-M.; Wang, C.H. Influence of the Yangtze River and grain size on the spatial variations of heavy metals and organic carbon in the East China Sea continental shelf sediments. Chem. Geol. 2002, 182, 377–394. [Google Scholar] [CrossRef]
- Abrahim, G.M.S.; Parker, R.J.; Nichol, S.L. Distribution and assessment of sediment toxicity in Tamaki Estuary, Auckland, New Zealand. Environ. Geol. 2007, 52, 1315–1323. [Google Scholar] [CrossRef]
- Sundaramanickam, A.; Shanmugam, N.; Cholan, S.; Kumaresan, S.; Madeswaran, P.; Balasubramanian, T. Spatial variability of heavy metals in estuarine, mangrove and coastal ecosystems along Parangipettai, Southeast coast of India. Environ. Pollut. 2016, 218, 186–195. [Google Scholar] [CrossRef]
- Ligero, R.A.; Ramos-Lerate, I.; Barrera, M.; Casas-Ruiz, M. Relationships between sea-bed radionuclide activities and some sedimentological variables. J. Environ. Radioact. 2001, 57, 7–19. [Google Scholar] [CrossRef]
- Selvaraj, K.; Ram Mohan, V.; Szefer, P. Evaluation of metal contamination in coastal sediments of the Bay of Bengal, India: Geochemical and statistical approaches. Mar. Pollut. Bull. 2004, 49, 174–185. [Google Scholar] [CrossRef]
- Weston, D.P.; Mayer, L.M. In vitro digestive fluid extraction as a measure of the bioavailability of sediment-associated polycyclic aromatic hydrocarbons: Sources of variation and implications for partitioning models. Environ. Toxicol. Chem. 1998, 17, 820–829. [Google Scholar] [CrossRef]
- Penry, D.L.; Weston, D.P. Digestive determinants of benzo[a]pyrene and phenanthrene bioaccumulation by a deposit-feeding polychaete. Environ. Toxicol. Chem. 1998, 17, 2254–2265. [Google Scholar] [CrossRef]
- McElroy, A.E.; Means, J.C. Factors Affecting the Bioavailability of Hexachlorobiphenyls to Benthic Organisms. In Aquatic Toxicology and Hazard Assessment; Adams, W.J., Chapman, G.A., Landis, W.G., Eds.; ASTM International: West Conshohocken, PA, USA, 1988; Volume 10, pp. 149–158. ISBN 978-0-8031-5043-0. [Google Scholar]
- Ferraro, S.P.; Lee, H.; Ozretich, R.J.; Specht, D.T. Predicting bioaccumulation potential: A test of a fugacity-based model. Arch. Environ. Contam. Toxicol. 1990, 19, 386–394. [Google Scholar] [CrossRef]


Publisher’s Note: MDPI stays neutral with regard to jurisdictional claims in published maps and institutional affiliations. |
© 2021 by the authors. Licensee MDPI, Basel, Switzerland. This article is an open access article distributed under the terms and conditions of the Creative Commons Attribution (CC BY) license (https://creativecommons.org/licenses/by/4.0/).
Share and Cite
Valentina, P.; Michele, M.; Tommaso, G.; Letizia, M.; Laura, M.M.; Francesca, M.; Adriano, S.; Augusto, S.A.; Cristina, M. Sediment Contamination by Heavy Metals and PAH in the Piombino Channel (Tyrrhenian Sea). Water 2021, 13, 1487. https://doi.org/10.3390/w13111487
Valentina P, Michele M, Tommaso G, Letizia M, Laura MM, Francesca M, Adriano S, Augusto SA, Cristina M. Sediment Contamination by Heavy Metals and PAH in the Piombino Channel (Tyrrhenian Sea). Water. 2021; 13(11):1487. https://doi.org/10.3390/w13111487
Chicago/Turabian StyleValentina, Pitacco, Mistri Michele, Granata Tommaso, Moruzzi Letizia, Meloni Maria Laura, Massara Francesca, Sfriso Adriano, Sfriso Andrea Augusto, and Munari Cristina. 2021. "Sediment Contamination by Heavy Metals and PAH in the Piombino Channel (Tyrrhenian Sea)" Water 13, no. 11: 1487. https://doi.org/10.3390/w13111487