Article

Urban Pluvial Flood Management Part 1: Implementing an AHP-TOPSIS Multi-Criteria Decision Analysis Method for Stakeholder Integration in Urban Climate and Stormwater Adaptation

Department of Economics, Ca’ Foscari University of Venice, 30121 Venice, Italy
*
Author to whom correspondence should be addressed.
Water 2021, 13(17), 2422; https://doi.org/10.3390/w13172422
Submission received: 10 July 2021 / Revised: 20 August 2021 / Accepted: 1 September 2021 / Published: 3 September 2021
(This article belongs to the Special Issue Blue-Green Cities for Urban Flood Resilience)

Abstract

:
Cities are facing increasing pressures to enact adaptation measures due to climate change. While blue-green infrastructure has emerged as a focal adaptation technique for stormwater management, in order to craft adaptation policies cities must consider a multitude of emerging, complex, and competing stakeholder interests around multiple adaptation alternatives. However, accounting for these different interests, analyzing their diverse priorities, and maintaining a transparent decision-making process is not easily achieved within the existing policy frameworks. Here we define and present a combined multi-criteria decision analysis (MCDA) of the analytic hierarchy process (AHP) and the technique for order of preference by similarity to ideal solution (TOPSIS) methods that easily integrates and quantifies stakeholder priorities while remaining accessible for non-experts engaged in the policy-making process. We demonstrate the method’s effectiveness through analyzing opinions about stormwater adaptation in New York City across several stakeholder groups. The method succeeds in integrating quantitative and qualitative judgements, indicating stakeholder preferential differences and allowing for more inclusive policy to be crafted. It can be extended beyond stormwater to many urban climate adaptation decisions facing multi-criteria considerations.

1. Introduction

Climate change is placing enormous pressures on urban policy decision-making. Traditional governance decision-making methods are being re-evaluated with the growing importance of urban sustainability, resilience, and adaptation. While disruptive of the status quo, this shift allows cities to engage with different and larger groups of people and concepts than before.
What defines urban climate adaptation is that decisions need to be made quickly for both long-term and immediate threats, at varying geographic scales, alongside varying climate projections. Urban pluvial flood management exemplifies these difficult considerations. For long-term adaptation, projects become stalled as the main benefits from implementation are often reaped decades later providing no or limited immediate financial returns [1]. With how environmental benefits are usually quantified, it is an uphill battle to pursue future environmental investments over other immediate pressing urban issues. The idea of future proofing is also questioned as technologies may become obsolete or climate projections over or underestimate the future reality [2].
For immediate threats, urban bureaucracy still poses a barrier to adaptation. It is not a lack of best practice awareness that delays policy but rather policy systems are not designed for radical changes [3]. Policy-makers become familiar with certain methods and processes and may struggle to diverge from this path dependence in the face of emerging pressures [4]. Furthermore, communication and coordination between departments may not be streamlined despite the interdisciplinary effects of climate change. As these delays compound across the various levels of governance, policy-making may struggle unless radical change occurs.
Despite the barriers, cities are making progress incorporating climate adaptation into their decision-making framework. Environmental considerations are becoming commonplace within governance [5]. However, as with most policy a city needs both strong political systems and political will to support environmental policy [3,6]. Cities must increase their efforts to streamline policy guidance across their often-segregated departments and coordinate regulations across sometimes unresponsive state/regional and national governance. Without this inter and intragovernmental support, the adaptation decision-making process becomes more difficult [5]. Existing governance structures may not be the best suited for the complex decisions climate change requires.
Urban climate adaptation decision-making should involve many stakeholders. While every citizen will be affected by climate change, it is unrealistic to include everyone in this process. Therefore, cities must be careful to select relevant stakeholders to the decision [7]. When defining the scope of the decision, the outcome must be applicable to the relevant stakeholders so finding a balance between inclusion and decision relevance is highly important in the adaptation processes.
Relevant stakeholders often hold conflicting views further complicating the decision-making. The perceptions toward adaptation solutions are often based in existing knowledge and experiences [2,8]. Additionally, issues around the environment and climate change bring conflicting definitions, emotion, and uncertainty into the process. While green infrastructure mimicking natural process, and more specifically blue-green infrastructure concerning stormwater management, emerge as best practices, what constitutes green solutions can differ between groups and the multi-faceted aspects of these adaptation solutions create differing perspectives in best management practice [4,9]. As climate change projections adjust, the relevance of stakeholders may also need to adjust. The inclusion of different people in decision-making is imperative for successful decisions but adds a layer of complexity to the process.
Regardless of the complexity of climate change, urban decision-making and adjusting governance systems, cities continue to make adaptation decisions. Considering urban stormwater, theory indicates that rainfall intensity will increase in urban areas and best management practice is moving toward blue and green solutions [10]. However, these solutions require multi-criteria considerations and involve stakeholders outside of formal stormwater management [11]. Particularly, purely valuing blue-green infrastructure in economic terms might influence its acceptability for a given decision [12]. Considering this, our study aims to demonstrate that a multi-criteria decision analysis (MCDA), based on a combined analytic hierarchy process (AHP)- technique for order preferences by similarity to ideal solutions (TOPSIS) method, can contribute to increased stakeholder involvement and satisfaction with urban stormwater adaptation policy. While these methods have been utilized in stormwater management before, they are usually presented with a level of expertise that prevents non-experts from immediately engaging with the methodology. Additionally, the method allows for the quantification and analysis of differences between stakeholders in urban decision-making allowing for policy-makers to analyze these differences and create more inclusive policy, something that previous studies have not thoroughly explored. After defining the AHP-TOPSIS methodology, we examine New York City (NYC), where the problem of stormwater management under climate change represents a complex topic overarching several municipal departments and involving differing stakeholder opinions. This paper forms Part I of a two-part study on urban pluvial flood management.

2. Multi-Criteria Decision Analysis

MCDA tools are useful for policy-makers to visualize, quantify, and increase transparency in the decision-making process by helping to evaluate the criteria influencing the decision and the possible decision alternatives to implement. Multi-attribute utility theory (MAUT), simple multi-attribute rating technique (SMART), AHP, case-based reasoning (CBR), simple additive weighting (SAW), TOPSIS, Elimination et Choix Traduisant la Realite (ELECTRE), and preference ranking organization method for enrichment of evaluations (PROMETHEE) are some of the MCDA methods that have been successful utilized in environmental decision-making [13,14]. Each method is optimized for different types of data, required complexity of analysis, uncertainty levels, computational intensity, and experience of the decision-maker. Ultimately, there is no single best MCDA method for making decisions [11,15,16]. While it may be possible to evaluate different methods for a specific challenge, the ability to identify an optimal method is hindered when there is low knowledge of MCDA methods among the decision-makers [13].
In climate change decision-making one selects an MCDA method based on preference and perceptions of what best fits the data and can represent the requirements of the decision. Nonetheless, it is still crucial to be critical when selecting an MCDA method as it will affect the output of the criteria, alternatives, and eventual decision [11,13]. It is important to understand the method used, and how easy it is for stakeholder involved in the decision-making process to understand the method. Participants need to understand the alternatives and the criteria to conceptualize the influence their judgments will have on the decision process [17]. While it is the decision analyst’s responsibility to make sure the participants understand the alternatives and criteria, they must also be transparent in the process. A decision aid such as computer programing, forms, and surveys makes the process more transparent. MCDA methods ultimately exist to aid making complex decisions and attention should be given when selecting the appropriate method for the given problem.
Here we propose using a combined AHP-TOPSIS MCDA method for stormwater management adaptation. The AHP developed by Saaty [18] is a linear model based on pairwise comparisons while TOPSIS developed by Hwang and Yoon [19] is a compensatory method measuring the distance to an idealized solution. In this method, the AHP is used to develop the weights of the criteria and sub-criteria in the decision-making process. As the number of criteria needed in urban policy and climate change decisions becomes complex, the criteria weights are then utilized in TOPSIS to test the performance of the alternatives, reducing the number of judgements required by the decision-maker and the computational complexity of the MCDA. The strength of this method is that conceptually and mathematically it is easy for non-experts to engage with while being robust and accepted in the field. While other methods additionally reduce the computational burden on largescale pairwise comparisons, they often become complex for non-expert communities [20,21]. The method we propose is appropriate as it is approachable for various stakeholders involved in urban climate adaptation decisions. Additionally, the method allows the decision-maker to observe how different stakeholder value different criteria and policy alternatives.
The AHP is a robust tool because of its ability to handle stakeholder involvement, integration of qualitative judgements and legacy in the fields of policy, governance, and planning [14]. The AHP can directly engage with public officials familiar with the process over other MCDA methods as it is widely used. In addition, the method can easily be described to non-experts.
The AHP is capable of handling large amounts of qualitative data, important in urban environmental and climate change studies. When a large number of stakeholders with different interests are involved, the AHP allows for deep analysis of these differences [22]. This is critical when considering the integration of expert and non-expert stakeholders in decision-making. For human judgement, the optimal amount of information a person can process, particularly during the AHP is 7 ± 2 judgements [23]. If environmental judgements become too complex, particularly with multiple comparisons, an additional MCDA method can be used in conjunction. TOPSIS can integrate the criteria weights of the AHP to analyze the performance of the alternatives.
TOPSIS is based on finding an ideal alternative and measuring the distance performance of the alternatives from this. It allows for the direct comparison between cost and benefit type criteria, another important factor in environmental decision-making. We acknowledge the emergence of applying the fuzzy sets theory to the AHP and TOPSIS as a way to compensate for inherent uncertainty in climate-related decisions. However, due to the additional computational complexities and continued theoretical debate we proceed with the non-fuzzy methods.
Table 1 displays recent studies from the past decade involving both the AHP and TOPSIS methodologies in a stormwater management context. These two MCDA methodologies are well established with stormwater management and have been applied to both large- and small-scale studies, with different national contexts, management alternatives, and criteria considerations. However, there are two important gaps that exist in the literature. First, it is difficult to approach the mechanics of these methods without prior familiarity with the MCDA methodologies. Additionally, many of the studies involving AHP and TOPSIS include additional computational modelling, particularly storm water management model (SWMM). While acknowledging the role these MCDA methods can have within policy formation, it is difficult for non-technical experts, many of which are still highly important decision-makers around stormwater management, to engage with the methodology. Without proper understanding of the methodology, the results of these methods can remain abstract to decision-makers thus weakening their ability to trust or defend the methods’ outputs when adopting policy for sensitive and uncertain decisions around climate change.
Second, the existing literature is focused on developing tools to find a solution to the stormwater issues the world faces while considering multiple stakeholder involved in the decision-making process. Aside from a few notable examples that consider differences between the stakeholders involved [25,26,37], however, there is little focus on how to manage the differences in opinions and how this affect the end policy decision. If differences emerge between the stakeholders involved in the MCDA it is important to acknowledge these differences so that policy can then attempt to address the disparities. This is particularly important in stormwater management and climate change adaptation as many minority stakeholders might hold crucial viewpoints and local knowledge that are not typically examined by traditional policy-making methods. It is important to consider the end goal of the MCDA but it is equally important to demonstrate how the AHP and TOPSIS methodologies can quantify stakeholder differences to allow for deeper policy discussions to occur around stormwater management.
In the proposed method we take from the existing mathematical theory to optimize the method for the nature of the stormwater adaptation process but paying particular attention to the ease of use for future decision-makers. We do not introduce new theory of calculating the AHP or TOPSIS but take from the extensive existing literature to demonstrate methods that complement each other, justifying these decisions and provide a full and comprehensive decision-making method that is readily available to be used in the field.

Criticisms

Two main technical criticisms are associated with the AHP and TOPSIS; rank reversal and consistency. Rank reversal can occur when the addition of new or duplicate alternatives or the subtraction of an existing alternative can alter the final ranking of the alternatives [39,40]. Rank reversal affects both the AHP and TOPSIS method [39,41,42]. The rank reversal phenomena is largely a result of inconsistent judgements as well as internal aggregation and normalization methods during the analysis [43]. To reduce the opportunity for rank reversal and maintain the internal mechanisms of the two MCDA methods, it is important to establish the independence of each alternative to avoid judgmental overlap or interdependencies. Furthermore, it is established that the AHP performs better when there is a small number of alternatives and a large number of criteria [13,22]. This additionally works for TOPSIS as the alternatives should be as unique and independent from one another so that the decision-maker examines the alternatives objectively and does not account for linked interdependencies in their judgments. Rank reversal in TOPSIS can further be reduced when the ideal solutions are predetermined and not reliant on the input data. The criteria should also be as independent as possible, but because they can be grouped together in sub-criteria categories, more similar criteria can still be judged objectively under a common criterion. Rank reversal is a common occurrence in both AHP and TOPSIS but in establishing a well-defined and independent set of alternatives it minimizes the chance of rank reversal with the introduction of new information.
The second criticism, consistency, influences the AHP method more than TOPSIS. There is a debate over how much inconsistency or flawed judgements stemming from human decisions the AHP can tolerate. However, as Saaty, Vargas and Whitaker [44] argue, issues regarding the AHP arise from the need to validate MCDA methods. The AHP is structured to handle the uncertainty of personal judgements and decisions without clear definitions and the results should be discussed within the context of the AHP method. While these criticisms can influence the proposed method, the method can be designed to minimize the influence of these drawbacks.

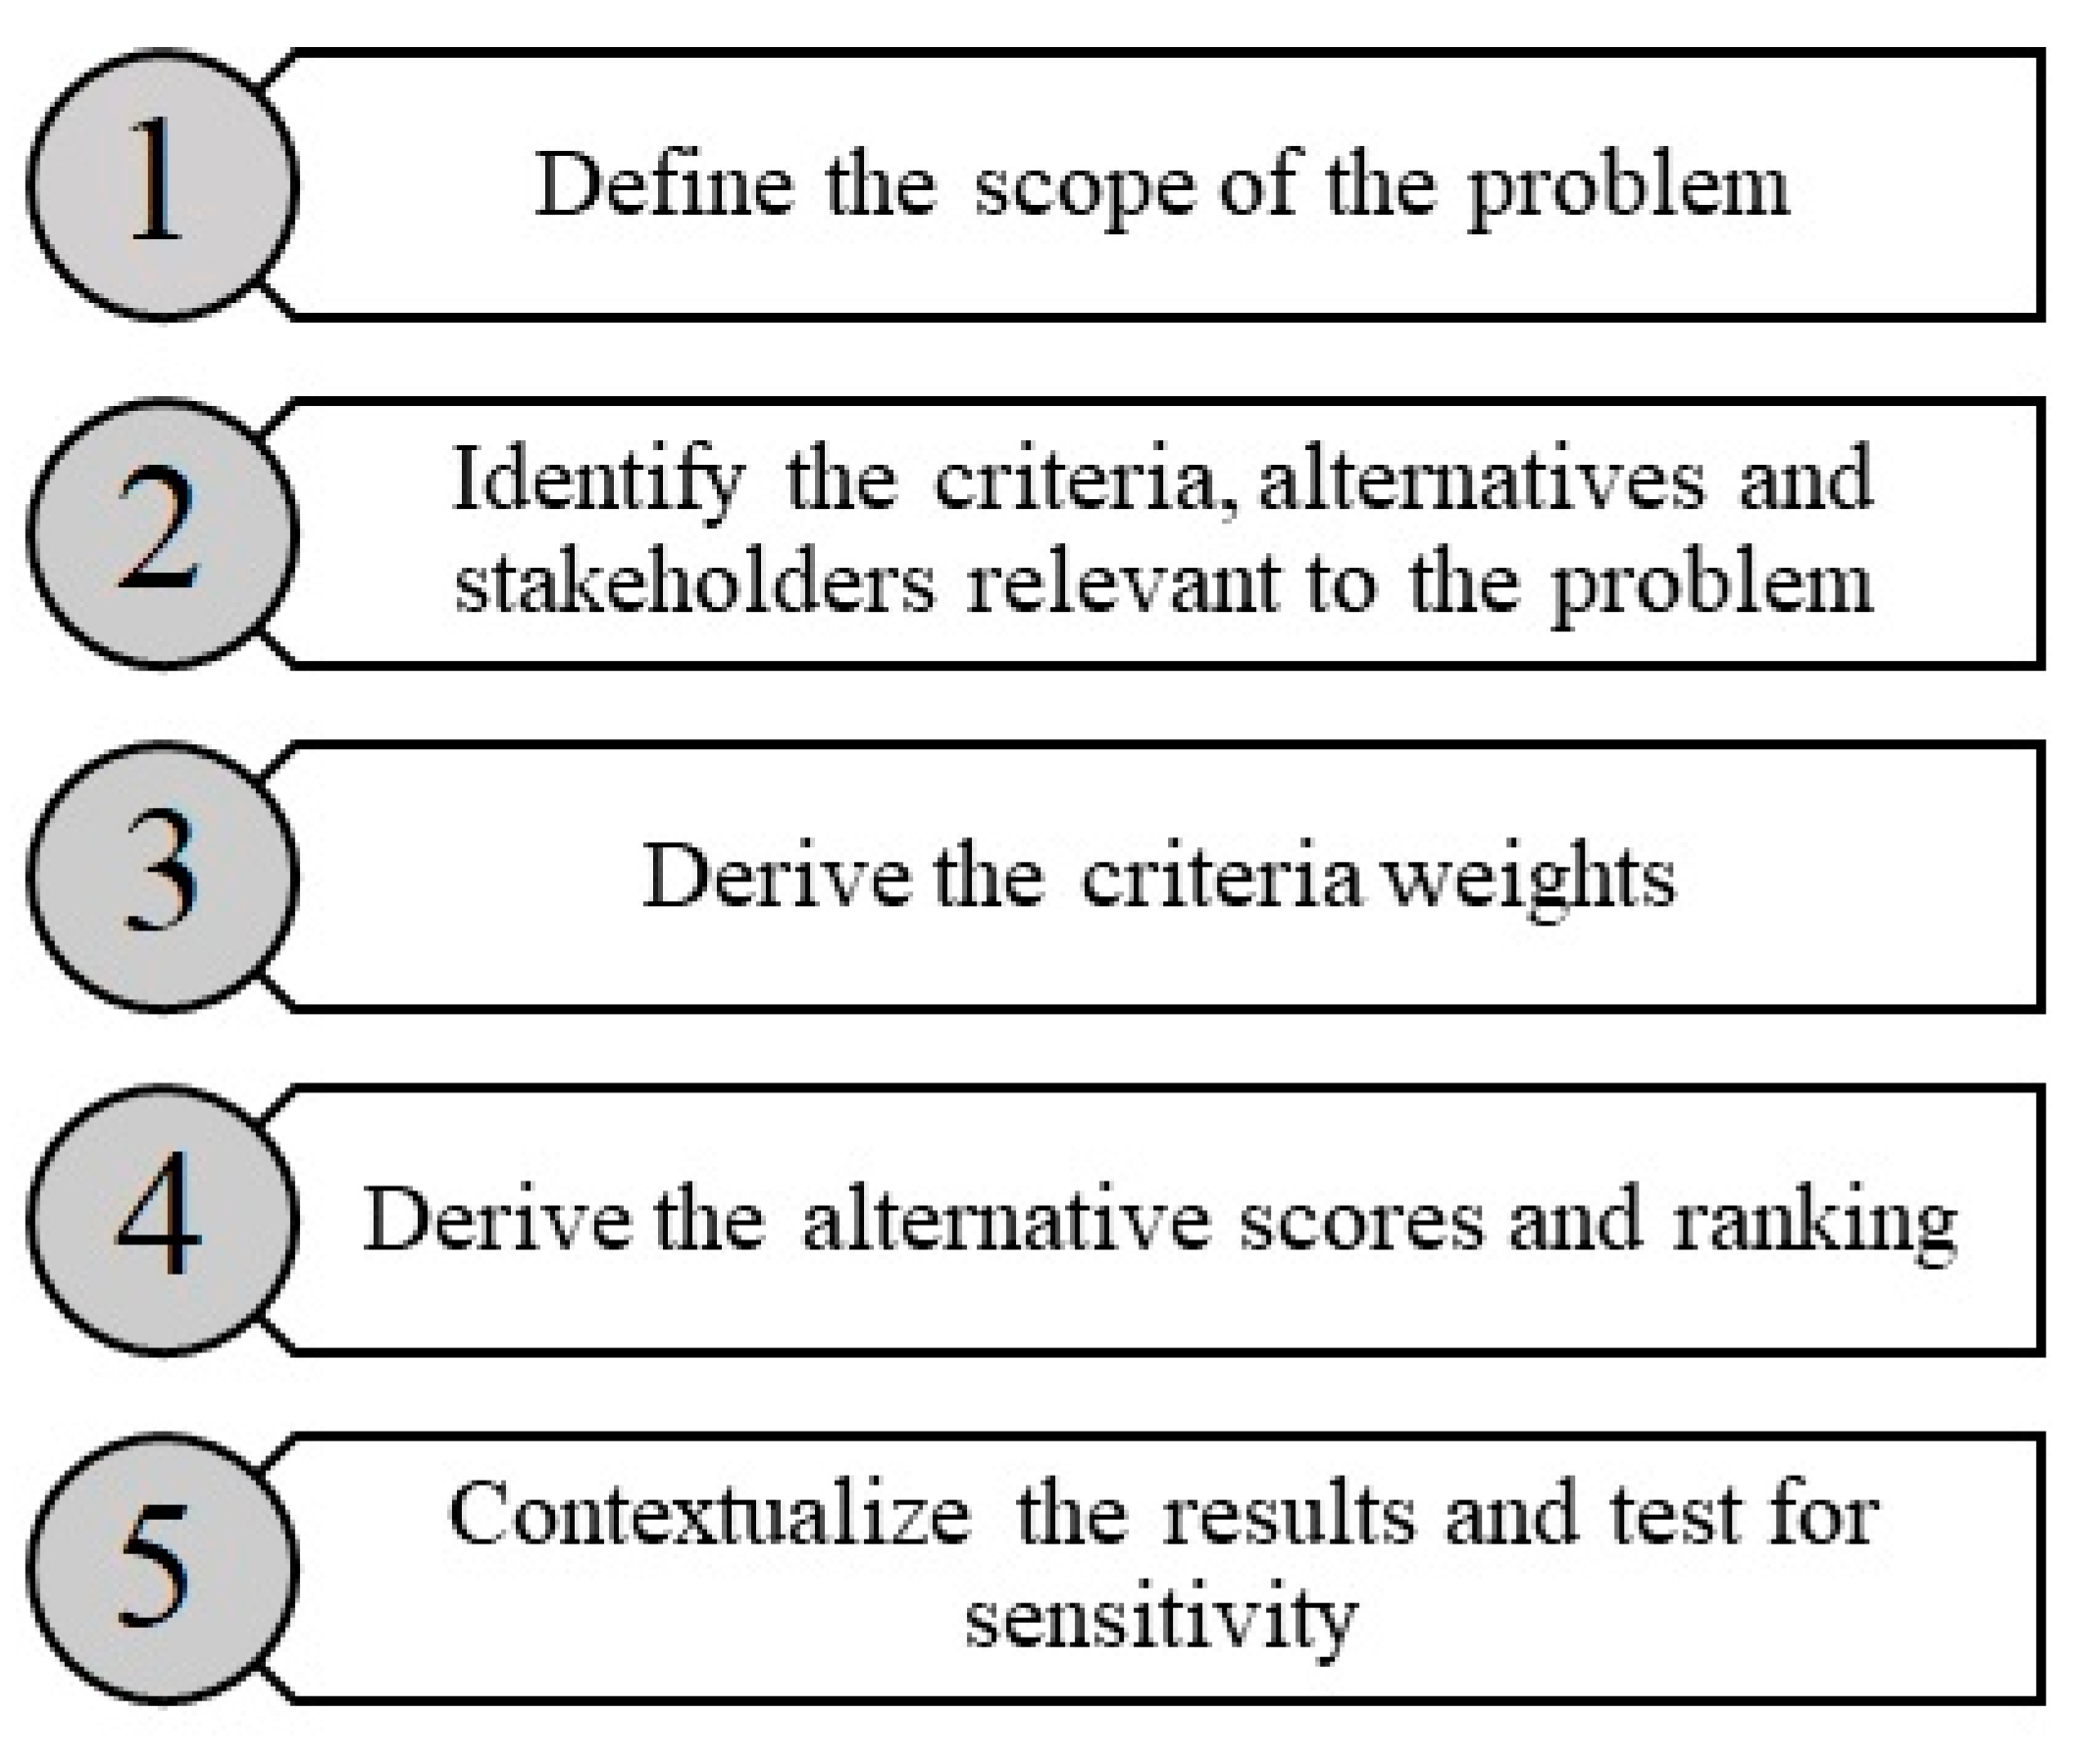
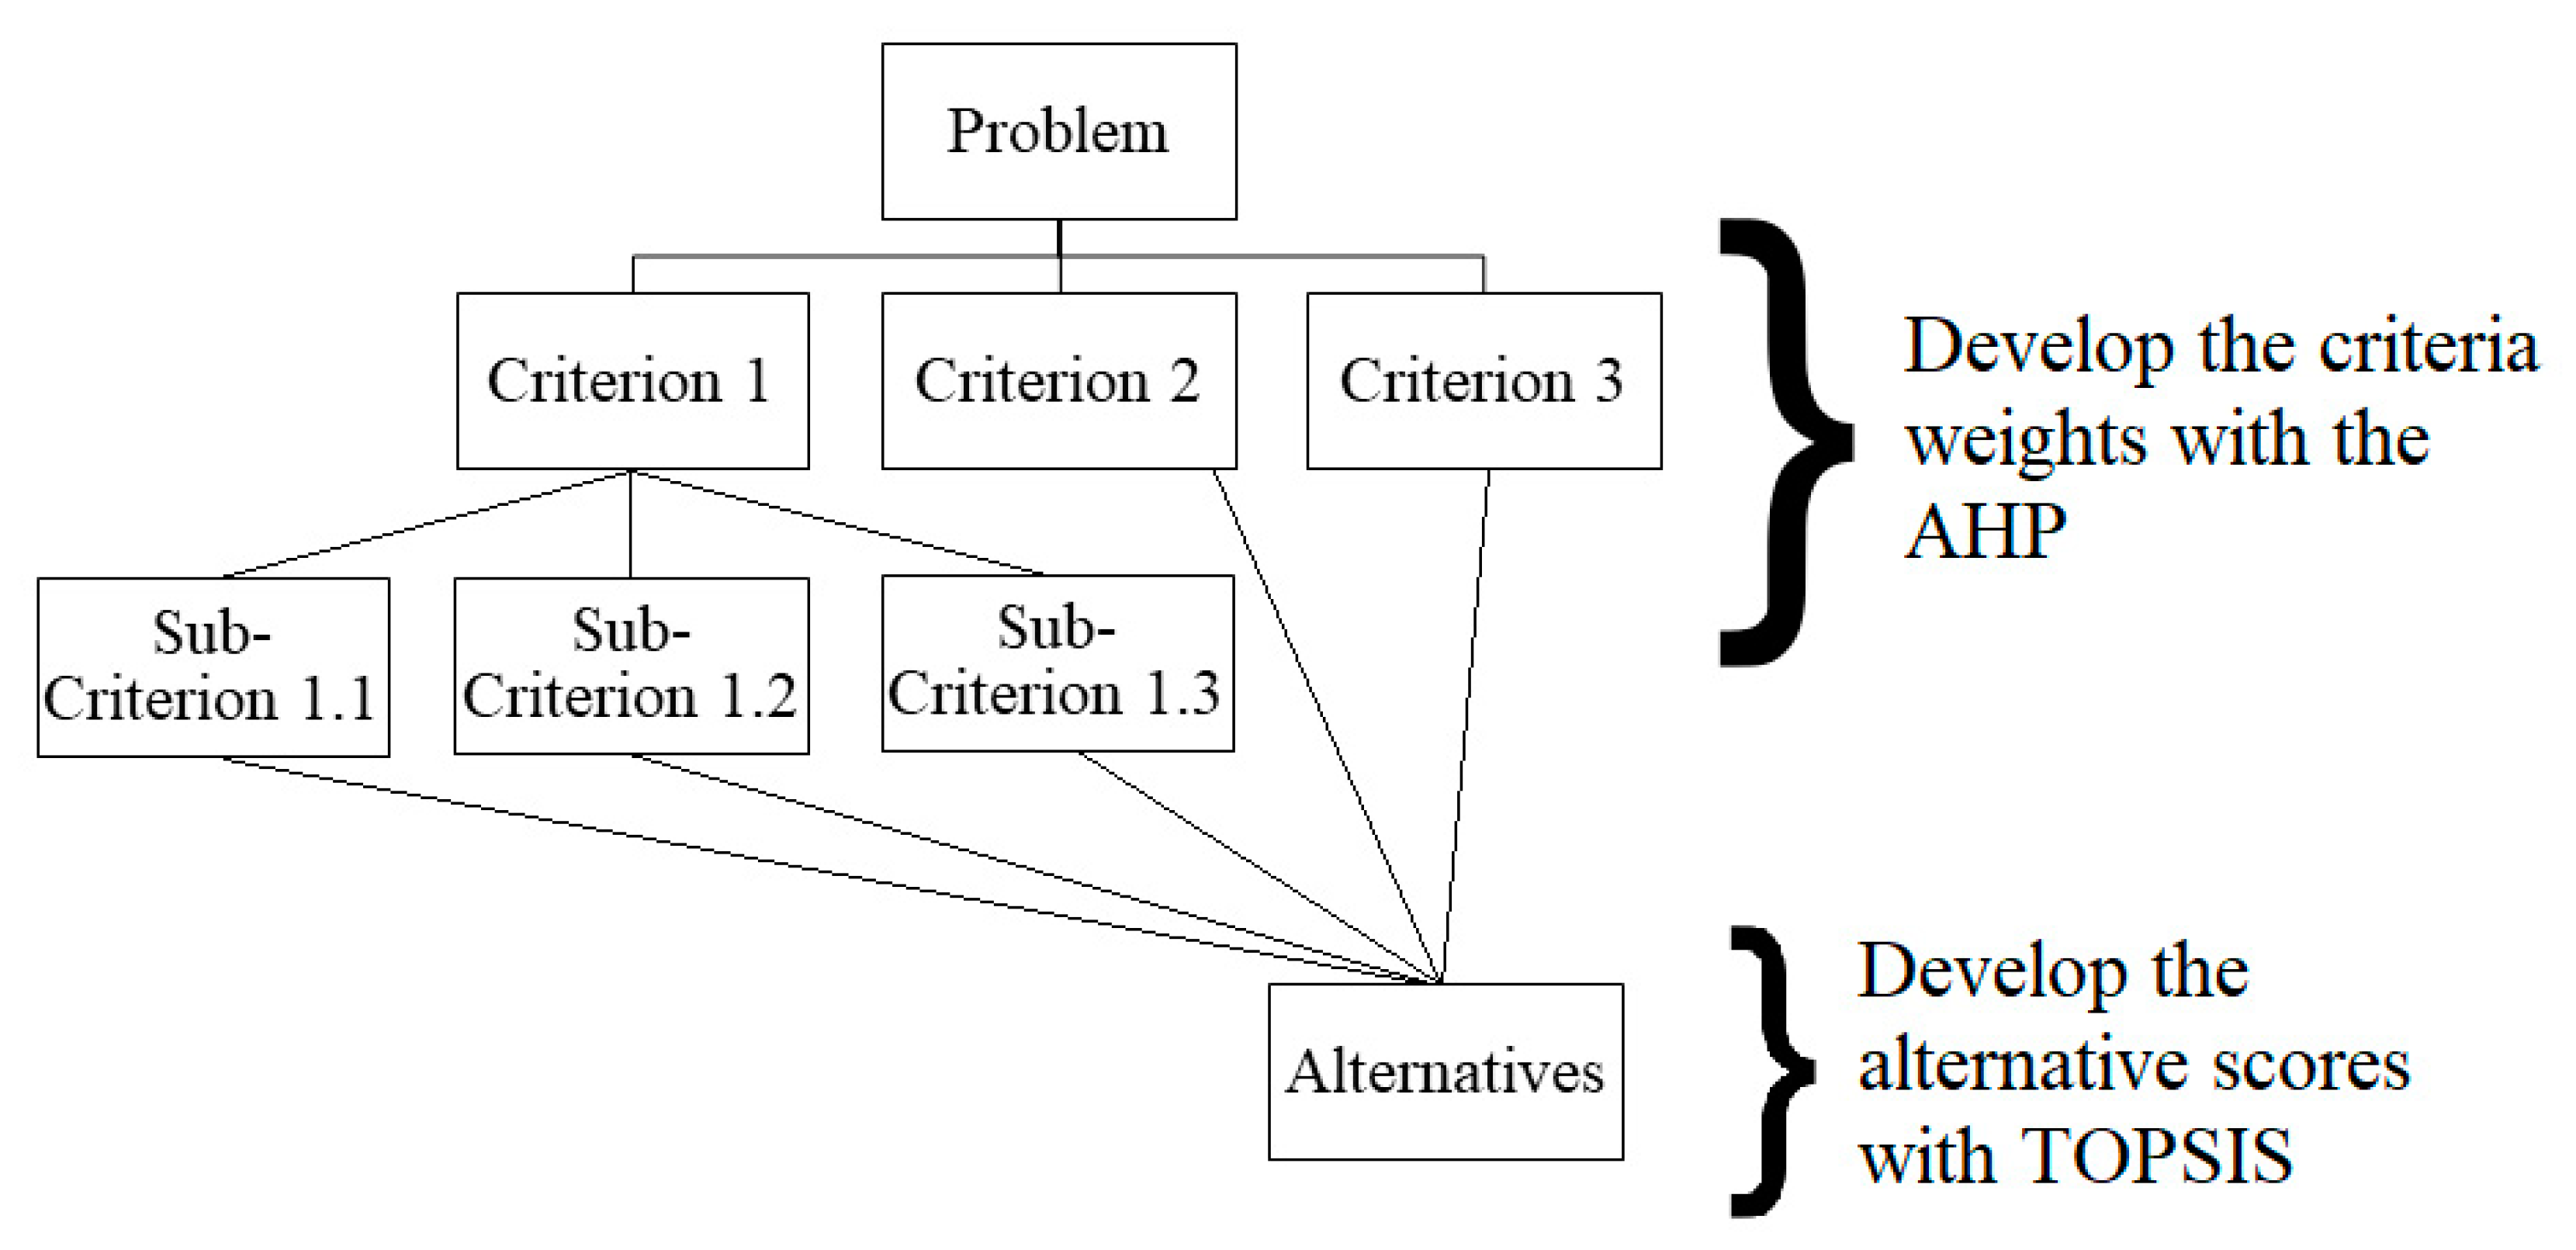
3. AHP-TOPSIS MCDA Methodology

An MCDA is generally performed in five stages (Figure 1) where we outline the proposed AHP-TOPSIS method through these stages.

3.1. Defining the Problem

The most important stage of any MCDA is to understand the nature of the problem. Like most decision-making it involves defining the problem, geographic area, pressures on the problem and for whom and what a solution is needed.

3.2. Alternative, Criteria, and Stakeholders

The criteria represent the factors of the decision and the alternatives are the potential solutions to the problem. Frequently, the criteria are derived from experience in decision-making, while the alternatives are developed from the literature [45]. While not a hard rule, it is generally preferable to verify the criteria and alternatives with experienced stakeholders or previous materials to ensure the relevance of the MCDA.
The stakeholder analysis identifies the parties relevant in the formation and implementation of policy and is integral in environmental decision-making as it helps make the decision more robust and it can adapt the decision to local characteristics [46]. Stakeholder analyses are not just useful for environmental management but are frequently used across decision areas affecting cities [46,47,48]. However, a stakeholder analysis may not capture every relevant voice and can obscure minority voices and unexpected stakeholders [46]. Ultimately, who is included and who is excluded are based on the methods used.
A simple stakeholder analysis for decisions that need to be made quickly is the interest-influence matrix to categorize the stakeholders. Participants in the analysis list stakeholders and rate their interest and influence in the decision and if desired, offer comments on the relationships between the groups [49]. The stakeholders are then categorized into four quadrants: high-interest/high-influence, high-interest/low-influence, low-interest/high-influence, and low-interest/low-influence and stakeholders can be selected as representative groups for participation in the MCDA.
No stakeholder method will be perfect in identifying everyone relevant toward the decision. As a top-down approach and depending on the participants, the interest/influence method can often identify usual stakeholders in the decision-making process and is also biased toward the opinions of those making the decision and rating the stakeholders as well as assuming how they judge other stakeholders is relevant [47]. However, other bottom-up methodologies like stakeholder-led categorization and Q as well as additional methods such as social network analysis can be time intensive and are also subject to their own flaws. There is no perfect stakeholder analysis method and ultimately every stakeholder will not be captured by the methods. However, with well-defined scopes and limitations the interest/influence method can be quickly implemented as part of the integral stakeholder for the decision-making process.

3.3. Criteria Weights and Alternative Scores

In this stage we employ the AHP-TOPSIS method. We determine the decision hierarchy of the problem to differentiate between the two MCDA methods (Figure 2), for the full equation set please refer to supplementary material.

3.3.1. AHP

We propose using the AHP to determine the criteria weights. In general, using pairwise comparisons one compares criteria C i with C j to form a square matrix of dimensions C n x C n , matrix A = [ a i j ] (Equation (1)). The matrix is reciprocal along the NW-SE axis. The matrix is then normalized by matrix column to A ^ .
A = [ a 11 a 12 a 1 n a 21 a 22 a 2 n a n 1 a n 2 a n n ]
where:
(i)
a i j = 1 a j i for i ,   j = 1 , , n and i j
(ii)
a i j = 1 for i , j = 1 , ,   n and i = j
The pairwise comparisons between criteria are made using a linguistic scale, regardless of their quantitative or qualitative natures. Saaty’s original scale is linear from values 1–9 so that the difference between each successive value is proportional in magnitude (Table 2). While other scales exist the main difference between scales is how consistent a decision-maker performs in their comparisons [50,51,52]. Saaty’s linear scale is not the best at maintaining consistency, but it is still widely used and favored in practice [50,53]. Additionally, while different scales influence the criteria weights, they rarely influence the final ranking of the alternatives [50]. Therefore, because of its integration in the non-scientific community we incorporate Saaty’s linear scale.
Next, the priority weight vector is derived from matrix A ^ that indicates the weight of each criterion in the matrix. Represented as w , there are several methods of calculation. Saaty supports using the eigenvector of the matrix as the priority weight vector [18,54,55]. Alternatively, Crawford and Williams [56] developed the logarithmic least squares or geometric mean method (GM) to determine w . Minimizing the logarithmic error of the weightings, Barzilai argues the geometric mean method is unburdened by scale inversion and is better at handling optimization problems and error estimations [57,58,59,60]. To calculate the GM, w is derived from the geometric mean of the matrix rows (Equation (2)). This method describes an explicit connection between matrix inputs and the weights allowing for quick and effective sensitivity analyses [61]. Furthermore, this method remains simple regardless of the size of the matrix allowing for non-experts to quickly understand the process. Nonetheless, despite the ongoing theoretical disagreement over the optimal method to derive the priority weights, there are marginal practical changes on the end results when using both methods [62]. Because of the GM’s performance advantage as well as the direct connections to the input matrices and decision-makers ease of use, we continue with the GM.
There is an additional method of calculating the priority weight vector by using a combined weighting measure taking into account the AHP weights and an objective weight measure [63,64,65]. While these methods have not yet been widely adopted within the theoretical discussions around the AHP, they have been demonstrated to be good at removing the subjective and variable nature of the weights, thus reducing inconsistencies and the potential for rank reversals, they require an extra step of establishing the objective criteria hierarchy. In a case such as stormwater climate adaptation, a large volume of criteria may be difficult to analyze truly objectively, akin to the introduction of valuing ecosystem services within environmental economics. Furthermore, these combined methods work best when there is a high amount of accurate data regarding the alternatives and criteria [66], something that is not always available in climate decisions with various projected outcomes. While we acknowledge the promise these combined methods have in reducing the subjective nature of AHP weighting systems, they add an additional layer of technical complexity for decision-makers while attempting to derive weights objectively with often variable and uncertain indicator data; therefore, proceeding without a combined weight methodology.
w = ( w 1 w 2 w n ) = ( a ^ 11 a ^ 12 a ^ 1 n n a ^ 21 a ^ 22 a ^ 2 n n a ^ n 1 a ^ n 2 a ^ n n n )
where:
(i)
w i > 0 and i = 1 , 2 , n
(ii)
i = 1 n w i = 1
Before the priority weight vector can be accepted, the decision matrix is tested for consistency. A consistency test is important due to the nature of making subjective comparisons as well as the internal structure of the AHP. How one calculates the priority weight vector determines an appropriate consistency test.
Saaty [18] developed a consistency index and ratio (CR) for the eigenvector method still widely referred to today in policies. To allow the GM to be directly comparable with these existing studies, we propose using the geometric consistency index (GCI) interpreted by Aguaron and Moreno-Jimenez [67] from Crawford and Williams [56] (Equation (3)). Here the GCI examines the “average of the squared difference between the log of the errors and the log of unity” [67] (p. 139).
G C I = 2 ( n 1 ) ( n 2 ) i , j = 1 i < j n l n 2 e i j
where e i j = a i j w j / w i is the error obtained when the ratio w i / w j is approximated by a i j .
Importantly, the GCI has a near linear relationship with Saaty’s CR for CR < 0.2 and for n ≤ 4. One can take the equivalent GCI value and compare it directly with the CR. This is useful as the CR can represent a percentage and traditionally, if the CR < 0.1 (10%), the comparison matrix is considered to have good consistency [18]. However, a CR > 0.1 does not mean that the matrix is necessarily invalidated, but critical attention should be paid to the decision matrix if it exceeds this amount. Therefore, sometimes a CR within 0.2 is still tolerable, particularly in uncertain areas such as climate change [25,68]. Here, we advocate for a CR < 0.2 or a GCI < 0.7052 (for n = 4) when considering urban climate adaptation studies. If a matrix has a greater GCI, then the analyst must either disregard the matrix or ask the decision-maker to re-evaluate their judgements. The GCI is beneficial as it is related to the GM method, directly comparable with the CR and easy to conduct.
Equations (1)–(3) are repeated for each level of the hierarchy, i.e., a new matrix is constructed for each level of sub-criteria.

3.3.2. Group Aggregation

The proposed method accounts for multiple stakeholders and thus the responses need to be aggregated together. Consistency can be used as a measure of aggregation [58,69]. Here we suggest the aggregation of individual priorities (AIP) where each decision-maker produced their own w and GCI measure. The AIP method treats decision-makers as individuals allowing for their variation to be observed as opposed to the aggregation of individual judgements which treats decision-makers as a cohesive group aggregating them into one matrix [70]. Neither aggregation method is superior but depends on how to observe the decision-makers [71,72]. Additionally, when using AIP should each decision-maker have acceptable consistency, the final aggregated w will be similarly acceptable [73].
As the CR can be represented as a percentage, we propose initially converting the GCI values to the equivalent CR. In practice, one cannot be more than 100% inconsistent so we propose using a consistency measure (CM) as the inverse of the CR to demonstrate consistency (Equation (4)). The CM can then subsequently be normalized by all the decision-makers to find the decision-makers’ individual aggregation weight (aiw) (Equation (5)). In a case where the decision-makers display the same level of consistency, then an equal aiw would apply for all decision-makers.
C M k = 1 C R k
where:
(i)
k = 1 ,   2 ,   ,   r for the set of decision-makers
a i w k = C M k k = 1 r C M k
where:
(i)
k = 1 r a i w k = 1
The aggregated priority weight vector ( w ¯ ) for the entire group of decision-makers can be calculated using the weighted arithmetic or geometric mean. Both techniques do not violate the Pareto principle and are therefore viable [74,75]. However, as the nature of the AHP relies on having ratio properties, we proceed with the weighted geometric mean (Equation (6)) [71]. Additionally, this method is less likely to be skewed by outliers in the data set [74,75,76]. Finally, w ¯ is normalized to w ^ .
w ¯ = k = 1 r ( w k ) ( a i w k )
Equations (4)–(6) are repeated to determine the group priority weighting of each decision matrix including each level of the hierarchy if sub-criteria are present. To condense the criteria and sub-criteria weights into the global aggregated weights of the criteria interacting with the alternatives in the decision hierarchy, one takes the weight of the aggregated parent criterion and multiplies it by the aggregated priority weight vector of the sub-criteria matrix (Equation (7)). The final global aggregated weights of the criterion that interact with the alternatives is now presented simply as the final priority weight vector w .
w g l o b a l   s u b c r i t e r i a   m a t r i x = w ^ i w ^ s u b c r i t e r i a   m a t r i x
where:
(i)
w i is the weight of the parent criterion in the decision hierarchy from the aggregated parent priority weight vector.

3.3.3. TOPSIS

After establishing the criteria weights, TOPSIS analyzes the performance of the alternatives. As we established the decision-makers as a group in the AHP, we propose using the group aggregation method for TOPSIS provided by Shih et al. [77]. In group decision-making, certain decision-makers may provide overly strong preferences and aggregation techniques might mask this dominance leaving other decision-makers dissatisfied with the outcome. While some aggregation techniques target this phenomenon specifically [78], Shih et al. [77] demonstrate that their method is useful under different distance measurements and internal aggregation techniques.
Starting in TOPSIS, a decision-maker k rates the alternatives A i to the criteria C j in a matrix B k = [ f i j ] of dimensions A m x C n (Equation (8)). The matrix is then normalized to matrix Z k = [ z i j ] as the square root of the sum of the squared matrix input by column (Equation (9)). Unlike in the AHP, in TOPSIS the decision-maker is only constructing one matrix, reducing the required burden of judgements.
B k = A 1 A 2 A m C 1 C 2 C n [ f 11 f 12 f 1 n f 21 f 22 f 2 n f m 1 f m 2 f m n ]
where:
(i)
Ai represents the alternative i and Cj represents the criteria j, for i = 1, …, m and j = 1, …, n
(ii)
fij represents the performance rating of Ai under Cj
(iii)
For k = 1, 2, …, r for the number of decision-makers
Z k = [ z 11 z 12 z 1 n z 21 z 22 z 2 n z m 1 z m 2 z m n ]
where:
(i)
z i j = f i j i = 1 m f i j 2
Quantitative values are directly input into the matrix while qualitative judgements are made using a linguistic scale. Like AHP, a 1–9 scale exists for TOPSIS judgements (Table 3). The analyst can establish many varieties of scales but in a stochastic TOPSIS, the 1–9 scale is satisfactory [79].
At this stage, Shih et al. [77] differ from the traditional TOPSIS by delaying the addition of the criteria weights into the matrix until later in the process. The analyst now establishes the positive ideal solution (PIS) and the negative ideal solution (NIS) for each criterion, or matrix column. The PIS ( Z k + ) represents the best performing alternative value in the criterion (Equation (10)) and the NIS ( Z k ) the worst performing value (Equation (11)). The PIS and NIS are influenced if the criteria is considered a cost (preferred low value) or a benefit (preferred high value).
Z k + = { ( M a x   z i j k | j J   ) , ( M i n   z i j k | j J ) | i = 1 , 2 , , m } = { z 1 k + , , z j k + | j = 1 , 2 , , n }
where:
(i)
J is associated with positive criteria or benefits while J is associated with negative criteria or costs
Z k = { ( M i n   z i j k | j J   ) , ( M a x   z i j k | j J ) | i = 1 , 2 , , m } = { z 1 k , , z j k | j = 1 , 2 , , n }
where:
(i)
J is associated with positive criteria or benefits while J is associated with negative criteria or costs.
Once the PIS and NIS are established for each criterion, considering the aggregated group priority vector w derived during the AHP, the analyst can calculate the separation measure of each alternative to the ideals. The Euclidean distance is one of several distance measures that can be considered [77,80]. However, despite the shortcomings of the measure in capturing the interdependencies between alternatives, the Euclidean distance is the traditional measure that is still applied in TOPSIS and has strong integration into the existing policy framework. The separation distance from the PIS ( S i + ) and the separation distance from the NIS ( S i ) for each alternative is then calculated (Equations (12) and (13)).
S i k + = j = 1 n w j ( z i j k z j k + ) 2
where:
(i)
w j is the weight of criterion j from the group priority weight vector w
S i k = j = 1 n w j ( z i j k z j k ) 2
where:
  • wj is the weight of criterion j from the group priority weight vector w .
Once the separation distances are calculated for each decision-maker, the group aggregated separation distances are calculated. The aggregation can be performed but with the geometric and arithmetic mean achieving similar results [77]. Similar to the justification in the AHP aggregation, because the separation measures are achieved through ratings based on scales and the arithmetic mean’s ability to be influenced by outliers, we proceed with the geometric mean (Equations (14) and (15)).
S i + ¯ = ( k = 1 r S i k + ) 1 r
S i ¯ = ( k = 1 K S i k ) 1 r
In the final stage, the relative closeness to the ideal solution C i * ¯ is calculated as a measure of each alternative’s separation from the ideal positive and negative solutions (Equation (16)). The results are presented on a scale of 0–1 and the final rankings of the alternatives are listed in descending order.
C i * ¯ = S i ¯ S i + ¯ + S i ¯

3.4. Sensitivity Analysis

The sensitivity of the results of the AHP-TOPSIS analysis needs to be explored to understand how stable the results are. As uncertainty is prevalent in making subjective judgements, a sensitivity analysis demonstrated how reliable the results are given the criteria weights [81,82,83]. While many methods exist to examine sensitivity, we proceed with Li et al.’s [82] sensitivity test as it is computationally simple and its functioning is simple for non-experts to explore.
In general, a disturbance is placed upon one of the weights, w q where q = 1, 2, 3, …, n for the set of criteria in such w q becomes w q * = γ q w q , where γ q is the initial variation ratio of w q and is >0. The sum of the weights must continue to equate to 1 so the weightings of the other weights are also adjusted by this variation (Equation (17)).
w = ( w 1 = w 1 w 1 + w 2 + w q * + w n = w 1 1 + ( γ q 1 ) w q w 2 = w 2 w 1 + w 2 + w q * + w n = w 2 1 + ( γ q 1 ) w q w q = w q * w 1 + w 2 + w q * + w n = γ q w q 1 + ( γ q 1 ) w q w n = w n w 1 + w 2 + w q * + w n = w n 1 + ( γ q 1 ) w q )
where:
(i)
w 1 , w 2 , w q , and w n are the new weights for criteria 1, 2, q, and n after the disturbance of w q
(ii)
j = 1 n w j = 1 and j = 1 , , n
β q is the unitary variation ration of w q after being altered and we can then represent γ q in terms of β q (Equations (18) and (19)).
β q = w q w q
γ q = β q β q w q 1 β q w q
By establishing the parameter β q , the analyst can test the variation of the weight on the criteria. For example, a β q set at 0, 0.5, 0.8, 0.95, 1, 1.05, 1.20, 1.50, 2.00 would effectively be testing the variation of a criterion when the weight is adjusted by ±5%, ±20%, ±50%, and ±100%, while the other criteria are adjusted accordingly. The resulting shifts in the C i * ¯ for each alternative can easily be visualized graphically allowing the analyst to observe the ranking changes over the criteria weight changes. By testing each criterion, one can establish the criterion that is the most sensitive to the top ranking alternative to change and the most sensitive to any alternative ranking to change.

4. New York City and MCDA Stormwater Results

4.1. Study Area

Demonstrating the effectiveness of the proposed AHP-TOPSIS method we focus on NYC stormwater management under climate change. NYC is a large coastal city with roughly 8.5 million inhabitants. Acting as a regionally, nationally, and internationally important city, the city is a leader in developing urban policy and can act as a case example for additional metropolitan areas to follow. Experiencing rapid growth in the 19th and early 20th century as well as several large public works projects in the mid-20th century, the city’s urban stormwater infrastructure is ageing and needs to be adapted to the emerging precipitation pressures of climate change. Rainfall intensity is expected to increase within the city [84]. As such NYC has begun to develop policies around stormwater management [85] and has also begun piloting specific cloudburst management neighborhood design [86].
The increasing intensity of rainfall threatens to overwhelm the local stormwater systems causing more frequent and damaging in-land flooding events while threatening the aquatic environment with combined sewage overflow events, a problem NYC has been attempting to fix. Recent rainfall events such as in July 2021, where 39.6 mm of rainfall fell within one hour flash flooding roads and causing disruptions within the underground subway network, have demonstrated the importance of adaptation to a more rainfall-intensive future [87]. However, as with many large cities, complications in policy management arise as stormwater is a complex topic that overarches several city departments including Parks, Water, and Planning with many non-governmental stakeholders also having a voice in the direction of policy management.

4.2. Defining the MCDA

To develop the criteria and alternatives we relied on the previous stormwater work by Axelsson et al. [10]. Using six dynamic and global cities from the developed world, including NYC, five policy alternatives were identified by examining 58 policy documents on stormwater, green infrastructure, and climate adaptation: 1. Grey Infrastructure Overhauls involved the (re)development of traditional concrete based stormwater systems to manage rainfall volumes, 2. Public Green Infrastructure, and 3. Private Green Infrastructure relate to the emerging best management practice of implementing green or green-blue systems for stormwater management but are differentiated by if they are financed by public or private bodies, 4. Government Streamlining which helps to merge stormwater management under one governmental agency while increasing the transparency in policy and infrastructure development and 5. Maintaining Urban Environments which ensures that the existing urban system functions and increases citizen engagement within policy management. From here in the study blue-green infrastructure is represented under the term “green” infrastructure as it connects to more general discourses around natural solutions in urban adaptation. These alternatives reflect industrial and post-industrial cities’ necessity to retrofit aging and complex layers of existing systems and infrastructure.
Using the same 58 policy documents from Axelsson et al. [10], sixteen relevant criteria were identified and organized as equal sub-criteria groupings under four principal criteria: Political, Economic, Environmental, and Social criteria. These criteria include traditional policy management considerations such as public costs and project feasibility but also introduce new and emerging criteria for stormwater management such as the ecosystem support of a project and how it can reduce urban inequalities. Please refer to supplementary material for the full list of criteria and their description as well as the full explanation of the alternatives.
In policy-making, groups who advocate and research for outcomes are influential alongside decision-makers [88,89]. Considering this we identified three groups to perform the stakeholder analysis: a green infrastructure research group (5 participants), an environmental activism group (3 participants), and a community advocate group (1 participant). With green solutions emerging as best management practice and community outreach and equity’s growing importance in planning, these three groups reflect key stakeholders in urban decision-making within water management. Due to COVID-19 restrictions, the analysis was performed via video. Each participant individually listed stakeholders involved in stormwater and rated their interest and influence on a scale of 0–10. The results were then aggregated within their group and a group follow-up discussion reflected and adjusted the placement of stakeholders. Finally, the research group re-performed the analysis to observe any changes post-discussion which results in a tighter clustering of the stakeholders. The three groups also discussed and validated the sixteen criteria’s relevance.
In total, 60 stakeholders were identified: 7 by all three groups and 14 by only two groups, in addition to some form of “citizen”. The 60 stakeholders were classified into six types: the general public, city governance, extra-city governance, advocacy/conservancy/local structuring, research/design/construction, and other.
Here, we are interested in more active stakeholders and continued with the stakeholders from city governance, advocacy/conservancy/local structuring, and research/design/construction. These types additionally have the most overlap between groups. Figure 3 demonstrates the distribution of the initial stakeholder placements and the distribution of the three types after discussion. While most remain high influence, they exert varying levels of interest.
From this, we drew upon three stakeholder groups for participation in the MCDA. City Formal Governance includes many of the departments relevant to stormwater management. Advocacy/Conservancy are vocal contributors to policy with specific focuses on aspects of stormwater. Research/Design provides the theoretical basis for many projects and is a frequent collaborator with both other groups.

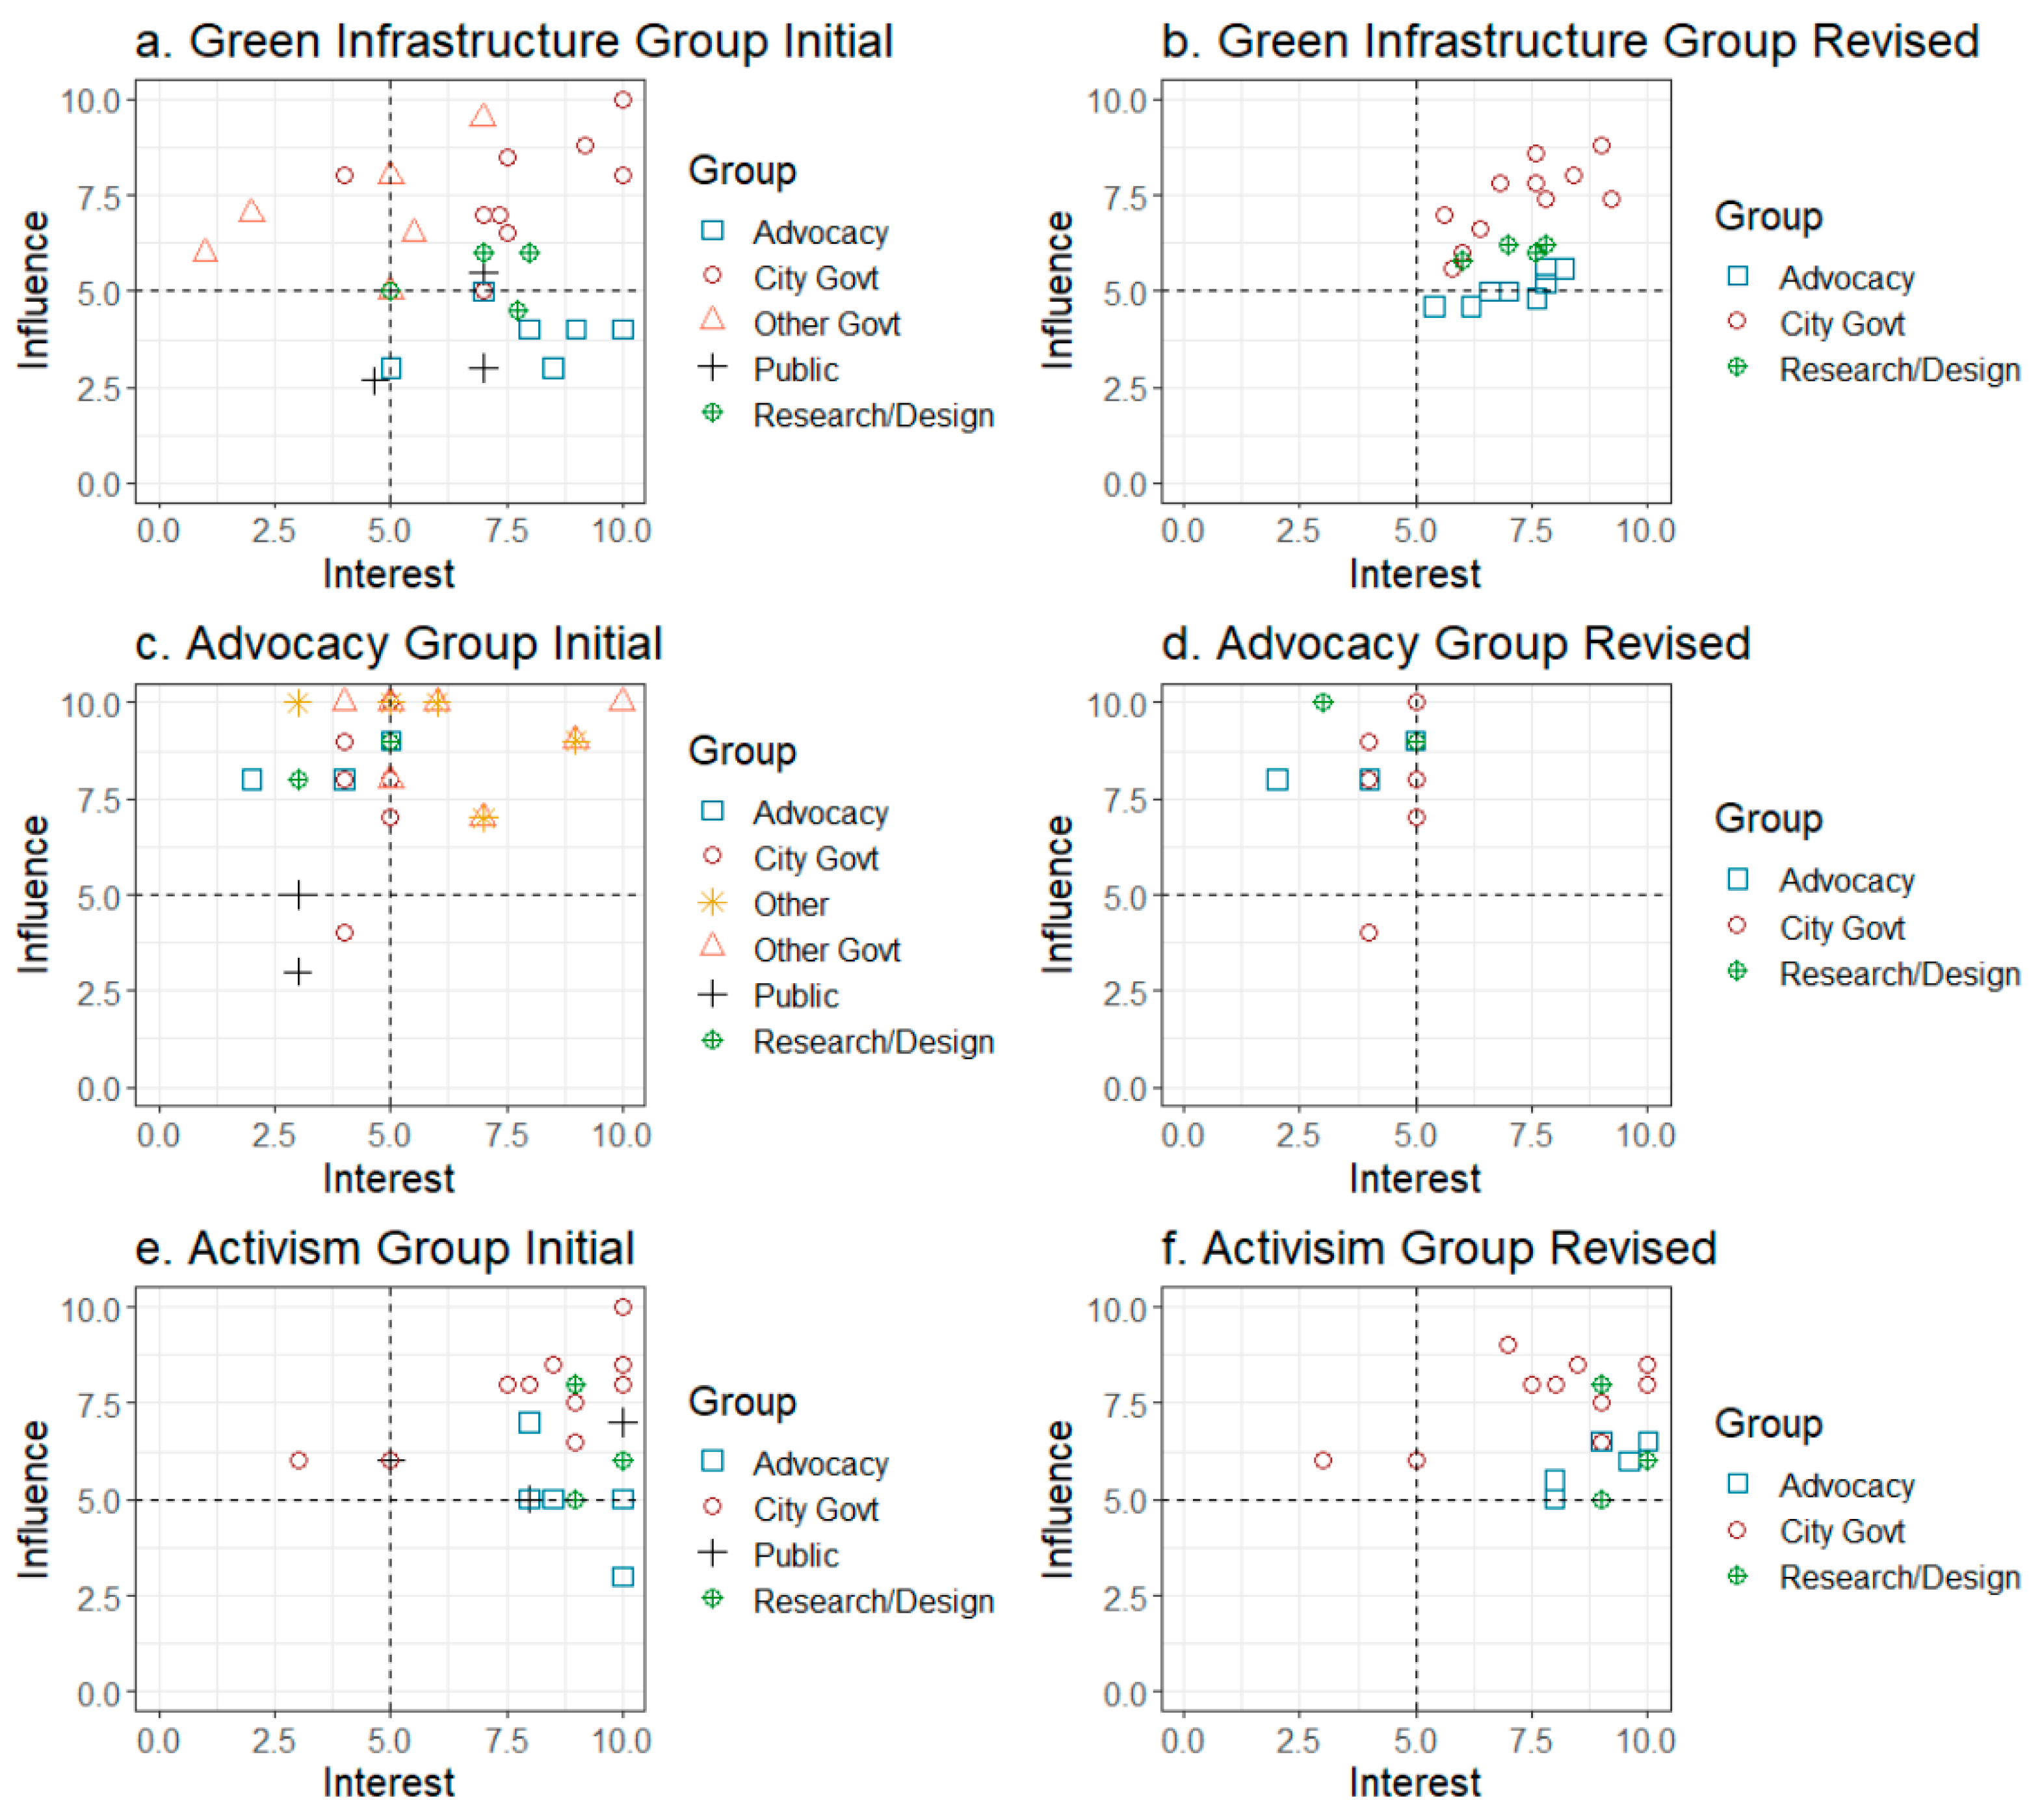
4.3. Data Collection

Data were collected using an online survey where participants compared the criteria and ranked the alternatives through Zoho Survey during November–December 2020 [90]. The survey focused on the reality of NYC and not an idealized hypothetical. Initial contacts were made using the identified three stakeholder types from publicly accessible contact information and then additional contact was made through a snowball method. We collected twelve completed responses: six from governance, two from research, and four from advocacy.
As the study does not focus on a specific infrastructure project or specific locale within NYC, no indicator data were provided to the participants, i.e., monetary values regarding costs, expected times to complete projects, established environmental scoring, etc. The participants compared and scored the criteria and alternatives based on their own experience and perceptions of stormwater adaptation and policy management. By focusing on the perceptions around management and not the perceptions around tangible values, we exclude any biases toward selecting what might be perceived to be the optimal choice, for example the cheapest option, the quickest to implement, or the one labeled “most sustainable”.
The data were analyzed using Microsoft Excel to underscore the accessibility of the method. Additionally, Excel provides a visual aspect of the data manipulation. For the AHP, GCI values were included up to the CR equivalent of 0.2. If participants exceeded this threshold, they were offered an opportunity to re-evaluate the inconsistent judgements or the specific matrix was excluded from analysis. Overall, 60 matrices were constructed for AHP: five per stakeholder. Only 8 matrices were excluded.

4.4. Results

The results underscore how the AHP-TOPSIS method is effective at identifying and quantifying differences between stakeholders. This provides a basis to overcoming barriers between urban stakeholders and enact decisions acceptable to more groups. As urban decision-making on stormwater becomes more pressing, this will be beneficial to ensure new policies are effective and well received.

4.4.1. Criteria Weights

The advocacy and governance groups are closely aligned with the main criteria and sub-criteria priority weights when compared to the research group (Table 4). Political and economic interests take priority in their weightings. Inversely, social and environmental interests contribute more to the researcher’s priorities. For governance, traditional methods of politics and economic concerns may explain their priorities. Advocacy, often involved in lobbying for change places a higher magnitude of importance on politics. Political will is a large component of the effectiveness of resilience planning [9]. Researchers may be more insulated from these political pressures with research focusing on specialized aspects of stormwater.
While research can operate in more theoretical spaces, it still forms the basis of most environmental decisions. This disconnect between stakeholders can hamper the ability for effective adaptation planning. By identifying the importance of criteria for the city but also by group, we have demonstrated that the priorities of the city may mask those of influential stakeholders. To ensure that the decision is ultimately relevant for those involved, NYC governance can collaborate closely with researchers to ensure the exchange of knowledge and information. These differences may not ultimately disappear, but they should be understood and not a result of limited exchanges or misunderstanding.

4.4.2. Alternative Scores
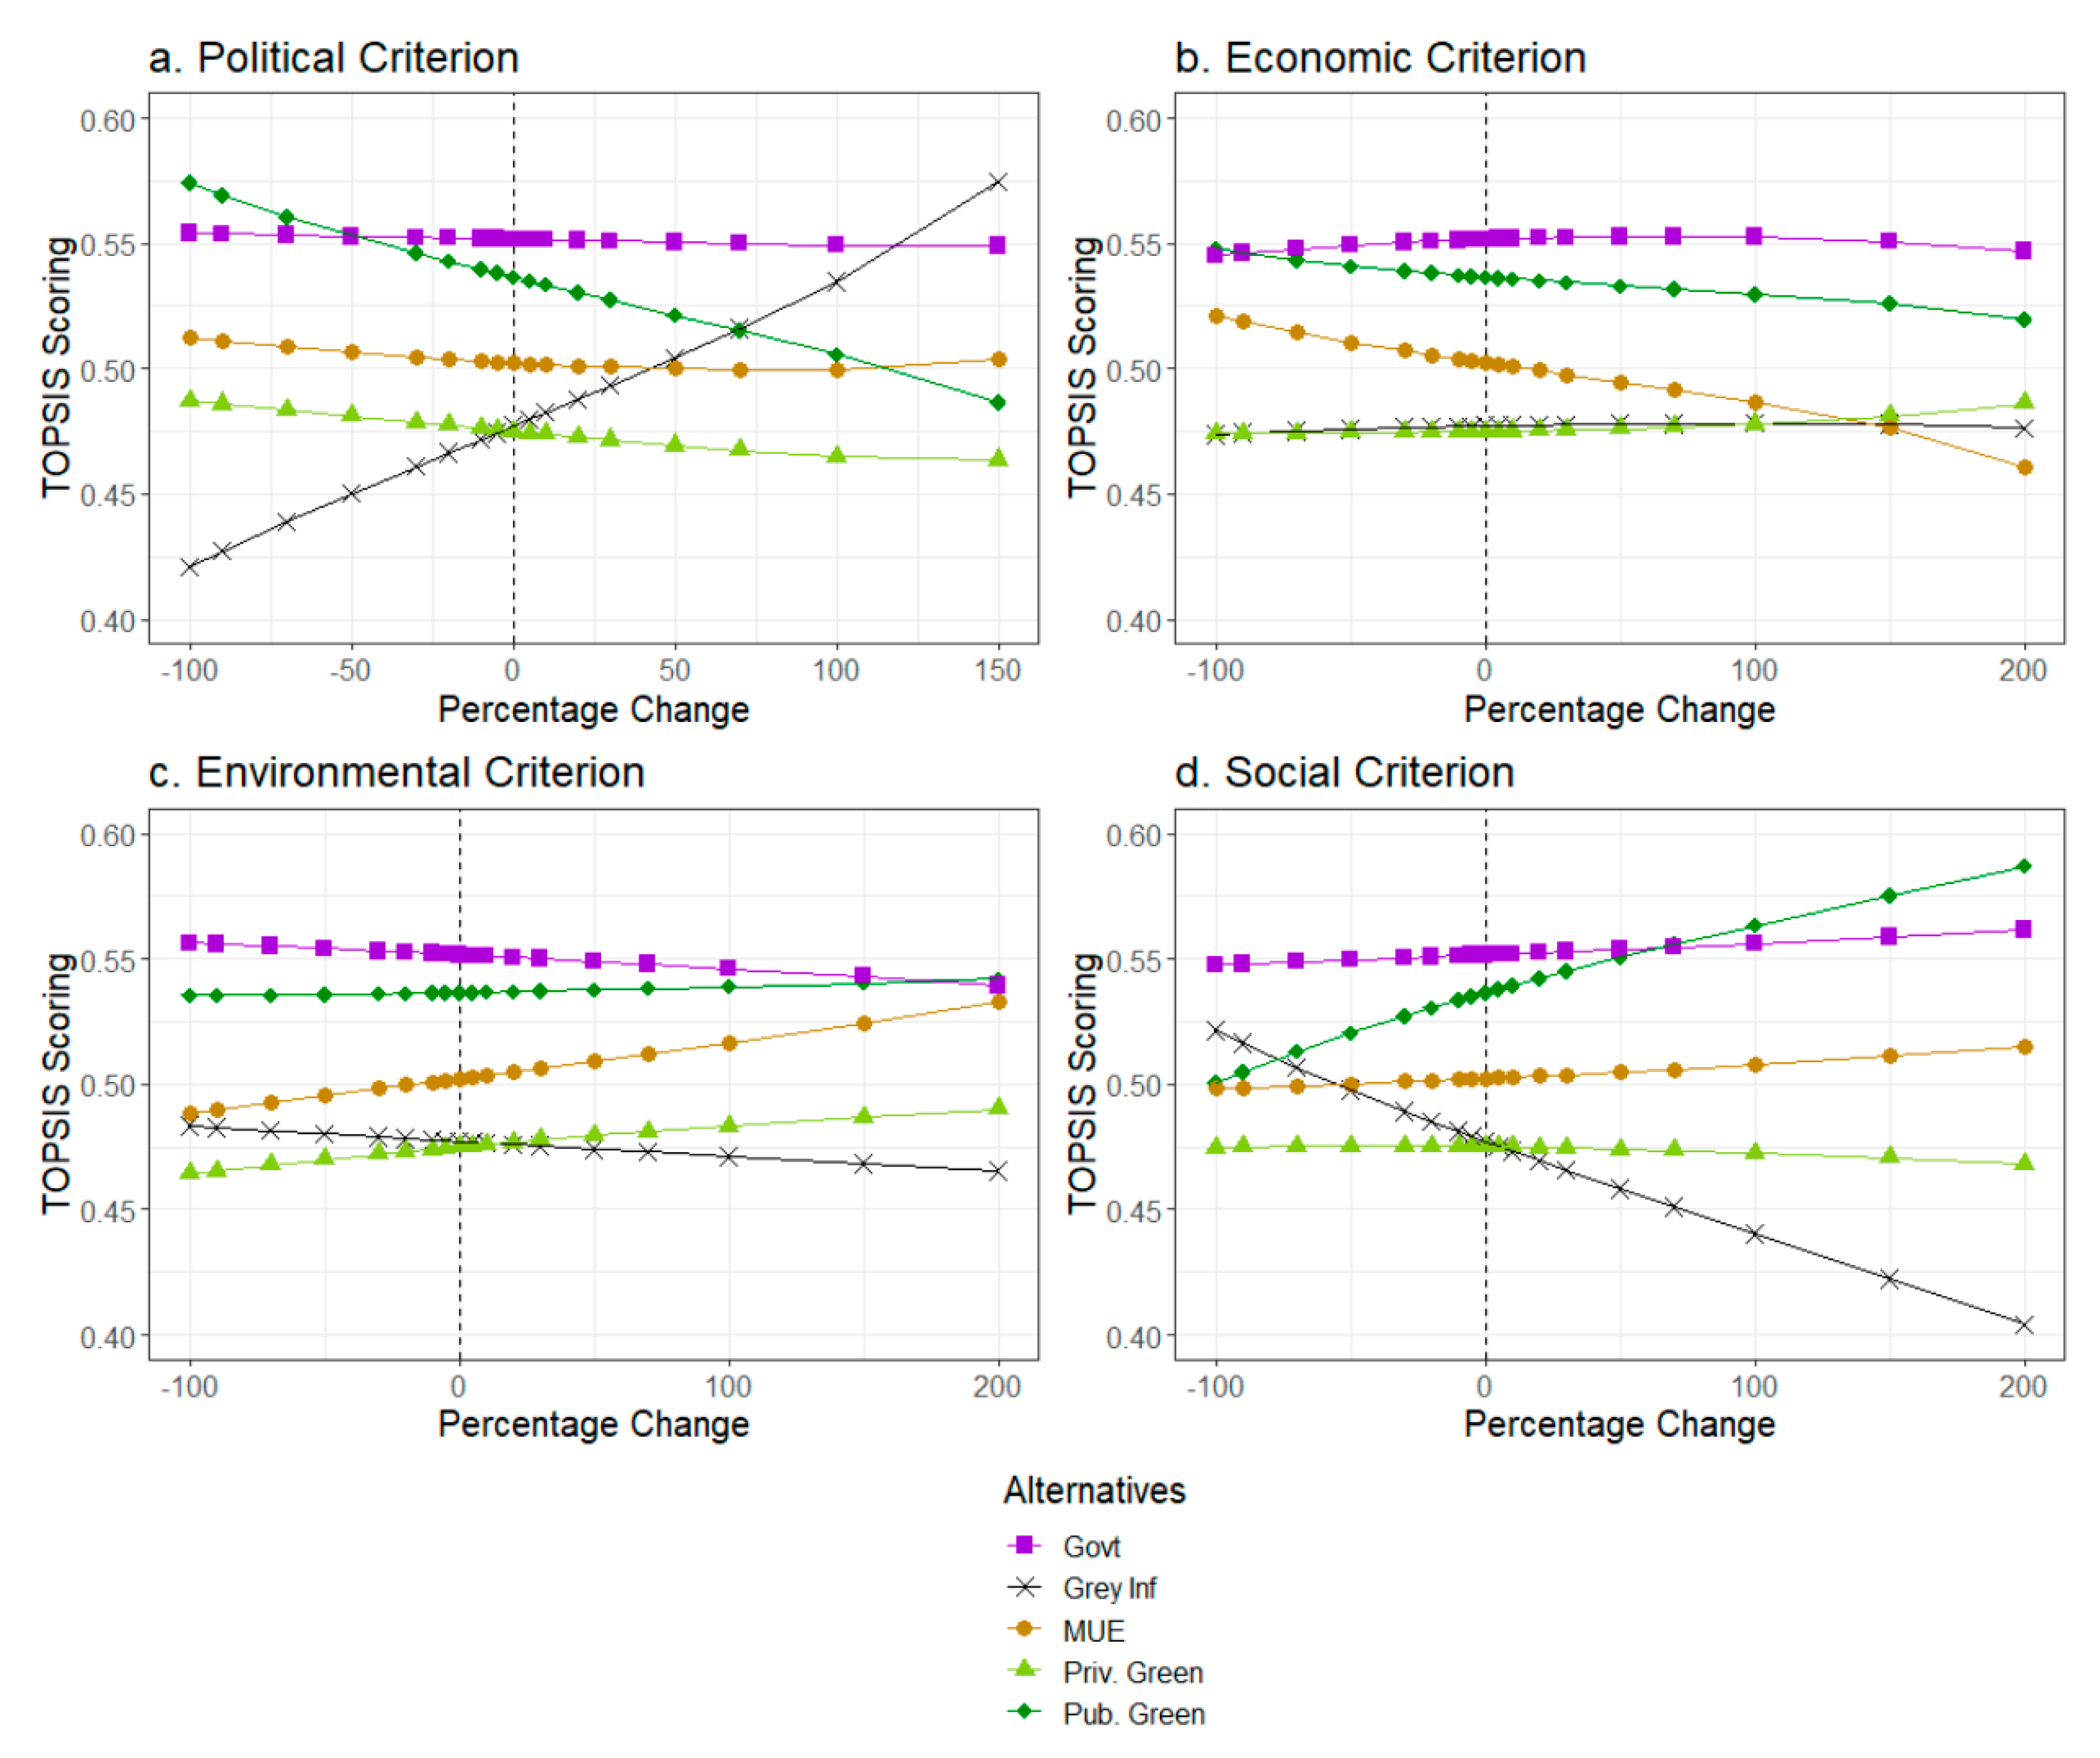
Advocacy and research are more aligned with each other in the final performance of the five alternatives (Table 5). Interestingly, despite there being an equal split between governance and non-governance participants, the ranking of the alternatives for the city overall is more aligned with the non-governance participants while governance holds more direct power in urban decision-making. Despite the frequent references to green infrastructure within stormwater and flood management discourses, only governance ranks it as the top alternative. Interestingly, governance does not place government streamlining as the top priority while the other groups do. While the alternatives are theoretically separate, the ranking of the full city indicates that securing good governance is often a desired first step before construction. Of note, while government streamlining places 4th for governance the variation between 1st and 4th position is smallest for governance indicating similar levels of alternative performance.
Grey infrastructure is another alternative of disagreement. While disliked by advocacy and research, governance provides grey infrastructure with a higher ranking. In practice, green infrastructure is not enough to handle the capacity of rain and stormwater so grey infrastructure is needed to supplement these solutions [91]. Therefore, the group responsible for implementing policy reflects a ranking focused on managing rainfall loads. Nonetheless, there is agreement among all participant groups that Private Green Infrastructure is not the best performing alternative. If governance were to implement policy based on this analysis, the other groups will not only be disappointed in the 1st position but upset at the focus on infrastructure over other softer alternatives.
The AHP-TOPSIS method again demonstrates how the differences in stakeholders can dramatically affect the policy decision. The method integrates competing voices highlighting where differences but also similarities arise. This is good for policy because local knowledge should be adapted into the decision-making framework [92]. This local expertise and environmental stewardship can bring unexpected and successful management strategies within the urban governance. Only by bringing together these policy perceptions can the differences truly be appreciated [93]. An impressive strength of this method is its ability to demonstrate these differences in quantitative terms while still providing the option to display them in visual and compelling ways. These data interpretation fits well within the quantitative-centric policy framework and engages non-experts and the public alike thus increasing transparency of the decision-making process. While there is unlikely to ever be full consensus between stakeholders, simply engaging with the process provides deeper appreciate and acceptance of policy.
By highlighting the differences, cities can also encourage behavioral changes around environmental issues by focusing on groups’ priorities and interests. By presenting environmental problems in relevant terms for a targeted audience, cities can influence urban behavior and directly engage fringe stakeholder groups who may have been excluded for the decision-making process [94]. This aids stakeholders who may lack the knowledge to make the decision but still exert varying levels of stewardship over the outcome. Inversely, minor stakeholders can also move governance toward their own goals by understanding how the existing system works underscoring that the social dimension of the city forms policy just as much as policy affects the social dimension [9]. The AHP-TOPSIS method provides exciting new ways for governance to enact more connected, localized and effective policy particularly within the complex dynamics of stormwater management.

4.4.3. Sensitivity

We tested the sensitivity of the four principal criteria for the entire aggregated city (Figure 4). For all four criteria, the top-ranking alternative, government streamlining, is relatively stable, first changing with the political criterion the weight is reduced around 50%. This demonstrates that the top-ranking alternative is unlikely to change with small adjustments in criteria weights. However, the sensitivity for the 4th and 5th ranked alternative is relatively high, with private green infrastructure and grey infrastructure overhauling swapping rankings with small percentage changes across all four criteria. Adjustments in the criteria weighting could influence a ranked policy strategy. The visualization of the sensitivity allows us to observe the relationship between the alternatives and criteria. Here, grey infrastructure is positively influenced by political bias but negatively by social bias. Policy-makers can reflect on how their decisions would have changed as the needs of the city vary through time allowing for deeper connections between present and future policies.

4.4.4. Limitations

This study does present some limitations. The worked example of examining stormwater management within NYC has not considered quantitative values attributed to the alternatives but rather relies on previous experience and perceptions. As not all stakeholders have extensive direct engagement with the stormwater decision-making process, some perceptions might be misrepresenting the reality of the alternatives. As the study has not focused on a specific site, we have only demonstrated the perceptions toward a preferred management instead of an actual preferred management. However, understanding what stakeholders perceive is useful in designing future site-specific studies to acknowledge that some management techniques should be excluded or emphasized.
The study has also not accounted for the geographic diversity within NYC. Where the stakeholders are located within the city and their previous experiences shape their responses. While this can provide us with generalized trends in NYC urban management it does not distinguish between the more and less flood susceptible neighborhood of the city.
While the study has presented the AHP-TOPSIS methodology as a user-friendly tool for policy decisions, there will always be some stakeholders who either choose not to engage with the methodology or are unable to process the methodology. While the concepts have been presented in a more general way, some of these can still pose a barrier to non-experts with the mathematical and computational prerequisites. It is recommended that an expert is always included in the use of the methodology. However, without oversimplifying the method, the way the study has presented the AHP-TOPSIS methodology has reduced the burden of complexity to engage non-expert and non-technical decision-makers with MCDA tools for decision-making.

5. Conclusions

The AHP-TOPSIS method is an effective aid for urban climate adaptation decision-makers. Building upon various aspects of the existing methodology we have combined a methodology that is effective at demonstrating differences between stakeholders. The results of the methodology, alongside the suggested sensitivity analysis, allow for simple yet engaging results encouraging the integration of the method within the existing policy framework. We have successfully presented an AHP-TOPSIS methodology that connects to the theoretical discussions of MCDA, allowing for decision-makers to understand the mechanics of the method, while still being accessible for a non-expert audience. Particularly for climate change, the method can incorporate uncertainty from many forms. Variations in climate projections, qualitative attributes, and uncertainty in personal judgements are all easily absorbed by this method. The approachability of the method for experts and non-experts alike encourages deeper stakeholder engagement with the decision-making process. A tool can only be effective if the users understand the nature of the tool.
The greatest strength of the method is to account for different stakeholder opinions while being easily adapted to local contexts. The method is responsive to the differences and similarities of different stakeholders and allows policy-makers to examine where these differences emerge, how local knowledge affects the results and to display these results in equal, quantitative terms. While stakeholder differences are well observed, the quantification of these differences connects the methodology with the existing focus on numerical decisions all while avoiding a reliance on monetary terms and incorporating emotional and qualitative judgements.
In our study in NYC, we demonstrated that not every participant prefers blue-green infrastructure for stormwater flood management, despite the alternative’s emergence as a priority in stormwater discourses. There is also disagreement over the importance of criteria between stakeholders in the city. This opens the possibility to further explore why these differences have emerged and how this will affect future stormwater policy within the city. Future work should incorporate tangible values to the alternatives to re-evaluate the ranking of the alternatives for specific policy implementation studies.
This method is contextually and geographically flexible, only requiring a shift in the framework of the decision. While presented for stormwater here, the method is adaptable for other urban adaptation problems cities face. Future work should explore how the method can be applied to these additional climate adaptation issues. The method is just one of the many policy tools available for urban climate adaptations. However, most of the traditional tools such as modelling rely on specialist knowledge exclusionary to many stakeholders engaged with policy. Future work should focus on identifying the tradeoffs between computational complexity and accuracy of the results from additional MCDA methods for climate adaptation and stormwater studies. Furthermore, future work should also consider providing more approachable descriptions of these additional methods so that policy-makers have a wider variety of tools to utilize.

Supplementary Materials

The following are available online at https://www.mdpi.com/article/10.3390/w13172422/s1. Equations (S1)–(S23): detailed equation sheet for the AHP-TOPSIS methodology. Survey user guide for participants: outline of the alternatives and criteria.

Author Contributions

Conceptualization, C.A.; methodology, C.A., S.G. and S.S.; formal analysis, C.A.; data curation, C.A.; writing—original draft preparation, C.A.; writing—review and editing, S.G., S.S.; supervision, S.G. and S.S. All authors have read and agreed to the published version of the manuscript.

Funding

This research received no external funding.

Institutional Review Board Statement

Ethics review and approval were waived for this study due to the non-sensitive and anonymous nature of the data collection and processing pursuant to national and institutional regulations.

Informed Consent Statement

Informed consent was obtained from all subjects involved in the study.

Data Availability Statement

Individual survey responses are unavailable due to confidentiality of the participants.

Acknowledgments

We acknowledge a doctoral stipend provided by Ca’ Foscari University of Venice.

Conflicts of Interest

The authors declare no conflict of interest.

Ethics Declaration

Pursuant to applicable regulations and institution protocol this study does not require an ethics board review. All participants were provided a data protection notice and all participants provided informed consent.

References

  1. Antrobus, D. Smart green cities: From modernization to resilience? Urban Pract. Res. 2011, 4, 207–214. [Google Scholar] [CrossRef]
  2. Qi, Y.; Chan, F.K.S.; Thorne, C.; O’Donnell, E.; Quagliolo, C.; Comino, E.; Pezzoli, A.; Li, L.; Griffiths, J.; Sang, Y.; et al. Addressing challenges of urban water management in Chinese sponge cities via nature-based solutions. Water 2020, 12, 2788. [Google Scholar] [CrossRef]
  3. Henstra, D.; Thistlethwaite, J.; Vanhooren, S. The governance of climate change adaptation: Stormwater management policy and practice. J. Environ. Plan. Manag. 2020, 63, 1077–1096. [Google Scholar] [CrossRef]
  4. Matthews, T.; Lo, A.Y.; Byrne, J.A. Reconceptualizing green infrastructure for climate change adaptation: Barriers to adoption and drivers for uptake by spatial planners. Landsc. Urban Plan. 2015, 138, 155–163. [Google Scholar] [CrossRef]
  5. Aylett, A. Institutionalizing the urban governance of climate change adaptation: Results of an international survey. Urban Clim. 2015, 14, 4–16. [Google Scholar] [CrossRef] [Green Version]
  6. Czako, V. Drowning the suburb: Settlement planning and climate change adaptation in a Hungarian metropolitan area. Urban Res. Pract. 2013, 6, 95–109. [Google Scholar] [CrossRef]
  7. Andre, K.; Simonsson, L.; Swartling, A.S.; Linner, B.-O. Method development for identifying and analyzing stakeholders in climate change adaptation processes. J. Environ. Policy Plan. 2012, 14, 243–261. [Google Scholar] [CrossRef]
  8. Gallo, E.M.; Bell, C.D.; Panos, C.L.; Smoith, S.M.; Hogue, T.S. Investigating tradeoffs of green to grey stormwater infrastructure using a planning-level decision support tool. Water 2020, 12, 5. [Google Scholar] [CrossRef]
  9. Torabi, E.; Dedekorkut-Howers, A.; Howes, M. A framework for using the concept of urban resilience in responding to climate-related disasters. Urban Res. Pract. 2021. [Google Scholar] [CrossRef]
  10. Axelsson, C.; Soriani, S.; Culligan, P.; Marcotullio, P. Urban policy adaptation toward managing increasing pluvial flooding events under climate change. J. Environ. Plan. Manag. 2020, 64, 1408–1427. [Google Scholar] [CrossRef]
  11. Pakfetrat, A.; Taghvaei, M.; Zarrabi, A. A comprehensive approach in green space site planning: An application of the three-stage multi-criteria decision support system. Urban Res. Pract. 2020, 13, 45–76. [Google Scholar] [CrossRef]
  12. Locatelli, L.; Guerrero, M.; Russo, B.; Martinez-Gomariz, E.; Sunyer, D.; Martinez, M. Socio-economic assessment of green infrastructure for climate change adaptation in the context of urban drainage planning. Sustainability 2020, 12, 3792. [Google Scholar] [CrossRef]
  13. Guarini, M.R.; Batisti, F.; Chiovitti, A. A methodology for the selection of multi-criteria decision analysis methods in real estate and land management processes. Sustainability 2018, 10, 507. [Google Scholar] [CrossRef] [Green Version]
  14. Velasquez, M.; Hester, P.T. An analysis of multi-criteria decision making methods. Int. J. Oper. Res. 2013, 10, 56–66. [Google Scholar]
  15. De Montis, A.; De Toro, P.; Droste-Franke, B.; Omann, I.; Stagl, S. Criteria for Quality Assessment of MCDA Methods. In Proceedings of the 3rd Biennial Conference of the European Society for Ecological Economics, Vienna, Austria, 3–6 May 2000. [Google Scholar]
  16. Guitouni, A.; Martel, J.M. Tentative guidelines to help choosing an appropriate MCDA method. Eur. J. Oper. Res. 1998, 109, 501–521. [Google Scholar] [CrossRef]
  17. Steele, K.; Carmel, Y.; Cross, J.; Wilcox, C. Uses and misuses of multicriteria decision analysis (MCDA) in environmental decision making. Risk Anal. 2009, 29, 26–33. [Google Scholar] [CrossRef]
  18. Saaty, T.L. The Analytic Hierarchy Process: Planning, Priority Setting, Resources Allocation; McGraw-Hill International: New York, NY, USA, 1980. [Google Scholar]
  19. Hwang, C.L.; Yoon, K. Multiple Attribute Decision Making: Methods and Applications; Springer: New York, NY, USA, 1981. [Google Scholar]
  20. Fedrizzi, M.; Giove, S. Incomplete pairwise comparison and consistency optimization. Eur. J. Oper. Res. 2007, 183, 303–313. [Google Scholar] [CrossRef] [Green Version]
  21. Fedrizzi, M.; Giove, S. Optimal sequencing in incomplete pairwise comparisons for large-dimensional problems. Int. J. Gen. Syst. 2013, 42, 366–375. [Google Scholar] [CrossRef]
  22. De Montis, A.; De Toro, P.; Droste-Franke, B.; Omann, I.; Stagl, S. Assessing the quality of different MCDA methods. In Alternatives for Environmental Valuation; Getzner, M., Spash, C.L., Stagl, S., Eds.; Routledge: London, UK, 2005; pp. 99–133. [Google Scholar]
  23. Saaty, T.L.; Ozdemir, M.S. Why the magic number seven plus or minus two. Math. Comput. Model. 2003, 38, 233–244. [Google Scholar] [CrossRef]
  24. Young, K.D.; Younous, T.; Dymond, R.L.; Kibler, D.F.; Lee, D.H. Application of the Analytic Hierarchy Process for selecting and modeling stormwater best management practcies. J. Contemp. Water Res. Educ. 2010, 146, 50–63. [Google Scholar] [CrossRef]
  25. Sahin, O.; Siems, R.; van Staden, R.; Jenkins, G. Decision dilemma in adapting stormwater systems to climate change: A tale of three cities. In Water Conservation: Practices, Challenges and Future Implications; Imteaz, M.A., Ed.; Nova Science: Hauppauge, NY, USA, 2013. [Google Scholar]
  26. Siems, R.; Sahin, O. Adapting water systems to climate change: A multi actor-multiple criteria decision analysis in South-East Queensland, Australia. IWTJ 2014, 4, 135–141. [Google Scholar]
  27. Ebrahimian, A.; Ardeshir, A.; Rad, I.Z.; Ghodsypour, S.H. Urban stormwater construction method selection using a hybrid multi-criteria approach. Autom. Constr. 2015, 58, 118–128. [Google Scholar] [CrossRef]
  28. Alhumaid, M.; Ghumman, A.R.; Haider, H.; Al-Salamah, I.S.; Ghazaw, Y.M. Sustainability evaluation framework of urban stormwater drainage options for arid environments using hydraulic modeling and multicriteria decision-making. Water 2018, 10, 581. [Google Scholar] [CrossRef] [Green Version]
  29. Kordana, S.; Slys, D. Decision criteria for the development of stormwater management system in Poland. Resources 2020, 9, 20. [Google Scholar] [CrossRef] [Green Version]
  30. Yu, Z.; Gan, H.; Xiao, M.; Huang, B.; Zhu, D.Z.; Zhang, Z.; Wang, H.; Lin, Y.; Hou, Y.; Peng, S.; et al. Performance of permeable pavement systems on stormwater permeability and pollutant removal. Environ. Sci. Pollut. Res. 2021, 28, 28571–28584. [Google Scholar] [CrossRef]
  31. Jayasooriya, V.M.; Muthukumaran, S.; Ng, A.W.M.; Perera, B.J.C. Multi Criteria Decision Making in selecting stormwater management green infrastructure for industrial areas part 2: A case study with TOPSIS. Water Resour. Manag. 2018, 32, 4297–4312. [Google Scholar] [CrossRef]
  32. Hager, J.K. An Integrated Planning Framework for Urban Stormwater Management: A One Water Approach; University of British Columbia: Vancouver, BC, Canada, 2019. [Google Scholar]
  33. Luan, B.; Yin, R.; Xu, P.; Wang, X.; Yang, X.; Zhang, L.; Tang, X. Evaluationg green stormwater infrastructure strategies efficiencies in a rapidly urbanizing catchment using SWMM-based TOPSIS. J. Clean. Prod. 2019, 223, 680–691. [Google Scholar] [CrossRef]
  34. Zeng, J.; Lin, G.; Huang, G. Evaluation of the cost-effectiveness of green infrastructure in climate change scenarios using TOPSIS. Urban For. Urban Green. 2021, 64, 127287. [Google Scholar] [CrossRef]
  35. Gogate, N.G.; Kalbar, P.P.; Raval, P.M. Assessment of the stormwater management options in urban contexts using multiple attribute decision making. J. Clean. Prod. 2017, 142, 2046–2059. [Google Scholar] [CrossRef]
  36. Moghadas, M.; Asadzadeh, A.; Vafeidis, A.; Fekete, A.; Kotter, T. A multi-criteria approach for assessing urban flood resilience in Tehran, Iran. Int. J. Disaster Risk Reduct. 2019, 35, 101069. [Google Scholar] [CrossRef]
  37. Ekmekcioglu, O.; Koc, K.; Ozger, M. Stakeholder perceptions in flood risk assessment: A hybrid fuzzy AHP-TOPSIS approach for Istanbul, Turkey. Int. J. Disaster Risk Reduct. 2021, 60, 102327. [Google Scholar] [CrossRef]
  38. Koc, K.; Ekmekcioglu, O.; Ozger, M. An integrated framework for the comprehensive evaluation of low impact development strategies. J. Environ. Manag. 2021, 294, 113023. [Google Scholar] [CrossRef] [PubMed]
  39. Wang, Y.-M.; Luo, Y. On rank reversal in decision analysis. Math. Comput. Model. 2009, 49, 1221–1229. [Google Scholar] [CrossRef]
  40. Belton, V.; Gear, T. On a short-coming of Saaty’s method of analytic hierarchies. Omega 1983, 11, 228–230. [Google Scholar] [CrossRef]
  41. Keshavarz-Ghorabee, M.; Amiri, M.; Zavadskas, E.K.; Turskis, Z.; Antucheviciene, J. A comparative analysis of the rank reversal phenomenon in the EDAS and TOPSIS methods. Econ. Comput. Cybern. Stud. Res. 2018, 52, 121–134. [Google Scholar]
  42. Garcia-Cascales, M.S.; Lamata, M.T. On rank reversal and TOPSIS method. Math. Comput. Model. 2012, 56, 123–132. [Google Scholar] [CrossRef]
  43. Fedrizzi, M.; Giove, S.; Predella, N. Rank reversal in the AHP with consistent judgement: A numerical study in single and group decision making. In Soft Computing Applications for Group Decision-making and Consensus Modelling; Collan, M., Kacprzyk, J., Eds.; Springer: Boston, MA, USA, 2018. [Google Scholar]
  44. Saaty, T.L.; Vargas, L.; Whitaker, R. Addressing with brevity criticism of the analytic hierarchy process. Int. J. Anal. Hierarchy Process 2009, 1, 2. [Google Scholar] [CrossRef]
  45. De FSM Russo, R.; Camanho, R. Criteria in AHP: A systematic review of literature. Procedia Comput. Sci. 2015, 55, 1123–1132. [Google Scholar] [CrossRef] [Green Version]
  46. Reed, M.S. Stakeholder participation for environmental management: A literature review. Biol. Conserv. 2008, 141, 2417–2431. [Google Scholar] [CrossRef]
  47. Reed, M.S.; Graves, A.; Dandy, N.; Posthumus, H.; Hubacek, K.; Morris, J.; Prell, C.; Quinn, C.H.; Stringer, L.C. Who’s in and why? A typology of stakeholder analysis methods for natural resources management. J. Environ. Manag. 2009, 90, 1933–1949. [Google Scholar] [CrossRef]
  48. Brugha, R.; Varvasovszky, Z. Stakeholder analysis: A review. Health Policy Plan. 2000, 15, 239–246. [Google Scholar] [CrossRef] [Green Version]
  49. Vogler, D.; Macey, S.; Sigouin, A. Stakeholder analysis in environmental and conservation planning. Lessons Conserv. 2017, 7, 5–16. [Google Scholar]
  50. Franek, J.; Kresta, A. Judgement scales and consistency measure in AHP. Procedia Econ. Financ. 2014, 12, 164–173. [Google Scholar] [CrossRef] [Green Version]
  51. Goepel, K.D. Comparison of judgement scales of the Analytical Hierarchy Process—A new approach. Int. J. Inf. Technol. Decis. Mak. 2019, 18, 445–463. [Google Scholar] [CrossRef] [Green Version]
  52. ISAHP. Judgement Scales of the Analytical Hierarchy Process—The Balanced Scale; ISAHP: Hong Kong, China, 2018. [Google Scholar]
  53. Zhang, Z.; Liu, X.; Yang, S. A note on the 1–9 scale and index scale in AHP. In Cutting-Edge Research Topics on Multiple Criteria Decision Making; Shi, Y., Wang, S., Peng, Y., Li, J., Zeng, Y., Eds.; Communications in Computer and Information Science; Springer: Berlin/Heidelberg, Germany, 2009; Volume 35. [Google Scholar]
  54. Saaty, T.L. Eigenvector and logarithmic least squares. Eur. J. Oper. Res. 1990, 48, 156–160. [Google Scholar] [CrossRef]
  55. Saaty, T.L.; Vargas, L.G. Comparison of eigenvalue, logarithmic least squares and least squares methods in estimating ratios. Math. Model. 1984, 5, 309–324. [Google Scholar] [CrossRef] [Green Version]
  56. Crawford, G.; Williams, C. A note on the analysis of subjective judgement matrices. J. Math. Psychol. 1985, 29, 387–405. [Google Scholar] [CrossRef]
  57. Barzilai, J. Notes on the Analytic Hierarchy Process. In Proceedings of the NSF Design and Manufacturing Research Conference, Tampa, FL, USA, 1–6 January 2001. [Google Scholar]
  58. Barzilai, J. Consistency measures for pairwise comparison matrices. J. Multi Criteria Decis. Analysis. 1998, 7, 123–132. [Google Scholar] [CrossRef]
  59. Barzilai, J. Deriving weights from pairwise comparison matrices. J. Oper. Res. Soc. 1997, 48, 1226–1232. [Google Scholar] [CrossRef]
  60. Barzilai, J.; Cook, W.D.; Golany, B. The Analytic Hierarchy Process: Structure of the Problem and Its Solutions. In Systems and Management Science by Extremal Methods; Phillips, F.Y., Rousseau, J.J., Eds.; Springer: Boston, MA, USA, 1992; pp. 361–371. [Google Scholar]
  61. Brunelli, M. Introduction to the Analytic Hierarchy Process; Springer: Berlin/Heidelberg, Germany, 2015. [Google Scholar] [CrossRef] [Green Version]
  62. Ishizaka, A. Development of an Intelligent Tutoring System for AHP (Analytic Hierarchy Process); University of Basel, Department of Business and Economics: Basel, Switzerland, 2004. [Google Scholar]
  63. Liu, Y.; Yang, L.; Jiang, W. Qualitative and quantitative analysis of the relationship between water pollution and economic growth: A case study in Nansi Lake catchment, China. Environ. Sci. Pollut. Res. 2020, 27, 4008–4020. [Google Scholar] [CrossRef]
  64. Zhang, Z.; Wang, W. Managing aquifer recharge with multi-source water to realize sustainable management of groundwater resources in Jinan, China. Environ. Sci. Pollut. Res. 2021, 28, 10872–10888. [Google Scholar] [CrossRef]
  65. Chuansheng, X.; Dapeng, D.; Shengping, H.; Xin, X.; Yingjie, C. Safety evaluations of smart grid based on AHP-Entropy method. Syst. Eng. Procedia 2012, 4, 203–209. [Google Scholar] [CrossRef] [Green Version]
  66. Al-Aomar, R. A combined AHP-Entropy method for deriving subjective and objective criteria weights. Int. J. Ind. Eng. 2010, 17, 12–24. [Google Scholar]
  67. Aguaron, J.; Moreno-Jimenez, J.M. The geometric consistency index: Approximated thresholds. Eur. J. Oper. Res. 2003, 147, 137–145. [Google Scholar] [CrossRef]
  68. Wedley, W.C. Consistency prediction for incomplete AHP matrices. Math. Comput. Model. 1993, 17, 151–161. [Google Scholar] [CrossRef]
  69. Farnia, L.; Giove, S. Fuzzy Measures and Experts’ Opinion Elicitation. In Advances in Neural Networks: Computational and Theoretical Issues: Smart Innovation, Systems and Technologies; Bassis, S., Esposito, A., Morabito, F., Eds.; Springer: Cham, Switzerland, 2015; Volume 37. [Google Scholar]
  70. Carmo, D.K.; Marins, F.A.; Salomon, V.A.P.; Mello, C.H. On the aggregation of individual priorities in incomplete hierarchies. In Proceedings of the International Symposium on the Analytic Hierarchy Process; ISAHP: Kuala Lumpur, Malaysia, 2013. [Google Scholar]
  71. Aragon, T.J. Deriving Criteria Weights for Health Decision Making: A Brief Tutorial; School of Public Health: Berkeley, CA, USA, 2017; Available online: https://escholarship.org/uc/item/52755837 (accessed on 20 July 2020).
  72. Ivanco, M.; Hou, G.; Michaeli, J. Sensitivity analysis method to address user disparities in the analytic hierarchy process. Expert Syst. Appl. 2017, 90, 111–126. [Google Scholar] [CrossRef]
  73. Saardchom, N. Expert judgement based scoring model. J. Bus. Econ. 2012, 3, 164–175. [Google Scholar] [CrossRef]
  74. Ossadnik, W.; Schinke, S.; Kaspar, R.H. Group aggregation techniques for analytic hierarchy process and analytic network process: A comparative analysis. Group Decis. Negot. 2016, 25, 421–457. [Google Scholar] [CrossRef] [Green Version]
  75. Forman, E.; Peniwati, K. Aggregating individual judgements and priorities with the analytic hierarchy process. Eur. J. Oper. Res. 1998, 108, 165–169. [Google Scholar] [CrossRef]
  76. Pauer, F.; Schmidt, K.; Babac, A.; Damm, K.; Frank, M.; von der Schulenburg, J.-M.G. Comparison of different approaches applied in Analytic Hierarchy Process- an example of information needs of patients with rare diseases. BMC Med. Inform. Decis. Mak. 2016, 16, 117. [Google Scholar] [CrossRef] [PubMed] [Green Version]
  77. Shih, H.-S.; Shyur, H.-J.; Lee, E.S. An extension of TOPSIS for group decision making. Math. Comput. Model. 2007, 45, 801–813. [Google Scholar] [CrossRef]
  78. Huang, Y.-S.; Li, W.-H. A study on aggregation of TOPSIS ideal solutions for group decision-making. Group Decis. Negot. 2012, 21, 461–473. [Google Scholar] [CrossRef]
  79. Erdogan, M.; Kaya, I. Prioritizing failures by using hybrid multi criteria decision making methodology with a real case application. Sustain. Cities Soc. 2019, 45, 117–130. [Google Scholar] [CrossRef]
  80. Vega, A.; Aguaron, J.; Garcia-Alcaraz, J.; Moreno-Jimenez, J.M. Notes on dependent attributes in TOPSIS. Procedia Comput. Sci. 2014, 31, 308–317. [Google Scholar] [CrossRef] [Green Version]
  81. Jiri, M. The robustness of TOPSIS results using sensitivity analysis based on weight tuning. In World Congress of Medical Physics and Biomedical Engineering; Lhotska, L., Sukupova, L., Lackovic, I., Ibbott, G., Eds.; Springer: Singapore, 2019. [Google Scholar]
  82. Li, P.; Qian, H.; Wu, J.; Chen, J. Sensitivity analysis of TOPSIS method in water quality assessment: I. Sensitivity to the parameter weights. Environ. Monit. Assess. 2013, 185, 2453–2461. [Google Scholar] [CrossRef] [PubMed]
  83. Song, J.Y.; Chung, E.-S. Robustness, uncertainty and sensitivity analyses of the TOPSIS method for quantitative climate change vulnerability: A case study of flood damage. Water Resour. Manag. 2016, 30, 4751–4771. [Google Scholar] [CrossRef]
  84. Gonzalez, J.E.; Ortiz, L.; Smith, B.K.; Devineni, N.; Colle, B.; Booth, J.F.; Ravindranath, A.; Rivera, L.; Horton, R.; Towey, K.; et al. New York City Panel on Climate Change 2019 Report Chapter 2: New Methods for Assessing Extreme Temperatures, Heavy Downpours, and Drought. Ann. N. Y. Acad. Sci. 2019, 1439, 30–70. [Google Scholar] [CrossRef] [Green Version]
  85. NYC Department of Environmental Protection. NYC Stormwater Management Program; NYC DEP: New York, NY, USA, 2019.
  86. NYC Department of Environmental Protection. Cloudburst Resiliency Planning Study: Executive Summary; NYC DEP: New York, NY, USA, 2017.
  87. Cappucci, M. Flooding rains keep hitting New York City. Another round is expected Monday night. The Washington Post, 12 July 2021. [Google Scholar]
  88. Mayne, R.; Green, D.; Guijt, I.; Walsh, M.; English, R.; Cairney, P. Using evidence to influence policy: Oxfam’s experience. Palgrave Commun. 2018, 4, 122. [Google Scholar] [CrossRef]
  89. Tabak, R.G.; Eyler, A.A.; Dodson, E.A.; Brownson, R.C. Accessing evidence to inform public health policy: A study to enhance advocacy. Public Health 2015, 129, 698–704. [Google Scholar] [CrossRef] [Green Version]
  90. Zoho ‘Survey’ Survey Software. 2021. Available online: https://www.zoho.com/ (accessed on 2 February 2021).
  91. Moore, T.L.; Gulliver, J.S.; Stack, L.; Simpson, M.H. Stormwater management and climate change: Vulnerability and capacity for adaptation in urban and suburban contexts. Clim. Chang. 2016, 138, 491–504. [Google Scholar] [CrossRef]
  92. Cloutier, G.; Joerin, F.; Dubois, C.; Labarthe, M.; Legay, C.; Viens, D. Planning adaptation based on local actors’ knowledge and participation: A climate governance experiment. Clim. Policy 2015, 15, 458–474. [Google Scholar] [CrossRef]
  93. Martinez-Juarez, P.; Chiabai, A.; Suarez, C.; Quiroga, S. Insights on urban and periurban adaptation strategies based on stakeholders’ perceptions on hard and soft responses to climate change. Sustainability 2019, 11, 647. [Google Scholar] [CrossRef] [Green Version]
  94. Garcia, R.A.; Aschenbrenner, M.; Durr, E.; Winder, G. Re-imagining cities as ecosystems: Environmental subject formation in Auckland and Mexico City. Urban Res. Pract. 2020. [Google Scholar] [CrossRef]
Figure 1. Stages of an MCDA analysis.
Water 13 02422 g001
Figure 2. An MCDA decision hierarchy.
Water 13 02422 g002
Figure 3. Results of a stakeholder analysis for NYC stormwater management regarding the initial placements of stakeholder categories and the final placement of stakeholder groupings from: (a,b) a green research infrastructure group, (c,d) an advocacy group, and (e,f) an activism group.
Water 13 02422 g003
Figure 4. The sensitivity analysis results of shifting the weight of a criterion and the resulting TOPSIS ranking of the alternatives for the (a) political, (b) economic, (c) environmental, and (d) social criterion with government streamlining (govt), grey infrastructure overhauls (grey inf), maintaining urban environments (MUE), private green infrastructure (priv. green), and public green infrastructure (pub. green).
Water 13 02422 g004
Table 1. Recent literature on the AHP and TOPSIS methodologies within stormwater management.
StudyYear PublishedDescription and Context
AHP
Young et al. [24]2010The use of AHP in identifying stormwater management strategies in an American local municipality
Sahin et al. [25]2013The use of AHP in identifying stormwater management strategies across councils in an Australian state
Siems and Sahin [26]2014The use of AHP in identifying stormwater management strategies across councils in an Australian state.
Ebrahimian et al. [27]2015The use of fuzzy AHP and compromise programing in stormwater collection systems in an Iranian urban context
Alhumaid et al. [28]2018The use of AHP and PROMETHEE II in stormwater drainage system management in a Saudi Arabian urban context
Kordana and Slys [29]2020The use of AHP to evaluate stormwater management strategies in at a building in a Polish context
Yu et al. [30]2021The use of AHP in identifying optimal permeable pavement types for stormwater management.
TOPSIS
Jayasooriya et al. [31]2018The use of TOPSIS to identify green infrastructure for stormwater management in industrial sites an Australian urban area
Hager [32]2019The use of fuzzy TOPSIS to examine optimal stormwater management strategies in a Canadian context.
Luan et al. [33]2019The use of TOPSIS to evaluate green infrastructure for stormwater in a Chinese sponge city
Zeng et al. [34]2021The use of TOPSIS to identify green infrastructure solutions for stormwater management in a Chinese smart city
AHP-TOPSIS
Gogate et al. [35]2017The use of AHP-TOPSIS to identify stormwater management alternative performances in an Indian urban area
Moghadas et al. [36]2019The use of AHP-TOPSIS to evaluate flood risk in an Iranian urban area
Ekmekcioglu et al. [37]2021Fuzzy AHP-TOPSIS for flood risk mapping in a Turkish municipalities
Koc et al. [38]2021Fuzzy AHP-TOPSIS for stormwater management in a Turkish urban watershed.
Table 2. Saaty (1980) linguistic and numeric scale for AHP.
Numeric ValueDescriptionReciprocal Value
1Equal Importance1
3Slight importance of one over another1/3
5Moderate importance of one over another1/5
7Very strong importance of one over another1/7
9Extreme importance of one over another1/9
2, 4, 6, 8Intermediate value1/2, 1/4, 1/6, 1/8
Table 3. Linguistic and numeric scale for TOPSIS.
Linguistic ValueNumerical Value
Very Low1
Low3
Moderate5
High7
Very High9
Table 4. The resulting criteria weights of the AHP in New York City stormwater management for the full city and by stakeholder grouping with cost criteria are emphasized in bold.
Main CriteriaFull CityAdvocacyResearchGovernance
Political0.3350.4010.1870.342
Economic0.3010.2800.2010.351
Environmental0.1820.1330.3350.170
Social0.1810.1870.2770.138
Sub-Criteria (global weights)
PoliticalExisting Legislative Framework0.0840.0950.0600.083
Project Feasibility0.1020.1650.0350.088
Jurisdiction0.0970.0860.0460.118
Implementation Time0.0520.0550.0460.052
EconomicPublic Costs0.1090.1000.0550.142
Private Costs0.0540.0540.0280.064
Funding Availability0.1040.0880.0880.115
Green Industry Growth0.0350.0380.0300.030
EnvironmentalStormwater Capacity0.0620.0290.1010.081
Stormwater Quality0.0570.0450.0580.050
Ecosystem Support0.0320.0360.0440.019
Energy Usage0.0310.0230.1320.019
SocialRisk to Human Health and Safety0.0710.0790.0650.053
Civic Engagement0.0290.0330.0490.019
Reducing Inequalities0.0400.0510.0490.025
Synergies with other Adaptations0.0420.0240.1130.040
Table 5. The resulting TOPSIS scoring and alternative ranking in New York City stormwater for the full city and stakeholder groupings. Each color represents one of the five policy alternatives.
Alternative RankingFull CityAdvocacyResearchGovernance
1Governmental Streamlining
0.552
Governmental Streamlining
0.604
Governmental Streamlining
0.615
Public Green Infrastructure
0.557
2Public Green Infrastructure
0.537
Public Green Infrastructure
0.523
Maintaining Urban Environments
0.557
Grey Infrastructure Overhauls
0.518
3Maintaining Urban Environments
0.502
Maintaining Urban Environments
0.473
Public Green Infrastructure
0.548
Maintaining Urban Environments
0.5082
4Grey Infrastructure Overhauls
0.477
Private Green Infrastructure
0.462
Private Green Infrastructure
0.483
Governmental Streamlining
0.5079
5Private Green Infrastructure
0.475
Grey Infrastructure Overhauls
0.457
Grey Infrastructure Overhauls
0.421
Private Green Infrastructure
0.457
Publisher’s Note: MDPI stays neutral with regard to jurisdictional claims in published maps and institutional affiliations.

