Article

Urban Pluvial Flood Management Part 2: Global Perceptions and Priorities in Urban Stormwater Adaptation Management and Policy Alternatives

1
Department of Economics, Ca’ Foscari University of Venice, 30121 Venice, Italy
2
College of Engineering, University of Notre Dame, Notre Dame, IN 46556, USA
*
Author to whom correspondence should be addressed.
Water 2021, 13(17), 2433; https://doi.org/10.3390/w13172433
Submission received: 10 July 2021 / Revised: 24 August 2021 / Accepted: 1 September 2021 / Published: 4 September 2021
(This article belongs to the Special Issue Blue-Green Cities for Urban Flood Resilience)

Abstract

:
Urban stormwater infrastructure is at an increased risk of being overwhelmed by pluvial flood events due to climate change. Currently, there are no global standards or frameworks for approaching urban rainfall adaptation policy. Such standards or frameworks would allow cities that have limited time, finances or research capacities to make more confident adaptation policy decisions based on a globally agreed theoretical basis. Additionally, while adaptation via blue-green infrastructure is often weighed against traditional grey infrastructure approaches, its choice must be considered within the context of additional policy alternatives involved in stormwater management. Using six global and developed cities, we explore to what extent a standardized hierarchy of urban rainfall adaptation techniques can be established through a combined Analytic Hierarchy Process (AHP) Technique for Order of Preference by Similarity to Ideal Solution (TOPSIS) Multi-Criteria Decision Analysis. While regional and stakeholder differences emerge, our study demonstrates that green infrastructure undertaken by public bodies are the top policy alternative across the cities and stakeholder groups, and that there exists some consensus on best management practice techniques for urban stormwater adaptation.

1. Introduction

Changing rainfall patterns are forcing cities to embrace climate adaptation strategies. High-intensity rainfall or cloudburst events, which are only projected to increase in urban areas under climate change, overwhelm city infrastructure causing localized flooding and potential environmental, financial and social damages [1,2]. Regardless of whether a city is retrofitting legacy existing infrastructure or implementing new systems to manage 21st century growth, the need to create rainfall adaptation projects that can be implemented under current stresses while planning for future variability is almost universal.
Stormwater adaptation needs to be flexible as over time, rainfall patterns and projections are highly dependent on climate mitigation efforts and the refinement of our climate models [3]. In addition, adaptation overall is not a means to protect and uphold our current existence from climate change in the form of disaster management, but rather provides us the tools to reorganize our existence to new climate realities [4].
Within stormwater management, blue–green infrastructure emerges as best management practice for handling rainfall [5]. Blue–green infrastructure mimics natural patterns of rainfall management by absorbing, filtering or delay-releasing rainfall volumes to the urban environment, oftentimes with a visual natural component, as compared to traditional grey concrete infrastructure focused on the removal of rainfall volumes. However, blue–green infrastructure is often regulated only for stormwater management while the ecological, economic, social and potential technological benefits of additional urban green spaces are relegated to co-benefits [6,7,8]. Conversely, climate adaptation techniques have complex and multi-faceted considerations.
There are no global uniform standards for climate adaptation, but cities are positioned as the centers of influence in this discussion. With the majority of the world being urban, paired with the emerging economic dominance of cities in the global economy, cities become representatives in coordinating climate action on a global scale [9]. In joining and networking within organizations such as C40 or CDP, cities engage in a global community to tackle urban climate issues while sharing local knowledge and strategies, which is moving urban adaptation closer to a coordinated international effort [10,11]. Urban policy on adaptation shapes global responses.
Increasing rainfall intensity is an urban issue, but who is influential in the adaptation decision-making process is less defined. Between those who make, enforce, advocate for or research adaptation strategies, there are multiple angles to evaluate stormwater adaptation. Furthermore, the impacts of pluvial flooding are dependent on urban geography and marginalized, minority or impoverished groups may be disproportionately located in geographically vulnerable neighborhoods [12,13]. Nonetheless, there is a balancing act between bringing in additional voices to strengthen policy without overwhelming the process and obscuring minority opinions [14,15].
Regardless of the complexities around urban stormwater adaptation, cities increasingly need to enact policy to combat rainfall extremes. In this study, we aim to establish the international trends in the preferences for climate-rainfall adaptation using six dynamic and international developed cities across North America, Europe and Australasia. By understanding the balance between policy uniformity and local characteristics, we present guidance for cities undertaking adaptation policy. This paper forms Part II of a two-part study on urban pluvial flood management.

2. Methodology

To understand the variations in stakeholder opinions on stormwater adaptation, this study employs a combined multi-criteria decision analysis (MCDA) methodology of the Analytic Hierarchy Process (AHP) [16] and the Technique for Order of Preference by Similarity to Ideal Solution (TOPSIS) [17]. Previously introduced in the corresponding Part I of this study [18], the proposed MCDA is made of four components: who is making the decision, what criteria influence the decision, how do the alternatives perform under these criteria and how sensitive are the results to variations. After first establishing the main parameters of the MCDA, the AHP, through pairwise comparisons, is used to determine the weight of each criterion in the process. Incorporating these weights, TOPSIS is used to determine the performance of each alternative so that they can be ranked, and a best performing solution can be selected.

2.1. Defining the Multi-Criteria Decision Analysis (MCDA)

The AHP and TOPSIS methodologies, alongside additional MCDA methods, such as Simple Additive Weighting (SAW), Multi-Attribute Utility Theory (MAUT), Preference Ranking Organization Method for Enrichment of Evaluations (PROMETHEE) and Elimination et Choix Traduisant la Realite (ELECTRE), have effectively been applied in decision-making regarding complex, quantitative, qualitative and also emotional situations regarding the environment [19,20]. MCDA methodologies allow for the decision maker to formalize these environmental decisions and visualize how the criteria and alternatives within the decision interact, while encouraging stakeholder participation and justifying the decision-making with quantifiable outputs. Within MCDA methods there are, additionally, various calculation approaches that decision-makers can chose to adopt, from setting different model parameters, applying fuzzy logic, aggregation techniques, weight elicitation methods, etc. Across the wide range of MCDA options available in environmental decision making, there is no hierarchy of MCDA methods, and no method is objectively the best [21,22,23]. Thus, in selecting an MCDA method, the decision-maker must consider their own expertise and experiences, the type of data available, the computational burden of performing the analysis, and those involved in the decision-making process.
The AHP, a linear model, can process a large volume of quantitative and qualitative indicators while deriving its scoring from direct stakeholder involvement. However, as it functions on pairwise comparisons, the methodology can become overwhelming as the volume of criteria and alternatives can increase the time and judgmental burden of completing all the pairwise comparisons. Therefore, with complex decisions involving a large amount of data, the AHP can be joined with an additional MCDA methodology. Here, we utilize the AHP to derive the weights of the decision criteria in urban stormwater management and combine it with TOPSIS to score the alternative choices. TOPSIS is a compensatory method that measures the distance to an idealized solution. In addition to reducing the computational burden, the method is built to analyze both cost and benefit criteria within the same structure, something which is particularly important to decisions regarding future adaptations to climate change.
The AHP-TOPSIS combination is not perfect and faces two main criticisms. First, the AHP faces problems of inconsistency influencing the decision. However, the method’s creator, Thomas Saaty, argues that the AHP is structured to handle some inconsistencies that stem from human judgements and if the inconsistency is monitored and managed, the issue is largely minimal [24]. Second, the phenomenon of rank reversal can occur in both methods [25,26,27]. As new or duplicate information is introduced to the decision, the ultimate ranking of the alternatives is subject to change. This phenomenon is largely a result of human inconsistencies in making judgements: ensuring the independence of all input criteria and alternative information can reduce the chance of rank reversal as well as by providing pre-established parameters, particularly in TOPSIS, if there are enough existing or previous studies to draw from.
Both the AHP and TOPSIS have legacy in urban policy and stormwater management and are thus familiar to existing governance structures. Table 1, taken from Part I in Axelsson et al. [18], highlights recent studies utilizing the AHP and TOPSIS methodologies in stormwater management. These studies cover a wide geographic range and focus on different spatial scales from individual sites to urban policy as well as regional and national contexts. Additionally, they focus on specific forms of adaptation or scale to evaluating multiple strategies. However, there exist three gaps in the literature. First, the studies are not intended for a non-technical audience, and therefore exclude many stakeholders from understanding the process and mechanics of the MCDA limiting their future uses in stormwater adaptation. Second, while the literature is normally focused on identifying a solution, it rarely focuses on differences that emerge between stakeholders during the process and how policy can address these differences, something which is important in urban stormwater management as many stakeholders are invested in the process. These first two gaps are addressed in Part I [18] where the AHP-TOPSIS method is demonstrated to be approachable for non-experts and effective at quantifying stakeholder differences.
Third, the existing literature predominantly focused on regional and local scales. However, cities around the world must adapt their stormwater systems to changing rainfall intensities. While the regional focus can account for local characteristics and knowledge, a global focus can identify the trends in management, potentially identifying a unified approach to urban stormwater adaptation. By focusing on the global scale, guidance can be created for a multitude of urban areas who will have to face increasingly difficult adaptation decisions in shorter periods of time with fewer financial resources.
Ultimately, the AHP-TOPSIS methodology has theoretical connections to discussions on MCDA for stormwater management yet is intuitive for non-experts, has a limited computational burden, incorporates qualitative and quantitative judgements important for environmental and social factors and is adaptable to local characteristics of a problem. By encouraging stakeholder participation, the method can quantify stakeholder differences and allow us to examine stormwater adaptation methods from a global perspective. For a summary of the technical mechanics of the AHP-TOPSIS methodology, please refer to Supplementary Materials.

2.2. City and Stakeholder Selection

This study selects New York City (NYC), Vancouver, Copenhagen, Amsterdam, Sydney (City of Sydney) and Auckland as six case cities to represent an international and developed snapshot of stakeholder opinions on stormwater adaptation. All six cities are global centers with strong economies, connections and research capacities providing them access to global adaptation discussions as representatives of their regions and nations. This representation also affords them to be held as case or comparison studies for other municipalities within their own region or on the global stage. Drawing upon sustainability index scores and from demographic-economic indicators, Axelsson et al. [5] previously analyzes these six cities together to establish the existing state of stormwater and rainfall adaptation management within their existing policy framework. These six cities are demonstratively actively pursuing adaptation policy to retrofit their post-industrial infrastructure systems and they represent varying levels of centralized governance within the three regions of North America, Europe and Australasia.
Within each city, this study incorporates stakeholders from three groups for the analysis: formal city governance, research and advocacy/conservancy. In a previous stakeholder analysis for NYC, Axelsson et al. [18] determined these three groups to be influential in the stormwater adaptation decision-making process. The importance of these three groups can be extended to all six cities as these categories represent three types of stakeholders in urban policy: those who make policy, those whose work supports policy and those who lobby policy. In every municipality, the basic function of governance and policy-making is crucial despite various levels of public expenditure on civil projects. Formal policies on stormwater management require governance, and in order to form such regulation, governance relies on informed research. This research can be undertaken internally or externally, but in cities with large research universities, there exists legacy partnerships between the governance and research systems. Furthermore, in a democratic city, advocates for policy can actively leverage their concerns through protests and the electoral process, thus guiding governance towards specific concerns. While each of these case-study cities may have additional and unique important stakeholder groups, these three groupings are universal across the cities and allow for comparisons between them. While other stakeholder groups such as ‘citizens’ can be considered universal, here this study is focused on stakeholders with experience in policy formation or the science of stormwater to make informed perceptive decisions on future management and adaptation. Thus, these three stakeholder groups are incorporated into the analysis.

2.3. Defining the Criteria

This study analyzes sixteen criteria as important to the urban rainfall adaptation decision-making process. The criteria are subsequently organized into four equal main criteria typologies: political, economic, environmental and social considerations (Table 2). Please refer to Supplementary Materials for a full description of the criteria. Axelsson et al. [18] previously applied these criteria within the context of NYC, while the criteria themselves we determined from the six cities’ existing policy documents. Here, we argue the universal justification of the criteria for the six cities as it is important that the criteria are relevant to the decision makers [21]. Additionally, we maintain a large scope of criteria to prevent the disenfranchisement of individuals important to the adaptation process [43].
Policy is a product of politics. With new climate adaptations, the ‘Existing Legislative Framework’ sets the foundation for the evolution of future projects. Within this evolution, political will is a driver of policy. However, for climate change, political systems need not only to be willing to implement policy changes but must themselves become resilient to climatic pressures as they strain the urban social network [44]. ‘Political Feasibility’ captures both this will to make policy change, but also the possibility to implement and manage change. This pairs with ‘Jurisdiction’ to cover the political limitations to policy management. Cities might be better positioned to transition towards adaptation and resiliency projects if there exists the political infrastructure to support environmental decisions [45]. Finally, ‘Implementation Time’ captures the urgency of adaptation but also the dynamics of short-term versus long-term political strategies. Ultimately, adaptation is always subject to political interpretations and needs [46]. However, politics alone does not capture the full extent of criteria.
Economically, rainfall adaptation presents both costs and future opportunities for cities. Firstly, the ‘Public Costs’ of adaptation born by the city and the ‘Private Costs’ of adaptation to individuals need to be evaluated. In addition to these costs, cities must evaluate the ‘Funding Availability’ for adaptation projects across various levels of governance and public–private partnerships. How a city finances green infrastructure can help determine how effective the project will be considering which design elements and co-benefits are prioritized [47]. The investments in adaptation projects can also simultaneously spur ‘Green Industry Growth’. With new technologies emerging, cities can take advantage and grow their industrial sectors while contributing to the green economy thus securing their competitive position in the global market [48].
Environmental criteria play a role in the discussion around rainfall management. ‘Stormwater Capacity’ is an initial criterion in rainfall management as it handles the total load of water. However, as traditional infrastructure and combined sewage systems can leak pollution to the environment, ‘Stormwater Quality’ emerges as an important consideration. ‘Ecosystem Support’ captures many of the ecological co-benefits and ecosystem services that are often difficult to quantify but still important in the decision-making process. Finally, with a continued focus on urban climate change mitigation, ‘Energy Usage’ directly ties the adaptation project back to emissions.
Socially, cities are framing adaptation projects to solve multiple urban issues. As with all urban projects involving infrastructure, cities are concerned with the ‘Risk to Human Health and Safety’ of a project. Yet, adaptation projects are not always understood, followed or cared for by the local population, so the level of ‘Civic Engagement’ is important to ensure projects become integrated into daily life. Additionally, adaptation projects are not always uniformly implemented across the city and as green infrastructure for stormwater management presents many co-benefits, rainfall adaptation becomes susceptible to urban inequalities. Wealthier areas receive higher levels of initial green infrastructure investments [49,50,51]. Green infrastructure is thus linked to environmental justice [52] and is captured by ‘Reducing Inequalities’. Finally, ‘Synergies with Other Adaptations’ connects the multi-criteria nature of stormwater adaptation projects to the climate as a system rather than disconnected issues.
All sixteen of the criteria shown in Table 1, as well as the four main criteria groupings that capture the range of priorities in urban climate rainfall adaptation. While each city may have additional concerns, these sixteen criteria represent universal concerns across the six cities and influence their policy making decisions.

2.4. Defining the Policy Alternatives

Building upon previous work in stormwater management, this study incorporates five policy alternatives important in future stormwater management across the six cities determined by Axelsson et al. [5]: Grey Infrastructure Overhauls, Public Green Infrastructure, Private Green Infrastructure, Government Streamlining and Maintaining Urban Environments. Firstly, Grey Infrastructure Overhauls describes the retrofitting and construction of traditional, concrete infrastructure. Conversely, Private Green Infrastructure and Public Green Infrastructure relate to the new green and green–blue systems cities can utilize and are differentiated by whether the infrastructural costs are covered by the municipality/public funding or by a private individual/business. The study refers to blue–green infrastructure under the umbrella term ‘green infrastructure’ to connect with the larger discussions around natural solutions in urban adaptation. Government Streamlining focuses on the reorganization of disjointed governmental departments for more integrated and cohesive management systems while increasing the transparency of these systems. The final alternative, Maintaining Urban Environments, ensures the existing urban stormwater system is running well while also capturing some softer management strategies such as volunteering, education campaigns and stewardship programs. While in practice these five alternatives are often used in tandem, here we discuss them as theoretically different policy options for implementation. Thus, we observe how each alternative, dependent on their own strengths and weaknesses, performs under the criteria weights to help determine if there is a universal hierarchy in preference towards the alternatives.
While several classifications of heavy precipitation exist, there is no uniform definition and here we do not define a threshold for heavy rainfall [3]. Rather, each of the study cities has existing thresholds and design guidelines for rainfall volumes in their respective regulations to which the existing and historical infrastructure has been built. These five alternatives that are the focus of this study are thus being discussed within each city as a response to exceeding city-based thresholds, regardless of the actual rainfall total. While we acknowledge that certain alternatives and strategies might not be sufficient if the magnitude of extreme precipitation exceeds expectations, these five policy alternatives still represent the strategies that all six cities wish to utilize for their expected increases in heavy rainfall events.

2.5. Data Collection

The data were collected over a three-month period from December 2020 to February 2021. Initial contacts were selected from the three stakeholder categories in the six cities. Following these initial contacts, additional participants were selected using a snowball method through their social and professional networks [53]. Participants were provided a description of the problem, criteria and alternatives and then asked to perform a survey where through linguistic judgements they would judge the criteria and the alternatives using Zoho Survey [54]. Participants were provided the opportunity to re-evaluate their judgements if inconsistencies were discovered during the analysis phase. A total of 34 participants out of 50 provided completed responses and are included in the analysis (Table 3). The full analysis was performed in seven groupings: the full participants, by stakeholder group (governance, advocacy and research) and by region (North America, Europe and Australasia).

3. Results and Discussion

The results of the study present a unique and quantitative picture of the preferences towards future urban rainfall adaptation across the six cities. In the preferences of the criteria and alternatives, key differences emerge between the groups, while, on the other hand, some level of consensus is achieved. Here, we discuss these differences as well as consensuses, and the implications this has on establishing an international framework for pluvial flood adaptation. Please refer to Supplementary Materials for raw data values.

3.1. Criteria Weights

The criteria weightings reveal that the priorities for rainfall adaptation share similarities between the stakeholders but lack uniformity. Of the 170 matrices produced for the AHP, only 30 matrices were excluded for containing an undesirable level of uncertainty. When examining the four main criteria across the seven analyses, the political criterion has the highest average weight of 32%, while the social criterion carries the lowest average weight at 19% (Table 4). Additionally, across the three regional analyses, the political and economic criteria exhibit higher priorities than the environmental and social criteria, which is reflected in the entire participant analysis. Despite the differences in regional histories and characteristics as well as the bias in the dataset towards participants from North America, the six cities converge on this similar criteria weight structuring. However, when the participants are separated by stakeholder type, differences arise between the criteria weights. These differences infer that the participant’s stakeholder typology is more influential in determining their criteria preferences than where the participant is located but that when the stakeholders within a city are aggregated together, these individual preferences merge into similar global trends, either similarly obscuring or smoothing the differences within the six cities.
The global criteria weightings of the sub-criteria, considering their parent criterion weight, exhibit similar trends to the main criteria. On average, 73% of the top half of the weighted sub-criteria across the seven analyses were either political or economic criteria. Nonetheless, the four highest average weighted sub-criteria were Project Feasibility (Political), Public Costs (Economic), Risk to Human Health and Safety (Social) and Stormwater Capacity (Environmental). While the focus of criteria weights overall is on the political and economic, certain aspects of social and environmental concerns outweigh the others. However, the capacity of infrastructure and the potential risk to human health and safety are traditional concerns in stormwater management and also urban infrastructure considerations, and they do not directly reflect the emerging focus on green solutions and their multi-dimensional benefits within urban climate adaptation policy.
The global weights of environmental and social sub-criteria are lower across the analyses. Particularly, Civic Engagement (Social), Reducing Urban Inequalities (Social), Energy Consumption (Environmental) and Green Industrial Growth (Economic) on average rank as the lowest criteria for urban rainfall adaptation. However, these four criteria capture a large part of the emerging focus of climate change policy. Landmark climate legislation proposals such as the American Green New Deal [55] explicitly discuss the importance of these criteria. Therefore, here we observe a disconnect between how climate change policy is theoretically discussed versus the perceptions of stakeholders involved in drafting and managing this policy in reality. This presents a barrier in implementing policy. For immediate threats, this disconnect can cause delays in action, while for long-term strategies, policy structured for past priorities might be unsuccessful in answering future demands. We do not advocate for which type of criteria should be presented as the most important, but rather we highlight the gap between theory and reality and that more work needs to be done to ensure that policy is responding to our criteria needs.
The observed criteria weights across the seven analyses are highly dependent on the criteria inputs themselves, and the weights may be subject to change. The addition of new criteria information could alter how the weightings unfold. While we capture some co-benefits of green technologies, we did not capture all co-benefits such as aesthetics and recreation as they go beyond the explicit scope of stormwater management [56]. How the decision-maker structures which criteria are included in the analysis can influence the weightings. However, because we initially organized the criteria into four main criteria groupings and these weights were also tested, we discover that overall, political and economic concerns continue to dominate the criteria weightings when compared to social and environmental considerations.

3.2. Alternative Rankings
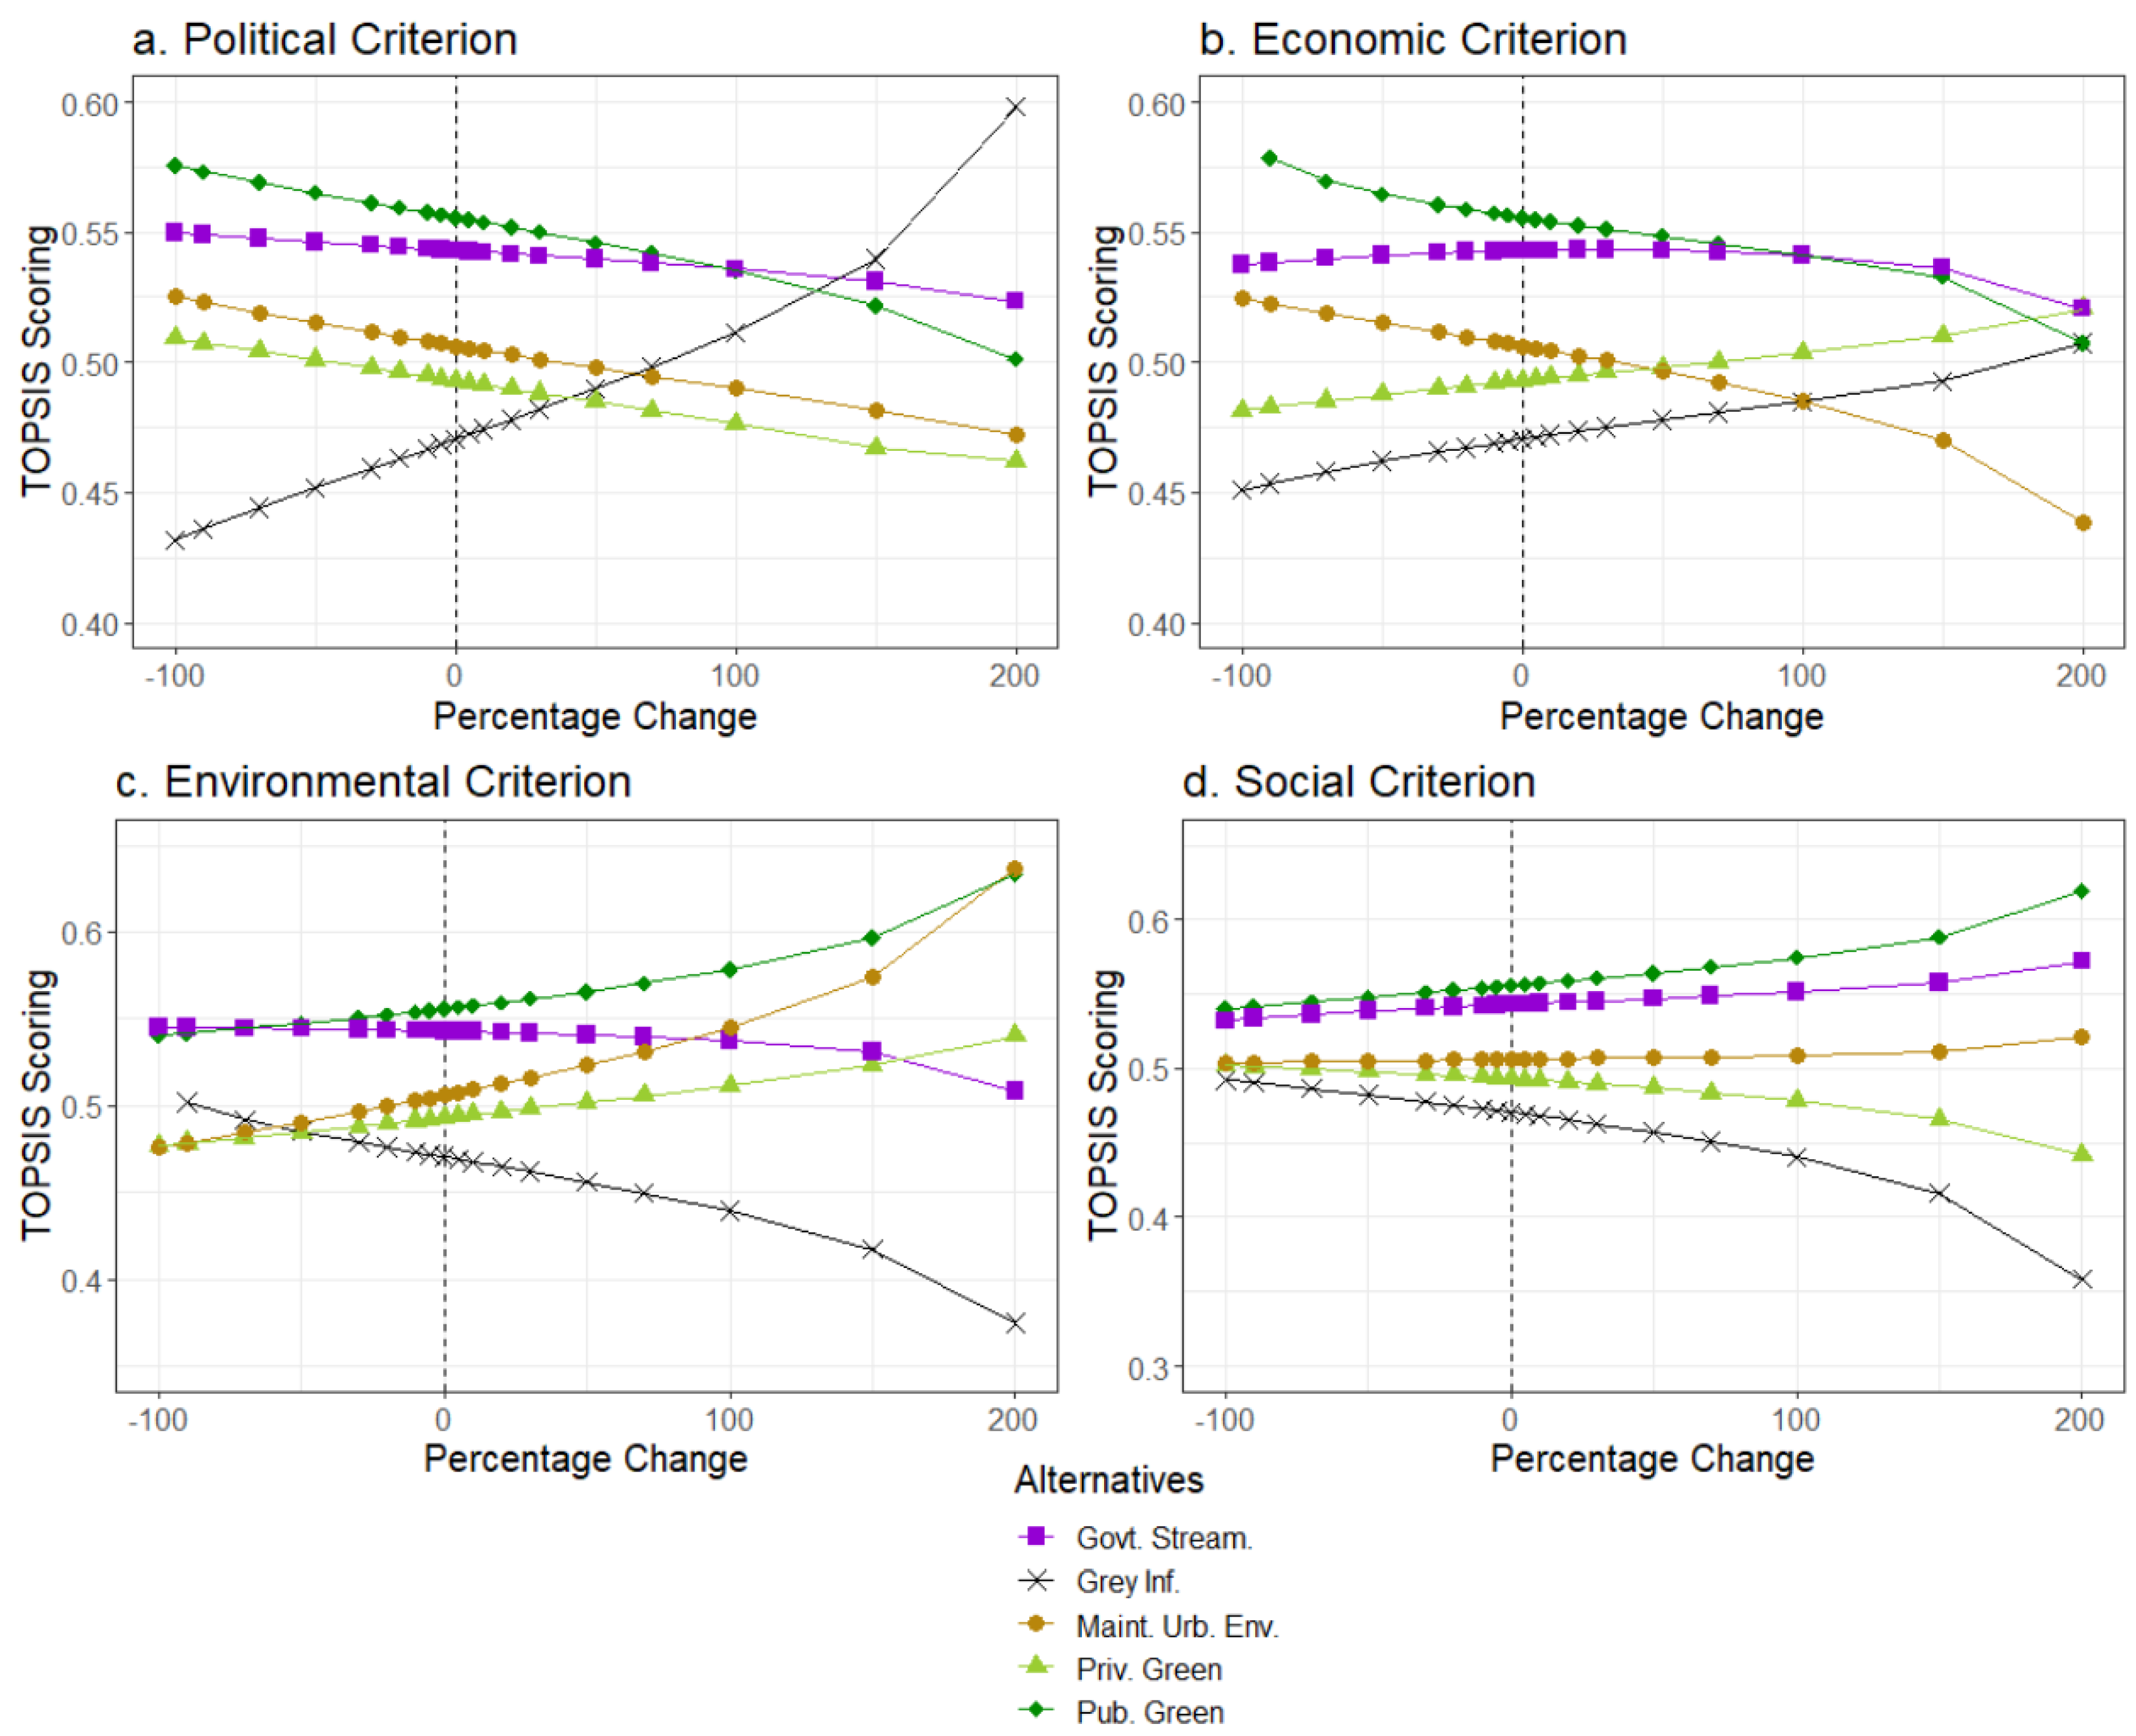
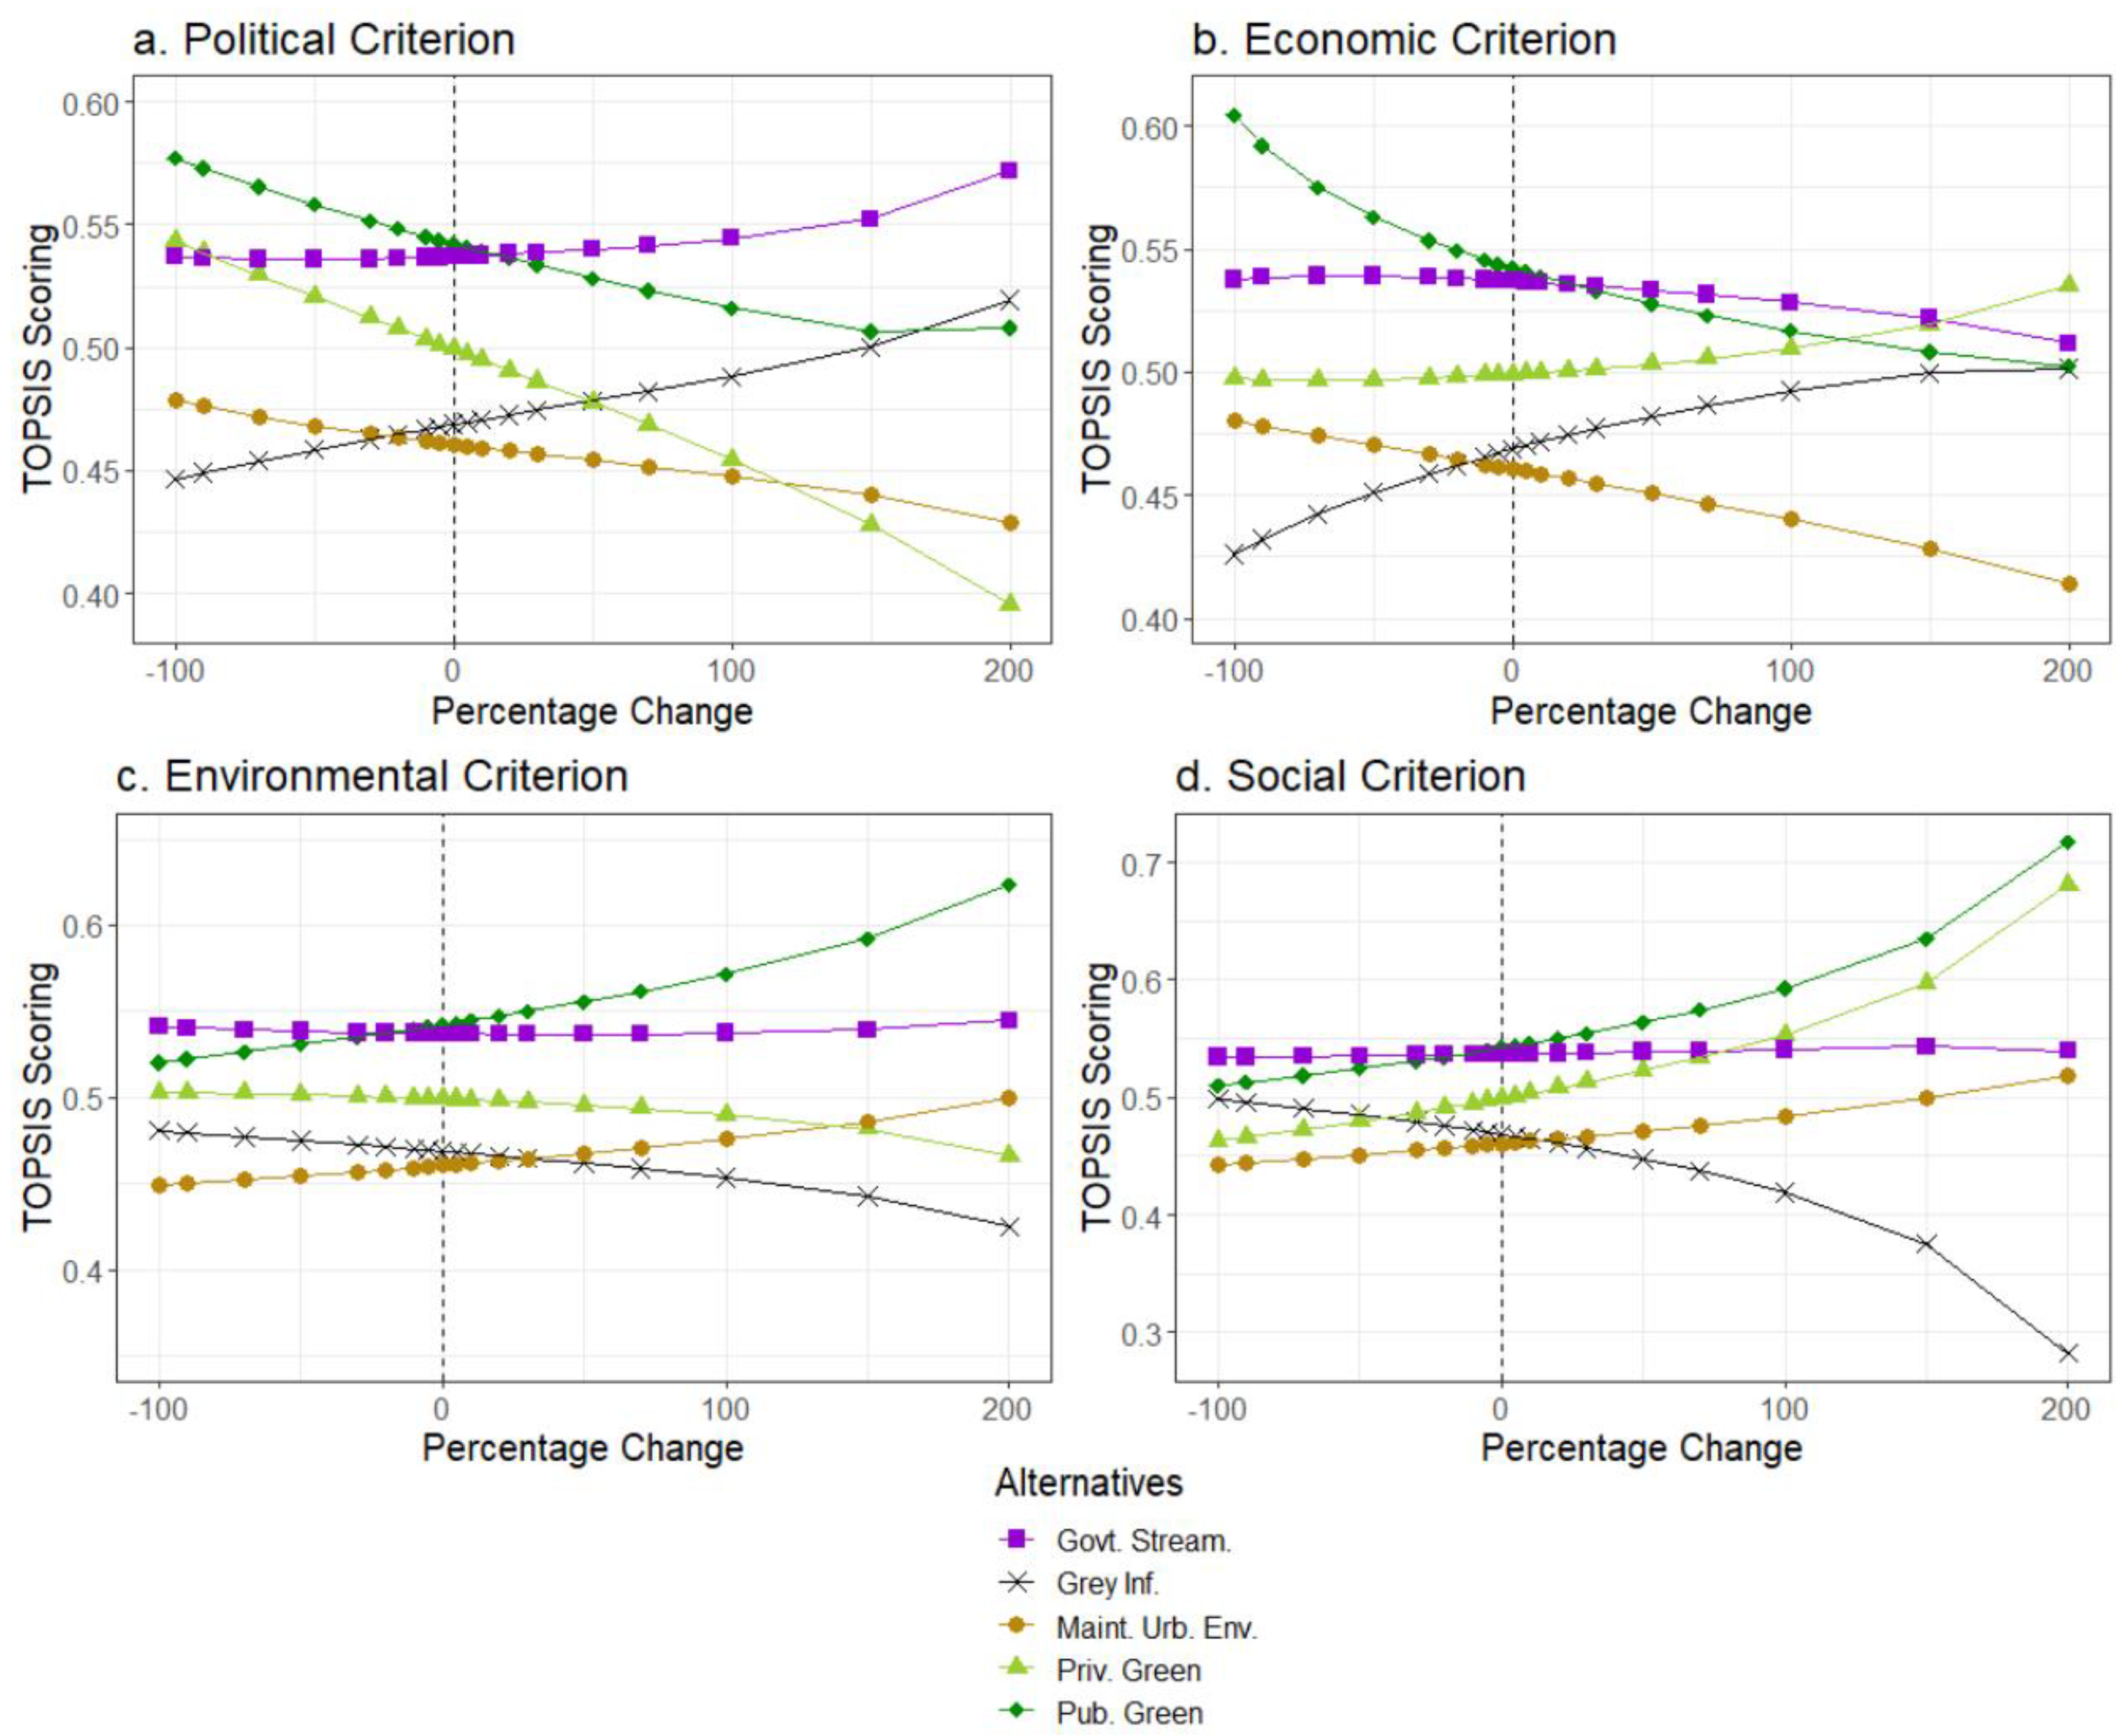
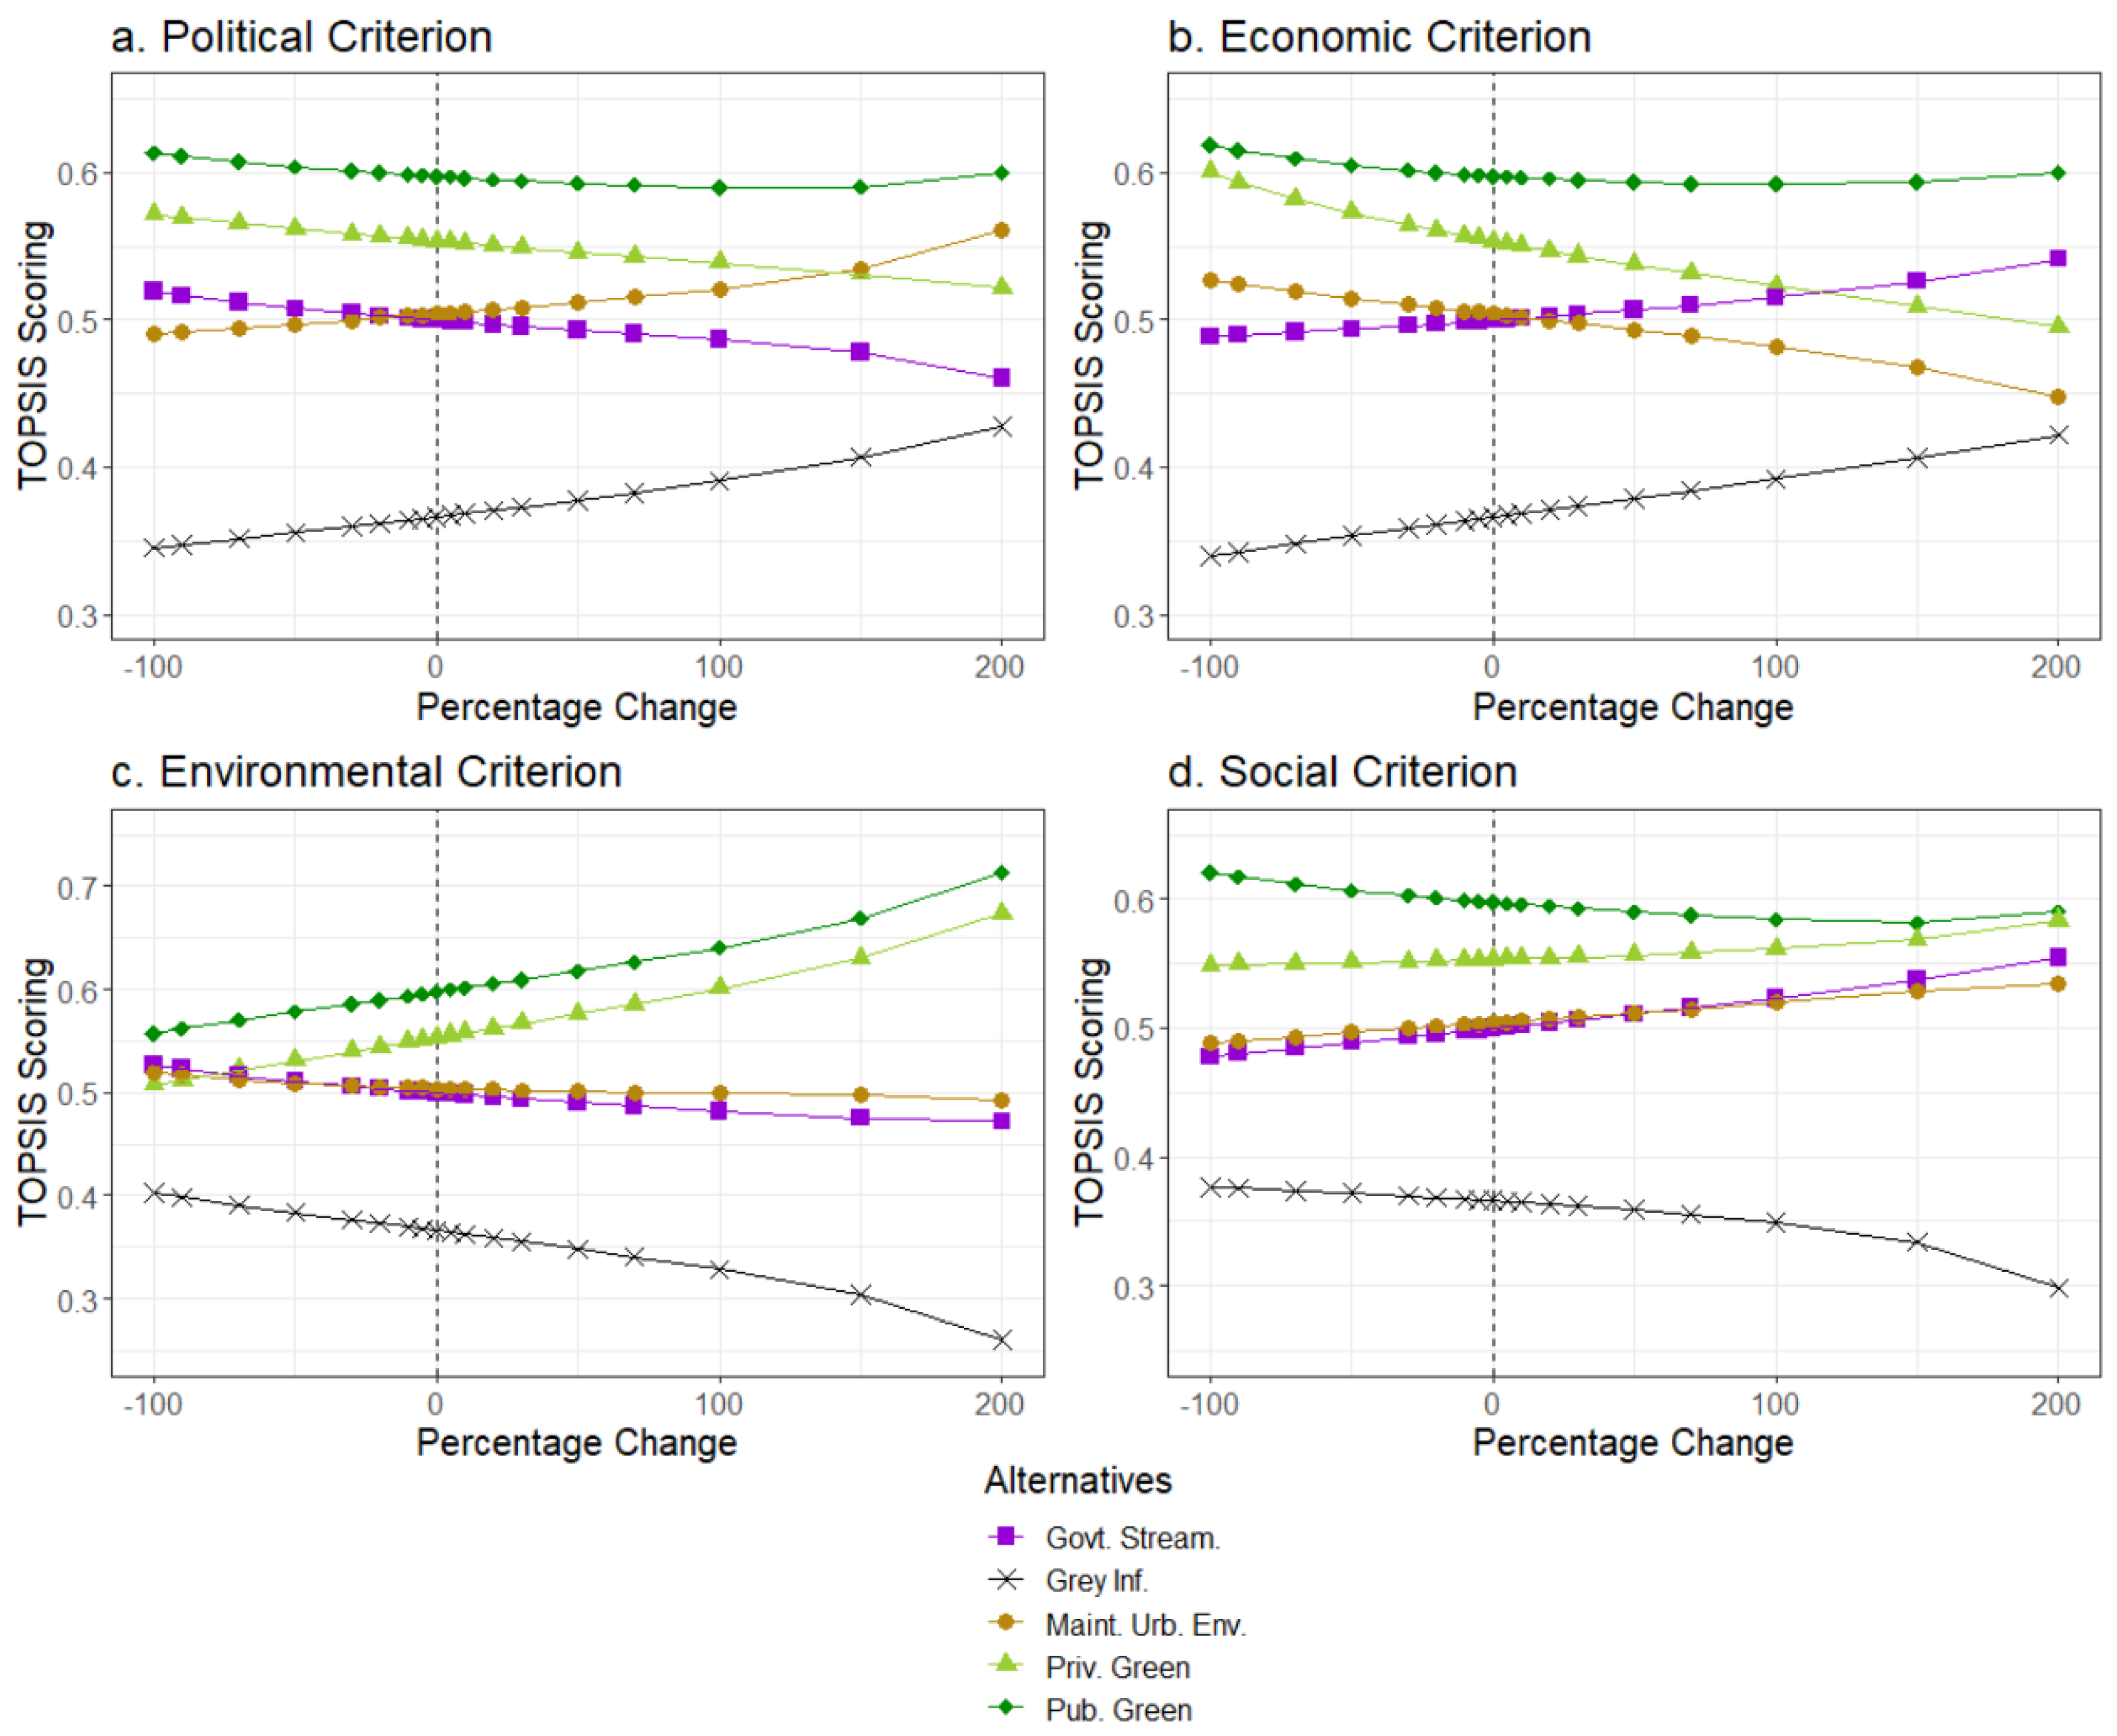
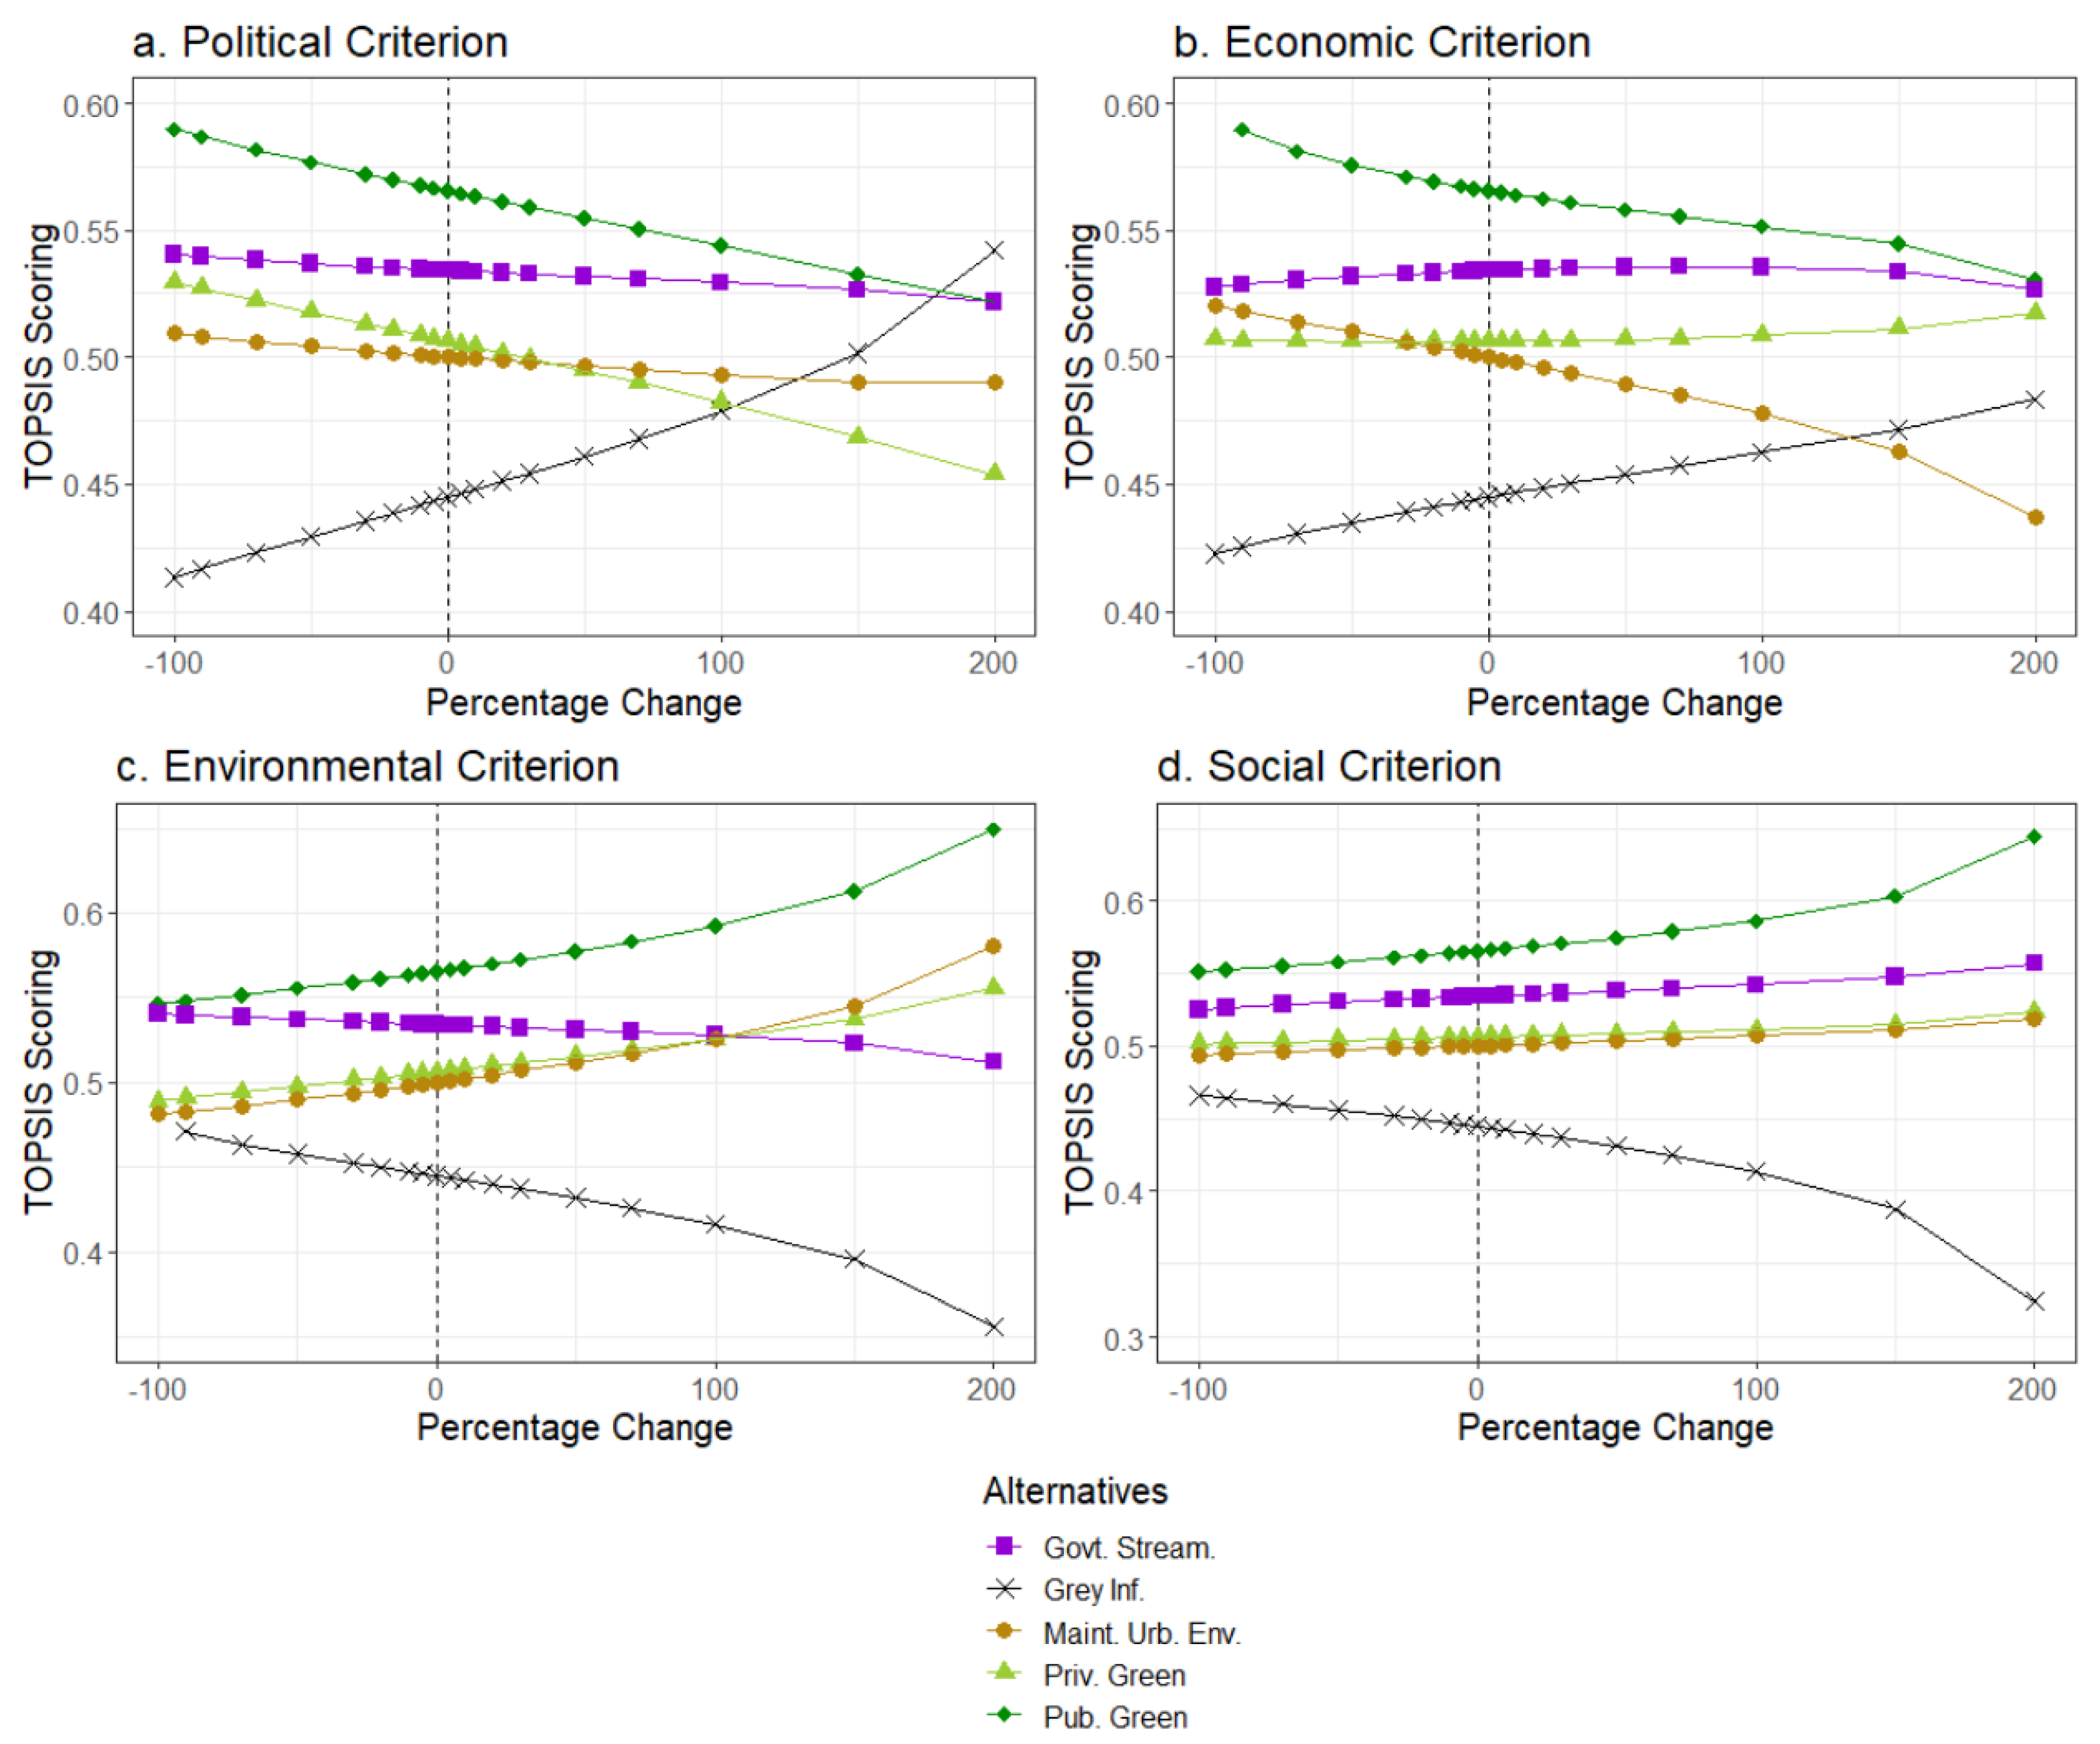
The performance of the five policy alternatives demonstrates mixed agreement between the stakeholders over the alternative preferences. For each analysis, public green infrastructure emerges as the most satisfactory alternative and in six of the seven analyses, government streamlining is ranked second, while grey infrastructure overhauls is the least satisfactory (Table 5). However, the range between these top and bottom performing alternatives is small: a TOPSIS score difference of around 0.13 on average. Additionally, the average score of every alternative was 0.51 or 51% satisfaction with no alternative breaking 60%. No alternative presents itself significantly more satisfactory over the others and the alternatives’ scores are clustered together. Nonetheless, the trends in the overall ranking of the alternatives does reveal that preferences exist within the participants.
Unlike the criteria weightings, there is more agreement between the stakeholder groupings in the ranking of the alternatives, the only difference being within the governance group where the 3rd and 4th alternative position shift compared to advocacy and research. Despite the disagreements over what criteria are important in evaluating the urban rainfall adaptation process, governance, advocacy and research reach similar conclusions about which alternative best answers these needs. Therefore, while there is disagreement over the decision-making process between the groups, the outcome is likely to satisfy their competing interests. This is encouraging for rainfall management as these disagreements might not prevent dissatisfaction with policy itself, allowing for immediate decisions to be made while discussions continue about how to formulate future policy.
When organized by region, stronger differences arise between the stakeholders. Despite having similar criteria weightings, the three regions exhibit different alternative rankings. Considering the larger volume of responses from North America, public green infrastructures nonetheless continues as the highest ranked alternative across the three regions. Policy makers and governments tend to prefer highly visible infrastructure projects as they convey action and are demonstratable projects during election cycles [4]. Paired with the focus on a greener city, stakeholders may be conditioned to this alternative designating it a favorable TOPSIS score. However, grey infrastructure is also a large and visible infrastructure intervention that can be better at handling pure stormwater capacity [57,58]. Green infrastructure alone might not be able to manage an entire city’s stormwater strategy [59,60]. Additionally, cities have the existing skillset and budgetary framework to quickly implement grey infrastructure, yet the regions do not universally prefer it. Green infrastructure continues to emerge as a best management practice for stormwater and the regions prefer this alternative. While the criteria weights do not reflect the current discourses on climate change legislation, the alternative rankings capture these emerging preferences.
Considering green infrastructure, the satisfaction level of private green infrastructure varies across North America, Europe and Australasia. More decentralized governance systems are better optimized to handle private and individual investments and here we observe that North America, with the least decentralization, shows less preference for these investments [61]. The variation in private green infrastructure also disconnects from the theory of stormwater management, especially strategies with a focus on public green infrastructure, as the private investments help close the gaps within the urban green system [1]. However, private green investments are more difficult to regulate than public strategies and come with additional barriers to implementation within the general population from differences in knowledge, backgrounds and experience [62]. The active stakeholders may be influenced with their previous engagement with private initiatives. Nonetheless, while the alternatives here are each presented as unique and separate policy strategies, one would expect that private green infrastructure would be reflected with the high preference placed on public green infrastructure to create a comprehensive citywide blue-green network.
The analysis shows there is consensus on the most optimal strategy focusing on public green infrastructure projects, with the least optimal being grey infrastructure in most cases, which is supported by the best practice literature of moving from grey to green solutions for water management. Government streamlining also emerges as a near-consistent second-ranked alternative which underscores the need for good governance to be able to tackle emerging climate adaptation problems. However, differences in the rankings emerge in the regional TOPSIS analyses, demonstrating that there is not an internationally agreed upon hierarchy of adaptation strategies. The question for each city then becomes which additional policies best support this green and blue–green infrastructure. The other four alternatives can each be paired with public green infrastructure, but local knowledge and characteristics play a role in determining the strategy which is reflected through the criteria weights and alternative scores. Therefore, we propose moving to incorporate a loose framework over a strict international guideline to foster the development and support of green and blue–green infrastructure over grey infrastructure as a principal solution as this approach allows for flexibility for supporting adaptation alternatives while providing a guidance basis to pull resources together and give cities confidence in their decision-making.

3.3. Sensitivity

In the sensitivity analyses, we explore the stability of the TOPSIS scores across the three geographic regions and the full dataset by examining the changes in criteria weighting to the four main criteria. We focus on the regions as they share similar criteria weight structures but differing alternative score hierarchies. In the four sensitivity analyses, the TOPSIS scoring remains relatively stable, but is still subject to changes. North America presents the least sensitive results considering any of the alternative rankings across the criteria weight changes (Figure 1). While the rankings do change, they do not occur until at larger criteria percentage changes around ±50%. The European region demonstrates the most sensitive criteria considering the top ranked alternative with weight changes of the criteria between −20 to +30% altering the position of public green infrastructure (Figure 2). The shift in the first and second ranking are more a response of public green infrastructure to the criteria weight adjustment than government streamlining.
In Europe (Figure 2) and Australasia (Figure 3), six alternative positions changes within the same criteria weight change of ±10–20%: 1st and 2nd for European political, environmental and social, fourth and fifth for European social and third and fourth for Australasian political and economic. While these shifts do not occur at the smallest percentage shift ranges (>5%), the concentration of rank changing at low percentages indicates that while small individual shifts in perceptions will unlikely change the result, mild adjustments in attitudes or collective shifts can alter the final performance of the alternatives. When all the participants are aggregated together, the sensitivity is more muted (Figure 4). This indicates that a global, uniform adaptation guideline may mask the specific dynamics of a region, also considering the dataset is skewed towards the least sensitive North American region and supports the idea of a loose framework that is adaptable to local characteristics. These sensitivity results further indicate that public green infrastructure remains a relatively strong, top-performing alternative but the sensitivity of all the alternatives at low-weight percentage changes makes it difficult to present a fully structured alternative hierarchy as small changes in input information or additional stakeholders might shift the position of the five alternatives.

4. Conclusions

In this study, we have identified four major trends in the perceptions of future stormwater management under climate change.
First, our study demonstrates that the emerging theoretical focus on ecological, social and new economic criteria within climate change management are still underweighted compared to the traditional political, cost-based and quantitative importance of policy management. The consequences of these different approaches in policy can hinder the ability to push through much needed climate change legislation and increase dissatisfaction with the policy system.
Second, we find that principally, public green infrastructure is the preferred alternative to manage future rainfall and pluvial flood adaptation projects across the six cities we studied despite differences in criteria weightings. This finding coincides with green infrastructure emerging as a best management practice tool for stormwater management in existing urban policy discussions.
Third, grey infrastructure is nearly universally the least-preferred adaptation method. Again, this counters the theoretical discussions on stormwater management where grey infrastructure is frequently acknowledged as being necessary in future adaptation projects.
Fourth, there is a lack of uniformity in the alternative rankings when the cities are organized by region. Therefore, our findings support that a loose international framework can be established prioritizing public green infrastructure, but that local knowledge and regional considerations retains an important role in adaptation so that a full international hierarchy standard cannot be adopted.

Supplementary Materials

The following are available online at https://www.mdpi.com/article/10.3390/w13172433/s1, Supplementary Material file S1: Overview summary of the technical AHP-TOPSIS methodology; Supplementary Material file S2: Table S1: Group aggregated by consistency main criteria weights (non-normalized) for the participants derived from the AHP, Table S2: Group aggregated by consistency sub-criteria weights (non-normalized) for the participants derived from the AHP, Table S3: Group aggregated TOPSIS distance from ideal positive ( S + ) and negative ( S ) solution and closeness coefficient ( C * ) of the policy alternatives; Supplementary Material file S3: Survey user guide for participants.

Author Contributions

Conceptualization, all authors; Methodology, C.A., S.G. and S.S.; Formal Analysis, C.A.; Data Curation, C.A. and P.J.C.; Writing—Original Draft Preparation, C.A.; Writing—Review and Editing, S.G., S.S. and P.J.C.; Supervision, S.G. and S.S. All authors have read and agreed to the published version of the manuscript.

Funding

This research received no external funding.

Institutional Review Board Statement

Ethics review and approval were waived for this study due to the non-sensitive and anonymous nature of the data collection and processing pursuant to all national and institutional regulations.

Informed Consent Statement

Informed consent was obtained from all subjects involved in the study.

Data Availability Statement

Individual survey responses are unavailable due to confidentiality of the participants.

Acknowledgments

We acknowledge a doctoral stipend provided by Ca’ Foscari University of Venice.

Conflicts of Interest

The authors declare no conflict of interest.

References

  1. Rosenzweig, B.; Ruddell, B.L.; McPhillips, L.; Hobbins, R.; McPhearson, T.; Cheng, Z.; Chang, H.; Kim, Y. Developing knowledge systems for urban resilience to cloudburst rain events. Environ. Sci. Policy 2019, 99, 150–159. [Google Scholar] [CrossRef]
  2. Donat, M.H.; Lowry, A.L.; Alexander, L.V.; O’Gorman, P.A.; Maher, N. More Extreme Precipitation in the World’s Dry and Wet Regions. Nat. Clim. Chang. 2016, 6, 508–513. [Google Scholar] [CrossRef]
  3. Collins, M.; Knutti, R.; Arblaster, J.; Dufresne, J.-L.; Fichefet, T.; Friedlingstein, P.; Gao, X.; Gutowski, W.J.; Johns, T.; Krinner, G.; et al. Long-term Climate Change: Projections, Commitments and Irreversibility. In Climate Change 2013: The Physical Science Basis. Contribution of Working Group I to the Fifth Assessment Report of the Intergovernmental Panel on Climate Change; Stocker, T.F., Qin, D., Plattner, G.-K., Tignor, M., Allen, S.K., Boschung, J., Nauels, A., Xia, Y., Bex, V., Midgley, P.M., Eds.; Cambridge University Press: Cambridge, UK, 2013. [Google Scholar]
  4. Dilsak, N.; Prakash, A. The politics of climate change adaptation. Annu. Rev. Environ. Resour. 2018, 43, 317–341. [Google Scholar] [CrossRef] [Green Version]
  5. Axelsson, C.; Soriani, S.; Culligan, P.; Marcotullio, P. Urban policy adaptation toward managing increasing pluvial flooding events under climate change. J. Environ. Plan. Manag. 2020. [Google Scholar] [CrossRef]
  6. Joss, S.; Cowley, R.; Tomozeiu, D. Towards the ‘ubiquitous eco-city’: An analysis of the internationalization of eco-city policy and practice. Urban Res. Pract. 2013, 6, 54–74. [Google Scholar] [CrossRef]
  7. Antrobus, D. Smart green cities: From modernization to resilience? Urban Res. Pract. 2011, 4, 207–214. [Google Scholar] [CrossRef]
  8. McPhillips, L.E.; Matsler, M.; Rosenzweig, B.R.; Kim, Y. What is the role of green stormwater infrastructure in managing extreme precipitation events? Sustain. Resilient Infrastruct. 2020. [Google Scholar] [CrossRef]
  9. United Nations, Department of Economic and Social Affairs, Population Division. World Urbanization Prospects: The 2018 Revision; United Nations: New York, UK, USA, 2019. [Google Scholar]
  10. C40 ‘Cities’ (WWW). 2021. Available online: https://www.c40.org/cities (accessed on 1 January 2021).
  11. CDP ‘Cities’, (WWW). 2021. Available online: https://www.cdp.net/en/cities (accessed on 1 January 2021).
  12. Fahy, B.; Brenneman, E.; Chang, H.; Shandas, V. Spatial analysis of urban flooding and extreme heat hazard potential in Portland, OR. Int. J. Disaster Risk Reduct. 2019, 39, 101117. [Google Scholar] [CrossRef]
  13. Colten, C.E. Vulnerability and Place: Flat Land and Uneven Risk in New Orleans. Am. Anthr. 2006, 108, 731–734. [Google Scholar] [CrossRef]
  14. Liu, L.; Fryd, O.; Zhang, S. Blue-Green Infrastructure for Sustainable Urban Stormwater Management—Lessons from Six Municipality-Led Pilot Projects in Beijing and Copenhagen. Water 2019, 11, 2024. [Google Scholar] [CrossRef] [Green Version]
  15. von Schönfeld, K.C.; Tan, W.; Wiekens, C.; Janssen-Jansen, L. Unpacking social learning in planning: Who learns what from whom? Urban Res. Pract. 2019, 13, 411–433. [Google Scholar] [CrossRef] [Green Version]
  16. Saaty, T.L. The Analytic Hierarchy Process: Planning, Priority Setting, Resources Allocation; McGraw-Hill International: New York, NY, USA, 1980. [Google Scholar]
  17. Hwang, C.L.; Yoon, K. Multiple Attribute Decision Making: Methods and Applications; Springer: New York, NY, USA, 1981. [Google Scholar]
  18. Axelsson, C.; Giove, S.; Soriani, S. Urban pluvial flood management Part 1: Implementing an AHP-TOPSIS Multi-Criteria Decision Analysis method for stakeholder integration in urban climate and storm water adaptation. Water 2021, 13, 2422. [Google Scholar] [CrossRef]
  19. Guarini, M.R.; Battisti, F.; Chiovitti, A. A Methodology for the Selection of Multi-Criteria Decision Analysis Methods in Real Estate and Land Management Processes. Sustainability 2018, 10, 507. [Google Scholar] [CrossRef] [Green Version]
  20. Velasquez, M.; Hester, P.T. An analysis of multi-criteria decision making methods. Int. J. Oper. Res. 2013, 10, 56–66. [Google Scholar]
  21. Pakfetrat, A.; Taghvaei, M.; Zarrabi, A. A comprehensive approach in green space site planning: An application of a three-stage multi-criteria decision support system. Urban Res. Pr. 2018, 13, 45–76. [Google Scholar] [CrossRef]
  22. De Montis, A.; De Toro, P.; Droste-Franke, B.; Omann, I.; Stagl, S. Criteria for Quality Assessment of MCDA Methods, 3rd. In Proceedings of the Biennial Conference of the European Society for Ecological Economics, Vienna, Austria, 3–6 May 2000. [Google Scholar]
  23. Guitouni, A.; Martel, J.-M. Tentative guidelines to help choosing an appropriate MCDA method. Eur. J. Oper. Res. 1998, 109, 501–521. [Google Scholar] [CrossRef]
  24. Saaty, T.L.; Vargas, L.G.; Whitaker, R. Addressing with Brevity criticisms of the analytic hierarchy process. Int. J. Anal. Hierarchy Process 2009, 1. [Google Scholar] [CrossRef]
  25. Wang, Y.-M.; Luo, Y. On rank reversal in decision analysis. Math. Comput. Model. 2009, 49, 1221–1229. [Google Scholar] [CrossRef]
  26. Keshavarz-Ghorabee, M.; Amiri, M.; Zavadskas, E.K.; Turskis, Z.; Antucheviciene, J. A comparative analysis of the rank reversal phenomenon in the EDAS and TOPSIS methods. Econ. Comput. Cybernet. Stud. Res. 2018, 52, 121–134. [Google Scholar]
  27. García-Cascales, M.S.; Lamata, M.T. On rank reversal and TOPSIS method. Math. Comput. Model. 2012, 56, 123–132. [Google Scholar] [CrossRef]
  28. Young, K.D.; Younous, T.; Dymond, R.L.; Kibler, D.F.; Lee, D.H. Application of the Analytic Hierarchy Process for selecting and modeling stormwater best management practices. J. Contempor. Water Res. Educ. 2010, 146, 50–63. [Google Scholar] [CrossRef]
  29. Sahin, O.; Siems, R.; van Staden, R.; Jenkins, G. Decision Dilemma in Adapting Stormwater Systems to Climate Change: A Tale of Three Cities. In Water Conservation: Practices, Challenges and Future Implications; Imteaz, M.A., Ed.; Nova Science: Hauppauge, NY, USA, 2013. [Google Scholar]
  30. Siems, R.; Sahin, O. Adapting water systems to climate change: A multi actor-multiple criteria decision analysis in South-East Queensland, Australia. IWTJ 2014, 4, 135–141. [Google Scholar]
  31. Ebrahimian, A.; Ardeshir, A.; Rad, I.Z.; Ghodsypour, S.H. Urban stormwater construction method selection using a hybrid multi-criteria approach. Autom. Constr. 2015, 58, 118–128. [Google Scholar] [CrossRef]
  32. Alhumaid, M.; Ghumman, A.R.; Haider, H.; Al-Salamah, I.S.; Ghazaw, Y.M. Sustainability evaluation framework of ur-ban stormwater drainage options for arid environments using hydraulic modeling and multicriteria decision-making. Water 2018, 10, 581. [Google Scholar] [CrossRef] [Green Version]
  33. Kordana, S.; Słyś, D. Decision Criteria for the Development of Stormwater Management Systems in Poland. Resources 2020, 9, 20. [Google Scholar] [CrossRef] [Green Version]
  34. Yu, Z.; Gan, H.; Xiao, M.; Huang, B.; Zhu, D.Z.; Zhang, Z.; Wang, H.; Lin, Y.; Hou, Y.; Peng, S.; et al. Performance of permeable pavement systems on stormwater permeability and pollutant removal. Environ. Sci. Pollut. Res. 2021, 28, 28571–28584. [Google Scholar] [CrossRef]
  35. Jayasooriya, V.M.; Muthukumaran, S.; Ng, A.W.M.; Perera, B.J.C. Multi Criteria Decision Making in selecting storm-water management green infrastructure for industrial areas part 2: A case study with TOPSIS. Water Resour. Manag. 2018, 32, 4297–4312. [Google Scholar] [CrossRef]
  36. Hager, J.K.; Mian, H.R.; Hu, G.; Hewage, K.; Sadiq, R. Integrated planning framework for urban stormwater management: One water approach. Sustain. Resilient Infrastruct. 2021, 1–22. [Google Scholar] [CrossRef]
  37. Luan, B.; Yin, R.; Xu, P.; Wang, X.; Yang, X.; Zhang, L.; Tang, X. Evaluationg green stormwater infrastructure strategies efficiencies in a rapidly urbanizing catchment using SWMM-based TOPSIS. J. Clean. Prod. 2019, 223, 680–691. [Google Scholar] [CrossRef]
  38. Zeng, J.; Lin, G.; Huang, G. Evaluation of the cost-effectiveness of Green Infrastructure in climate change scenarios using TOPSIS. Urban For. Urban Green. 2021, 64, 127287. [Google Scholar] [CrossRef]
  39. Gogate, N.G.; Kalbar, P.; Raval, P.M. Assessment of stormwater management options in urban contexts using Multiple Attribute Decision-Making. J. Clean. Prod. 2017, 142, 2046–2059. [Google Scholar] [CrossRef]
  40. Moghadas, M.; Asadzadeh, A.; Vafeidis, A.; Fekete, A.; Kötter, T. A multi-criteria approach for assessing urban flood resilience in Tehran, Iran. Int. J. Disaster Risk Reduct. 2019, 35, 101069. [Google Scholar] [CrossRef]
  41. Ekmekcioğlu, Ö.; Koc, K.; Özger, M. Stakeholder perceptions in flood risk assessment: A hybrid fuzzy AHP-TOPSIS approach for Istanbul, Turkey. Int. J. Disaster Risk Reduct. 2021, 60, 102327. [Google Scholar] [CrossRef]
  42. Koc, K.; Ekmekcioglu, O.; Ozger, M. An integrated framework for the comprehensive evaluation of low impact development strategies. J. Environ. Manag. 2021, 294, 113023. [Google Scholar] [CrossRef] [PubMed]
  43. Baron, N.; Petersen, L.K. Understanding controversies in urban climate change adaptation. A case study of the ole of homeowners in the process of climate change adaptation in Copenhagen. Nord. J. Sci. Technol. Stud. 2015, 3, 4–13. [Google Scholar] [CrossRef] [Green Version]
  44. Torabi, E.; Dedekorkut-Howes, A.; Howes, M. A framework for using the concept of urban resilience in responding to climate-related disasters. Urban Res. Pr. 2021, 1–23. [Google Scholar] [CrossRef]
  45. Holden, M.; Larsen, M.T. Institutionalizing a policy by any other name: In the City of Vancouver’s Greenest City Action Plan, does climate change policy or sustainability policy smell as sweet? Urban Res. Pract. 2015, 8, 354–370. [Google Scholar] [CrossRef]
  46. Sovacool, B.; Linnér, B.-O.; Goodsite, M.E. The political economy of climate adaptation. Nat. Clim. Chang. 2015, 5, 616–618. [Google Scholar] [CrossRef]
  47. Tubridy, D. Co-financing green resilient infrastructures in Copenhagen: Integrated or superficial design? Landsc. Res. 2020, 46, 261–272. [Google Scholar] [CrossRef]
  48. Georgeson, L.; Maslin, M. Estimating the scale of the US green economy within the global context. Palgrave Commun. 2019, 5, 1–12. [Google Scholar] [CrossRef] [Green Version]
  49. Sanchez, L.; Reames, T.G. Cooling Detroit: A socio-spatial analysis of equity in green roofs as an urban heat island mitigation strategy. Urban For. Urban Green. 2019, 44, 126331. [Google Scholar] [CrossRef]
  50. Heckert, M.; Rosan, C.D. Developing a green infrastructure equity index to promote equity planning. Urban For. Urban Green. 2016, 19, 263–270. [Google Scholar] [CrossRef]
  51. Shi, L.; Chu, E.; Anguelovski, I.; Aylett, A.; Debats, J.; Goh, K.; Schenk, T.; Seto, K.C.; Dodman, D.; Roberts, D.; et al. Roadmap towards justice in urban climate adaptation research. Nat. Clim. Chang. 2016, 6, 131–137. [Google Scholar] [CrossRef] [Green Version]
  52. Wolch, J.R.; Byrne, J.; Newell, J.P. Urban green space, public health, and environmental justice: The challenge of making cities ‘just green enough’. Lands. Urban Plan. 2014, 125, 234–244. [Google Scholar] [CrossRef] [Green Version]
  53. Goodman, L.A. Snowball Sampling. Ann. Math. Stat. 1961, 32, 148–170. [Google Scholar] [CrossRef]
  54. Zoho ‘Survey’ [Survey Software]. 2021. Available online: https://www.zoho.com/ (accessed on 2 February 2021).
  55. Available online: https://www.congress.gov/bill/116th-congress/house-resolution/109/text (accessed on 31 August 2021).
  56. Derkzen, M.L.; van Teeffelen, A.J.A.; Verburg, P.H. Green infrastructure for urban climate adaptation: How do residents’ views on climate impacts and green infrastructure shape adaptation preferences. Landsc. Urban Plan. 2017, 157, 106–130. [Google Scholar] [CrossRef]
  57. Alves, A.; Gersonius, B.; Kapelan, Z.; Vojinovic, Z.; Sanchez, A. Assessing the co-benefits of green-blue-grey infrastruc-ture for sustainable urban flood risk management. J. Environ. Manag. 2019, 239, 244–254. [Google Scholar] [CrossRef]
  58. Alves, A.; Vojinovic, Z.; Kapelan, Z.; Sanchez, A.; Gersonius, B. Exploring trade-offs among the multiple benefits of green-blue-grey infrastructure for urban flood mitigation. Sci. Total. Environ. 2020, 703, 134980. [Google Scholar] [CrossRef] [PubMed]
  59. Li, F.; Chen, J.; Engel, B.A.; Liu, Y.; Wang, S.; Sun, H. Assessing the Effectiveness and Cost Efficiency of Green Infrastructure Practices on Surface Runoff Reduction at an Urban Watershed in China. Water 2020, 13, 24. [Google Scholar] [CrossRef]
  60. Zhang, Y.; Zhao, W.; Chen, X.; Jun, C.; Hao, J.; Tang, X.; Zhai, J. Assessment on the Effectiveness of Urban Stormwater Management. Water 2020, 13, 4. [Google Scholar] [CrossRef]
  61. Engberg, L.A. Climate Adaptation and Citizens’ Participation in Denmark: Experiences from Copenhagen; Springer: Cham, Switzerland, 2017; pp. 139–161. [Google Scholar] [CrossRef]
  62. Pagliacci, F.; Defrancesco, E.; Bettella, F.; D’Agostino, V. Mitigation of Urban Pluvial Flooding: What Drives Residents’ Willingness to Implement Green or Grey Stormwater Infrastructures on Their Property? Water 2020, 12, 3069. [Google Scholar] [CrossRef]
Figure 1. Sensitivity analysis of all the North American participants and the alternative scoring by testing the percentage shifts in the four main criteria weights: (a) political, (b) economic, (c) environmental and (d) social with government streamlining (govt), grey infrastructure overhauls (grey inf), maintaining urban environments (MUE), private green infrastructure (priv. green), and public green infrastructure (pub. green).
Water 13 02433 g001
Figure 2. Sensitivity Analysis of all the European participants and the alternative scoring by testing the percentage shifts in the four main criteria weights: (a) political, (b) economic, (c) environmental and (d) social with government streamlining (govt), grey infrastructure overhauls (grey inf), maintaining urban environments (MUE), private green infrastructure (priv. green), and public green infrastructure (pub. green).
Water 13 02433 g002
Figure 3. Sensitivity analysis of all the Australasian participants and the alternative scoring by testing the percentage shifts in the four main criteria weights: (a) political, (b) economic, (c) environmental and (d) social with government streamlining (govt), grey infrastructure overhauls (grey inf), maintaining urban environments (MUE), private green infrastructure (priv. green), and public green infrastructure (pub. green).
Water 13 02433 g003
Figure 4. Sensitivity analysis of all the study participants and the alternative scoring by testing the percentage shifts in the four main criteria weights: (a) political, (b) economic, (c) environmental and (d) social with government streamlining (govt), grey infrastructure overhauls (grey inf), maintaining urban environments (MUE), private green infrastructure (priv. green), and public green infrastructure (pub. green).
Water 13 02433 g004
Table 1. Recent literature on the AHP and TOPSIS methodologies within stormwater management extracted from Axelsson et al. [18].
StudyYear PublishedDescription and Context
AHP
Young et al. [28]2010The use of AHP in identifying stormwater management strategies in an American local municipality
Sahin et al. [29]2013The use of AHP in identifying stormwater management strategies across councils in an Australian state
Siems and Sahin [30]2014The use of AHP in identifying stormwater management strategies across councils in an Australian state.
Ebrahimian et al. [31]2015The use of fuzzy AHP and compromise programing in stormwater collection systems in an Iranian urban context
Alhumaid et al. [32]2018The use of AHP and PROMETHEE II in stormwater drainage system management in a Saudi Arabian urban context
Kordana and Slys [33]2020The use of AHP to evaluate stormwater management strategies in at a building in a Polish context
Yu et al. [34]2021The use of AHP in identifying optimal permeable pavement types for stormwater management.
TOPSIS
Jayasooriya et al. [35]2018The use of TOPSIS to identify green infrastructure for stormwater management in industrial sites an Australian urban area
Hager [36]2019The use of fuzzy TOPSIS to examine optimal stormwater management strategies in a Canadian context.
Luan et al. [37] 2019The use of TOPSIS to evaluate green infrastructure for stormwater in a Chinese sponge city
Zeng et al. [38]2021The use of TOPSIS to identify green infrastructure solutions for stormwater management in a Chinese smart city
AHP-TOPSIS
Gogate et al. [39]2017The use of AHP-TOPSIS to identify stormwater management alternative performances in an Indian urban area
Moghadas et al. [40]2019The use of AHP-TOPSIS to evaluate flood risk in an Iranian urban area
Ekmekcioglu et al. [41]2021Fuzzy AHP-TOPSIS for flood risk mapping in Turkish municipalities
Koc et al. [42]2021Fuzzy AHP-TOPSIS for stormwater management in a Turkish urban watershed.
Table 2. Organization of the criteria.
Main CriteriaPoliticalEconomicEnvironmentalSocial
Sub-criteriaExisting Legislative FrameworkPublic CostsStormwater CapacityRisk to Human Health and Safety
Project FeasibilityPrivate CostsStormwater QualityCivic Engagement
JurisdictionFunding AvailabilityEcosystem SupportReducing Inequalities
Implementation TimeGreen Industry GrowthEnergy UsageSynergies with Other Adaptations
Table 3. Spread of the 34 participants across the different stakeholder groupings.
n = 34GovernanceAdvocacyResearch
North AmericaNew York City642
Vancouver5 4
EuropeCopenhagen 2
Amsterdam31
AustralasiaSydney 22
Auckland111
Table 4. The criteria weights of the four main criteria and the global weights of the sixteen sub-criteria.
Aggregated by Stakeholder TypeAggregated by Region
Total ParticipantsGovernanceAdvocacyResearchNorth AmericaEuropeAustralasia
Main CriteriaPolitical (0.320)Economic (0.335)Political (0.371)Political (0.280)Political (0.323)Economic (0.355)Political (0.310)
Economic (0.276)Political (0.323)Social (0.252)Environmental (0.276)Economic (0.266)Political (0.313)Economic (0.248)
Environmental (0.219)Environmental (0.204)Economic (0.224)Economic (0.243)Environmental (0.217)Environmental (0.205)Environmental (0.234)
Social (0.185)Social (0.138)Environmental (0.153)Social (0.201)Social (0.194)Social (0.128)Social (0.208)
Global weights of the sub-criteriaPublic Costs (0.110)Public Costs (0.145)Feasibility (0.159)Feasibility (0.109)Public Costs (0.110)Public Costs (0.129)Feasibility (0.147)
Feasibility (0.107)Jurisdiction (0.102)Safety Risk (0.127)Storm Capacity (0.104)Feasibility (0.096)Private Costs (0.105)Safety Risk (0.120)
Funding (0.082)Funding (0.088)Existing Leg. (0.085)Public Costs (0.096)Jurisdiction (0.090)Storm Capacity (0.104)Storm Capacity (0.111)
Safety Risk (0.082)Feasibility (0.086)Public Costs (0.081)Safety Risk (0.087)Existing Leg. (0.088)Feasibility (0.103)Public Costs (0.093)
Existing Leg. (0.081)Existing Leg. (0.082)Jurisdiction (0.080)Ecosystems (0.073)Safety Risk (0.082)Funding (0.091)Funding (0.086)
Jurisdiction (0.081)Storm Capacity (0.082)Funding (0.080)Existing Leg. (0.072)Funding (0.076)Time (0.081)Existing Leg. (0.075)
Storm Capacity (0.079)Private Costs (0.073)Storm Quality (0.050)Funding (0.070)Storm Quality (0.067)Jurisdiction (0.065)Jurisdiction (0.064)
Storm Quality (0.058)Safety Risk (0.056)Inequalities (0.047)Storm Quality (0.061)Storm Capacity (0.062)Existing Leg. (0.063)Storm Quality (0.052)
Private Costs (0.055)Storm Quality (0.055)Time (0.046)Jurisdiction (0.050)Ecosystems (0.051)Ecosystems (0.048)Private Costs (0.052)
Ecosystems (0.051)Time (0.052)Civic Engage. (0.046)Time (0.049)Time (0.050)Other Hazards (0.043)Ecosystems (0.045)
Time (0.051)Ecosystems (0.041)Private Costs (0.040)Other Hazards (0.048)Private Costs (0.046)Safety Risk (0.037)Other Hazards (0.033)
Other Hazards (0.039)Other Hazards (0.034)Storm Capacity (0.040)Private Costs (0.047)Other Hazards (0.040)Storm Quality (0.034)Civic Engage. (0.032)
Civic Engage. (0.034)Green Industry (0.028)Ecosystems (0.038)Civic Engage. (0.040)Inequalities (0.038)Civic Engage. (0.031)Energy Usage (0.026)
Inequalities (0.031)Energy Usage (0.026)Other Hazards (0.031)Energy Usage (0.038)Energy Usage (0.037)Green Industry (0.029)Time (0.024)
Energy Usage (0.031)Inequalities (0.025)Energy Usage (0.026)Green Industry (0.031)Civic Engage. (0.035)Energy Usage (0.019)Inequalities (0.023)
Green Industry (0.029)Civic Engage. (0.023)Green Industry (0.023)Inequalities (0.027)Green Industry (0.033)Inequalities (0.017)Green Industry (0.018)
Table 5. The TOPSIS scores of the five policy alternatives.
Aggregated by Stakeholder TypeAggregated by Region
Alternative RankingsTotal ParticipantsGovernanceAdvocacyResearchNorth AmericaEuropeAustralasia
1Public Green Infrastructure (0.566)Public Green Infrastructure (0.568)Public Green Infrastructure (0.565)Public Green Infrastructure (0.575)Public Green Infrastructure (0.556)Public Green Infrastructure (0.542)Public Green Infrastructure (0.597)
2Government Streamlining (0.534)Government Streamlining (0.537)Government Streamlining (0.561)Government Streamlining (0.526)Government Streamlining (0.543)Government Streamlining (0.537)Private Green Infrastructure (0.553)
3Private Green Infrastructure (0.506)Maintaining Urban Environments (0.512)Private Green Infrastructure (0.505)Private Green Infrastructure (0.518)Maintaining Urban Environments (0.506)Private Green Infrastructure (0.499)Maintaining Urban Environments (0.504)
4Maintaining Urban Environments (0.500)Private Green Inf. (0.492)Maintaining Urban Environments (0.492)Maintaining Urban Environments (0.500)Private Green Infrastructure (0.493)Grey Infrastructure Overhauls (0.469)Government Streamlining (0.500)
5Grey Infrastructure Overhauls (0.445)Grey Infrastructure Overhauls (0.469)Grey Infrastructure Overhauls (0.392)Grey Infrastructure Overhauls (0.449)Grey Infrastructure Overhauls (0.471)Maintaining Urban Environments (0.461)Grey Infrastructure Overhauls (0.366)
Publisher’s Note: MDPI stays neutral with regard to jurisdictional claims in published maps and institutional affiliations.

