Article

Impact of the Farakka Dam on Thresholds of the Hydrologic Flow Regime in the Lower Ganges River Basin (Bangladesh)

Venice Centre for Climate Studies (VICCS), Department of Economics, Ca' Foscari University of Venice, Cannaregio 873, Venice 30121, Italy
*
Author to whom correspondence should be addressed.
Water 2014, 6(8), 2501-2518; https://doi.org/10.3390/w6082501
Submission received: 22 June 2014 / Revised: 6 August 2014 / Accepted: 7 August 2014 / Published: 15 August 2014

Abstract

:
The variation of river flow within a natural range plays an important role in promoting the social-ecological sustainability of a river basin. In order to determine the extent of the natural range of variation, this study assesses hydrologic flow thresholds for the Lower Ganges River Basin. The flow threshold was calculated using twenty-two “Range of Variability (RVA)” parameters. The impact of Farakka Dam on the Lower Ganges River flow was calculated by comparing threshold parameters for the pre-Farakka period (from 1934 to 1974) and the post-Farakka period (1975–2005). The results demonstrate that due to water diversion by the Farakka Dam, various threshold parameters, including the monthly mean of the dry season (December–May) and yearly minimum flows, have been altered significantly. The ecological consequences of such hydrologic alterations include the destruction of the breeding and raising grounds for a number of Gangetic species, the increase of salinity in the southwest coastal region of Bangladesh and a reduction of fish and agricultural diversity. The major findings in this paper have a number of policy-level implications to aid water sharing mechanisms and agreements between the government of Bangladesh and India. The methodological approach presented in this study is applicable to other river basins.

1. Introduction

A social-ecological system (SES) is defined as a system that includes social and ecological subsystems in mutual interaction [1]. All human-used resources are embedded in complex SESs [2]. The sustainability of SESs depends on the long-term maintenance of well-being, which encompasses the responsible management of resource use. There is a fundamental need to address ecological requirements for attaining sustainability in the management and allocation of water [3,4,5,6]. The social-ecological sustainability of a river basin depends in part on the dynamic flow pattern of the river. The dynamic flow pattern of a river must be maintained within a natural range of variation to promote the integrity and sustainability of SESs [7,8]. This dynamic flow pattern creates and maintains the ideal conditions of in-channel and floodplain habitats.
The maintenance of river flow within such natural variation plays a fundamental role for the functioning of aquatic and riparian species [9]. A natural flow regime is essential to support a native river ecosystems for flora and fauna [10,11]. High flows of different frequencies effectively transport sediments, which are important for channel maintenance, bird breeding, high benthic productivity and creating spawning habitat for fish [12]. High flows through wetland flooding create space available for the recruitment of new individuals or species and eventually maintain riparian vegetation [13]. Floods also distribute and deposit river sediments over large areas of land that can replenish nutrients in top soils, making agricultural lands more fertile [14]. As periodic flooding made the land more fertile, the populations of many ancient civilizations concentrated along the floodplains of rivers, e.g., the Nile, Tigris and Yellow River [15]. Floodwaters are also absorbed into the ground and percolated down through the rock to recharge underground aquifers that supply natural springs, wells, rivers and lakes with fresh water. In addition to high flows, periods of low flows are equally important for algae control, water quality maintenance and the use of the river by local people [16]. Low flows can also provide recruitment opportunities for riparian plant species in frequently inundated floodplains [17].
Hydrological alteration can be defined as any changes in the magnitude or timing of natural river flow. The natural flow regime of a river can be altered by various anthropogenic activities and climate change [18]. Climate change is likely to lead to an intensification of the global hydrological cycle, resulting in an overall net negative impact on the frequency and timing of river flow and the health of freshwater ecosystems [19,20,21,22]. Similarly, increased population pressure and economic development patterns are responsible for the alteration of the hydrologic flow regime through building dams, constructing levees, urbanization and pumping ground water [9]. Building dams and barrages is one of the major sources of human-induced hydrologic alteration. The magnitude and extent of dam construction and associated water diversion are large and cause many local and regional environmental effects [23]. By the 20th century, the number of large dams (>15 m) had risen to more than 47,000, with an additional 800,000 smaller dams [24], which had an effect on over half of the 292 large river systems [25]. The ecological consequences of hydrologic alteration due to dam building are many. For example, they modify biogeochemical cycles, as well as channel and floodplain habitats through altering the downstream flux of water and sediments [26]. In turn, this affects biotic composition. The natural evolution of life history strategies is also affected by altered flow. Flow alterations due to dams affect longitudinal and lateral connectivity and create barriers to the upstream-downstream movement of organisms and nutrients that hinder biotic exchange [27]. For these consequences, the extent to which the alteration of natural flow is feasible is an important area of research.
However, the threshold determination of flow variability is a complex procedure, and several studies have been conducted in this area [8,23,28,29,30,31,32,33,34,35,36]. To determine the ecological flow threshold, Richter et al. [28,29] proposed the “Range of Variability Approach (RVA)” based on hydrologic characteristics of magnitude, frequency, duration, timing and the rate of the change of flow. Pegg et al. [31], Magilligan and Nislow [32] and Jiang et al. [33] applied the RVA technique to quantify the effects of dam construction on hydrological alteration. Applying a similar approach, recently, Gain et al. [8] investigated the climate change impact on the thresholds of the hydrologic flow regime. Smakhtin [37] reviewed many of the well-established hydrological techniques used to derive the flow indices for gauged and ungauged watersheds. Pyron and Neumann [35] applied the indicators of hydrologic alteration through regressions of hydrological variables against time. Zhang et al. [36] identified six classes of flow patterns in the Huai River Basin, China, based on 80 hydrologic metrics, analyzed by hierarchical clustering algorithms. Ghanbarpour et al. [23] applied a combination of techniques to determine environmental flow thresholds and to quantify how dam construction altered the hydrology of the Tajan River watershed in Iran.
Among these available methods, a simple approach is essential to determine the allowable extent of hydrologic alteration that can be useful for policymakers. However, in developing parts of the world where the consequences of hydrologic flow alterations are severe, such methods of assessment are still rare. The Ganges Basin is one of the most vulnerable areas in the world, as it is subject to the combined effects of climate change and various development pressures, including dam constructions [38,39,40]. Although hydrologic alterations occur in the Ganges River Basin, systematic investigation of the impacts on environment and society is unavailable. Such information is useful to examine the causes and potential impacts on stream ecosystems and to achieve sustainable water management.
In order to overcome this gap, the objective of this study is to determine the threshold of the natural flow regime of the lower Ganges Basin and to investigate the hydrologic alteration of downstream flow in the Ganges River due to the construction of the Farakka Dam. In assessing the thresholds and evaluating the impact of the Farakka Dam, this study does not present any new approach. Instead, we apply the existing method of the RVA approach developed by Richter et al. [28,29] and applied by Pegg et al. [31], Magilligan and Nislow [32], Gain et al. [8] and Jiang et al. [33]. The reason behind the selection of RVA approach is that the method is simple, but very much effective for policymakers. The analysis allowed us to provide insights on the impact of Farakka Dam on the hydrologic regime of the studied river basin. The assessment can be useful later for a broader assessment of impacts on local SESs. Moreover, the calculated thresholds may be used as a good basis for the negotiation with the riparian countries in the Ganges River Basin. This research is particularly relevant, as there are large global initiatives for trans-boundary river basin management.
The remainder of this paper is organized as follows. The study area along with the description of Farakka Dam is provided in the next section. The methods of assessment are then briefly outlined. The results are subsequently presented, and the impacts of hydrologic alterations are discussed. The paper concludes with comments on the potential application of research findings.

2. Study Area

2.1. The Ganges Basin

The Ganges is a major river of the Indian subcontinent rising in the Himalayan Mountains and flowing about 2510 km generally eastward through a vast plain to the Bay of Bengal. The total catchment of the Ganges Basin is 907,000 km2 [41]. India shares the major portion of the total basin area, with 861,452 km2 [42]. Bangladesh is the furthest downstream country of the Ganges Basin and shares only about 4% of the basin area (45,548 km2), which nevertheless represents 37% of the total area of Bangladesh. The water supply of the Ganges depends partly on the monsoon-dominated rainfall (during July to October) and Himalayan snow melting during the dry season (April to June) [40]. The region is characterized by flooding in the wet season [43] and water scarcity in the dry season [44]. The average annual rainfall varies from 760 mm at the western end of the basin to more than 2290 mm at the eastern end. The sediment load of the Ganges at Farraka Dam is 1235 t·km−2·y−1 [45]. The vast sediment deposition makes the soil alluvium cover more than 52% of the basin. These alluvial soils are highly fertile and are capable of producing a variety of crops. Therefore, the Ganges Basin is one of the most populous regions on Earth. Around 407 million people of China, Nepal, India and Bangladesh are directly or indirectly dependent on the Ganges River. The river also supports important fauna and flora, including the endangered species, Platanista gangetica (Ganges River dolphin). Fisheries along the river are of considerable economic value, which makes a major contribution to the region. Similarly, the riparian zone also supports many plant species that play an important role in nutrient and water conservation and in controlling soil erosion. Thus, the river is of great importance in the social-ecological system of the four countries.

2.2. Construction of Farakka Dam and Its Impact

Until 1975, the river was unregulated and the flow was natural. However, on 21 April 1975, a dam on the Ganges River was commissioned by India at Farakka, roughly 16.5 km upstream from the border of Bangladesh. With an aim to maintain proper navigation at the port of Kolkata, the dam was built to divert 1133 m3·s−1 of water. During the dry season (January to June), this amount of water was diverted from the Ganges to the Hooghly River [46].
Following the operation of the Farakka Dam, the dry season flow of the Ganges in Bangladesh reduced significantly [39,47], while the monsoon discharge in Bangladesh increased. This flow alteration has had a significant effect on the social-ecological system of Bangladesh through disruption to fisheries, forestry, agriculture, navigation and increasing salinity intrusion from the coast. Despite these social-ecological consequences, Bangladesh and India were not able to form a consensus to maintain a regular flow downstream. In 1996, a 30-year agreement on sharing the dry season flow of the Ganges River at Farakka was signed by India and Bangladesh [48]; however, this agreement did not contain any guarantee of minimum water for Bangladesh, and the problem is still severe. In part, this is because the techno-political debate between Bangladesh and India on the impact of the Farakka Dam is based on general observation and anecdotal evidence instead of quantitative assessment of water requirements [47].

3. Methods

3.1. Data

To assess the flow thresholds, hydrological discharge data were collected. The major discharge measuring station of the lower Ganges Basin in Bangladesh is at Hardinge Bridge Point, and long-term observation records of this station are available and accessible from the Bangladesh Water Development Board. The data are of high quality and have been used in major hydrological studies in flood forecasting and other planning purposes [47]. Daily discharge data from this station was collected from 1934 to 2005.
India began the operation of Farakka Dam on 21 April 1975. Hence, the data series up to 1975 represents pre-Farakka flow, and data from 1975 onwards represent post-Farakka flow. To assess the hydrological data series, the hydrological year, 1 April to 31 March, instead of the calendar year is considered. Depending on meteorological and geographical factors, the beginning of a “hydrologic year” or “water year” differs from the calendar year. In winter snow-dominated watersheds, the year begins 1 October and ends at 30 September, because snow is deposited in the fall and winter and drains out of the watershed in the spring and summer, and the watershed returns to a “dry” state at the end of the year [49]. However, the situation is completely opposite (rainfall in the spring and summer and drains out in the fall and winter) in summer-monsoon dominated regions. Therefore, in the Ganges-Brahmaputra Basin (situated in the Indian Summer Monsoon), the hydrologic year begins 1 April and ends 31 March [38,47]. In addition to discharge data, available daily rainfall data were also collected from the Rajshahi station of the Bangladesh Meteorological Department (BMD) for the period 1964–2005. The data series of the Rajshahi station represents the rainfall of the Bangladesh portion (only 4% of the basin area) of the Ganges Basin. The missing rainfall data were filled up using appropriate hydrologic techniques, e.g., the averaged value of surrounding stations. For representing the rainfall of the Indian portion of the Ganges Basin, the results of the trend analysis carried out by Kumar and Jain [50] were considered, in which available daily gridded rainfall data at a 1° × 1° resolution for the period 1951–2004 provided by the India Meteorological Department (IMD) were used.

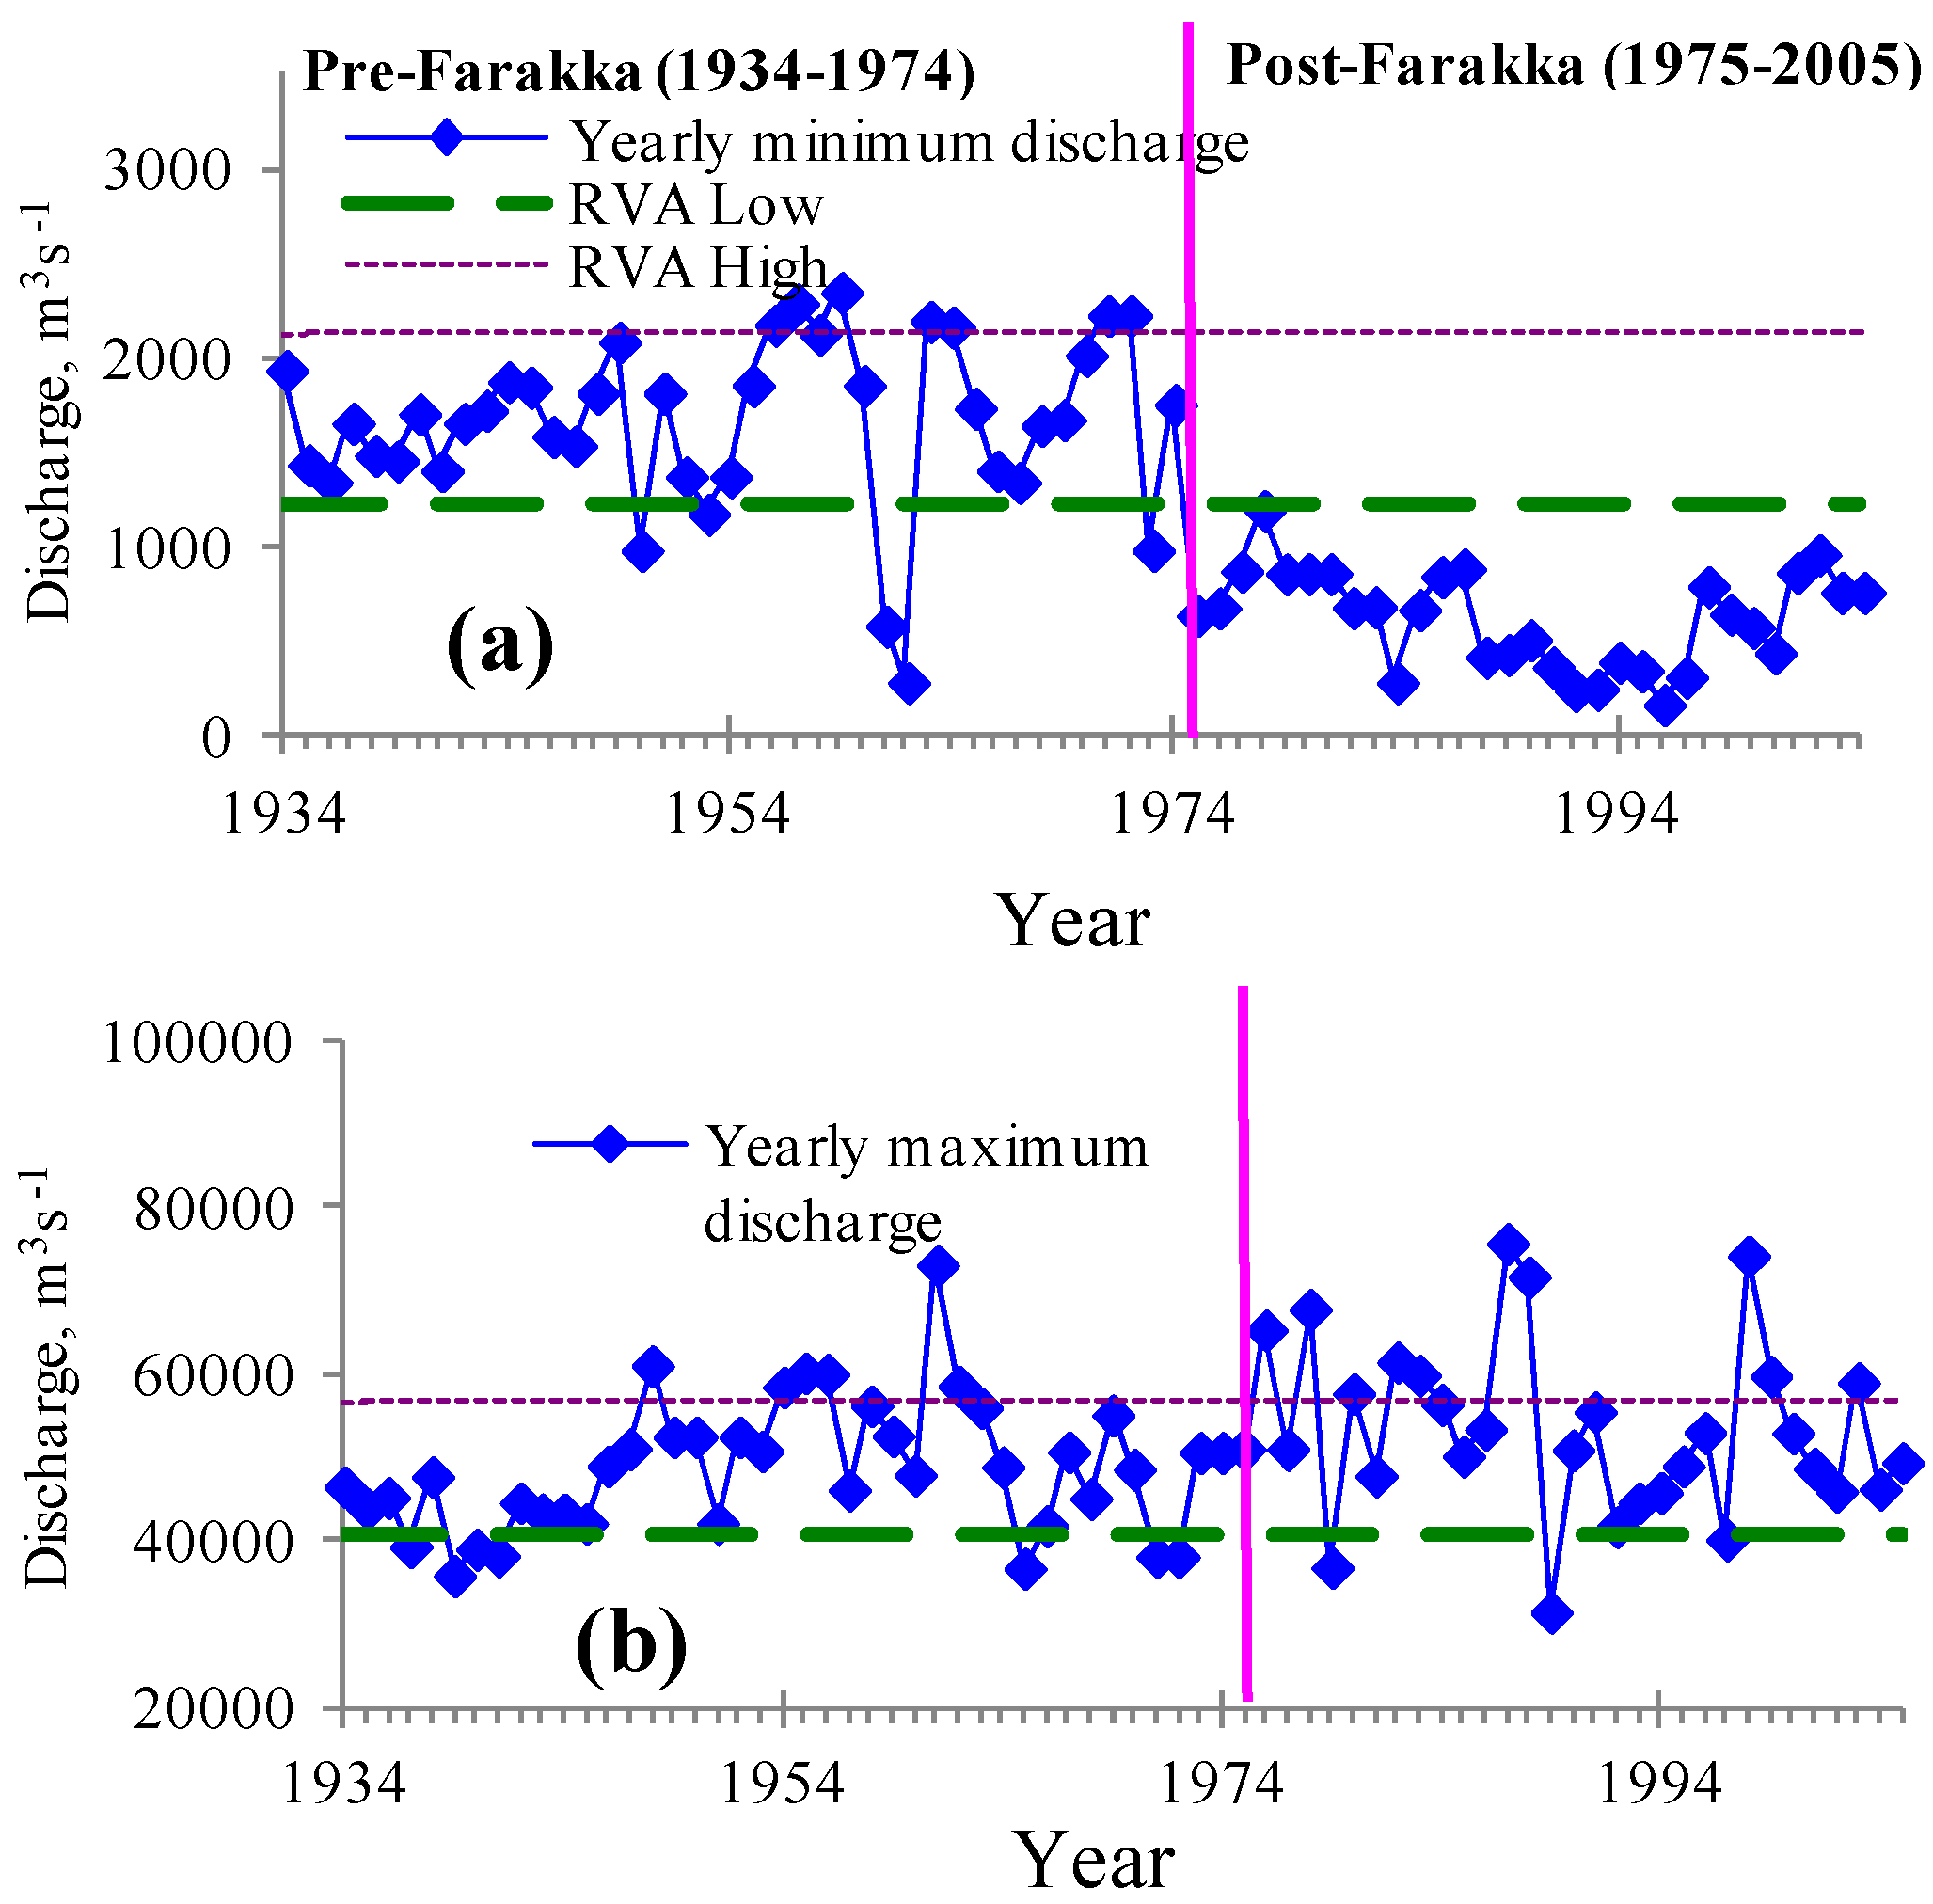
3.2. Testing the Natural Condition of Discharge

The first step for determining the flow thresholds is to consider the observation data series that represent natural flow, in which no shifts and trends are found. For testing the natural condition, a linear trend analysis was conducted considering the fact that the natural flow series is trend-free and constitutes a stochastic process whose random component follows the appropriate probability distribution. Gain et al. [51] present a detailed description on the method used for testing linear trends, which can be summarized as follows:
Assume that yt, t = 1, …, N is an annual time series and N is the sample size. A simple linear trend can be written as:
yt = D + Mt
where D and M are the parameters of the regression model. The rejection of hypothesis M = 0 can be considered as a detection of a linear trend. The hypothesis that M = 0 is rejected if:
Water 06 02501 i001
in which R is the cross-correlation coefficient between the sequences y1, …, yN and 1, …, N and T1 − ∞/2, v is the 1 − ∞/2 quantile of the Student’s t distribution with v = N − 2 degrees of freedom; ∞ is the significance level, which is 5% (or 95% confidence level).
For the quantitative assessment of the natural flow condition, a trend test was carried out for the available discharge data series (1934–2005) and for the pre-Farakka period (1934–1974). For assessing the trend, yearly maximum and minimum data series were considered. The results of the trend test are shown in Table 1. The pre-Farakka period (1934–1974) represents no intervention, and all of the series in this period are trend-free, as the calculated Tc for each series is lower than the critical value (2.02) at the 5% significance level. However, for the available period (1934–2005), all of the series represent a significant trend. Therefore, for calculating thresholds, the discharge series of the pre-Farakka period that represents the natural flow was considered.
Table 1. The results of the trend analysis for the yearly discharge and rainfall series.
Yearly SeriesLength of the SeriesTrend: Test Statistics, TcCritical Value at 5% Significance Level, T1 − α/2, ν (t Distribution)Results
Cumulative rainfall1964–20050.2052.02Trend does not exist
1964–19740.3822.02Trend does not exist
Minimum discharge1934–20056.002.00Significant trend
1934–19740.5612.02Trend does not exist
Maximum discharge1934–20052.332.00Significant trend
1934–19741.512.02Trend does not exist
However, shifts in the discharge may occur due to both natural climatic variability and to human abstraction. India claimed that this was due to low winter and summer rainfall in northern India, while Bangladesh argued that the low flow was the result of only water diversions upstream of Farakka [39]. An analysis of the variations in basin-scale precipitation was used to clarify whether the alterations of flow were due to natural climatic variability or to human abstraction. Using the daily gridded rainfall data at a 1° × 1° resolution for the period 1951–2004, few studies carried out a basin-wise trend analysis of rainfall over India and found no change in the annual rainfall of the Indian portion of the Ganges Basin [42,50]. For analyzing the variation of rainfall in the Bangladesh portion, a linear trend analysis (the method described above) was also considered. Using the daily rainfall of the Rajshahi station of Bangladesh, we carried out a linear trend analysis for the available data series (1964–2005) and for the pre-Farakka period (1964–1974). In both cases, no trend is found in the cumulative annual rainfall (Table 1). The rainfall trend analysis of the Ganges Basin indicates that the alterations of flow in the downstream are due to the water diversion at Farakka, and before construction of the dam (1934–1974), the river flow was natural.

3.3. Assessment of Thresholds Using RVA Approach

Once the natural condition of flow has been tested, an analysis of the ecological flow threshold of natural variability is required. Reflecting different aspects of flow variability (magnitude, frequency, duration and timing of flows), Richter et al. [29] proposed the “Range of Variability Approach” (RVA). The hydrological variability and its associated characteristics (timing, frequency, duration and rates of change; see [28,52,53] for a detailed description) play a critical role in sustaining aquatic ecosystem. A hydrological regime characterized by the near full range of natural variation is necessary to sustain the full native biodiversity and integrity of aquatic ecosystems. The RVA method proposed by Richter et al. [29] addresses this paradigm by incorporating into river management targets a suite of ecologically-relevant hydrological parameters that comprehensively characterize the natural stream flow regime. The RVA method was applied to investigate the water diversion-induced ecological flow threshold in the Lower Ganges Basin in Bangladesh. In the RVA method, thirty-two hydrological parameters were considered.
However, many parameters that are used in the original RVA method are likely to be correlated with each other, as significant redundancy (multicollinearity) exists between many hydrologic parameters [54]. Monk et al. [55] suggested a refined number of clearly-defined hydrological parameters, where the known duplication of hydrological information has been removed/minimized using hydrological understanding. Smakhtin et al. [16] reduced the number of RVA flow parameters to sixteen. For assessing maximum and minimum flow, Smakhtin et al. [16] considered only 1-day and 90-day average flows. However, maximum and minimum flows of 3-, 7- and 90-day averages can capture a different extent of drought and flood information. Therefore, for assessing ecological flow thresholds, we considered twenty-two flow parameters, of which, twelve represent the mean flow value for each calendar month that can jointly capture the seasonal flow distribution, and the remaining ten parameters (1-, 3-, 7-, 30- and 90-day maxima; 1-, 3-, 7-, 30- and 90-day minima) reflect the variability of the maximum and minimum range and their different durations.
In an altered flow regime (by means of climate change or human perturbation), those parameters should be maintained within the limits of their natural variability, which should be based on extensive ecological information, taking into account the ecological consequences of different flow regimes. However, setting flow targets based on ecological information is very difficult to achieve. In the absence of extensive ecological information, Richter et al. [29] suggested several measures of dispersion (e.g., ±1 or 2 standard deviation, twentieth and eightieth percentile, etc.) to use in setting initial threshold flows. The choice of the most appropriate measure of dispersion should be based on whether each parameter follows a normal or skewed distribution, and in the case of a normal distribution, one could use the standard deviation (SD) from the mean value as an initial threshold flow. In order to select am appropriate measure of dispersion, we tested the distribution of each of the 22 RVA parameters, and we found that all of the parameters follow a normal distribution. Therefore, values at ±1 SD from the mean were selected as thresholds for each of the twenty-two RVA parameters. Any considered parameter should thus stay in the limits [8,29]:
(mean − SD) ≤ parameter ≤ (mean + SD)
Exceedance of these limits by a particular parameter may lead to considerable ecosystem stress over long time periods. We used this approach for setting initial flow thresholds in this study.

4. Results

4.1. Ecological Flow Threshold

After characterizing and testing the natural conditions of the observed data series, we determined the ecological flow thresholds of twenty-two RVA parameters, reflecting different aspects of flow variability (magnitude, frequency, duration and timing of flows). A summary of these results are shown in Table 2. For assessing the mean and standard deviation values of each parameter (Columns 2 and 3 of Table 2, respectively), we analyzed the daily mean discharge series of a 41-year period (1934–1974). Values at ±1 SD from the mean were selected as the ecological flow threshold for each of the twenty-two RVA parameters. Minimum threshold (Mean − 1 SD) and maximum threshold (mean + 1 SD) values for each parameter are shown in Columns 4 and 5 of Table 2, respectively. Different parameters with a lower and higher limit of threshold represent the seasonal variability of the flow within which an ecosystem can sustain itself.
Table 2. Results of the selected Range of Variability Approach (RVA) parameter analysis (Columns 2–5) based on the data of the pre-Farakka period (1934–1974).
RVA parametersMean and standard deviationThreshold flow (m3·s−1)
Means (m3·s−1)SD (m3·s−1)LowHigh
January3,0836772,4063,760
February2,6706132,0573,283
March2,2994541,8452,752
April2,0423651,6772,406
May2,1614351,7262,596
June4,0249583,0664,982
July17,6724,78112,89022,453
August37,8098,11629,69345,924
September35,8127,92027,89243,731
October17,6617,05610,60524,717
November7,0582,4494,6099,507
December4,1911,0173,1735,208
1-Day Minimum1,6774461,2312,123
3-Day Minimum1,7803311,4492,110
7-Day Minimum1,8243001,5242,124
30-Day Minimum1,8533071,5462,161
90-Day Minimum2,1223301,7932,452
1-Day Maximum48,7277,95740,77056,683
3-Day Maximum48,3678,04040,32756,406
7-Day Maximum47,3308,31939,01155,649
30-Day Maximum41,8468,07033,77649,916
90-Day Maximum32,7476,79925,94839,546

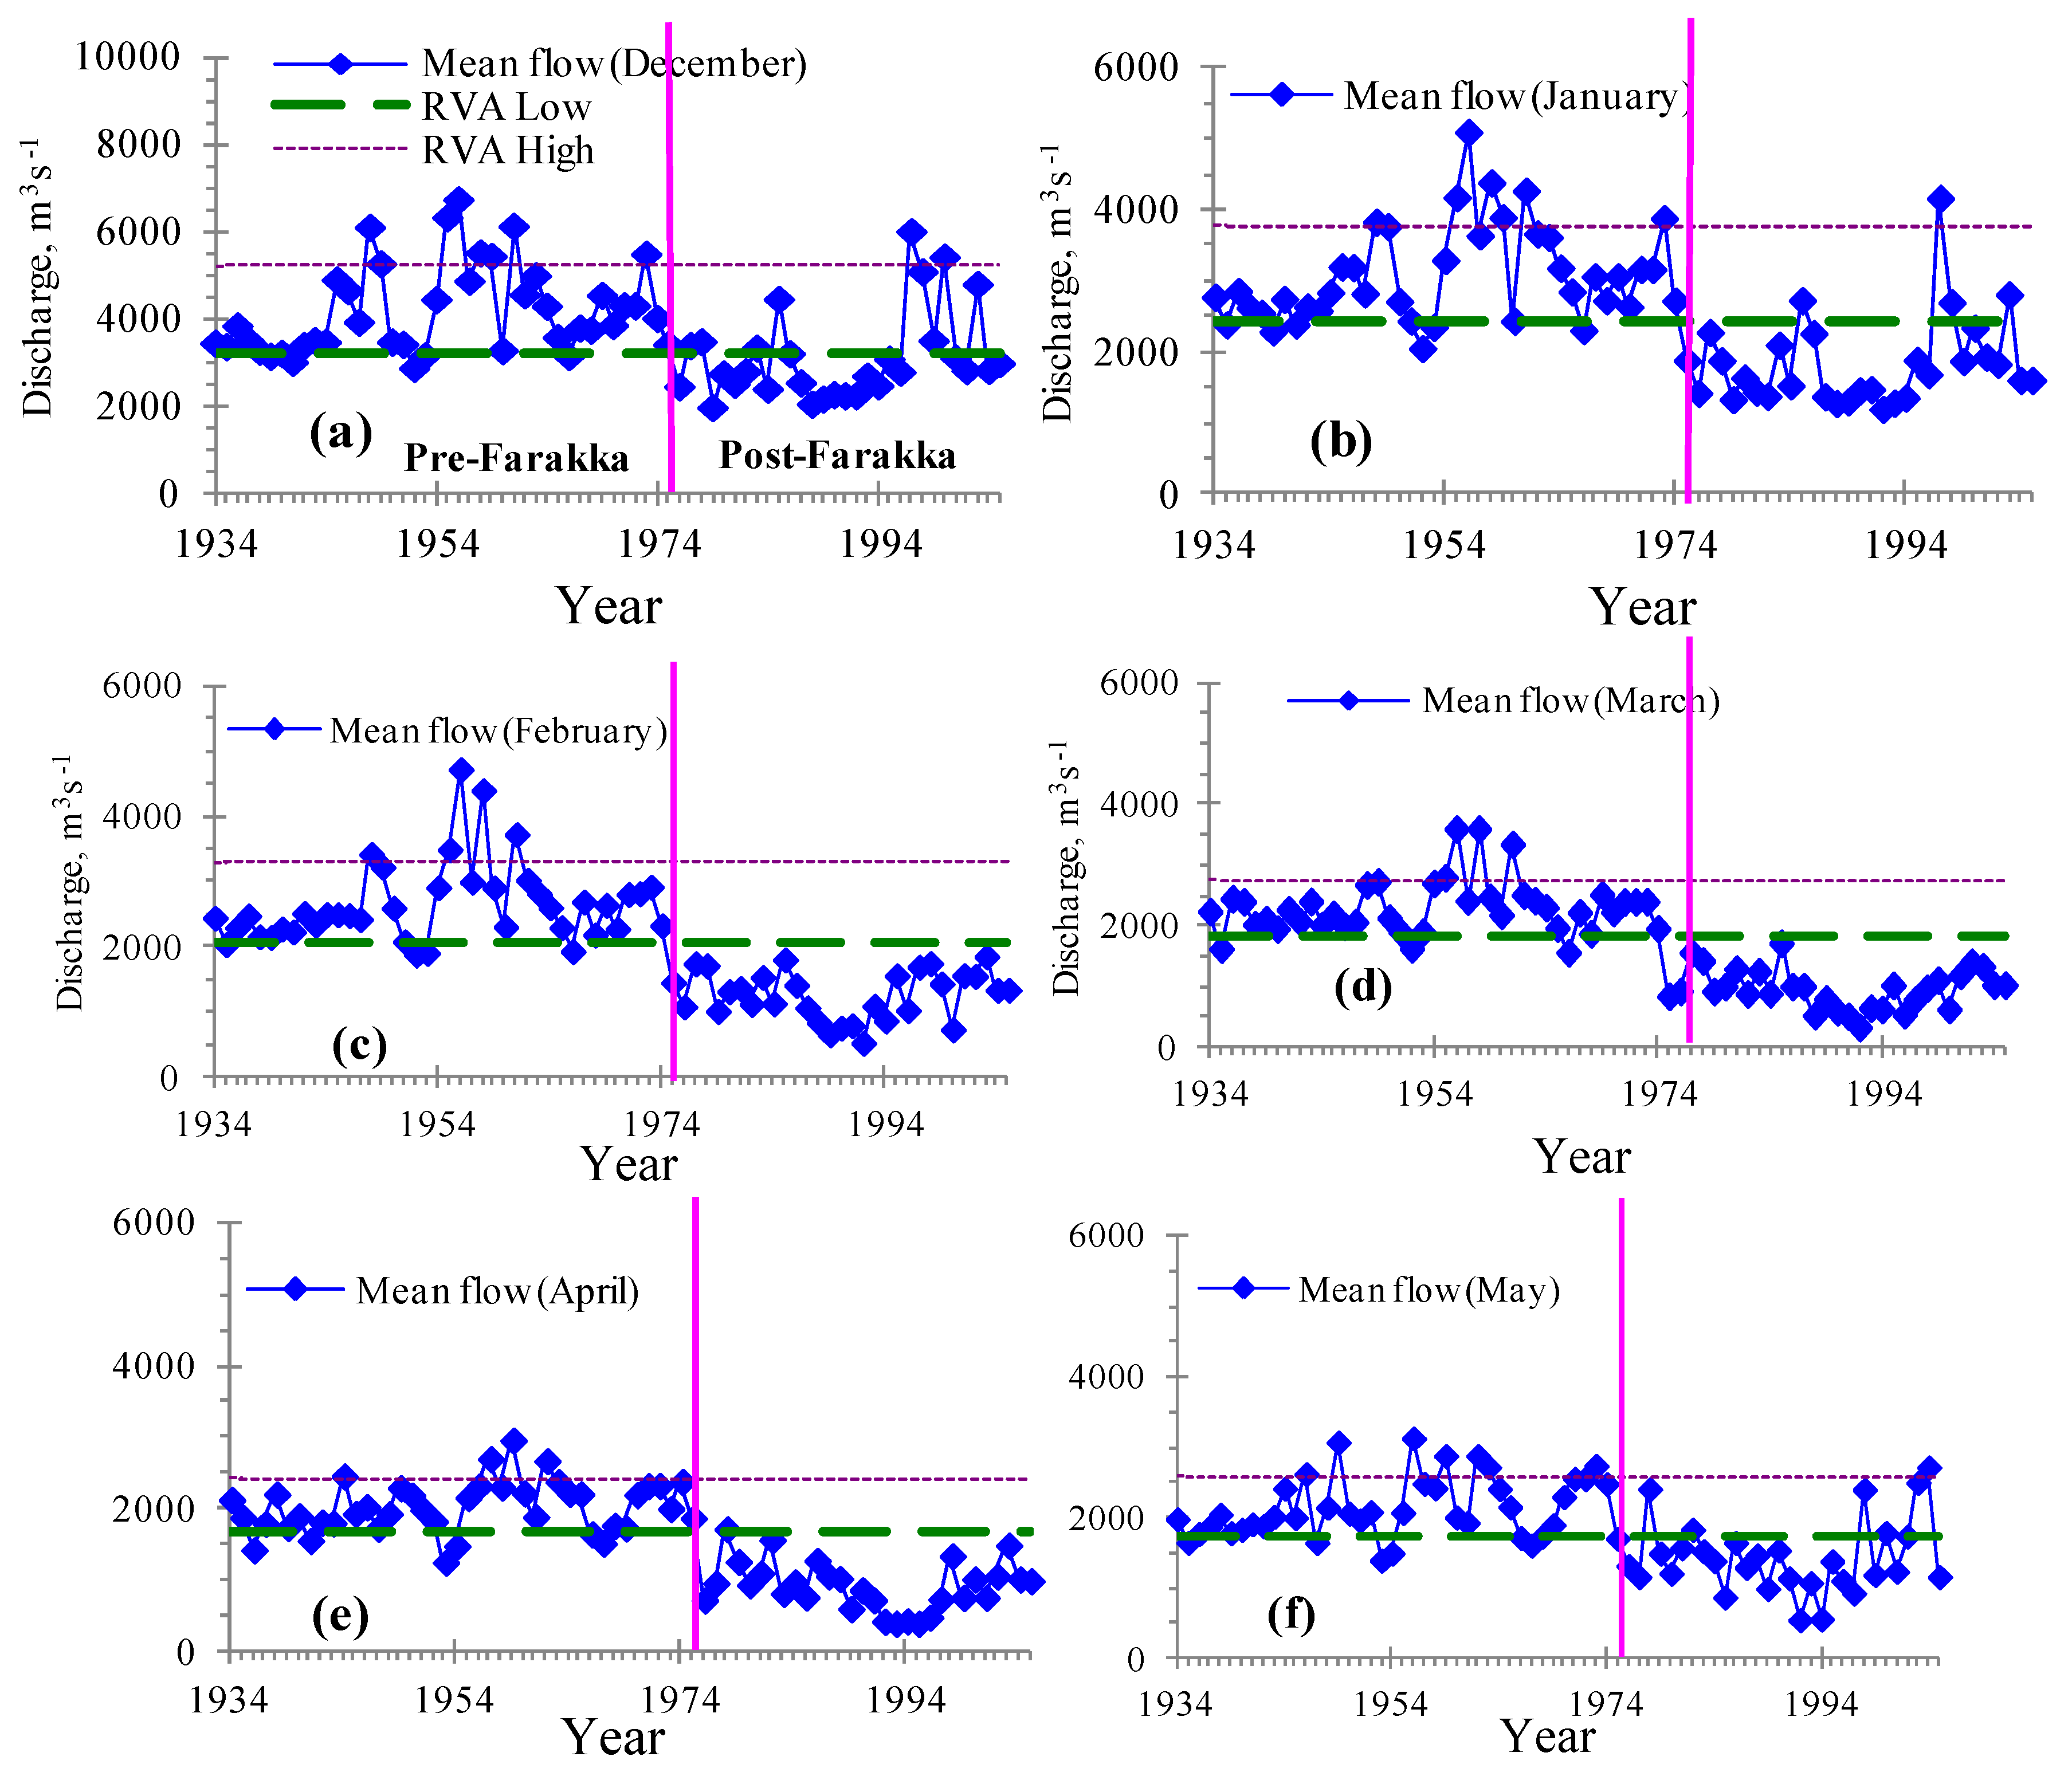
4.2. Investigation of the Effects of Farakka Dam

Once the threshold for ecological flow has been determined, the extent of alteration due to water diversion post-Farakka is subsequently analyzed. To investigate the impact of the Farakka Dam, hydrological discharge for 31 years (from 1975 to 2005) was analyzed. The rate of exceedance of RVA threshold values for the post-Farakka flow regime was calculated by counting the number of years that would have failed to meet the threshold conditions. This calculation is carried out for each of the twenty two parameters. A summary of the results is shown in Column 4 of Table 3. In both dry and wet months, the flow was altered remarkably. Particularly in dry periods (especially in February and March), 100% of the post-Farakka periods (1975–2005) would have failed to meet the thresholds. Similarly, all of the years of the post-Farakka period failed to meet the lower threshold of the minimum flow parameters.
Table 3. Investigation of the failure (Column 4) of the RVA target of the post-Farakka period (1975–2005).
RVA ParametersThreshold Flow (m3·s−1) Based on the Data of Pre-Farakka PeriodFailure Rate of RVA Target at Post-Dam Period (1975–2005)
LowHigh
January2,4063,76090%
February2,0573,283100%
March1,8452,752100%
April1,6772,40694%
May1,7262,59681%
June3,0664,98268%
July12,89022,45361%
August29,69345,92436%
September27,89243,73158%
October10,60524,71732%
November4,6099,50748%
December3,1735,20871%
1-Day Minimum1,2312,123100%
3-Day Minimum1,4492,110100%
7-Day Minimum1,5242,124100%
30-Day Minimum1,5462,161100%
90-Day Minimum1,7932,452100%
1-Day Maximum40,77056,68342%
3-Day Maximum40,32756,40642%
7-Day Maximum39,01155,64945%
30-Day Maximum33,77649,91639%
90-Day Maximum25,94839,54632%
The results of the yearly annual minimum (Figure 1a) and maximum flow (Figure 1b) are shown in Figure 1. The results demonstrate that every year after the construction of Farakka Dam, annual minimum flow failed to meet the threshold limit. Similarly, annual maximum flows also failed to meet the threshold limit in the post-Farakka period. Therefore, both floods and droughts are seen to be more frequently occurring in the post-Farakka period.
Figure 1. Yearly minimum (a) and yearly maximum flow (b) for both the pre- and post-Farakka period and a comparison with the threshold value.
Water 06 02501 g001
The result for dry season months (from December to May) is shown in Figure 2, which illustrates that in January, February, March and April, the flow is reduced significantly. The result of wet season months (from June to November) is also plotted in the Figure 3. Among the wet months, the flow of the post-Farakka regime failed to meet the criteria in the early wet season (June and July) compared to the pre-Farakka period. However, in August, September and October, the river flow of the region is particularly dominated by monsoon rainfall, and about 70 percent of Bangladesh’s rain falls during this period. As a consequence, the construction of Farakka Dam has relatively less impact on the monsoon-dominated period. Therefore, the failure rate of the threshold criteria in the post-Farakka regime is not so high during these months, compared to other periods of the year.
Figure 2. Monthly mean flow for the dry months of December (a), January (b), February (c), March (d), April (e) and May (f) in the pre- and post-Farakka period and a comparison with the threshold value.
Water 06 02501 g002
Figure 3. Monthly mean flow for wet months of June (a), July (b), August (c), September (d), October (e) and November (f) in the pre- and post-Farakka period and a comparison with the threshold value.
Water 06 02501 g003

5. Impact of Hydrologic Alteration

The analysis of this study suggests that construction of the Farakka Dam in 1975 has caused considerable hydrologic changes in the lower Ganges River system, particularly in Bangladesh. The hydrologic alteration of flow due to water diversion at Farakka introduced a new ecological system against the usual course of nature. The risk of ecological change has been increased globally due to the alteration of hydrologic flow [56].
Under the flow alteration situation, several studies have assessed the social-ecological consequences. Swain [57] stated that the flow alteration brought much misery and hardship to approximately 35 million people in nearly one-third of the total area of Bangladesh, who are directly dependent on the Ganges Basin for their livelihood. This region is already vulnerable to cyclone and other manmade disasters [58,59], and the situation is more aggravated by the altered flow regime. A detailed investigation on Farakka water diversion-induced social-ecological consequences has been carried out by Adel [60]. The water diversion has caused the destruction of the breeding and raising grounds for 109 species of Gangetic fishes and other aquatic species and amphibians. In addition, it has disrupted the navigation and increased dependence on groundwater. A separate study undertaken by Hossain and Haque [61] found that more than 50 species have become rare, which were found abundantly in the research-covered areas during the pre-Farakka period.
Freshwater flowing from the Ganges through the Gorai-Madhumati channel, one of the distributaries of the Ganges, governs the state of the salinity of the southwest coastal region of Bangladesh. The ecological environment of the region depends on the complex interaction of fresh water and saline water. However, the reduction of the freshwater supply through the upstream Ganges water diversion increases the river salinity in the downstream. This has an implication on the reduction of fish and the agricultural diversity of that coastal region [51,62]. Increased salinity has also constrained the growth, survival and regeneration of major mangrove plants (e.g., Heritiera fomes). There are significant changes in the floral composition in the Sundarbans, the large mangrove forests [63]. The alteration of threshold flow-induced ecosystem degradation can result in a reduced availability of ecosystem goods and services, on which particularly poor communities may depend for their well-being [64,65].
Bangladesh being a predominantly agrarian economy, water is critical for irrigated agriculture in the Ganges-dependent area. The Ganges-Kobadak (GK) Irrigation Project, the largest surface water irrigation project in the country, was conceived of in 1954 to improve the quality of life and economic solvency of the people living in southwest region by achieving self-sufficiency in food through increasing agricultural productivity. After the Farakka Barrage went into operation, the drastic fall in the available surface and ground water for farming led to a steady decline of rice production in the southwest region of Bangladesh [45]. As a consequence, the Ganges-Kobadak Irrigation Project came to a halt in 1994, which adversely affected 350,000 acres of agricultural lands [66]. The reduced potential of agricultural production conditions put approximately 10 million subsistence farmers out of work in the dry season, which has a negative impact on food security and livelihood opportunities [67]. In addition, increasing pressures of frequent disasters (e.g., cyclones, floods) along with human interventions (e.g., construction of embankments in 1960s) have created hardship for peoples’ livelihoods in the southwest region of Bangladesh [68,69]. Such hardship has particularly affected poor women, who have the least amount of resources to address the collapse of livelihoods and increasing poverty [66].
These socio-economic, as well as ecological consequences of the Farakka Barrage in the Ganges River Basin management have led to conflict between the Ganges states since 1951 [70,71]. In order to resolve the conflict, the Government of Bangladesh and the Government of India adopted a water sharing treaty in 1996 for sharing the dry season flow of the Ganges River at Farakka [40,72]. However, the results of this study suggest that the agreement between India and Bangladesh did not provide minimum water for Bangladesh.

6. Conclusions

Our analysis showed that the RVA threshold criteria have been exceeded in most years during post-Farakka period, even after adopting a water sharing treaty between Bangladesh and India. The exceedance of threshold conditions is detrimental to both aquatic and terrestrial ecosystems on which the livelihood pattern of the inhabitants is dependent. As a consequence, the social-ecological system of the basin is negatively affected.
The approach of hydrologic threshold flow confirms its potential for use in planning and management of water resources, which have impacts on the coupled social-ecological system. The assessment of the hydrologic alteration of different parameters and of the ecological consequences of such an alteration presented in this study is intended to be used in planning and management of water resources, especially for post-Farakka water sharing between Bangladesh and India.
Our results have a number of policy-level implications for government agencies of the Ganges Basin. The calculated threshold flow of twenty-two RVA parameters can be used as initial targets for water resources and ecosystem management in the Lower Ganges Basin, particularly in Bangladesh. The government of Bangladesh and India could consider allowing human perturbation and development activities within the calculated threshold ranges. The calculated thresholds can also be used for water allocation to meet household, agriculture and industrial water demands. In trans-boundary river basin management within an integrated water resources management approach [71,72,73,74,75,76], thresholds of flow variability can be used as a basis for negotiation with other riparian countries. This simple, but effective, approach for evaluating the impact of dam-induced hydrologic alterations presented in this study may also prove to be useful to the policymakers and river basin authorities.
In setting ecological threshold flows with the RVA approach, the study is mainly based on statistics. However, further research is required to investigate the physical impact of the hydrologic flow regime on ecosystems in detail [55]. To ensure livelihood security in the lower Ganges ecosystem in both India and Bangladesh, there is a need for close introspection and appropriate action in a holistic manner to restore the hydrology of the river system [76,77,78]. In this study, we focused only on the impact of the dam on river flow thresholds. However, in reality, climate change and human-induced perturbation (e.g., development of river infrastructure, such as dams) happen concomitantly and interactively [8]. The extent of hydrologic perturbation associated with human activities and climate change has already been assessed separately in several studies [8,23,29]. To investigate the combined impact of climate change and human-induced perturbation, future studies are required, aiming at a more in-depth understanding of the system.

Acknowledgments

The authors wish to thank the Bangladesh Water Development Board for providing necessary data. The authors thank the anonymous reviewers for their constructive comments. Part of this research was conducted at Ca’ Foscari University of Venice, whose financial support is gratefully acknowledged.

Author Contributions

The Authors share the responsibility of the paper, in particular Animesh K. Gain was responsible for designing the research and analyzing the hydrologic parameters, while Carlo Giupponi contributed in analyzing social and ecological consequences of hydrologic alterations. Both authors were involved in writing manuscript.

Conflicts of Interest

The authors declare no conflict of interest.

References

  1. Gallopín, G.C. Linking between vulnerability, resilience and adaptive capacity. Glob. Environ. Chang. 2006, 16, 293–303. [Google Scholar] [CrossRef]
  2. Ostrom, E. A general framework for analyzing sustainability of social-ecological systems. Science 2009, 325, 419–422. [Google Scholar] [CrossRef]
  3. Gleick, P.H. Global freshwater resources: Soft-path solutions for the 21st century. Science 2003, 302, 1524–1528. [Google Scholar] [CrossRef]
  4. Millennium Ecosystem Assessment. In Ecosystem and Human Wellbeing: Current State and Trends; Island Press: Washington, DC, USA, 2005.
  5. Vörösmarty, C.J.; Mclntyre, P.B.; Gessner, M.O.; Dudgeon, D.; Prusevich, A.; Green, P.; Glidden, S.; Bunn, S.E.; Sullivan, C.A.; Liermann, C.R.; et al. Global freshwater resources: Soft-path solutions for the 21st century. Nature 2010, 467, 555–561. [Google Scholar] [CrossRef]
  6. Poff, N.L.; Matthews, J.H. Environmental flows in the Anthropocene: Past progress and future prospects. Curr. Opin. Environ. Sustain. 2013, 5, 667–675. [Google Scholar] [CrossRef]
  7. Sanz, D.B.; Garcίa del Jalόn, D.; Gutiérrez Teira, B.; Vizcaίno Martίnez, P. Basin influence on natural variability of rivers in semi-arid environments. Int. J. River Basin Manag. 2005, 3, 247–259. [Google Scholar] [CrossRef]
  8. Gain, A.K.; Apel, H.; Renaud, F.G.; Giupponi, C. Thresholds of hydrologic flow regime of a river and investigation of climate change impact—The case of lower Brahmaputra river Basin. Clim. Chang. 2013, 120, 463–475. [Google Scholar] [CrossRef]
  9. Poff, N.L.; Allan, J.D.; Bain, M.B.; Karr, J.R.; Prestegaard, K.L.; Brian, D.; Sparks, R.E.; Stromberg, J.C.; Richter, B.D. The natural flow regime—A paradigm for river conservation and restoration. BioScience 1997, 47, 769–784. [Google Scholar] [CrossRef]
  10. Olden, J.D.; Poff, N.L.; Bestgen, K.R. Life-history strategies predict fish invasions and extirpations in the Colorado River Basin. Ecol. Monogr. 2006, 76, 25–40. [Google Scholar] [CrossRef]
  11. Poff, N.L.; Richter, B.R.; Arthington, A.H.; Bunn, S.E.; Naiman, R.J.; Kendy, E.; Acreman, M.; Apse, C.; Bledsoe, B.P.; Freeman, M.C.; et al. The ecological limits of hydrological alteration (ELOHA): A new framework for developing regional environmental flow standards. Freshw. Biol. 2010, 55, 147–170. [Google Scholar] [CrossRef]
  12. Leopold, L.B.; Wolman, M.G.; Miller, J.P. Fluvial Processes in Geomorphology; W.H. Freeman and Sons: San Francisco, CA, USA, 1964. [Google Scholar]
  13. Tabacchi, E.; Correll, D.L.; Hauer, R.; Pinay, G.; Planty-Tabacchi, A.M. Development, maintenance and role of riparian vegetation in the river landscape. Freshw. Biol. 1998, 40, 497–516. [Google Scholar] [CrossRef]
  14. Cuny, F.C. Living with floods: Alternatives for riverine flood mitigation. Land Use Policy 1991, 8, 331–342. [Google Scholar] [CrossRef]
  15. Tockner, K.; Stanford, J.A. Riverine floodplains: Present state and future trends. Environ. Conserv. 2002, 29, 308–330. [Google Scholar]
  16. Smakhtin, V.U.; Shilpakar, R.L.; Hughes, D.A. Hydrology-based assessment of environmental flows: An example from Nepal. Hydrol. Sci. J. 2006, 51, 207–222. [Google Scholar] [CrossRef]
  17. Wharton, C.H.; Lambou, V.W.; Newsome, J.; Winger, P.V.; Gaddy, L.L.; Mancke, R. The fauna of bottomland hardwoods in the southeastern United States. In Wetlands of Bottom-Land Hardwood Forests; Clark, J.R., Benforado, J., Eds.; Elsevier: New York, NY, USA, 1981; pp. 87–160. [Google Scholar]
  18. Gain, A.K.; Giupponi, C.G.; Renaud, F.G. Climate change adaptation and vulnerability assessment of water resources systems in developing countries: A generalized framework and a feasibility study in Bangladesh. Water 2012, 4, 345–366. [Google Scholar] [CrossRef] [Green Version]
  19. Kundzewicz, Z.W.; Mata, L.J.; Arnell, N.W.; Döll, P.; Kabat, P.; Jiménez, B.; Miller, K.A.; Oki, T.; Sen, Z.; Shiklomanov, I.A. Freshwater resources and their management. In Climate Change 2007: Impacts, Adaptation and Vulnerability. Contribution of Working Group II to the Fourth Assessment Report of the Intergovernmental Panel on Climate Change; Parry, M.L., Canziani, O.F., Palutikof, J.P., van der Linden, P.J., Hanson, C.E., Eds.; Cambridge University Press: Cambridge, UK, 2007; pp. 173–210. [Google Scholar]
  20. Bates, B.C.; Kundzewicz, Z.W.; Wu, S.; Palutikof, J.P. Climate Change and Water; Technical Paper for Intergovernmental Panel on Climate Change; IPCC Secretariat: Geneva, Switzerland, 2008. [Google Scholar]
  21. Stocker, T.F.; Qin, D.; Plattner, G.-K.; Tignor, M.; Allen, S.K.; Boschung, J.; Nauels, A.; Xia, Y.; Bex, V.; Midgley, P.M. Climate Change 2013: The Physical Science Basis. Contribution of Working Group I to the Fifth Assessment Report of the Intergovernmental Panel on Climate Change; Cambridge University Press: Cambridge, UK, 2013. [Google Scholar]
  22. IPCC (The Intergovernmental Panel on Climate Change). Climate Change 2014: Impact, Adaptation and Vulnerability. Summary for Policymakers. Contribution of Working Group II to the Fifth Assessment Report of the Intergovernmental Panel on Climate Change; Cambridge University Press: Cambridge, UK, 2014. [Google Scholar]
  23. Ghanbarpour, M.R.; Zolfaghari, S.; Geiss, C.; Darvari, Z. Investigation of river flow alterations using environmental flow assessment and hydrologic indices: Tajan River Watershed, Iran. Int. J. River Basin Manag. 2013, 11, 311–321. [Google Scholar] [CrossRef]
  24. WCD (World Commission on Dams). Dams and Development: A New Framework for Decision Making; Earthscan: London, UK, 2000. [Google Scholar]
  25. Nilsson, C.; Reidy, C.A.; Dynesius, M.; Revenga, C. Fragmentation and flow regulation of the world’s large river systems. Science 2005, 308, 405–408. [Google Scholar] [CrossRef]
  26. Poff, N.L.; Hart, D.D. How dams vary and why it matters for the emerging science of dam removal. BioScience 2002, 52, 659–668. [Google Scholar] [CrossRef]
  27. Bunn, S.E.; Arthington, A.H. Basic principles and ecological consequences of altered flow regimes for aquatic biodiversity. Environ. Manag. 2002, 30, 492–507. [Google Scholar] [CrossRef]
  28. Richter, B.D.; Baumgartner, J.V.; Powell, J.; Braun, D.P. A method for assessing hydrologic alteration within ecosystems. Conserv. Biol. 1996, 10, 1163–1174. [Google Scholar]
  29. Richter, B.D.; Baumgartner, J.V.; Wigington, R.; Braun, D.P. How much water does a river need? Freshw. Biol. 1997, 37, 231–249. [Google Scholar]
  30. Richter, B.D.; Davis, M.M.; Apse, C.; Konrad, C. A presumptive standard for environmental flow protection. River Res. Appl. 2012, 28, 1312–1321. [Google Scholar] [CrossRef]
  31. Pegg, M.A.; Pierce, C.L.; Roy, A. Hydrological alteration along the Missouri River basin: A time series approach. Aquat. Sci. 2003, 65, 63–72. [Google Scholar] [CrossRef]
  32. Magilligan, F.J.; Nislow, K.H. Changes in hydrologic regime by dams. Geomorphology 2005, 71, 61–68. [Google Scholar] [CrossRef]
  33. Jiang, L.; Ban, X.; Wang, X.; Cai, X. Assessment of hydrologic alterations caused by the Three Gorges Dam in the Middle and Lower Reaches of Yangtze River, China. Water 2014, 6, 1419–1434. [Google Scholar] [CrossRef]
  34. Matthews, R.; Richter, B.D. Application of the indicators of hydrologic alternation software in environmental flow setting. J. Am. Water Resour. Assoc. 2007, 43, 1400–1413. [Google Scholar] [CrossRef]
  35. Pyron, M.; Neumann, L. Hydrologic alterations in the Wabash River Watershed, USA. River Res. Appl. 2008, 24, 1175–1184. [Google Scholar] [CrossRef]
  36. Zhang, Y.; Arthington, A.H.; Bunn, S.E.; Mackay, S.; Xia, J.; Kennard, M. Classification of flow regimes for environmental flow assessment in regulated rivers: The Huai River Basin, China. River Res. Appl. 2012, 28, 989–1005. [Google Scholar] [CrossRef]
  37. Smakhtin, V.U. Low flow hydrology: A review. J. Hydrol. 2001, 240, 147–186. [Google Scholar] [CrossRef]
  38. Gain, A.K.; Immerzeel, W.W.; Sperna Weiland, F.C.; Bierkens, M.F.P. Impact of climate change on the stream flow of the lower Brahmaputra: Trends in high and low flows based on discharge-weighted ensemble modelling. Hydrol. Earth Syst. Sci. 2011, 15, 1537–1545. [Google Scholar] [CrossRef] [Green Version]
  39. Mirza, M.M.Q. Diversion of the Ganges Water at Farakka and its effects on salinity in Bangladesh. Environ. Manag. 1998, 22, 711–722. [Google Scholar] [CrossRef]
  40. Rouillard, J.J.; Benson, D.; Gain, A.K. Evaluating IWRM implementation success: Are water policies in Bangladesh enhancing adaptive capacity to climate impacts. Int. J. Water Resour. Dev. 2014, 30, 515–527. [Google Scholar] [CrossRef]
  41. Chowdhury, M.R.; Ward, N. Hydro-meteorological variability in the greater Ganges-Brahmaputra-Meghna Basins. Int. J. Climatol. 2004, 24, 1495–1508. [Google Scholar] [CrossRef]
  42. Jain, S.K.; Kumar, V. Trend analysis of rainfall and temperature data for India. Curr. Sci. India 2012, 102, 37–49. [Google Scholar]
  43. Gain, A.K.; Hoque, M.M. Flood risk assessment and its application in the eastern part of Dhaka City, Bangladesh. J. Flood Risk Manag. 2013, 6, 219–228. [Google Scholar] [CrossRef]
  44. Gain, A.K.; Wada, Y. Assessment of future water scarcity at different spatial and temporal scales of the Brahmaputra River Basin. Water Resour. Manag. 2014, 28, 999–1012. [Google Scholar]
  45. Abbas, N.; Subramanian, V. Erosion and sediment transport in the Ganges River basin, India. J. Hydrol. 1984, 69, 173–182. [Google Scholar] [CrossRef]
  46. Abbas, B.M. The Ganges Water Dispute; University Press Limited: Dhaka, Bangladesh, 1984. [Google Scholar]
  47. Mirza, M.M.Q. Hydrological changes in the Ganges system in Bangladesh in the post-Farakka period. Hydrolog. Sci. J. 1997, 42, 613–631. [Google Scholar] [CrossRef]
  48. Governtment of the People’s Republic of Bangladesh GoB. Ganges Water Sharing Treaty; Government of the People’s Republic of Bangladesh Dhaka: Dhaka, Bangladesh, 1996. [Google Scholar]
  49. Milhous, R.T. Selected hydrological tools for in-stream flow analysis. In Proceedings of the 34th Annual American Geophysical Union (AGU) Hydrologic Days, CO, USA, 24–26 March 2014; Colorado State University; pp. 32–43.
  50. Kumar, V.; Jain, S.K. Trend in rainfall amount and number of rainy days in river basins of India (1951–2004). Hydrol. Res. 2011, 42, 290–306. [Google Scholar] [CrossRef]
  51. Gain, A.K.; Uddin, M.N.; Sana, P. Impact of river salinity on fish diversity in the south-west coastal region of Bangladesh. Int. J. Ecol. Environ. Sci. 2008, 34, 49–54. [Google Scholar]
  52. Poff, N.L.; Ward, J.V. Implications of streamflow variability and predictability for lotic community structure: A regional analysis of streamflow patterns. Can. J. Aquat. Sci. 1989, 46, 1805–1818. [Google Scholar] [CrossRef]
  53. Walker, K.F.; Sheldon, F.; Puckridge, J.T. A perspective on dryland river ecosystem. Regul. River 1995, 11, 85–104. [Google Scholar] [CrossRef]
  54. Olden, J.D.; Poff, N.L. Redundancy and the choice of hydrologic indices for characterizing streamflow regimes. River Res. Appl. 2003, 19, 101–121. [Google Scholar] [CrossRef]
  55. Monk, W.A.; Wood, P.J.; Hannah, D.M.; Wilson, D.A. Selection of river flow indices for the assessment of hydroecological change. River Res. Appl. 2007, 23, 113–122. [Google Scholar] [CrossRef]
  56. Poff, N.L.; Zimmerman, J.K.H. Ecological responses to altered flow regimes: A literature review to inform the science and management of environmental flows. Freshw. Biol. 2010, 55, 194–205. [Google Scholar] [CrossRef]
  57. Swain, A. Displacing the conflict: Environmental destruction in Bangladesh and ethnic conflict in India. J. Peace Res. 1996, 33, 189–204. [Google Scholar] [CrossRef]
  58. Mallick, B.; Vogt, J. Population displacement after cyclone and its consequences: Empirical evidence from coastal Bangladesh. Nat.Hazards 2014, 73, 191–212. [Google Scholar] [CrossRef]
  59. Akter, S.; Mallick, B. The poverty-vulnerability-resilience nexus: Evidence from Bangladesh. Ecol.Econ. 2013, 96, 114–124. [Google Scholar] [CrossRef]
  60. Adel, M.M. Effect on water resources from upstream water diversion in the Ganges basin. J. Environ. Qual. 2001, 30, 356–68. [Google Scholar] [CrossRef]
  61. Hossain, M.A.; Haque, M.A. Fish species composition in the river Padma near Rajshahi. J. Life Earth Sci. 2005, 1, 35–42. [Google Scholar]
  62. Gain, A.K.; Aryal, K.P.; Sana, P.; Uddin, M.N. Effect of river salinity on crop diversity: A case study of south west coastal region of Bangladesh. Nepal Agric. Res. J. 2007, 8, 35–43. [Google Scholar]
  63. Mirza, M.M.Q. The Ganges Water Diversion: Environmental Effects and Implications; Kluwer Academic Publisher: Dordrecht, The Netherlands, 2004. [Google Scholar]
  64. Meijer, K.S.; van Beek, E. A framework for the quantification of the importance of environmental flows for human well-being. Soc. Nat. Resour. 2011, 24, 1252–1269. [Google Scholar] [CrossRef]
  65. Hossain, M.S.; Hein, L.; Rip, F.I.; Dearing, J.A. Integrating ecosystem services and climate change responses in coastal wetlands development plans for Bangladesh. Mitig. Adapt. Strateg. Glob. Chang. 2013. [Google Scholar] [CrossRef]
  66. Sultana, F. Engendering a catastrophe: A gendered analysis of India’s river linking project. In Regional Cooperation on Transboundary Rivers: Impact of the Indian River-linking Project; Ahmed, M.F., Ahmad, Q.K., Khalequzzaman, M., Eds.; BAPA Press: Dhaka, Bangladesh, 2004; pp. 288–305. [Google Scholar]
  67. Opstal, E.V. O Mother, O Ganges! Water Reduction and Social Changes in Rural Southwest Bangladesh; Working Paper No. 3; Conflict Research Group, Ghent University: Ghent, Belgium, 2006. [Google Scholar]
  68. Mallick, B.; Rahaman, K.R.; Vogt, J. Social vulnerability analysis for sustainable disaster mitigation planning in coastal Bangladesh. Disaster Prev. Manag. 2011, 20, 220–237. [Google Scholar] [CrossRef]
  69. Zaman, M. Economic opportunities from Polders in Bangladesh. Int. J. Water Resour. Dev. 1983, 1, 197–204. [Google Scholar] [CrossRef]
  70. Kamruzzaman, M.; Beecham, S.; Zuppi, G.M. A model for water sharing in the Ganges River Basin. Water Environ. J. 2012, 26, 308–318. [Google Scholar] [CrossRef]
  71. Rahaman, M.M. Integrated Ganges Basin management: Conflicts and hope for regional development. Water Policy 2009, 11, 168–190. [Google Scholar] [CrossRef]
  72. Rahaman, M.M. Principles of transboundary water resources management and Ganges Treaties: An analysis. Int. J. Water Resour. Dev. 2009, 25, 159–173. [Google Scholar] [CrossRef]
  73. Gain, A.K.; Rouillard, J.J.; Benson, D. Can integrated water resources management increase adaptive capacity to climate change adaptation? A critical review. J.Water Resour.Prot. 2013, 5, 11–20. [Google Scholar] [CrossRef]
  74. Huq, N.; Hugé, J. “Greening” integrated water resources management policies for tackling climate change impacts: A call for sustainable development. In Climate Change and the Sustainable Use of Water Resources; Filho, W.L., Ed.; Springer: Berlin, Germany, 2012; pp. 173–183. [Google Scholar]
  75. Giupponi, C.; Sgobbi, A. Decision support systems for water resources management in developing countries: Learning from experiences in Africa. Water 2013, 5, 798–818. [Google Scholar] [CrossRef] [Green Version]
  76. Gain, A.K.; Schwab, M. An assessment of water governance trends: The case of Bangladesh. Water Policy 2012, 14, 821–840. [Google Scholar] [CrossRef]
  77. Sen, H.S. The drying up of River Ganga: An issue of common concern to both India and Bangladesh. Curr. Sci. India 2010, 99, 725–727. [Google Scholar]
  78. Gain, A.K.; Giupponi, C. A dynamic assessment of water scarcity risk in the Lower Brahmaputra River Basin: An integrated approach. Ecol. Indic. 2014, in press. [Google Scholar]

