Article

Multi-Variate Analyses of Flood Loss in Can Tho City, Mekong Delta

1
GFZ German Research Centre for Geosciences, Section 5.4 Hydrology, Potsdam 14473, Germany
2
Geography Department, Humboldt University, Berlin 12489, Germany
3
Southern Institute for Water Resources Research, Ho Chi Minh City 750062, Vietnam
4
Department of Computational Landscape Ecology, Helmoltz Centre for Environmental Research—UFZ, Permoserstr. 15, Leipzig 04318, Germany
*
Author to whom correspondence should be addressed.
Water 2016, 8(1), 6; https://doi.org/10.3390/w8010006
Submission received: 15 September 2015 / Revised: 26 November 2015 / Accepted: 16 December 2015 / Published: 25 December 2015

Abstract

:
Floods in the Mekong delta are recurring events and cause substantial losses to the economy. Sea level rise and increasing precipitation during the wet season result in more frequent floods. For effective flood risk management, reliable losses and risk analyses are necessary. However, knowledge about damaging processes and robust assessments of flood losses in the Mekong delta are scarce. In order to fill this gap, we identify and quantify the effects of the most important variables determining flood losses in Can Tho city through multi-variate statistical analyses. Our analysis is limited to the losses of residential buildings and contents. Results reveal that under the specific flooding characteristics in the Mekong delta with relatively well-adapted households, long inundation durations and shallow water depths, inundation duration is more important than water depth for the resulting loss. However, also building and content values, floor space of buildings and building quality are important loss-determining variables. Human activities like undertaking precautionary measures also influence flood losses. The results are important for improving flood loss modelling and, consequently, flood risk assessments in the Mekong delta.

1. Introduction

Floods are recurring natural phenomena [1]. Floods can be caused by extreme rainfall events, sometimes in combination with snow melt inland or by storm surges in coastal area [2]. Due to climate change, the frequency and intensity of extreme events is expected to increase globally, as reported in the fourth and fifth assessment reports of the Intergovernmental Panel on Climate Change (IPCC) [3,4]. In addition to extreme hydro-meteorological events, different anthropogenic activities, such as population growth, extensive urbanization, land use and poverty distribution, play an important role in producing catastrophic floods [5]. As a consequence, globally, the number of large inland flood catastrophes between 1996 and 2005 was twice as large, per decade, than between 1950 and 1980, while the economic losses increased by a factor of five [6].
The impacts of floods can be significantly reduced through a holistic approach to “flood risk management”. Flood risk management now is not only focused on technical measures, such as dyke systems, but also on reducing exposure and vulnerability [7,8]. The estimation of flood losses supplies crucial information to decision support and policy development in the fields of flood management [9]. Depending on the degree of monetization (i.e., characterized by market value) and the degree of physical contact with the hazard, flood losses can be classified into four categories: direct tangible, direct intangible, indirect tangible and indirect intangible losses [9,10]. Tangible losses can [11] be estimated in monetary terms (all marketable goods and services), but intangible losses have no market value, e.g., loss of life, losses to ecosystems. Direct losses are those resulting from the physical contact of flood water with humans, property or any other objects (e.g., structural losses to buildings). Indirect losses are induced by the direct impacts, but occur, in space or time, outside the flooded area (e.g., costs occurring longer after the flood event or outside the flood-affected area) [12]. The available methods for estimating flood losses are mainly focused on direct tangible losses of residential, industrial, agricultural and commercial sectors. Residential buildings are commonly strongly affected by floods [13,14].
Depending on the purposes, economic loss assessments can be categorized into ex ante assessments and ex post assessments. Using physical process-based models, ex ante assessments aim to evaluate potential economic losses prior to possible events, while, ex post assessments are carried out in the after-math of an event. Until recently, most economic analysis guidelines mainly addressed ex ante assessments, while ex post assessments are not as well developed [14].
Flood losses are influenced by many variables, such as flood depth, flow velocity, flood duration, contamination, sediment concentration, lead time and information content of flood warning, building characteristics (elevation, structure, etc.) and the quality of external response in a flood situation [9]. However, most available loss models consider the water depth as the most important variable for economic loss assessments [13,15].
Stage-damage functions are a popular and simple method for loss assessment; however, studies have shown that they are associated with large uncertainty because the single variable only explains a part of the data variance [15,16,17,18]. Direct flood loss to buildings is influenced by more variables than inundation depth and building characteristics. For instance, flow velocity and flood duration are considered as influencing variables in the loss model HIS-SSM (High Water Information System-Damage and Casualties Module) [19]. In a study in Australia, Smith [20] found that warning time and type of building and content play a significant role in flood losses. The important roles of flood warning and preparedness in reducing flood losses are confirmed in studies in America [21,22]. Loss-determining variables can be classified into impact and resistance variables. Impact variables reflect the characteristics of the flood event at the affected object, while resistance variables reflect the characteristics of a flood-prone object. For example, flood experience, mitigation measures and early warning influence the resistance [12,15,23,24].
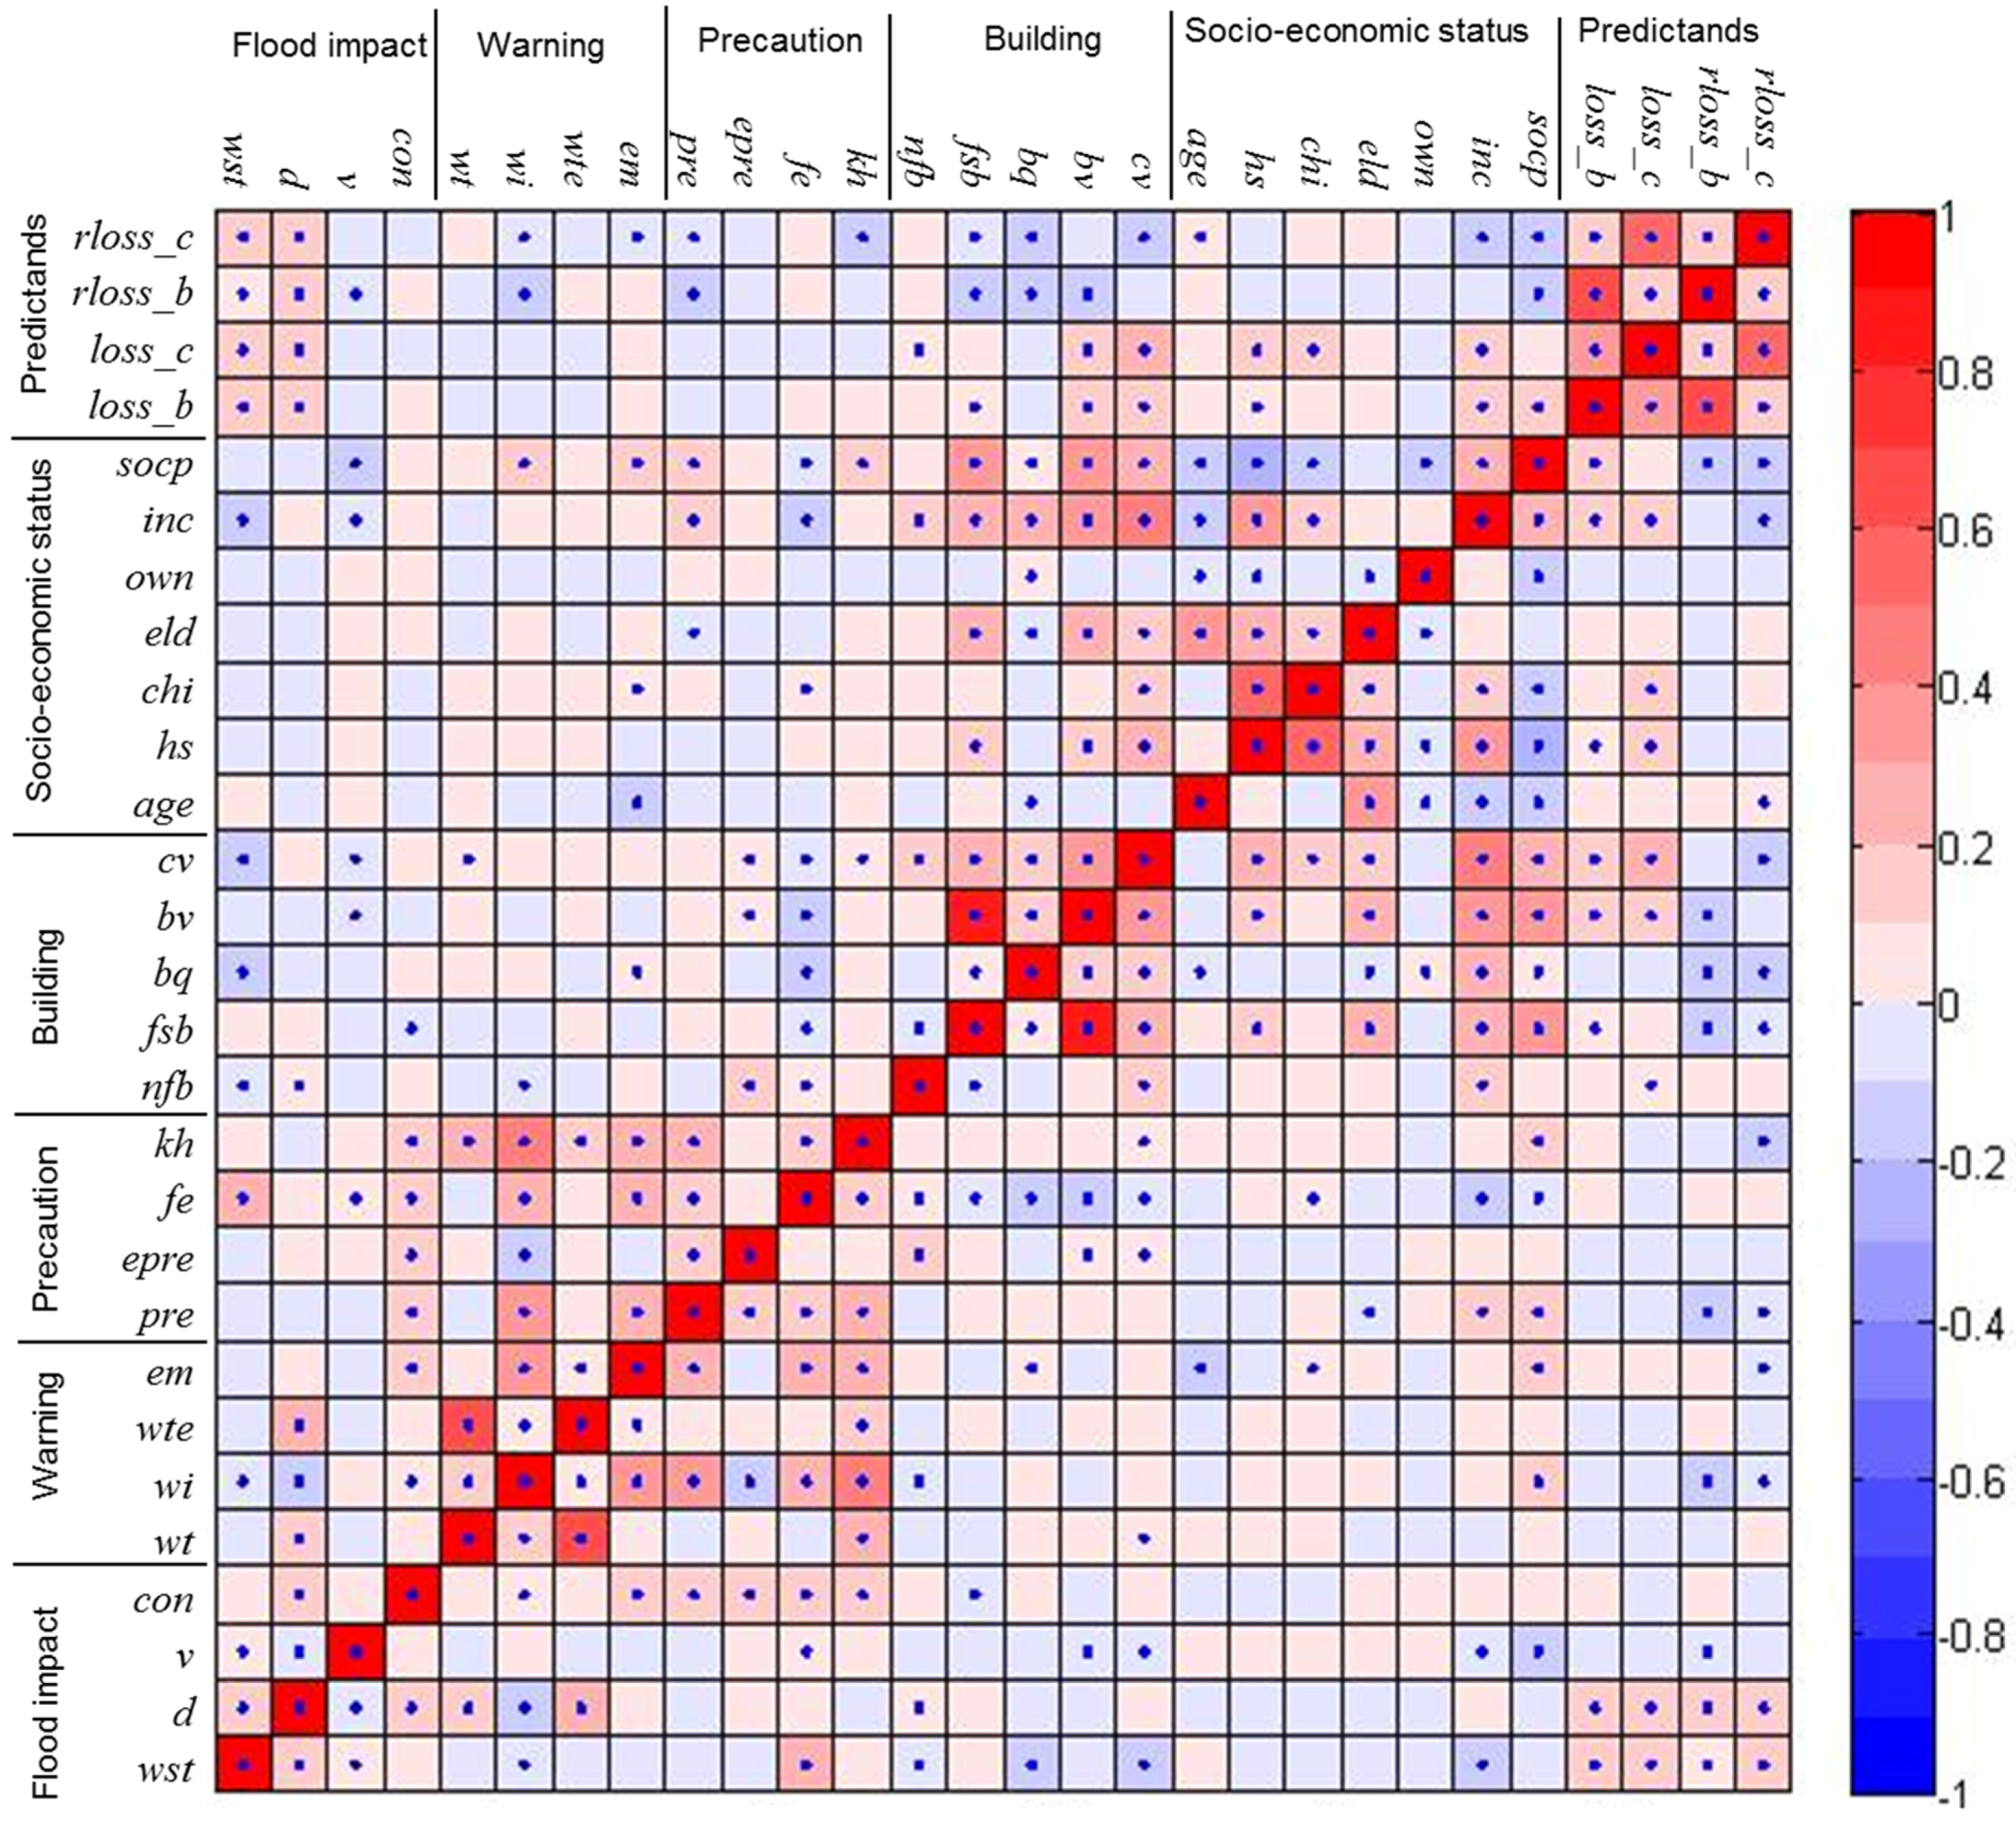
Quantifying the single and joint effects of these variables on flood losses is an important aspect for flood loss assessments and can be effectively undertaken by multi-variate loss analyses [15,18,24]. A study based on loss data from the 2002, 2005 and 2006 floods in Germany revealed that the most important loss-influencing variables were water depth, floor space of building, flood return period, building value, contamination, inundation duration, precautionary measures and flow velocity [18].
However, such a multi-variate analysis of flood loss data has so far not been undertaken for flooding in the Mekong delta. Vietnam, in the Mekong delta, is an example where floods occur on a recurring basis during the wet season (from July to November). The monsoon causes long-lasting floods and widespread inundations [25]. Most of the settlements and infrastructures are located along river banks or flood protection dykes, so that floods lead to damage to exposed people, assets and infrastructures [26]. Sea level rise and increased precipitation during the wet season are expected to be pronounced in the south of Vietnam [27], resulting in increased frequency of flood hazards in the Mekong delta. In Can Tho city, the biggest city in the Mekong delta, sea level rise and precipitation increase in combination with urbanization is likely to significantly increase the pluvial flood risk [26]. The extreme flood in 2011, for example, caused significant losses to buildings, businesses and infrastructure [28]. Currently, there is no standard approach for flood loss assessments in the Mekong delta, including Can Tho city. Available loss assessment studies use stage-damage functions [19,29,30].
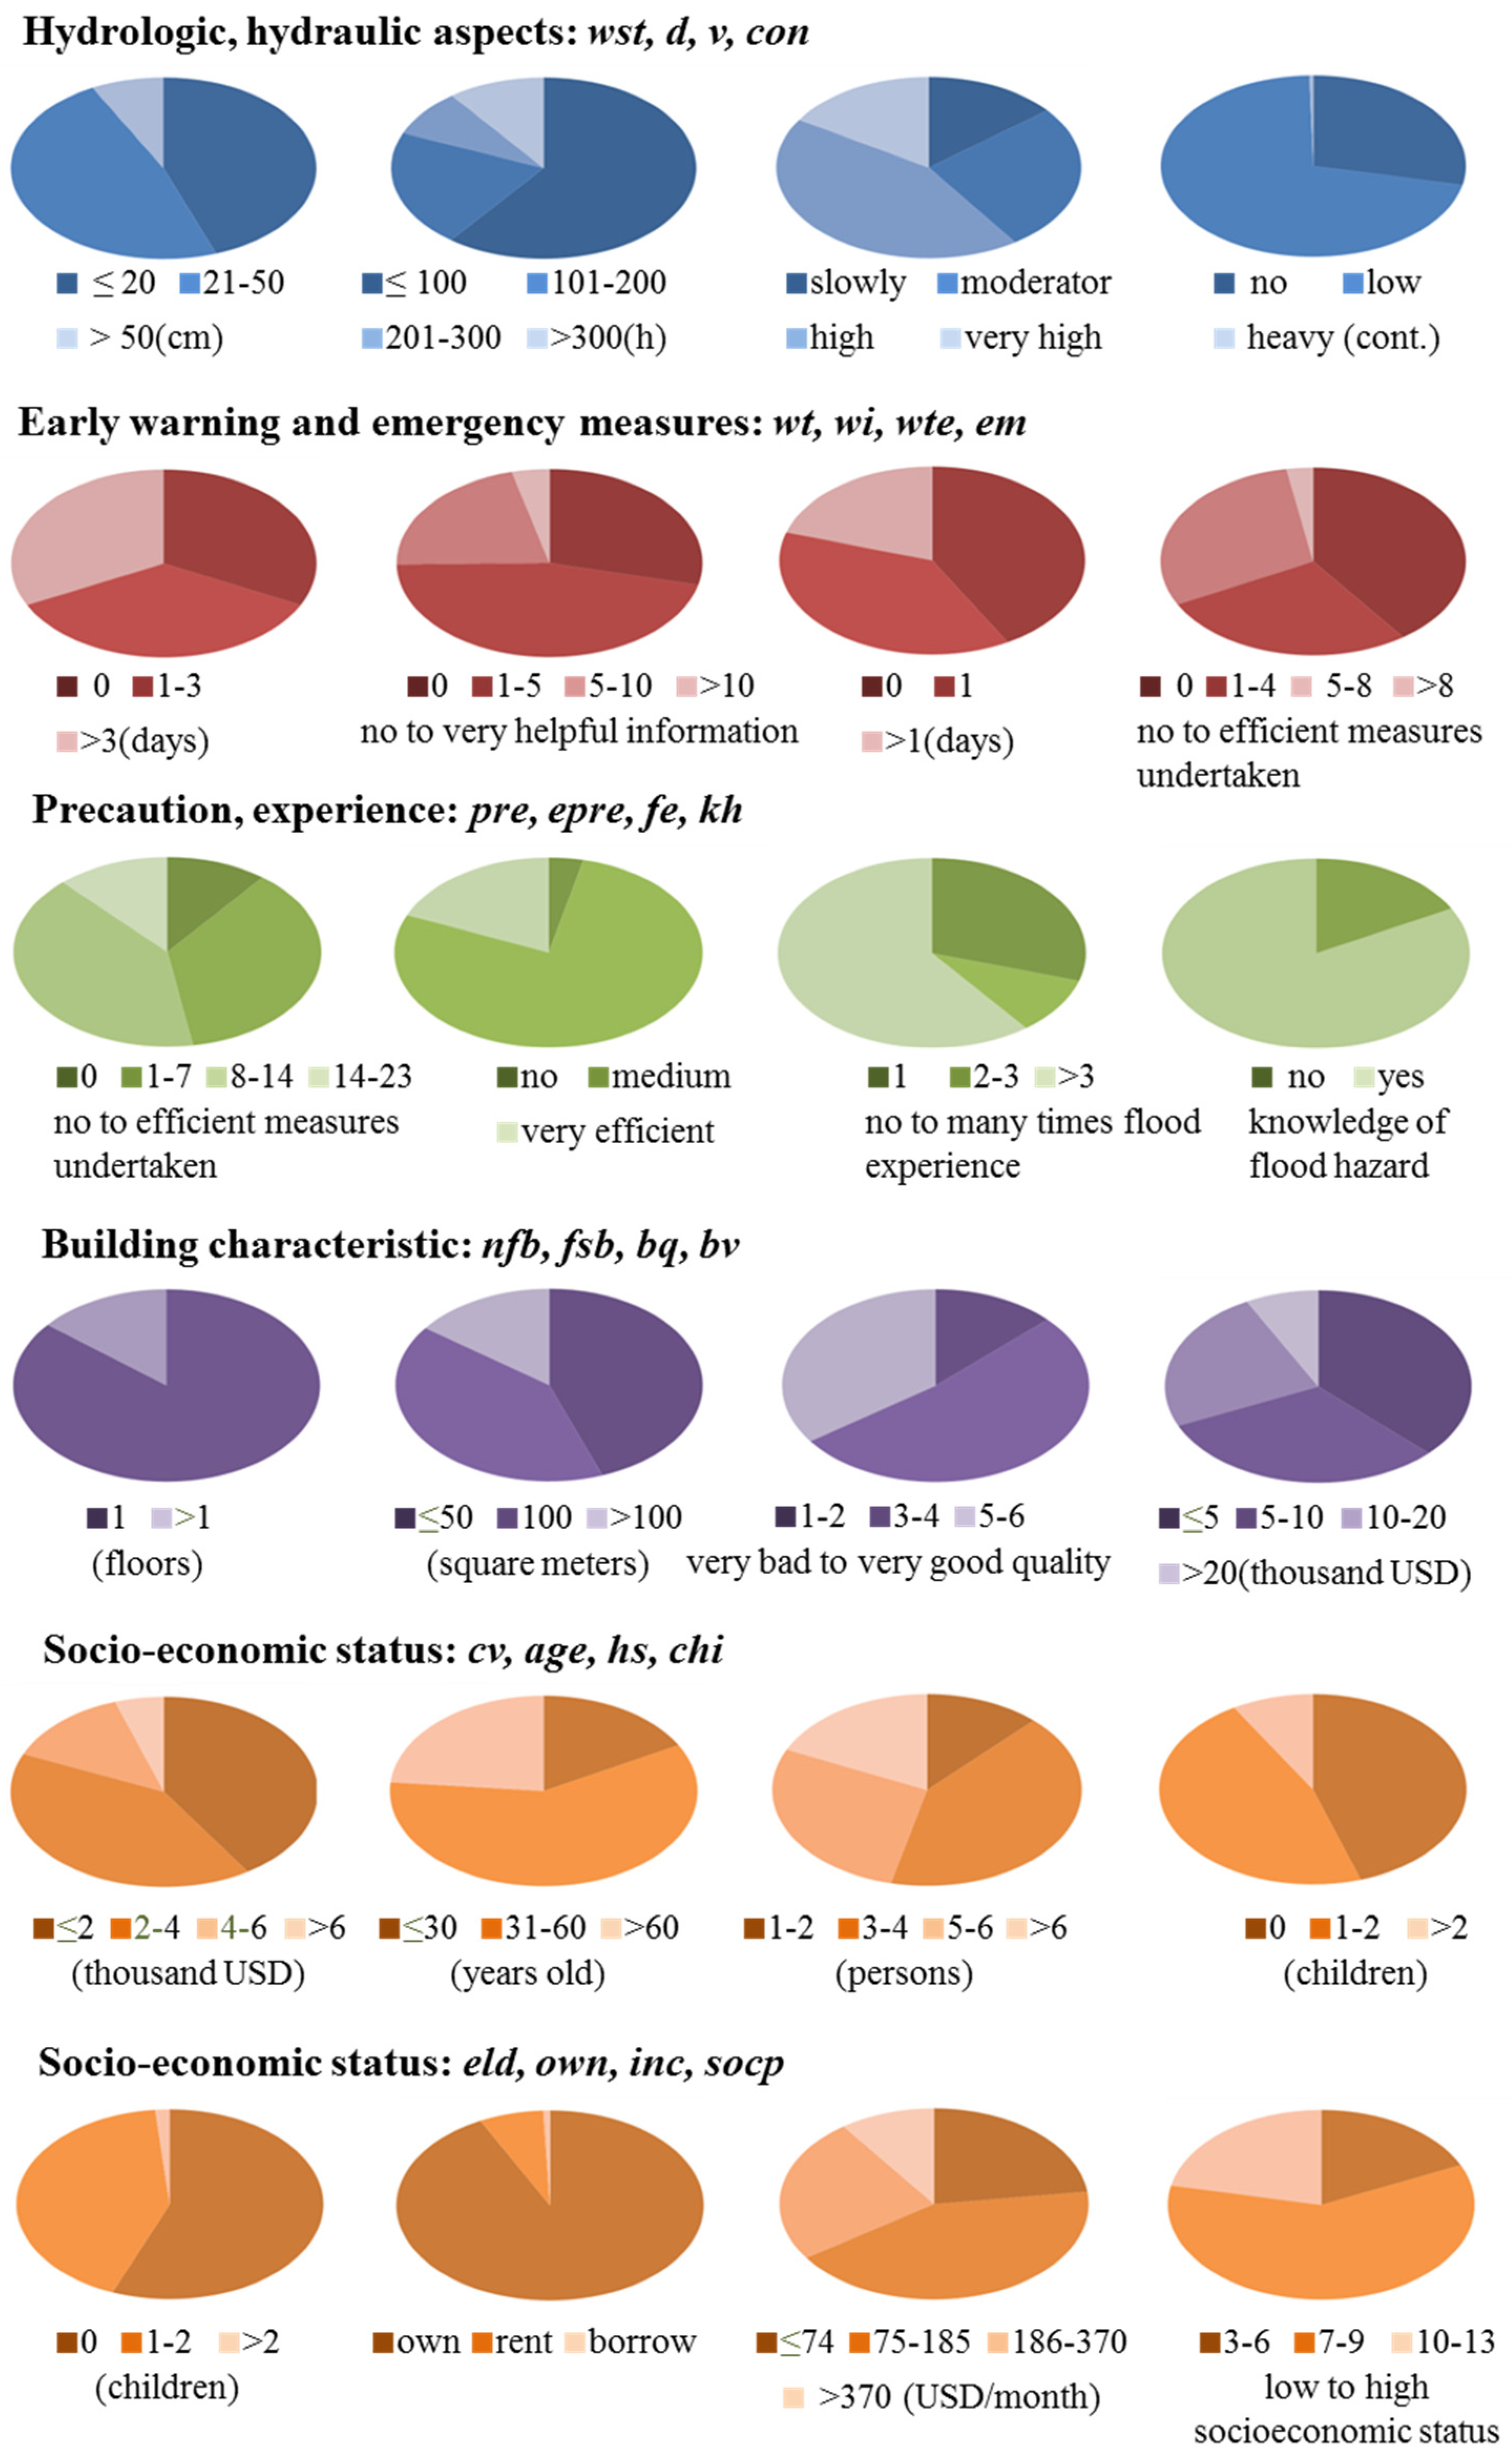
The objective of this study is to improve the quantitative knowledge about damaging processes and loss-determining variables for residential buildings in the Mekong delta, specifically in Can Tho city. The most important variables influencing flood losses are identified through multi-variate analysis considering 23 candidate predictors and the predictands for absolute flood loss of buildings and contents, as well as the loss ratio of buildings and contents. The loss data were compiled from interviews with 858 households and businesses damaged by the flood in 2011 in Can Tho city.

2. Study Area

In Can Tho city, riverine flood and tidal influences act together. River discharges are commonly high from September to November, whereas the flood tide is strong from October to January. The flood in 2011 was a severe one in Can Tho city causing great damage to agriculture, infrastructure, buildings and business. During the flood event in 2011, some areas close to the river were inundated continuously for nearly a month; other parts of Can Tho city were recurrently inundated for several months. Overall, about 27.8 thousand houses were inundated, and an economic loss of 11.3 million U.S. dollars occurred to buildings, infrastructure, agriculture and aquaculture [28].
Data collection was undertaken by interviews with 480 flood-prone households and 378 small businesses (which are located in a type of shop-house, including a living part and a business part) in four urban districts of Can Tho city, namely, NinhKieu, BinhThuy, Cai Rang and O Mon [28]. To identify the sample area, qualitative expert interviews were conducted with flood-damage experts and housing experts. A quantitative survey method was used for the household interviews. The questionnaire (online Supplementary Material) covered the following topics: characteristics of the 2011 flood event, flood preparedness, warning and emergency measures, losses to households’ content and building structure, risk perception, as well as socioeconomic characteristics of the respondents. Each topic contained several questions, and altogether, there were 70 questions for households and 88 questions for small business. For the interviews related to small business, the questionnaire consisted of two parts: questions related to the living part focusing on the building and contents and questions related to the business part focusing on goods, equipment and sale. In this paper, only answers to questions related to the living part were taken into account. Therefore, all data collected via household and business interviews were combined into one database containing information on flood losses to buildings and contents and potentially influencing variables. The interviews were undertaken in January to February 2012, right after the flood event. In order to improve the quality of the collected data, cross-checks between answers to different related questions were performed, for instance comparing estimates of losses with estimated building and content values. More details about the survey and collected data were published by Chinh et al. [28].

3. Materials and Methodology

3.1. Data Preparation and Analyses

Following the approach of Merz et al. [18] and based on data availability, 23 input variables (candidate predictors) were selected for the multi-variate statistical analysis. The selected variables potentially influence absolute or relative (loss ratio) “residential building losses” and “content losses”. The predictors are classified into five groups: hydrologic and hydraulic aspects (4 predictors), early warning and emergency measures (4 predictors), precaution and flood experience (3 predictors), building characteristic (4 predictors) and socioeconomic status (7 predictors) (Table 1). Values for 16 predictors (of 23) were directly taken from the interview answers. The remaining 7 predictors (inundation duration, indicator of warning information, indicator of emergency measures, indicator of precautionary measure, perception of efficiency of private precaution, building quality, building/content value, socioeconomic status) were transformed from several answers. A detailed picture of the variable characteristics is provided in Figure 1.
Table 1. Description of the 23 candidate predictors with value range and key statistics (type of scale: C, continuous; O, ordinal; N, nominal).
Groups#PredictorsAbbreviationType of RangeMean ValueSDAmount of Data
Hydrologic, hydraulic aspects1Water depthwstC: 2 cm to 120 cm above ground29.217.5857
2Inundation durationdC: 4 to 1040 h136.1167.3856
3Flow velocity indicatorvO: 1= calm to 5 = very high4.51858
4ContaminationconO: 0 = no contamination to 3 = heavy contamination0.70.5858
Early warning and emergency measures5Early warning lead timewtC: 0 to 60 day4.17.3853
6Indicator of flood warning informationwiO: 0 = no helpful information to 16 = very helpful information2.32.5858
7Lead time period elapsed without using it for emergency measurewteC: 0 to 30 day1.53.3858
8Emergency measures indicatoremO: 1 = no measure undertaken to 13 = many, efficient measures undertaken2.93.0858
Precaution, experience9Precautionary measure indicatorpreO: 0 = no measure undertaken to 23 = many, efficient measures undertaken8.05.3858
10Perception of efficiency of private precautionepreO: 1 = not efficient at all to 6 = very efficient3.90.8858
11Flood experience indicatorfeO: 0 = no flood experience to 5 = many times experience flood 3.51.8858
12Knowledge of flood hazardkhN: 0 = No, 1 = Yes 858
Building/content characteristic13Number of floors in buildingnfbC: 1 to 4 floors10.7858
14Floor space of buildingfsbC: 6 to 650 m276.189.9858
15Building qualitybqO: 1 = very bad to 6 = very good4.51.1858
16-1Building valuebvC: 342 to 14,2613 USD89399414855
16-2Content valuecvC: 95 to 42,290 USD29583117849
Socioeconomic status17Age of interviewed personageC: 14 to 88 year old50.513.2858
18Household size (number of people)hsC: 1 to 20 people52858
19Number of children (<12 years old) in householdchiC: 0 to 5 children11858
20Number of elderly persons (>60 years old) in householdeldC: 0 to 5 elderly persons11858
21Ownership structureownN: 1 = own, 2 = rent, 3 = borrow 858
22Monthly net income in classesincC: 1 = <500,000 to 7 = >20,000,000 VND 854
23Socioeconomic status according to Plapp [31]socpO: 4 = very low socioeconomic status to 13 = very high socioeconomic status8.21.7858
Figure 1. Characteristics of variables by pie diagrams. The colors from dark to light indicate the frequency of the (classified) variable values, in the case of ordinal-scaled variables from small to large values.
Water 08 00006 g001

3.1.1. Water Depth

The water depth value was provided by the interviewees by showing the highest water level during the flood season on the wall. This height, i.e., water depth, in the house above the ground floor was then estimated by the interviewer in centimeters. According to our survey, flood water depth was up to 50 cm for 92.3 percent of the households. Water depth was 50 to 100 cm for 7.6 percent of the households. Only one respondent reported that water depth in his house was 120 cm (Figure 1).

3.1.2. Inundation Duration

In Can Tho city in 2011, the inundation duration differed among areas. According to 97.5 percent of the people, the flood inundation duration was about 5 to 8 h per day during three to 10 days per month for a period of three to five months. Flood duration in the houses was influenced by tidal, pluvial or mixed floods. However, 2.5 percent of the interviewees reported continuous inundation of their house for a period of one to two months due to riverine floods or water backlogs. To be able to compare these different inundation characteristics, the variable “inundation duration” in hours was calculated as follows:
I n u n d a t i o n   d u r a t i o n   =   i n d u n d a t e d   h o u r s   p e r   d a y   × d a y s   p e r   m o n t h s × m o n t h s
Although the flooding period in Can Tho city lasted for several months, about 60% of households experienced inundation durations of less than 100 h.

3.1.3. Flow Velocity

In order to estimate the flow velocity, the interviewees were asked to rank the water flow around their house from calm to rapid flow. Additionally, interviewees were asked which material was deposited next to their house (mud, sand, gravel or stone), indicating calm, medium or high flow velocity. Based on the interviewees’ ranking of flow velocity and the transported material, the flow velocity is ranked again from calm to very high.

3.1.4. Contamination

Interviewees were asked which contamination of the flood water they realized on the basis of visual inspection and smell. Water contamination due to sewage, chemical, oil, petrol and fuel was considered. The different contaminants received weights from zero to three to represent the severity of the contamination (Table 2).
Table 2. Ranking of contamination.
Observed ContaminationWeightContamination Category
No contamination0No contamination
Sewage1Low
Chemicals3Medium
Oil, petrol, fuel5Heavy
As only a small number of households identified oil, petrol or fuel in the flood water, hardly any heavy contamination occurred (see Figure 1).

3.1.5. Building Value

Our survey provides information on house area in square meters, building material and number of floors. The building material of the wall, foundation, roof and floor was requested. Solid houses are made of bricks or concrete material, with tin, tile or concrete roofs. Most houses located nearby the river are built on wooden and concrete stilts and have wooden planks for the wall and floor. Based on the house material, the price per square meter is defined by the Can Tho city People Committee [32]. The building value is calculated by the function:
B u i l d i n g   v a l u e   =   A r e a × p r i c e
where, the building value is in USD; the living area of the interviewed households is in m2; the price is in USD per m2.
The values of the surveyed buildings range from 342 USD to 142,613 USD, with a mean value of 9257 USD (according to the exchange rate in 2011).

3.1.6. Building Quality

Based on building material and age of the house, indicators for building quality are defined. Wooden plank, tile or concrete are popular types of construction material in Can Tho city. Wooden material is less resistant to water compared to titled or concrete material. Concrete material has the best resistance to water. Thus, the weight of the house material ranged from one to three, from low to high quality (Table 3). The quality of building also depends on the age of houses. According to interview results, the houses usually were built from the 1960s. The weight for the house age is defined from one to three for the houses from old to new representing low to high quality of the houses (Table 3). The indicator for the quality of houses consist of the houses’ material and the houses’ age, ranging from one to six, representing the bad quality to the good quality of the house, respectively.
Table 3. Ranking of house quality by construction year and materials.
Construction MaterialsFloorConstruction YearWeightQuality of Houses
Wooden stilt, wooden plank wallGravelBefore 19801Low
Concrete or tiled stiltTiled1980 to 20002Medium
Concrete and tileConcreteAfter 20003High

3.1.7. Content Value

The contents of the house are items stored in the house, including furniture, vehicles and electric items. The interviewees provide the type of content and the quantity of each type. Because there is no regulation on the price of assets in a house, the price unit was taken from the broken items that were replaced. Some kinds of assets’ price, for example vehicles, was taken from the average market price.
Content value is calculated from the price of all of the assets in house by this function:
C o n t e n t   v a l u e   =   Ʃ   N o .   o f   a s s e t   ×   p r i c e   u n i t
The content value of the dataset is from 95 USD to 42,290 USD. The mean value of the content is 2405 USD.

3.1.8. Flood Warning Information

Flood warning could come from many sources, such as radio, newspapers, the Internet, neighbors, television and local government. The indicator value shows how reliable the information sources are, which is shown in Table 4.
Table 4. Reliability of information source.
Information SourceWeightReliability of Information
No information0No information
Neighbor, other1Low
Television, radio, newspaper, Internet3Medium
Local government5High
This question provided multi-choice answers. The warning indicator is summarized from all single-choice answers. The range of the flood warning information indicator was from 0 = no to 26 = perfect.

3.1.9. Emergency Measures

The interviews provide information about whether people undertook the emergency measures, such as saving valuables, moving vehicles, moving furniture, saving dangerous substances and pumping water out, against water infiltration or not. The weight for each measure was calculated by comparing between undertaken cases and not undertaken cases. Measures without showing a loss reduction have the weight “1”; measures showing a small loss reduction only for contents have the weight “2”; measures showing a loss reduction for both buildings and content have the weight “3”. Especially, the measures “others”, such as “cut off electricity supply” or “move pet to safe area”, showing a high loss reduction for buildings and contents have the weight “5” (see Table 5). The indicator of emergency measures was summarized from all of the measures, which were undertaken in houses ranging from zero to 13.

3.1.10. Precautionary Measures

The precautionary measures for flood losses include the information measures (e.g., gathered information about flood exposure or protecting the house), the adaptation measure (applied low value usage to flood-prone floor, acquired stationary or mobile water barriers to inhibit water infiltration in the house) and the building measure (elevated the house, used water-resistant building material for the house). By comparing the difference of the mean value of loss reduction between two groups (whether they applied or did not apply precaution measures), we have calculated the weight for each kind of precautionary measure (see Table 6). Measures without showing a loss reduction have the weight “1”; measures showing a small loss reduction only for contents have the weight “2”; measures showing a loss reduction for both buildings have the weight “3”. Especially, the measures “mobile barrier” and “use water resistant material” showing a high loss reduction for buildings in both absolute loss and the ratio loss have the weight “5”.
The value of the precautionary measures indicator ranges from zero to 23.
The perception of the efficiency of private precaution: This variable is the average value of all of the answers about the response efficacy, self-efficacy and response cost of households for the precautionary measures. From Figure 1, the medium efficiency of private precaution is the highest percentage of answers. Most of the interviewees ranked response cost as the thing that prevented them from preparing for the flood.
Flood experience and hazard knowledge: About 70% of households have experience with floods; this explained that most of interviewees answered that they have knowledge about flood hazards (Figure 1).

3.1.11. Socioeconomic Status

According to Plapp [31], applied by Thieken et al. [15], socioeconomic status was determined and classified by the variables of education, house area per person and ownership of a house. Each input item was interpreted as a rank scale with three to six classes (Table 7). The interviews provided information about education, including: never went to school, primary school, secondary school, high school, vocational, university and higher. The data also provided house area and the number of people living in a house, so that the house area per person was determined, which is from three to 500 square meters per person.

3.2. Statistical Methods

The effect of the single influencing variables on the different loss parameters was analyzed in the upper and the lower quartiles (0.75 and 0.25 quantiles, respectively). The Pearson correlation coefficient was used to investigate the correlations among the four dependent variables and the 23 explanatory variables. Statistic software SPSS 20 was used to calculate the Pearson correlation coefficient. A 5% significance level was used (p-value < 0.05).
Socioeconomic status was composed of the sum of ranks of its items. The value of the socioeconomic indicator according to Plapp [31] is from three to 13.
Table 5. Weight of emergency measures (n is the total number of cases; w is the weight for the indicator of the difference in losses; n(A) is the number of houses that did not apply measures; n(B) is the number of houses that applied measure; the difference in losses expresses the loss reduction between Group B and Group A; sig. is significance probability or p-value; a positive value means that the measure has no reduction in losses; a negative value means that the measure has a reduction in losses; the significance expresses the correlation coefficient between losses and measures).
Emergency Measure (Mean Value)n(A)n(B)Difference in Building Loss (USD)Sig. Building LossDifference in Building Loss RatioSig. Building Loss RatioDifference in Contents Loss (USD)Sig. Content LossDifference in Contents Loss RatioSig. Content Loss RatioW
Saving valuables435423136.910.020.010.032−1.840.146−0.020.513
Moving vehicle64920925.840.8970.000.50920.030.301−0.010.293
Moving furniture303554249.840.0010.030.00121.670.2540.010.441
Saving dangerous substances79266491.8500.060.001111.780.173−0.020.642
Pump water out677180325.120.0220.020.19642.020.0010.000.041
Against water infiltration661196283.250.0010.030.02119.210.562−0.010.992
Other83325−346.230.026−0.050.063−84.960.02−0.050.025
Table 6. Weight of precautionary measures (n is the total number of cases; w is the weight for the indicator of the difference in losses; n(A) is the number of houses that did not apply measures; n(B) is the number of houses that applied measure; the difference in losses expresses the loss reduction between Group B and Group A; sig. is significance probability or p-value; a positive value means that the measure has no reduction in losses; a negative value means that the measure has a reduction in losses; the significance expresses the correlation coefficient between losses and measures).
Precautionary Measure (Mean Value)n(A)n(B)Difference in Absolute Building Loss (USD)Sig. Building LossDifference in Building Loss RatioSig. Building Loss RatioDifference in Absolute Contents Loss (USD)Sig. Content LossDifference in Contents Loss RatioSig. Content Loss RatioW
Information hazard411446−66.580.077−0.030.0225.680.4520.010.313
Information exposure38147719.470.149−0.030.041−3.630.6520.020.813
Join network696162309.250.0720.010.36260.920.5240.000.901
Avoid expensive furniture580278−10.420.12−0.020.216−26.290.0140.010.023
Apply low value usage69816024.10.6180.020.626−50.490.0180.020.022
Mobile barrier448410−33.670.158−0.030.00310.760.4390.011.005
Elevated floor624234140.260.0650.010.30530.010.0280.000.071
Use water-resistant material758100−199.60.079−0.030.092−29.530.7250.010.715
Table 7. Rank scale of socioeconomic components.
EducationHouse Area/PersonOwnership of HousesWeight
Never went to schoolLower 0.25 quantilesBorrow1
Primary school completedLower 0.50 quantilesRent2
Secondary school completedLower 0.75 quantileOwn3
High school completedUpper 0.75 quantile-4
Vocational--5
University and higher--6
Multi-variate statistical analyses with tree-based approaches (decision trees, bagging decision trees) were used to identify the most important loss-influencing variables and their interaction. Decision tree approaches enable the analyses of continuous (e.g., water depth) and categorical variables (e.g., ownership structure). An important advantage is their ability to exploit the local relevance of variables, avoiding the need to find a parametric function that holds globally across all data. The MATLAB Statistics Toolbox was used, whose decision tree algorithms are based on Breiman et al. [33]. Bagging (bootstrap aggregation) decision trees are an ensemble of many regression trees, which are designed to improve the stability and accuracy in comparison to single regression trees. To bag a decision tree, many bootstrap replicas of the dataset are generated, and decision trees are grown on these replicas. Observations not considered in the replica are called out-of-bag for the tree. Out-of-bag prediction is estimated by averaging over predictions from all trees in the ensemble for which this observation is out of bag. It represents a quality measure of a bagging tree: the higher the increase of out-of-bag error, the more important the feature.
Principle component analysis with “varimax” rotation was used to investigate the correlation structure of the loss-influencing variables. The dimension of the dataset was reduced by using only the important influencing variables, which were selected from multi-variate statistic. Analysis was undertaken with SPSS software 20.

4. Results and Discussion

Through multi-variate statistical analysis, we analyze the correlations among potential flood loss predictors and their single and joint effects on loss parameters.

4.1. Importance and Relationship among Potential Flood Loss Predictors

4.1.1. Correlations between Variables

The Pearson correlation coefficient demonstrates the relationship among potential flood loss predictors and loss variables. Figure 2 shows the Pearson correlation coefficient of 23 candidate predictors and the loss ratio for building, the loss ratio for content, the absolute loss for buildings and the absolute loss for contents.
The flood impact variables have significant positive correlations with each other, except for flow velocity and inundation duration, which are negatively correlated. In general, the warning information variables have a significant negative correlation with flood impact variables; meanwhile, there is a significant positive correlation with precautionary variables. The building or content variables have a significant positive correlation with income and socioeconomic status variables. For example, warning information has a significant negative correlation with flood depth in house and inundation duration. Warning information has a significant positive correlation with precautionary measures, emergency measures, flood experience and knowledge of flood hazard. The lead time elapsed without using it for emergency measure has a significant positive correlation with early warning lead time. The building characteristic variables, such as building value and floor space of the building, have a significant correlation with the socioeconomic status variables, such as income or socioeconomic status. Instead of socioeconomic status, Merz et al. [18] showed for Germany that ownership of houses is the main variable influencing building value and the floor space of a building [18].
Figure 2. The Pearson correlation of 23 candidate predictors and four predictands for: absolute loss for buildings (loss_b); absolute loss for content (loss_c); loss ratio for buildings (rloss_b); loss ratio for content (rloss_c). The upper row contains the correlation between the candidate predictors and predictand. The red color indicates positive correlation, and the blue one indicates negative correlation. Significant correlation (p < 0.05) is marked by a dot.
Water 08 00006 g002
In general, the correlation coefficients of potentially loss-influencing variables and losses are quite low (Table 8). For building and content loss, the most strongly correlated variables are building or content value, flood duration and flood water depth. They are important in all models for absolute or ratio losses of building and content.
Table 8. The Pearson correlation coefficient of variables significantly correlated with absolute building loss, absolute content loss, building loss ratio and content loss ratio.
VariablesAbsolute Building LossBuilding Loss RatioAbsolute Content LossContent Loss Ratio
Water depth0.110.100.140.19
Duration0.140.140.160.16
Flood velocity−0.07−0.08−0.05−0.01
Precautionary measure−0.02−0.11−0.01−0.09
Floor space of building0.07−0.110.02−0.07
Building quality−0.04−0.15−0.02−0.14
Building/content value0.15−0.150.21−0.16
House size0.09−0.030.16−0.02
Income of households0.16−0.020.12−0.15
Socio−economic status0.15−0.130.05−0.11
In regard to the correlation coefficient of predictors and the building loss ratio (Figure 2), the building value and building quality have the highest absolute correlation toward the building loss ratio (−0.15), followed by duration (0.14), floor space of the building and precautionary measures (−0.11), in house water depth (0.10) and flow velocity (−0.08). Others variables have a small correlation coefficient to building loss ratio. In comparison with the analyses undertaken by Merz et al. [18] for Germany, the identified correlations for our loss data in Vietnam are much lower. In comparison, correlations found in the German loss data were as follows: coefficient between building loss ratio and water depth (0.50); duration (0.26); precautionary measure indicator (−0.23); and flow velocity (0.21)
Regarding to the Pearson correlation coefficient of predictors and absolute building loss, income of households has the highest absolute correlation to building loss (0.16); followed by building value and socioeconomic status (0.15); duration and emergency measures (0.14); water depth (0.11).
Figure 2 also shows the Pearson correlation coefficients of the predictors and content loss ratio. The water depth has the highest absolute correlation to the content loss ratio (0.19), followed by content value (−0.16) and duration (0.16), income of households (−0.15), building quality (−0.14) and precautionary measures and knowledge of hazard (0.12).
According to Figure 2, the Pearson correlation coefficient of predictors and absolute content loss is presented. The most influencing variable is content value, with a correlation coefficient of 0.21, followed by duration and house size (0.16), water depth (0.14) and income (0.12) and emergency measures (0.08).
To sum up, building or content value are most strongly correlated with relative or absolute losses to households. In regard to flood impact, duration has a higher correlation with building loss than water depth. Besides building or content value, also building quality is correlated with incomes, and precautionary measures contributed to mitigating the losses. Despite about 81% respondents applying at least one emergency measure, our analysis suggests that the emergency measures did not influence the losses. This result is also supported by the findings of Garschagen [34] that almost all of the affected households elevated their furniture and appliances within their houses. Only a few houses had upstairs, and they do not have such elevation; consequently, those measures were not effective for them.

4.1.2. Identification of Important Loss-Determining Variables

Bagging decision trees were used to identify the important variables influencing losses. The bagging decision tree was applied with 23 predictors. The minimum number of cases in terminal nodes was set to 30; the number of trees in the bagging decision tree ensemble is 200 until the model error became stable for the building loss ratio, the content loss ratio, absolute building loss and absolute content loss.
As indicated by the out-of-bag feature importance (Figure 3), there are several important variables influencing the building loss ratio, the content loss ratio, absolute loss for buildings and absolute loss for contents. The common important variables for all loss categories are duration, building or content value.
Figure 3. Out-of-bag feature importance for bagging decision tree building loss ratio (a); content loss ratio (b); absolute loss for building (c); absolute loss for content (d).
Water 08 00006 g003
As shown in Figure 3a, important variables influencing the building loss ratio are the building value (bv), duration (d), floor space of the building (fsb), flow velocity (v), flood experience (fe), precautionary measure (pre), socioeconomic status (socp) and water depth in the house (wst). In contrast, the analyses of Merz et al. in Germany revealed the water depth to be the most important variable influencing the building loss ratio, while flood experience indicated no influence. The particular flood characteristics of the flood events in Can Tho city and Germany define that difference. The flood event in Germany had a high water depth (reaching to 6.5 m) and a short duration (several days); however, the one in Can Tho city, with tidal influence, had a low water depth (most of the cases below one meter) and a long duration (several months).
Figure 3b shows the important variables influencing content loss ratios. The most important variable is content value (bv), followed by inundation duration (d), water depth in the house (wst), income of the household (inc), number of floors of the building (nfb), floor space of the building (fsb) and warning time (wt). Other variables are less important.
As shown in Figure 3c, the most important variables influencing absolute building loss are duration (d), followed by socioeconomic status (socp), income (inc), building value (bv), floor space of the building (fsb), water depth (wst) and flood experience (fe)
The variables influencing absolute content loss are flood duration (d), water depth in the house (wst), content value (cv), income of the household (inc), socioeconomic status (socp), floor space of the building (fsb) and knowledge of flood hazards (kh) (Figure 3d).
Summarizing the Pearson correlation coefficient and bagging decision tree analyses, inundation duration is the most important variable influencing flood loss in Can Tho city in the Mekong delta. This finding is different from the result of Penning-Rowsell [35] that the water depth is considered as a primary variable of flood losses to a building. Traditionally, depth-damage functions are used for flood loss estimation all over the world [9,20,36,37]. According to USACE (U.S Army Corps Engineers) [38], velocity is a major variable in damaging structures and contents. However, from the result in Figure 3b,d, flow velocity hardly influences content losses. Flow velocity has influence on the building loss ratio and a small influence on absolute building losses. This is in line with the result by Kreibich et al. [39] that the influences of flood velocity on the absolute building losses are weak. These findings are most likely due to the special flood situation in Can Tho city, with very low water depth, but very long (partly several months) flood durations.

4.2. Quantify of Single Influencing Variables

To gain more insight into the single and joint effects of these 10 most important loss-determining variables, the following further analyses were undertaken. The relation of each important variable for building loss, content loss, building loss ratio or content loss ratio is shown in Figure 4, Figure 5 and Figure 6. Single influencing variables are also quantified to determine how strongly each important influencing variable influenced the dependent variables. Principle component analysis with varimax rotation was used to investigate the correlation structure of the losses influencing variables.

4.2.1. Impact Variables: Water Depth, Duration, Flow Velocity

The impact variables, including duration, water depth and flow velocity, have an important influence on flood losses. Figure 4 shows the results from a single analysis between impact variables and dependent variables. The median ratio losses in all classes of the water depth, duration or flood velocity indicators are below the 0.75 quantile of the flood loss variables.
The water depth ranges from two to 120 cm above the ground. This was classified into six classes in the single analysis. The classification was based on the interval of water depth and also the amount of cases. Although the maximum value of the water depth is 120 cm, 7.5 percent of cases show a water depth above 50 cm, creating a specific group. In detail, the building loss ratio is increasing with the increase of the water depth up to the water depth class of 31 to 40 cm, then slowly reduces down to the water depth class of 41 to 50 cm and rises again. Similarly, the content loss ratio increases with the rise of the water depth up to the water depth class of 21 to 30 cm and reduces to the water depth class of 31 to 40 cm and then increases again.
Similarly, the rank of inundation duration value from four to 1040 h was formed into five classes, e.g., below 50 h, 51 to 100 h, 101 to 200 h, 201 to 300 h and above 300 h. The flood velocity was ranked from one equivalent for calm to six equivalent for torrential, which was reclassified into four classes: calm, slow, fast and very fast.
Flood duration has a positive relation with all building loss, content loss, the building loss ratio and the content loss ratio, and they increase continuously together with the increase of duration (Figure 4). For content loss and the building loss ratio, duration represented a clear linear relation; meanwhile, for the content loss ratio, duration showed a positively linear relation up to 300 h; after that, it became quite stable; for building loss, duration represented a positive relation up to 200 h and then a little bit negative for 200 to 300 h, then positive again above 300 h.
Flow velocity exhibited an influence on only the building loss ratio, and it does not influence other losses, such as building loss, content loss and the content loss ratio (Figure 4). The building loss ratio is high in slow and fast flood velocities, but low in calm or very fast flood velocities (Figure 4). This is different from the idea of Soetanto and Proverbs [40] that the higher the flow velocity of the floodwater, the greater the probability (and extent) of structural losses. This explained that the flood coming slowly and staying longer in the house actually generated more losses than when it came and withdrew quickly. Beside, with the complicated characteristics of the combination of flood tide and riverine flood in Can Tho city, the water not only comes from the door into house, but also from the sewage system with different velocities, making the flood velocity highly uncertain.
Figure 4. The relation between building loss, content loss, the building loss ratio and the content loss ration with water depth, duration and flood velocity. The horizontal lines represent the 0.25, 0.5 and 0.75 quantiles of the loss ratios of the total dataset.
Water 08 00006 g004

4.2.2. Resistance Variables: Building Value, Content Value, Floor Space of Building, Building Quality

From the Pearson analysis and bagging decision tree, the selected important influencing variables on building loss and the building loss ratio are building, floor space of the building and building quality; on content loss and the content loss ratio are content value and floor space of the building. The rank of the building value is from 342 USD to 145,465 USD, classified into six classes based on the interval and number of cases, such as to 2000 USD, above 2000 USD to 4000 USD, above 4000 USD to 6000 USD, above 6000 USD to 8000 USD, above 8000 USD to 12,000 USD and above 12,000 USD. Similarly, the content value was classified into five classes, and the floor space of the building was classified into three classes, while the building quality indicator was classified into four classes from bad to very good. Figure 5 shows the details of these relations.
All of the resistant variables related negatively to the building loss ratio and the content loss ratio. Figure 5 shows that the building value is inversely proportional with the building loss ratio, increasing of the building value causes the decreasing of the building loss ratio. It is also a similar situation with content value and the content loss ratio (Figure 5).
Figure 5. The relation between the building loss ratio and the content loss ration with building/content value, floor space of the building and building quality.
Water 08 00006 g005
Buildings with a bigger floor space experience a smaller loss ratio, but the absolute building loss seems stable with the different floor spaces of buildings. The better quality of a building helps to reduce the losses.

4.2.3. Human Activities: Precautionary Measures, Income and Socioeconomic Status

The important human activities influencing the building loss ratio and the content loss ratio are precautionary measures and socioeconomic status or income. The precautionary measures indicator is classified into four classes from zero to 23, such as: no precautionary measure (88 cases); indicator from one to five (208 cases); indicator from six to 10 (271 cases); indicator from 11 to 15 (207 cases); indicator above 15 (81 cases). The socioeconomic status is classified into four classes from zero to 13. Income is also classified into four classes, such as up to 100 US$ (196 cases); above 100 up to 250 US$ (363 cases); above 251 up to 500 US$ (210 cases); above 500 US$ (85 cases).
Precautionary measures represented a key role in loss mitigation. From Figure 6, one can see that when the precautionary measure indicator increases, the loss reduces.
Figure 6. The relation between the building loss ratio and the content loss ration with the precautionary measure indicator, socioeconomic status and income.
Water 08 00006 g006
The roles of income and socioeconomic status in loss mitigation are represented in Figure 6. The losses for content decrease with the increase of income. The socioeconomic status did not have a linear relation with losses. The losses decreased up to the socioeconomic status indicator equal to eight, and after that, it increased when the socioeconomic status indicator was above eight.

4.3. Quantification of the Joint Effect of the Influencing Variables

A principle component analysis was performed with the above nine important variables for building and content losses. The method is principle component analysis with varimax rotation. Significant principal components were extracted based on the Kaiser criterion and scree plot. For both building losses and content losses, four components were extracted.
For the important variables concerning the building losses, four components were extracted, explaining 63.73 percent of the total variance (Table 9). In the first component, variables concerning the building, such as the building value, floor space of the building, income and socioeconomic status, acquire high loadings. The second and third component is indicated by high loadings of water depth, flood duration and flow velocity, representing flood hazard. The fourth component is characterized by high loadings of precautionary measure, expressing human activities to mitigate flood losses. All of the variables show a correlation with one of the components. The building value shows the highest correlation with the first component. The table also shows that both absolute building loss and the building loss ratio correlated best with the first component, namely resistant variables.
Table 9. Component loading variables that probably influence building losses.
ItemComponent (858)
1234
Water depth in house (cm)−0.120.710.020.32
Flood duration by hours−0.030.550.590.12
Flow velocity−0.140.16−0.67−0.07
Building value in USD0.890.24−0.10−0.12
Floor space of building0.810.36−0.19−0.17
Building quality0.29−0.400.24−0.38
Precautionary measures0.21−0.37−0.120.79
Income0.55−0.290.250.07
Socioeconomic status0.63−0.05−0.030.30
Pearson correlation
Absolute building loss0.15 **0.12 *0.050.12 **
Building loss ratio−0.15 **0.13 **−0.09 *0.14 **
Notes: Extraction method: principal component analysis. Total variance explained 63.73%; a bold value indicates a variable with an absolute value ≥0.5; ** correlation is significant at the 0.01 level (2-tailed); * correlation is significant at the 0.05 level (2-tailed).
Table 10 shows the three extracted components, explaining 59.49 percent of the total variance. The first component is indicated by high loading of the content value, floor space of the building, socioeconomic status and income of the household, which are represent the household characteristics. The second component is characterized by high loadings of flood impact variables, such as water depth and flood duration. The third component is characterized by flow velocity. The fourth component is indicated by precautionary measures, which represent human activity to mitigate flood losses. Only building quality shows no high loading for any of the components. The flood duration shows the highest correlation with the second component, and then, the content value and income of the household show high correlation with the first component. The table also shows that the content loss ratio correlated best with the second component, namely impact variables, and absolute content loss correlated best with the first component, which represents the household characteristics.
The principle component shows that flood impact variables, such as duration and water depth, and building/content variables, such as building/content value, have the most influence on building/content losses.
Table 10. Component loading variables that influence content losses.
ItemComponent (858)
1234
Water depth in house (cm)−0.280.680.31−0.07
Flood duration by hours−0.020.70−0.41−0.13
Flow velocity−0.20−0.060.580.57
Building value in USD0.720.13−0.120.17
Floor space of building0.550.320.330.25
Building quality0.36−0.26−0.310.30
Precautionary measures0.27−0.260.38−0.65
Income0.720.01−0.140.06
Socioeconomic status0.600.110.34−0.22
Pearson correlation
Absolute content loss0.17 **0.11 **−0.06−0.14 **
Content loss ratio−0.14 **0.24 **−0.10 **−0.07 *
Notes: Extraction method: principal component analysis. Total variance explained 59.49%; a bold value indicates a variable with an absolute value ≥0.5; ** correlation is significant at the 0.01 level (2-tailed); * correlation is significant at the 0.05 level (2-tailed).

5. Conclusions

To improve the knowledge about damaging processes and to quantify the effect of the important loss-influencing variables, multi-variate statistical analysis is carried out for flood loss data from the 2011 flood in Can Tho city, the biggest city in the Mekong delta. For data collection, 858 flood-affected households and small businesses were interviewed.
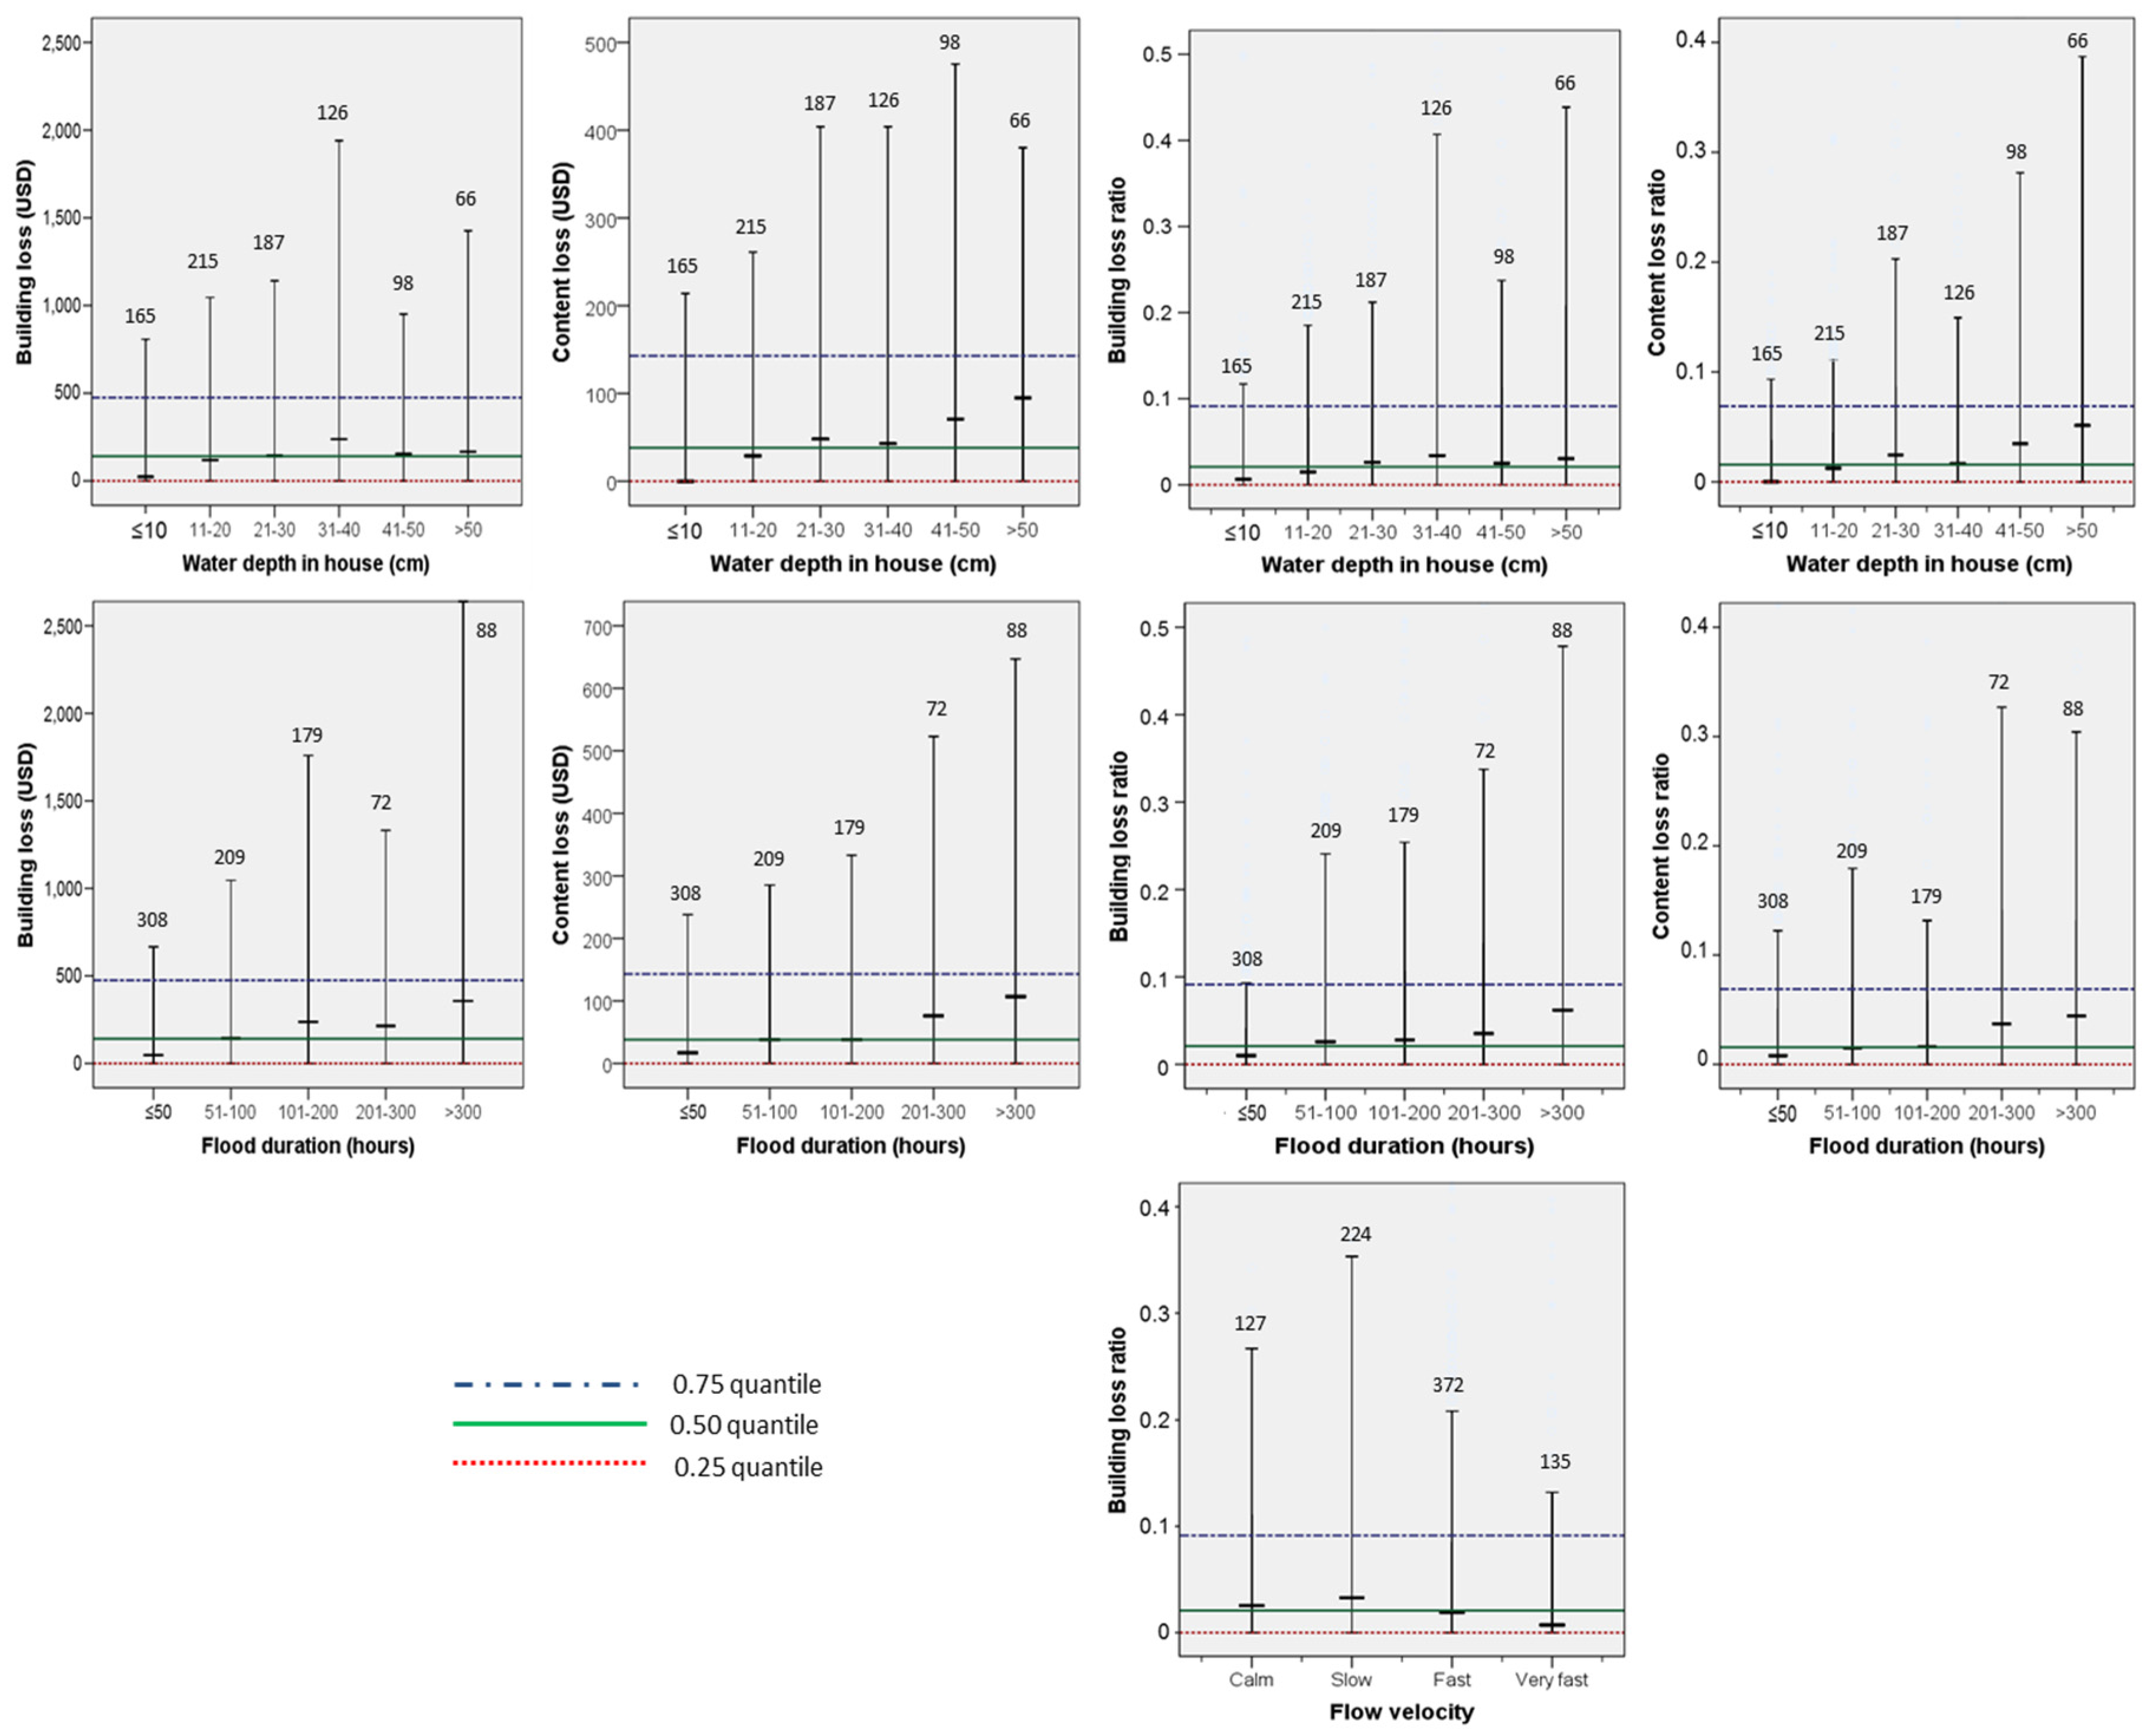
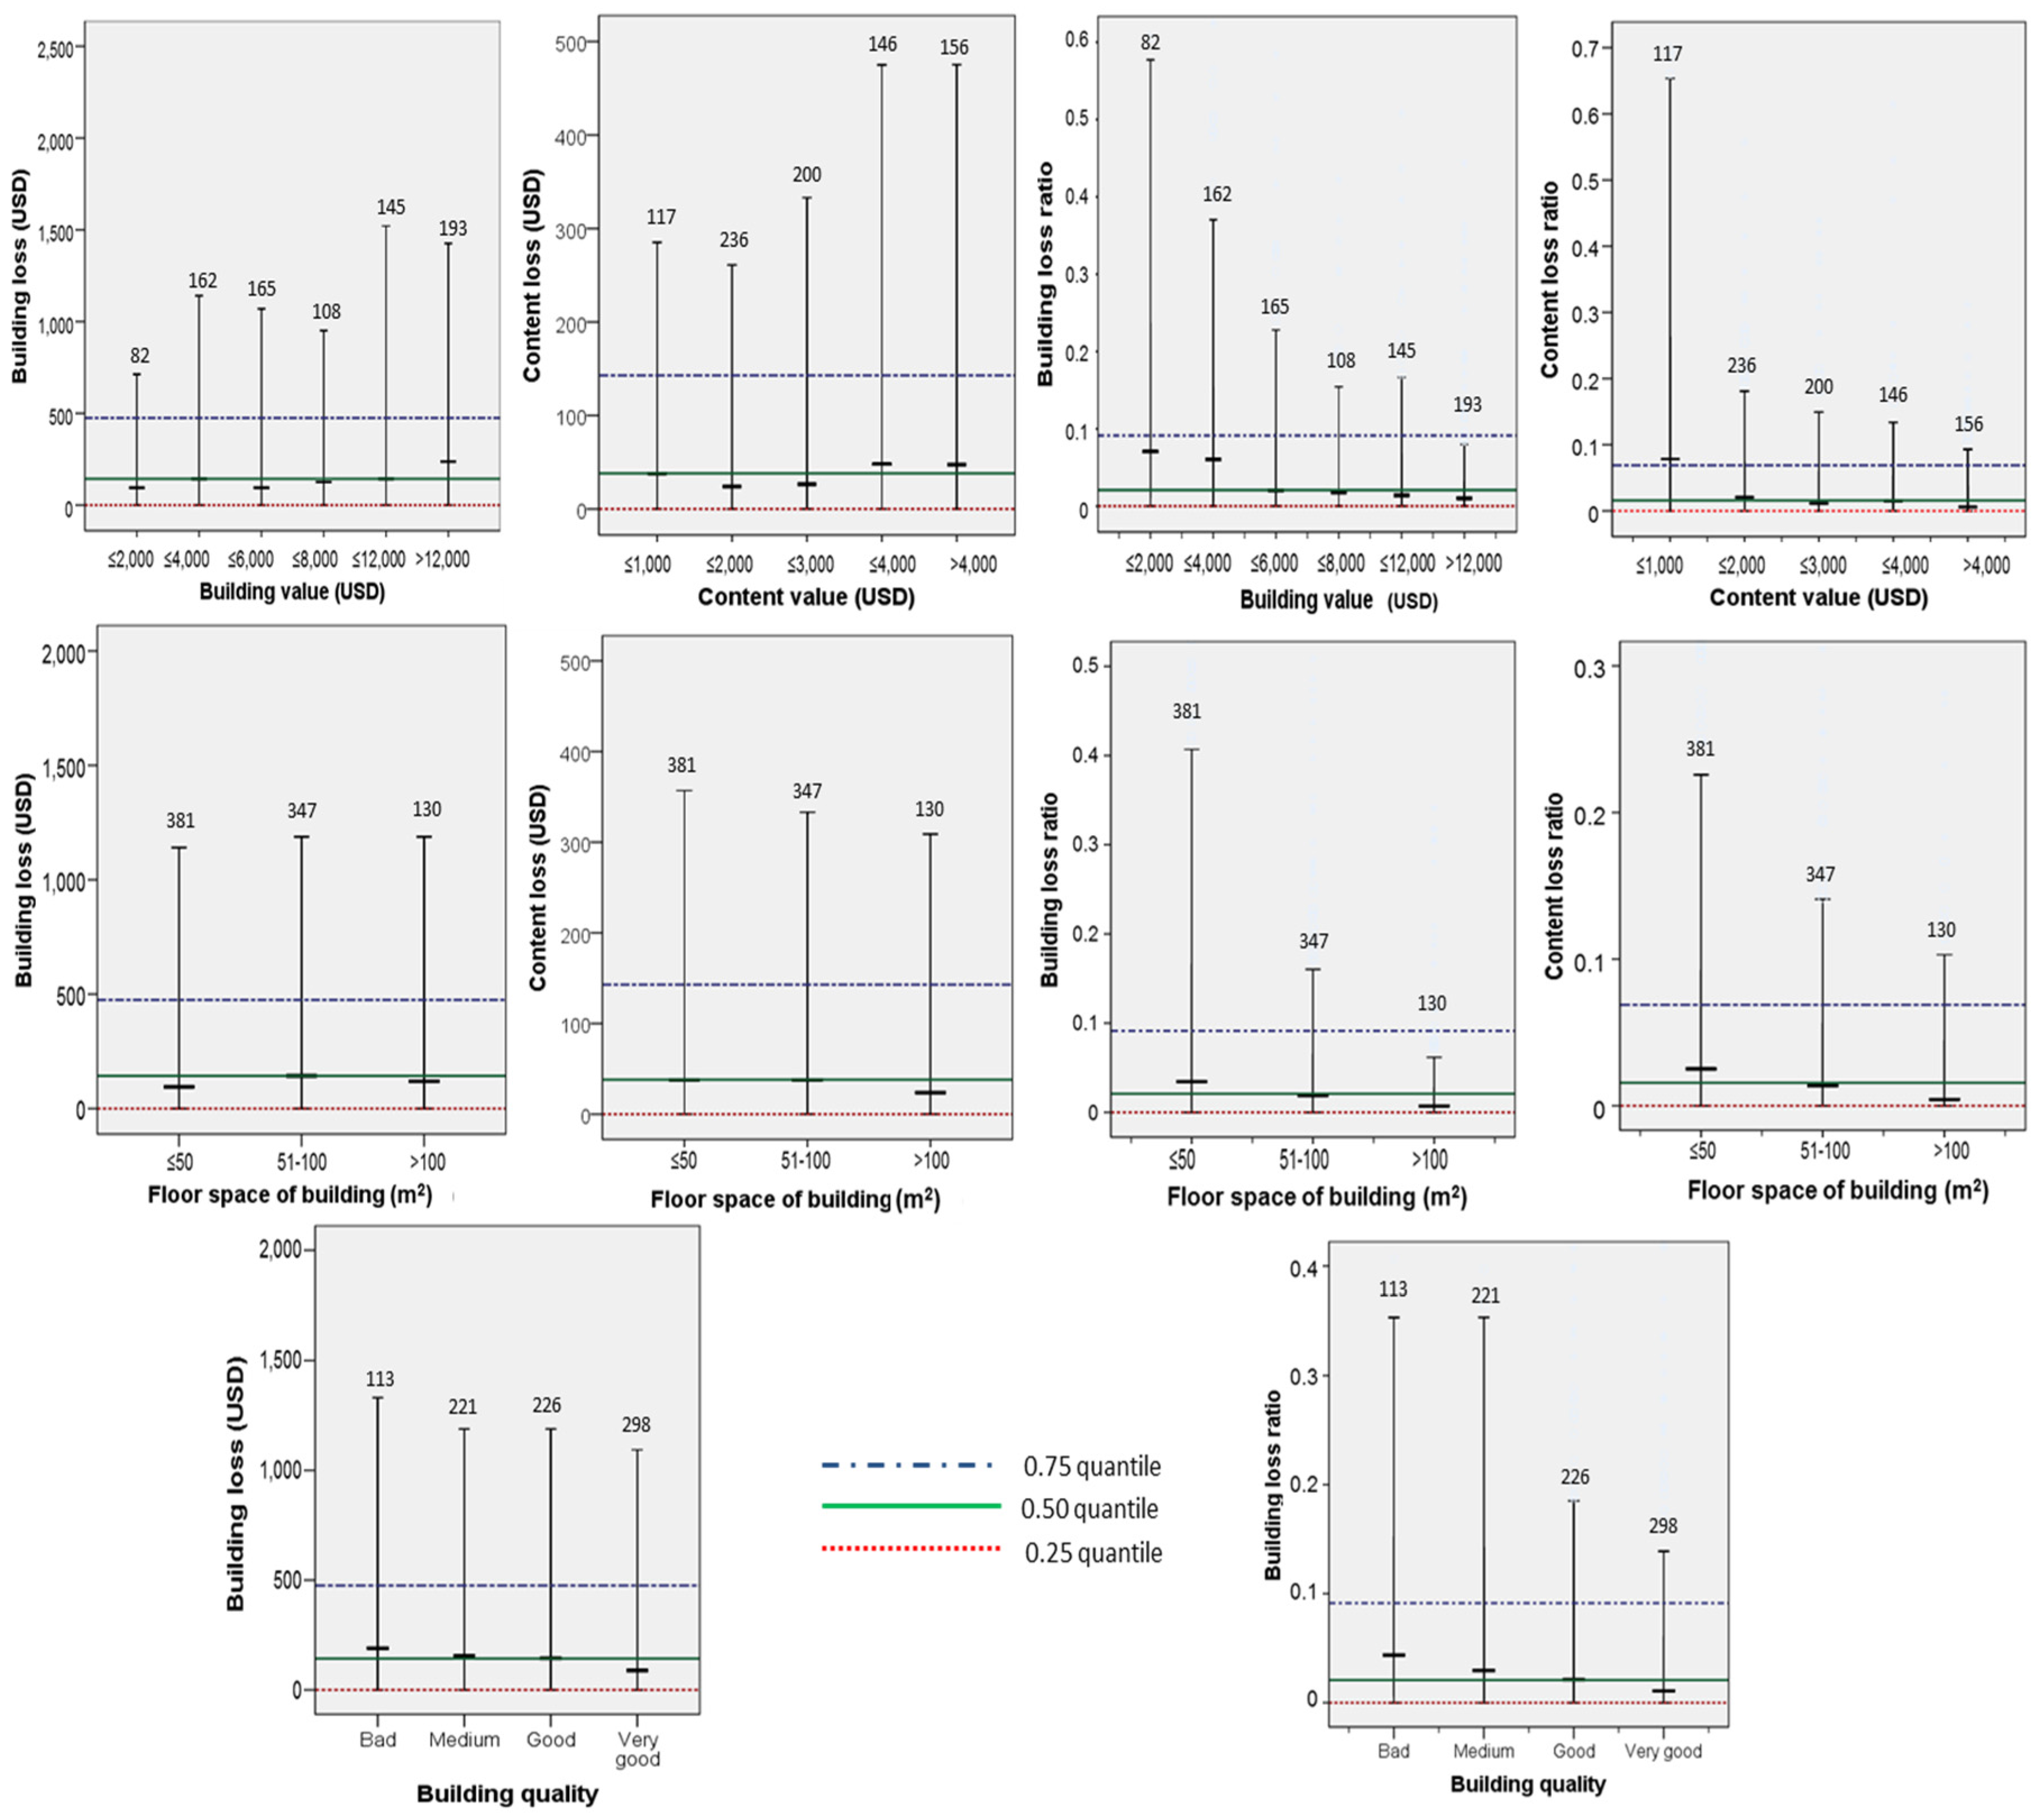
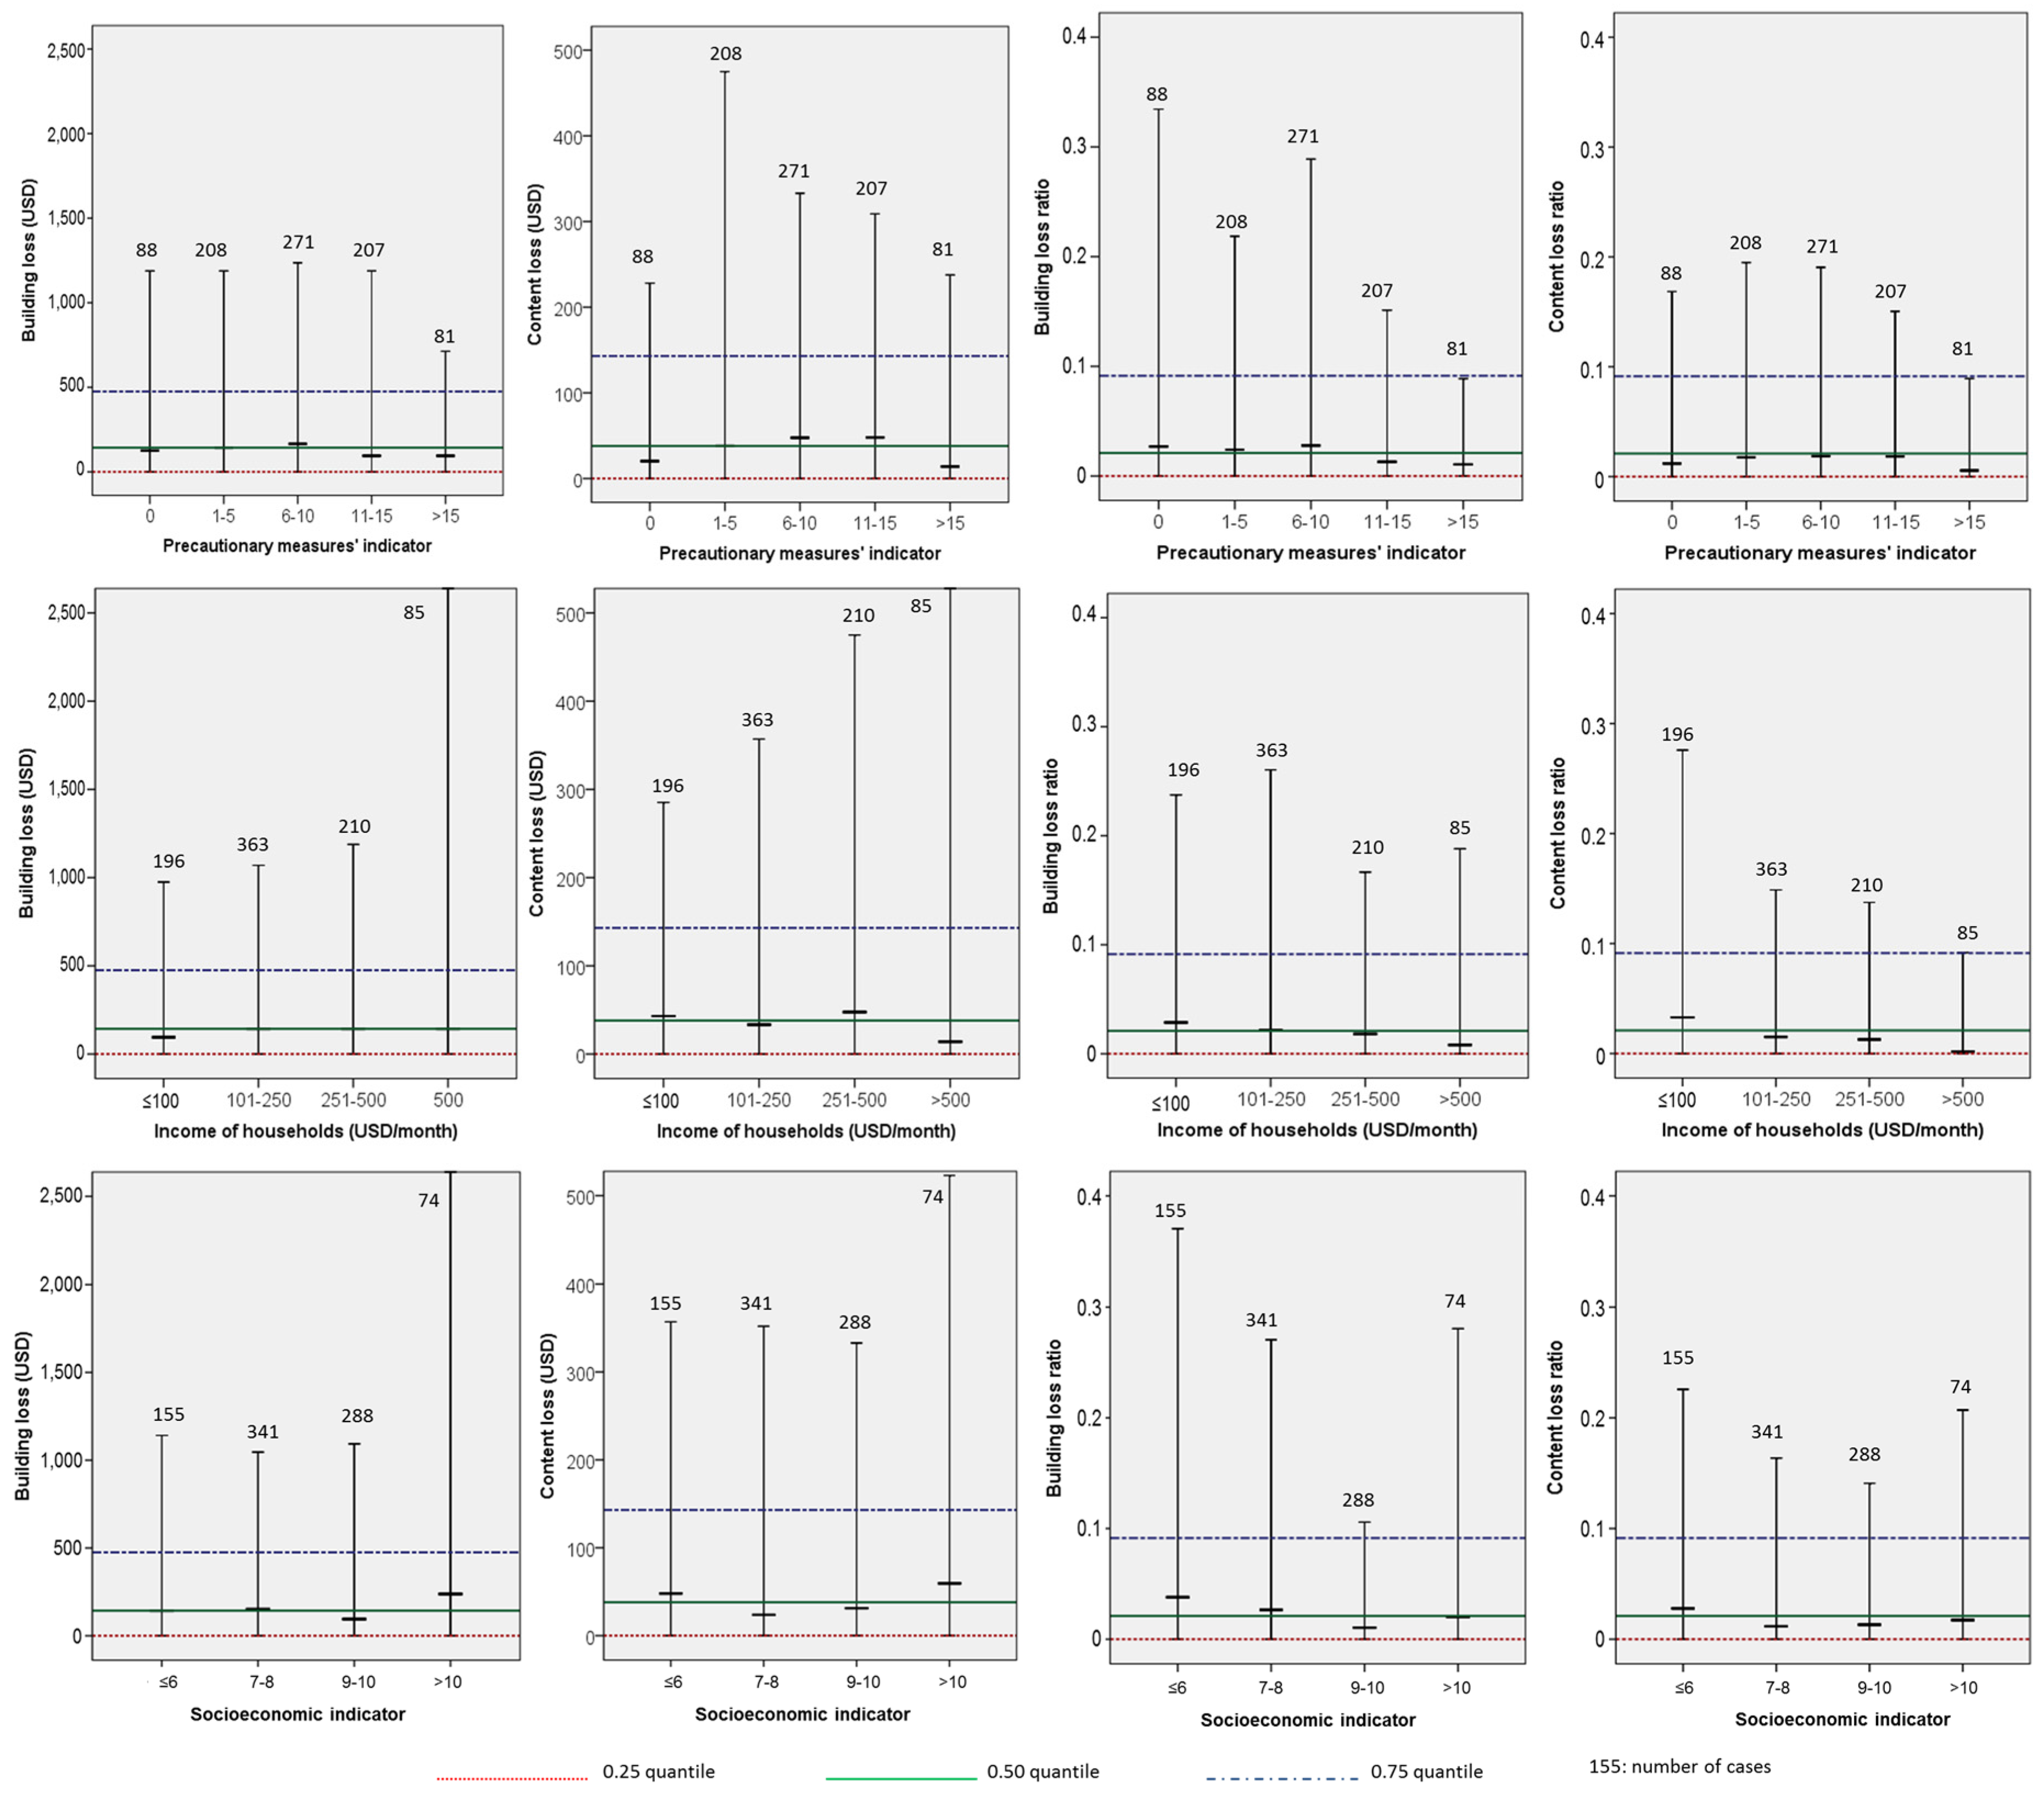
Our results reveal that under the specific flooding situation in the Mekong delta with relatively well-adapted households, long inundation durations and shallow water depths, inundation duration is more important than water depth for the amount of resulting loss. Additionally, building variables, such as building or content value, floor space of the building or building quality, also significantly influence the loss ratios. According to our results, precautionary measures play a key role in flood loss mitigation, in contrast to the emergency measures. The household characteristics, such as socioeconomic status or income, strongly influence building and content losses, probably also due to their strong correlation with the building quality and value.
The knowledge gained on damaging processes is helpful for recovery issues and for adapting the flood risk management strategy on the basis of the experiences with the flood in 2011. However, particularly, the results have important implications for loss estimation and flood risk assessments. Commonly, depth damage functions are used for flood risk assessment all over the world, and often, published functions are transferred in time and space without checking their suitability for the specific application and region. Our results suggest that for areas like Can Tho city in the Mekong delta, depth damage functions are not suitable. Instead, multi-variable loss models may be a better option, since they are better able to represent complex damaging processes.

Supplementary Files

Supplementary File 1

Acknowledgments

This research was carried out as part of the “Water related Information System for a Sustainable development of the Mekong Delta” (WISDOM II) project. Funding by the German Ministry of Education and Research (BMBF—Bundesministerium für Bildung und Forschung) and Vietnamese Ministry of Science and Technology (MOST) is gratefully acknowledged.

Author Contributions

Heidi Kreibich and Do Thi Chinh developed the concept of this study. Dagmar Haase contributed ideas concerning the structure and content of the article. The analysis was carried out by Do Thi Chinh under supervision of Heidi Kreibich and the technical help of Nguyen Viet Dung. Do Thi Chinh drafted the first version of the article, which was further improved and revised by Heidi Kreibich, Animesh K. Gain and Do Thi Chinh.

Conflicts of Interest

The authors declare no conflict of interest.

References

  1. European Commission. A New EU Floods Directive; European Commission: Vienna, Austria, 2007. [Google Scholar]
  2. Kreibich, H.; Bubeck, P.; Kunz, M.; Mahlke, H.; Parolai, S.; Khazai, B.; Daniell, J.; Lakes, T.; Schröter, K. A review of multiple natural hazards and risks in germany. Nat. Hazards 2014, 74, 2279–2304. [Google Scholar] [CrossRef]
  3. Solomon, S.; Qin, D.; Manning, M.; Chen, Z.; Marquis, M.; Averyt, K.B.; Tignor, M.; Miller, H.L. Climate Change 2007: The Physical Science Basis. Contribution of Working Group I to the Fourth Assessment Report of the Intergovernmental Panel on Climate Change; Cambridge University Press: Cambridge, UK; New York, NY, USA, 2007. [Google Scholar]
  4. Intergovernmental Panel on Climate Change (IPCC). Climate change 2013: The physical science basis. In Contribution of Working Group I to the Fifth Assessment Report of the Intergovernmental Panel on Climate Change; Cambridge University Press: Cambridge, UK, 2013. [Google Scholar]
  5. Gain, A.K.; Mojtahed, V.; Biscaro, C.; Balbi, S.; Giupponi, C. An integrated approach of flood risk assessment in the eastern part of dhaka city. Nat. Hazards 2015, 79, 1499–1530. [Google Scholar] [CrossRef]
  6. Kron, W.; Berz, G. Flood Disasters and Climate Change: Trends and Options—A (re) Insurer’s View. In Global Change: Enough Water for All? Lozan, J.L., Grasl, H., Hupfer, P., Menzel, L., Schonwiese, C.-D., Eds.; University of Hamburg: Hamburg, Germany, 2007; pp. 268–273. [Google Scholar]
  7. Gain, A.K.; Hoque, M.M. Flood risk assessment and its application in the eastern part of Dhaka City, Bangladesh. J. Flood Risk Manag. 2013, 6, 219–228. [Google Scholar] [CrossRef]
  8. Ward, P.J.; Jongman, B.; Weiland, F.S.; Bouwman, A.; van Beek, R.; Bierkens, M.F.P.; Ligtvoet, W.; Winsemius, H.C. Assessing flood risk at the global scale: Model setup, results, and sensitivity. Environ. Res. Lett. 2013, 8, 044019. [Google Scholar] [CrossRef]
  9. Merz, B.; Kreibich, H.; Schwarze, R.; Thieken, A. Review article “assessment of economic flood damage”. Nat. Hazards Earth Syst. Sci. 2010, 10, 1697–1724. [Google Scholar] [CrossRef]
  10. Giupponi, C.; Mojtahed, V.; Gain, A.K.; Biscaro, C.; Balbi, S. Chapter 6—Integrated risk assessment of water-related disasters. In Hydro-Meteorological Hazards, Risks and Disasters; Paron, P., Baldassarre, G.D., Shroder, J.F., Jr., Eds.; Elsevier: Boston, MA, USA, 2015; pp. 163–200. [Google Scholar]
  11. Adger, W.N.; Agrawala, S.; Mirza, M.M.Q.; Conde, C.; O’Brien, K.; Pulhin, J.; Pulwarty, R.; Smit, B.; Takahashi, K. Assessment of adaptation practices, options, constraints and capacity. In Climate Change 2007: Impacts, Adaptation and Vulnerability: Contribution of Working Group II to the Fourth Assessment Report of the Intergovernmental Panel on Climate Change; Parry, M.L., Canziani, O.F., Palutikof, J.P., van der Linden, P.J., Hanson, C.E., Eds.; Cambridge University Press: Cambridge, UK, 2007; pp. 717–743. [Google Scholar]
  12. Kreibich, H.; van den Bergh, J.C.J.M.; Bouwer, L.M.; Bubeck, P.; Ciavola, P.; Green, C.; Hallegatte, S.; Logar, I.; Meyer, V.; Schwarze, R.; et al. Costing natural hazards. Nat. Clim. Chang. 2014, 4, 303–306. [Google Scholar] [CrossRef]
  13. Pistrika, A.K.; Jonkman, S.N. Damage to residential buildings due to flooding of new orleans after hurricane katrina. Nat. Hazards 2010, 54, 413–434. [Google Scholar] [CrossRef]
  14. André, C.; Monfort, D.; Bouzit, M.; Vinchon, C. Contribution of insurance data to cost assessment of coastal flood damage to residential buildings: Insights gained from johanna (2008) and xynthia (2010) storm events. Nat. Hazards Earth Syst. Sci. 2013, 13, 2003–2012. [Google Scholar] [CrossRef]
  15. Thieken, A.H.; Muller, M.; Kreibich, H.; Merz, B. Flood damage and influencing factors: New insights from the august 2002 flood in germany. Water Resour. Res. 2005, 41. [Google Scholar] [CrossRef]
  16. Tang, J.C.S.; Vongvisessomjai, S.; Sahasakmontri, K. Estimation of flood damage cost for bangkok. Water Resour. Manag. 1992, 6, 47–56. [Google Scholar] [CrossRef]
  17. Merz, B.; Kreibich, H.; Thieken, A.; Schmidtke, R. Estimation uncertainty of direct monetary flood damage to buildings. Nat. Hazards Earth Syst. Sci. 2004, 4, 153–163. [Google Scholar] [CrossRef]
  18. Merz, B.; Kreibich, H.; Lall, U. Multi-variate flood damage assessment: A tree-based data-mining approach. Nat. Hazards Earth Syst. Sci. 2013, 13, 53–64. [Google Scholar] [CrossRef]
  19. Leenders, J.K.; Wagemaker, J.; Roelevink, A.; Rientjes, T.H.M.; Parodi, G. Development of a Damage and Casualties Tool for River Floods in Northern Thailand; Taylor & Francis Group: London, UK, 2009; pp. 1707–1715. [Google Scholar]
  20. Smith, D.I. Flood damage estimationA review of urban stage-damage curves and loss functions. Water SA 1994, 20, 231–238. [Google Scholar]
  21. Day, H.J.; Lee, K.K. Flood damage reduction potential of reiver forecast services in the connecticut river basin. In NOAA Technical Memorandum NWS HYDRO-28; Office of Hydrology: Silver Spring, MD, USA, 1976. [Google Scholar]
  22. Yoe, C. Frame Work of Estimation National Economic Development Benefits and Other Beneficial Effects of Flood Warning and Prepareness System; Water Resour.; Support Center U.S Army Corps Engineers: Alexandria, VA, USA, 1994. [Google Scholar]
  23. Messner, F.; Meyer, V. Flood damage, vulnerability and risk perceptionChallanges for flood damage research. In Flood Risk Management: Hazards, Vulnerability and Mitigation Measures; Springer: Dordrecht, The Netherlands, 2006; pp. 149–169. [Google Scholar]
  24. Kreibich, H.; Müller, M.; Thieken, A.H.; Merz, B. Flood precaution of companies and their ability to cope with the flood in august 2002 in saxony, germany. Water Resour. Res. 2007, 43. [Google Scholar] [CrossRef]
  25. Hung, N.N.; Delgado, J.M.; Tri, V.K.; Hung, L.M.; Merz, B.; Bárdossy, A.; Apel, H. Floodplain hydrology of the mekong delta, vietnam. Hydrol. Process. 2012, 25, 674–686. [Google Scholar] [CrossRef]
  26. Apel, H.; Chinh, D.T. Flood in mekong delta. In Severe Weather in Eastern Asia: Peril—Risks—Insurance, Knowledge Series Natural Hazards; Munich Re: Munich, Germany, 2013. [Google Scholar]
  27. Ministry of Natural Resources and Environment (MONRE). Climate Change, Sea Level Rise Scenarios for Vietnam; MONRE: Hanoi, Vietnam, 2009. [Google Scholar]
  28. Chinh, D.T.; Bubeck, P.; Dung, N.V.; Kreibich, H. The 2011 flood event in the mekong delta: Preparedness, response, damage, and recovery of private households and small businesses. In Proceeding of Mekong Environmental Symposium, Ho Chi Minh City, Vietnam, 5–7 March 2013.
  29. Mekong River Commission. Flood Damages, Benefits and Flood Risk in Focal Areas; Mekong River Commission: Vientiane, Laos PDR, 2009. [Google Scholar]
  30. Vu, T.T.; Tingsanchali, T. Flood hazard and risk assessment of hoang long river basin, vietnam. In Proceeding of International MIKE by DHI Conference 2010, Copenhagen, Denmark, 6–8 September 2010.
  31. Plapp, S.T. Risk Perception of Natural Catastrophes—An Empirical Investigation in Six Endangers Areas in South and West Germany; Werner, U., Ed.; Verlag Versicherungswirtschaft: Karlsruhe, Germany, 2003. (In German) [Google Scholar]
  32. Can Tho city People Committee. The Regulation of Price for Houses, Works and Structural Compensation in Can Tho City, Decision 12/2010-qđ-Ubnd about Regulations of Compensation, Support and Resettlement when the State Evicts Land in Can Tho City; Can Tho City People Committee: Can Tho City, Vietnam, 2010. [Google Scholar]
  33. Breiman, L.; Friedman, J.; Stone, C.J.; Olshen, R.A. Classification and Regression Trees; Chapman & Hall: New York, NY, USA, 1984. [Google Scholar]
  34. Garschagen, M. Risky change? Dynamics in Vulnerability and Adaptation to Natural Hazards between Transformation and Climate Change in Can Tho City, Vietnam. Ph.D. Thesis, University of Cologne, Cologne, Germany, October 2013. [Google Scholar]
  35. Penning-Rowsell, E.; Tapsell, S.; Johnson, C.; Wilson, T. Development of Economic Appraisal Methods for Flood Management and Coastal Erosion Protection; Department for Environment, Food and Rural Affairs (Defra): London, UK, 2006.
  36. Meyer, V.; Becker, N.; Markantonis, V.; Schwarze, R.; van den Bergh, J.C.J.M.; Bouwer, L.M.; Bubeck, P.; Ciavola, P.; Genovese, E.; Green, C.; et al. Review article: Assessing the costs of natural hazards—State of the art and knowledge gaps. Nat. Hazards Earth Syst. Sci. 2013, 13, 1351–1373. [Google Scholar] [CrossRef]
  37. Gerl, T.; Bochow, M.; Kreibich, H. Flood damage modeling on the basis of urban structure mapping using high-resolution remote sensing data. Water 2014, 6, 2367–2393. [Google Scholar] [CrossRef]
  38. U.S Army Corps Engineers (USACE). Risk-Based Analysis for Flood Damage Reduction Studies; USACA: Washington, DC, USA, 1996. [Google Scholar]
  39. Kreibich, H.; Piroth, K.; Seifert, I.; Maiwald, H.; Kunert, U.; Schwarz, J.; Merz, B.; Thieken, A. Is flow velocity a signifcant parameter in flood damage modelling? Nat. Hazards Earth Syst. Sci. 2009, 9, 1679–1692. [Google Scholar] [CrossRef]
  40. Soetanto, R.; Proverbs, D.G. Impact of flood characteristics on damage caused to uk domestic properties: The perceptions of building surveyors. Struct. Surv. 2004, 22, 95–104. [Google Scholar] [CrossRef] [Green Version]

