Homeownership Investment and Tax Neutrality: a Joint Assessment of Income and Property Taxes in Europe
- Herman Deleeck Centre for Social Policy, University of Antwerp, Belgium
- Article
- Figures and data
- Jump to
Abstract
Western countries’ income tax system exempts the return from investing in owner-occupied housing. Returns from other investments are instead taxed, thus distorting households’ portfolio choices, although it is argued that housing property taxation might act as a counterbalance. Based on data drawn from the Statistics of Income and Living Conditions and the UK Family Resources Survey, and building on the tax benefit model EUROMOD, we provide novel evidence on the interplay of income and property taxation in budgetary, efficiency and equity terms in eight European countries. Results reveal that, even accounting for recurrent housing property taxation, a sizeable ‘homeownership bias’ i.e. a lighter average and marginal taxation for homeownership investment, is embedded in current tax systems, and displays heterogeneous distributional profiles across different countries. Housing property taxation represents only a partial correction towards neutrality.
1. Introduction
The Great Recession started in 2008 has revived interest towards housing taxation. Owner-occupied housing taxation in particular has been one of the subjects holding the spotlight in the past few years’ public discourse over government intervention. On the one hand, existing tax provisions have been causally linked to households’ indebtedness (Fjærli, 2010; Saarimaa, 1979a; Goode, 2010) and the housing bubble that triggered the crisis in the US (Manestra et al., 2011). On the other hand, governments on both sides of the Atlantic have been facing the need to consolidate their public finances, and to do so are tempted to adopt forms of taxation least detrimental to growth (Arnold et al., 2011; Bielecki and Stähler, 2000). Housing taxation has thus entered the scene, with several publications released on the matter, and reform recommendations issued, by international bodies such as the European Commission, the IMF and the OECD (e.g. IMF, 2009; Andrews et al., 2011; Norregaard, 2013; Slack and Bird, 2014; European Commission, 2012).
The subject has a long tradition in the economic literature. Homeownership represents an investment yielding a return in the form of non-cash income, i.e. the avoided cost of paying for the residential services enjoyed, which is referred to as figurative or imputed rent (IR) (Frick et al., 2010). Neutrality, benchmark criterion for efficiency in taxation (Johnson and Myles, 2011), requires IR to be taxed as other returns from investment in order to avoid distortions in households’ portfolio choices leading to inefficient investment decisions. However, tax policies applying in most western countries, including the US and many in Europe, do not follow such recommendation. On the contrary, tax rules provide for a favourable tax treatment of owner-occupied housing, most notably in the context of personal income taxation: IR (or an equivalent tax base) and capital gains are tax exempt, and often also tax reliefs on mortgages incurred to purchase housing apply.
The normative rationale behind this choice broadly relates to the idea that homeownership generates positive externalities, in terms of social capital, citizenship (DiPasquale and Glaeser, 2007a; DiPasquale and Kahn, 2007b) and lower crime (Glaeser et al., 2010), house (Galster, 1983) and neighbourhood maintenance (Dietz and Haurin, 2007), children’s educational outcome (Bramley and Kofi Karley, 1998; Haurin et al., 2012) and assets accumulation in long run (Di et al., 2007). However, the scientific debate has not reached consensus on the point, as several authors trace the link to a selection mechanism, pointing rather at homeownership hampering mobility and therefore employment (Bover et al., 2000; Cameron and Muellbauer, 1998; Boeri and Terrell, 2000). In practice, owner-occupied housing taxation is highly unpopular, for a variety of reasons (European Commission, 2012). These include the salience of particular forms of housing taxation (e.g. recurrent property taxation), but also the non-cash nature of imputed rents, and a popular notion that housing constitutes a primary need. The last argument, however, would equally recommend the income tax exemption of rent paid by renters, a practice which does not apply, or does to a very limited extent, in the same countries that exempt imputed rent.
Past prominent contributions (Goode, 2010; Aaron, 1970; Rosen, 1979; Poterba, 1992), followed by a considerable body of later research, have illustrated the multiple drawbacks of this favourable treatment of homeownership (e.g. Skinner, 1979; Kneller et al., 1999; Arnold et al., 2011; Fatica and Prammer, 2017). On efficiency grounds, lack of tax neutrality in household portfolio choices leads to overinvestment in housing along the extensive and intensive margins (Hanson, 2012; Saarimaa, 1979a) and to the crowding-out of more productive alternative investments that are more heavily taxed (Turnovsky and Okuyama, 1994; Leung, 1999). Also, the favourable income tax treatment of owner-occupied housing might increase house prices (Berger et al., 2000; Damen et al., 1998; Martin and Hanson, 1999; Sommer and Sullivan, 2018) without necessarily expanding housing opportunities, but rather fostering inflation and volatility (Catte et al., 2004; Splinter, 2018).
On distributional grounds, a related stream of research has discussed horizontal and vertical equity of existing tax provisions in relation to Comprehensive Income Taxation, requiring the tax base to reflect both monetary and non-monetary potential consumption opportunities (Haig, 1921; Simons, 1938). These works generally found existing housing-related income tax provisions to bear horizontal inequity, and mortgage interest reliefs in particular to bear regressive distributional effects (e.g. Anderson and Roy, 2011; Matsaganis and Flevotomou, 2007; Poterba and Sinai, 2008; Figari et al., 2017).
Despite such long-standing endorsement for abolishing the differential income tax treatment applying to owner-occupied housing investment, a political argument brought to bear in its defence is that this investment is then subject to recurrent property taxation. Recurrent owner-occupied property taxation may then possibly be correcting the lack of neutrality embedded in income taxation.1 Yet no evidence exists - to our knowledge – on whether this is actually the case i.e. on the size and the distribution of a possible homeownership bias (lighter taxation for homeownership investment) arising from the interplay between income and property taxes. The answer to this empirical question is highly relevant for informing the current debate on taxation reform prospects. On efficiency grounds, in order to assess how far current provisions actually stand from neutrality, and therefore the scope for potentially growth-enhancing reforms; on distributional grounds, because of the peculiar equity concern that the prospect of expanding owner-occupied housing property taxation raises, including lack of progressivity of property taxes and the need to safeguard asset-rich but income-poor households.
In what follows, we respond to such research needs offering new quantitative evidence, drawn from after the Great Recession onset, in eight European countries (Austria, Belgium, Finland, France, Germany, Italy, Spain and the United Kingdom) selected to represent heterogeneous institutional settings (Anglo-Saxon, Central European, Mediterranean, Nordic), with respect to housing markets, population distribution of homeownership, and tax systems. Section 2 describes the relevant tax provisions prevailing in each country. The analysis is based on data drawn from the Statistics of Income and Living Conditions (EU-SILC) and the UK Family Resources Survey (FRS), and builds on the multi-country tax benefit model EUROMOD, as described in Section 3. The methodological set-up and its implementation are illustrated in Section 4. The contribution that our results, presented in Section 5, provide is fourfold. First, we quantify the budgetary size of this lack of neutrality. Second, we address its efficiency side computing the population distribution of effective marginal tax rates applying to alternative portfolio choices i.e. homeownership versus financial investments.2 Third, to gauge the horizontal (in)equity side of (lack of) tax neutrality, we compute differential average tax rates applying across alternative portfolio choices, for otherwise identical taxpayers that, in principle, should not be discriminated by preferred investment type – unless further economic reasons would recommend it. Finally, we turn to vertical equity and measure the extent to which the overall tax system progressivity is altered by the homeownership bias.
Results, discussed in Section 6, show that a sizeable distortion in favour of homeownership (w.r.t financial) investment, is indeed embedded in current direct tax systems, even when property taxation is accounted for. Actually, property taxation on the main residence represents only a partial compensation to the homeownership bias inherent in income tax provisions in all countries, except France. The distributional profile of the homeownership bias varies across countries, in reflection of country-specific income and property tax designs and the population distribution of incomes, homeownership and financial investments. Finally, the homeownership bias generally slightly enhances the overall tax system progressivity, due to the definition and population distribution of the underlying exempted tax base.
2. Recurrent taxation of owner-occupied housing: the current practice
Table 1 describes the income tax rules applying to owner occupied housing,3 in contrast to tax provisions applying to other types of investment, namely financial investment, as of 2012.4 Strikingly, in no country IR is subject to income tax: rules de facto exempt returns from owner-occupied housing investment, yielding a tax discount reflecting legal marginal tax rates spanning from 10 to 50%. On the contrary, returns from financial investment are subject to income taxation, either under the marginal tax rate in PIT or, in most countries, under proportional separate taxation with rates below the top marginal rates in PIT (see column ‘Financial’). Hence, the chance of an income tax induced distortion in households’ portfolio choices, potentially leading to overinvestment in housing, seems possibly present in all the countries we consider.
Income Taxation of investment returns, by investment type, 2012.
| Owner-occupied housing | Financial | Personal income tax | ||
|---|---|---|---|---|
| Tax on return | Mortgage Interest tax relief | Tax rate on return | Top marginal rate | |
| Austria | Exempt from PIT | YES, low amount allowed for low incomes | 20% | 50% |
| Belgium | Exempt from PIT | YES | 15% | 50% |
| Finland | Exempt from PIT | YES | Progressive with rate equal to 30% and 32% | 29.75% |
| France | Exempt from PIT | NO – abolished in 2010 (tax credit maintained for second properties) | 39% & 32% | 45% |
| Germany | Exempt from PIT | NO | PIT with deduction | 45% |
| Italy | Exempt from PIT | YES, with high limits | 12.5% | 43% |
| Spain | Exempt from PIT | Mortgage tax credit removed since 2012 (still compensation for house acquired before 2006). | 21% & 25% | 30.5% |
| United Kingdom | Exempt from PIT | NO (after lengthy phasing-out), maintained on other taxed properties. | 10% | 50% |
-
Source: Taxes in Europe database.
Besides, mortgage interest (MI) tax reliefs might apply to owner-occupied housing investment, although there has been a tendency to reduce them in recent years.5 MI tax reliefs have been entirely abolished in Spain (2012) and France (2010) and reduced in Finland (since 2012, while previously the country provided one of the most generous). It has been reformed in Belgium in 2005 in a way that did not affect the generosity of the system.6 Italy appears the only country, among those providing for a sizeable MI tax relief (in Italy the maximum amount returned to the taxpayer per year corresponds to about one third of median monthly earnings), which has made no plan of reducing it, despite its undisputed regressive nature.
On the contrary, no tax relief exists associated to negative interests in the case of financial investment.
The following Table 2 covers instead recurrent housing property taxation rules. In all the countries we consider, except the UK,7 a recurrent tax applies to owner-occupied housing.8 The assessment of housing values appears quite out of date in all countries, with some exceptions, most notably Finland which provides for regular re-assessments, reflecting a feature of other Nordic Countries. Indeed, property taxation varies a lot with respect to the amount of revenues raised (Barrios et al., 2019).
Property taxation on owner-occupied housing, 2012.
| Recurrent Taxation | Revenues (as % of GDP) | Latest values assessment | ||
|---|---|---|---|---|
| Austria | Real Estate Tax: federal and municipal rate on standard value of the property | 0.2 | 1973 | |
| Belgium | Real Estate Tax: regional and municipal rate on Cadastral Income | 1.22 | 1975 | |
| Finland | Real Estate Tax: municipal rate on taxable value of the property | 0.64 | 2011 | |
| France | Real Estate Tax: municipal rate on Cadastral Income | 1.33 | 1978 | |
| Germany | Real Estate Tax: federal and municipal rate on standard value of the property | 0.45 | 1964 | |
| Italy | Real Estate Tax: municipal rate on Cadastral Income | 1.51 | 1988 | |
| Spain | Real Estate Tax: municipal rate on Cadastral Income. | 1.09 | 1994 | |
| United Kingdom | NO | - | - | |
-
Source: Taxes in Europe database except in the case of Italy (official national tax revenues data).
Clearly, to assess its weight in each country, and the potential for compensating the owner-occupied return exemption from income taxation, it is imperative to consider the integration of different housing tax measures (Lunde and Whitehead, 2021). For example, Austria and Germany display very light housing property taxation, but no (or very limited, in the case of Austria) mortgage interest relief is granted to homeowners. The UK has removed homeowners’ mortgage interest reliefs, but a relevant homeownership bias still stems from the combined effect of IR exemption and the lack of a property tax. In a few countries, ‘safeguard mechanisms’ are in place, to protect individuals who might be assets-rich but income-poor (Shan, 2010). For example, France, where since 2012 the total tax burden cannot exceed the 50% of taxable income. Such mechanisms represent a promising avenue for enlarging the role of housing taxation while safeguarding the most vulnerable in societies.
3. Data and tax microsimulation modelling.
Data are drawn from the European Statistics of Income and Living Conditions (EU-SILC) for all countries except United Kingdom, for which we use Family Resources Survey (FRS). These correspond to the surveys acting as input databases for the multi-country microsimulation model EUROMOD, which we exploit for empirical analysis. The EU-SILC provides cross-sectional and cross-country comparable yearly data drawn from nationally representative samples, covering different topic domains, including housing tenure, house characteristics and quality indicators, besides information on households financial circumstances. The FRS, the UK household budget survey, offers a considerably larger sample size than the British component of EU-SILC, as well as much more detailed information on household incomes, valuable for tax modelling. The data used here refer to 2010. Information on country-specific homeownership rates are shown in Table 3. Homeownership is most prevalent in Belgium, Italy, Finland and Spain, where rates score above 70%, and lower in Austria and Germany (below 60%).
Homeownership rates, 2010.
| Owned on mortgage | Owned outright | Total | |
|---|---|---|---|
| AT | 25.4 | 32.1 | 57.5 |
| BE | 41.6 | 30.2 | 71.8 |
| FI | 42.0 | 32.3 | 74.3 |
| ES | 33.2 | 46.7 | 79.9 |
| FR | 28.9 | 33.3 | 62.2 |
| DE | 27.8 | 25.5 | 53.3 |
| IT | 15.4 | 56.5 | 71.9 |
| UK | 41.3 | 27.7 | 69.0 |
-
Source: Own calculations on the basis of EU-SILC/FRS.
Assessing the tax saving enjoyed by homeowners because of the IR income tax exemption requires measuring the exempted tax base. Although the EU-SILC provides estimates of IR, i.e. the return from homeownership investment, for all the countries involved since 2007, these are known to suffer from comparability issues (Juntto and Reijo, 2010; Törmälehto and Sauli, 2013) because derived under country-specific methodological choices. For this reason, we employ IR measures estimated adopting a cross-country comparable approach (Figari et al., 2015b) as described in Appendix 1.
The empirical analysis is developed adopting a fiscal microsimulation approach, which allows estimating household incomes under different taxation scenarios, holding everything else constant (Figari and Paulus, 2015a). Tax scenarios are implemented using EUROMOD, the multi-country European wide static tax-benefit microsimulation model that generates comparable measures of direct taxes, social insurance contributions and cash benefits. Simulations reflect given tax-benefit rules, applied to populations as characterised in the underlying input datasets; further tax benefit policies which are not simulated, as well as market incomes, are taken directly from the data. As such, EUROMOD allows to gauge the first order effects of specific tax-benefit policies in terms of government budgets, income distribution and a variety of effective tax rate indicators (Sutherland and Figari, 2013). Specifically for our purpose it is important to note that mortgage interest tax reliefs are simulated in the countries where they exist (notably Belgium, Finland, Italy and Spain). The property tax is simulated in Belgium and Italy, while for Finland, France, Germany and Spain the amounts are taken from the data.
The baseline tax-benefit systems simulated refer to tax policy rules applying in 2012. Appropriate price and income indices are used to update monetary variables from the income reference period (i.e. 2009) to policy system year (i.e. 2012). The simulations of these policy systems have been cross-checked with administrative statistics and tested through a number of other applications.9
4. Methodology and Implementation
We quantify the homeownership bias based on the comparison between the baseline tax scenario (reflecting actual income and property tax rules) and a tax-neutral micro-simulated counterfactual tax scenario. The counterfactual scenario is designed to achieve tax-neutrality in portfolio investment decisions, considering low-risk financial investment as an alternative to homeownership investment.10 In this counterfactual scenario, neutrality is achieved by applying the same income tax rules provided for financial investment (typically proportional taxation at source) to the return from homeownership investment, i.e. net IR; and also removing any further differential tax treatment between the two types of investment, i.e. removing housing property taxation and mortgage interest tax reliefs that would only apply to homeownership and, as such, contribute to shaping an homeownership bias.11 In sum, the counterfactual scenario implies an increase of the tax rate on IR in order to equal the tax rate on financial investment.
This counterfactual scenario is purposely not designed to achieve revenue-neutrality. The underlying idea is that the level of taxation is left as a political choice to policy makers, or citizens’ representatives in democratic societies (Johnson and Myles, 2011). Besides, availability of additional tax revenues might be valuable in times of fiscal consolidation needs, and anyway enlarge the scope for growth enhancing tax-shifting measures.
The comparison (i.e. differencing) of the population pre- and post-tax income distribution arising under the baseline and the neutral tax scenario allows to quantify the budgetary dimension of the homeownership bias; also, to quantify the specific and offsetting contributions of various homeownership tax provisions: namely IR exemption and Mortgage Interest Tax Reliefs (MITR) contributing to the bias, and entailing a fiscal cost on the one side; property taxation partially offsetting the bias, and collecting revenues, on the other.
Besides, we are able to describe the income-distributional pattern of the homeownership bias arising from the combined effect of income and property taxation rules applying to homeownership. In more detail, we explore two economic concerns embedded in tax neutrality: efficiency (i.e. the homeownership bias entailing distortions to otherwise efficient portfolio investment decisions) and equity (i.e. discrimination of taxpayers based on legitimate portfolio preferences). We explore the (in)efficiency side of the homeownership bias computing effective marginal tax rates i.e. the size of taxation applying to a marginal investment in housing, as opposed to a marginal financial investment. This is achieved applying baseline tax rules to an hypothetical marginal increase in each form of investment, quantified as the 10% of country-specific median IR for current homeowners.12 While income tax rules applying to the two types of hypothetical investments are simulated, the property tax applying to the hypothetical marginal investment in homeownership is obtained through calibration.13
Next, we turn to the horizontal and vertical equity side of tax neutrality. Horizontal equity requires non-discriminatory tax treatment of ‘equals’: in other words, two otherwise identical taxpayers, should not be discriminated being charged with higher tax liability by preferred investment type. We compute indicators for the burden of taxation, namely average tax rates, that households actually bear under existing tax provisions (income tax exemption of IR, MITR, property tax), and those that would arise if they had invested in financial capital instead of homeownership (their actual IR being taxed as if financial income).
Finally, we gauge the vertical equity embedded in existing housing-related tax provisions, with respect to a tax-neutral scenario of homeownership bias removal. We do so by computing progressivity indexes for tax liabilities in the two scenarios. Indeed, the peculiar distributional pattern of specific tax provisions contributing to the ‘homeownership bias’ (IR exemption, MITR on one side and recurrent property taxation as a possible compensation on the other) questions the role of the latter as a counterbalance to the first two components and may raise a vertical equity concern.
5. Results
5.1 Budgetary impact
The homeownership-related lack of neutrality embedded in the income tax systems results in a relevant loss of tax revenue in all the countries we consider. The revenue loss arises from the combined effect of IR exemption and MITR. The IR exemption implies a revenue loss (as % of the counterfactual tax revenue) worth from -5% in France and Italy to close to -20% in Spain and Finland (see Table 4, first column), with differences across countries reflecting the national homeownership rates, IR levels and tax burdens on financial incomes. Also mortgage interest tax reliefs (Table 4, second column), as further contributor to the homeownership bias, reduce revenues mainly in Belgium (6%) and Spain (4%), while the effect would be rather small in Finland and Italy.
Budgetary size of homeownership bias, components and total, in % of counterfactual tax revenue, and absolute amount.
| Exempting IR (1) | MITRs (2) | Property tax on main residence (3) | Total homeownership bias (1)+(2)+(3) | Absolute amount (million € per year) | |
|---|---|---|---|---|---|
| As % of counterfactual tax revenuea | |||||
| AT | -6.35 | - - - | - - - | -6.35 | -1,906.2 |
| BE | -6.06 | -5.61 | 2.78 | -8.89 | -4,077.6 |
| FI | -17.90 | -0.16 | 1.10 | -16.96 | -5,178.2 |
| ES | -19.99 | -3.86 | 13.16 | -10.69 | -8,046.4 |
| FR | -5.23 | - - - | 7.20 | 1.98 | 3,776.1 |
| DE | -9.28 | - - - | 2.27 | -7.01 | -18,945.0 |
| IT | -5.2 | -0.78 | 2.21 | -3.78 | -7,403.8 |
| UK | -14.60 | - - - | - - - | -14.60 | -23,444.3 |
-
Notes a:Tax revenues corresponds to the sum of final personal income and property tax. Tax provision abolished in countries where existed. A negative (positive) amount represents a revenue loss (gain). The ‘- - -'‘ sign indicates no such policy exists in the country (or, as in the case of property tax in Austria, it is negligible in size)
-
Source: Own calculations on the basis of EU-SILC/FRS.
To what extent are existing property taxes actually offsetting such aggregate revenue losses? As apparent the third column of Table 4, only partially: the existing property tax revenue ranges from 1.1% in Finland to 14.6% in Spain.
Overall (Table 4, column 4), existing tax provisions result in lower fiscal revenues in all countries, except France. In other words, generally, at aggregate level, the budgetary role played by recurrent housing property taxation is not sufficient to compensate for the revenue loss entailed by the sizeable tax discounts that homeowners enjoy (Table 4, fourth and fifth column for the absolute aggregate amount).
Homeownership bias along the income distribution
The lack of neutrality of the tax systems and the partial compensation provided by the property tax is distributed unevenly over income groups. For analyses along the income distribution, we rank individuals on the basis of an extended disposable income concept (measured in the baseline scenario), notably cash income plus net imputed rent, following the consensus in the literature about the superiority of an extended income concept that also incorporates non-cash income components with respect to a cash income only concept (Frick et al., 2010).
Efficiency: effective marginal tax rates
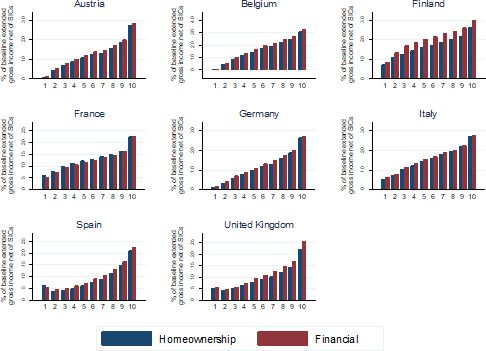
We address the efficiency side of tax neutrality and compute the population distribution of effective marginal tax rates (EMTRs) applying to alternative portfolio choices, notably homeownership and financial investments. Results in Figure 1 show that effective marginal tax rates are very small or even negligible in the case of housing investment in Austria, Finland, Germany and the United Kingdom, the countries with low or no property taxes. Marginal tax rates on housing investment are higher in Belgium, France, Italy and Spain. In Belgium and Spain, the EMTRs are an increasing function of income, while the pattern is more mixed in France. Strikingly, EMTR on financial investment is remarkably higher in all countries. The income-related pattern is, however, very different across countries. For example, in Belgium it closely matches the proportional design of the tax on income from financial investment; it is instead decreasing in income in several countries due to a compositional effects (with investment incomes subject to lower tax rates, such as government bonds in Italy, owned by richer tax payers) and a withdrawal effect of benefits received by tax payers at the bottom of the distribution; it is) rather increasing in income in the UK, reflecting the specific higher Personal Income Tax rate applying to investment income.

Effective Marginal Tax Rates for homeownership and financial investment.. Source: Own calculations on the basis of EU-SILC/FRS and EUROMOD.
Horizontal equity
To gauge the horizontal (in)equity side of tax neutrality, we compute average tax rates applying a fixed-size investment across alternative portfolio choices: homeownership and financial investment. In more detail, Figure 2 shows the average tax rates that homeowners would bear if they had invested their amount of net IR in financial capital (i.e. financial investment), and those actually borne on homeownership (i.e. homeownership investment) under existing tax provisions (income tax exemption of IR, MITR, property tax) .

Average tax rates for homeownership and financialinvestment.. Source: Own calculations on the basis of EU-SILC/FRS and EUROMOD.
The difference in average tax rates, thus an indicator of the advantage homeowners derive from the homeownership bias, is in general unequally distributed over income deciles. In most countries the advantage is relatively small at the bottom of the income distribution and is highest in the upper (middle) part of the distribution, due to the fact that both the tax discount on imputed rent and the mortgage interest tax relief are an increasing function of income. In France, where property taxes are high enough to more than compensate the loss of revenues at the aggregate level, the additional tax burden is however much higher for low incomes, and is reduced further up the income distribution, until becoming slightly positive in the highest decile. We also see a negative sign for the bottom decile in Spain, indicating that the poorest pay more in property tax than what they gain from the income-tax-related lack of neutrality. Interestingly, the lack of neutrality is smaller for the top decile than for the middle part in Austria, Belgium, Finland, Germany, Italy and Spain, due to the higher incidence of the property tax for the richest taxpayers.
Vertical equity
Finally, we look at the vertical equity patterns by calculating the impact on the progressivity of the tax system of this lack of neutrality. In Kakwani (1984), progressivity is measured in the literature in terms of the deviation of proportionality. The Kakwani index measures progressivity as the difference between the concentration coefficient of taxes and the Gini of pre-tax income. A positive (negative) Kakwani index means that the tax is progressive (regressive), while a value of zero indicates that the tax is proportional. Table 5 reports Kakwani indexes computed for specific tax components (Total, Property and Income taxes) under the actual homeownership investment, and existing tax rules (first column), and in an alternative scenario where homeownership investment is taxed as financial investment (second column).
Progressivity of income taxes and property taxes, homeownership and financial investment.
| Baseline scenario: Taxation under actual homeownership investment rules | Alternative scenario: homeownership investment is taxed as financial investment | ||||
|---|---|---|---|---|---|
| Total | Components | Total | Components | ||
| Austria | Total taxes | 0.289 | 0.268 | ||
| Property tax | - | - | |||
| Income taxes | 0.289 | 0.268 | |||
| Belgium | Total taxes | 0.269 | 0.248 | ||
| Property tax | 0.049 | - | |||
| Income taxes | 0.279 | 0.248 | |||
| Finland | Total taxes | 0.162 | 0.133 | ||
| Property tax | 0.055 | - | |||
| Income taxes | 0.165 | 0.133 | |||
| France | Total taxes | 0.182 | 0.193 | ||
| Property tax | 0.044 | - | |||
| Income taxes | 0.194 | 0.193 | |||
| Germany | Total taxes | 0.290 | 0.271 | ||
| Property tax | 0.092 | . | |||
| Income taxes | 0.298 | 0.271 | |||
| Italy | Total taxes | 0.191 | 0.179 | ||
| Property tax | 0.019 | - | |||
| Income taxes | 0.196 | 0.179 | |||
| Spain | Total taxes | 0.261 | 0.253 | ||
| Property tax | -0.125 | - | |||
| Income taxes | 0.343 | 0.253 | |||
| UK | Total taxes | 0.263 | 0.262 | ||
| Property tax | - | - | |||
| Income taxes | 0.263 | 0.262 | |||
-
Source: Own calculations on the basis of EU-SILC/FRS and EUROMOD.
-
Notes: In the index computation, pre-tax income is extended original income (i.e. including imputed rent) plus benefits.
When comparing property taxes with the other taxes in the baseline, it is clear that property taxes are the least progressive and in the case of Spain even clearly regressive. This means that the progressivity of total taxes is entirely due to the personal income tax system, with highest levels of progressivity in Austria, Belgium, Germany and Spain, and much lower levels in the other countries. Interestingly, moving to a neutral tax system (second column) would make the tax system slightly less progressive, or in other words, the homeownership bias bears a slightly progressivity-enhancing effect. This may be a somewhat surprising result, given that the proportional/regressive property tax, as well as the mortgage interest tax relief, which tends to benefit disproportionally higher income taxpayers, would both not apply in that scenario. However, taxing imputed rent as financial income in the counterfactual neutral scenario shifts the tax burden more towards the bottom of the income distribution, thus leading to a (small) reduction in progressivity. This follows from the fact that net IR is relatively more important for households on the lower parts of the income distribution and due to a relatively high prevalence of outright homeowners among the elderly who are located in the lower parts of the income distribution (see also Frick et al., 2010; Figari et al., 2017; Saarimaa, 1979b). It also points towards the crucial difference in tax base definition between property taxation (applied to the cadastral value in the homeownership scenario often not recently assessed) and income taxation (applying to the return from homeownership investment in the second scenario).
Discussion and Conclusions
In Europe, the Great Recession has made it imperative to identify forms of taxation least detrimental to growth, and shift the tax burden towards those, thus reviving interest towards owner-occupied housing taxation. For decades, in sharp contrast with economic principles, western countries’ income tax systems have exempted IR, i.e. the return from investing in owner-occupied housing, from income taxation.
Existing tax measures often seem driven by political attempts to maximise consensus, as showcased by the succession of owner-occupied housing tax reforms passed in Italy over the past decade, with the property tax on the main residence being repeatedly announced to be, and then actually being abolished, re-introduced, reformed, at a pace replicating that of the political cycle (Figari and Fiorio, 2015).
A political argument against reforming existing tax provisions, removing the IR exemption, builds on the presence of an additional tax burden on homeowners stemming from recurrent property taxation of the main residence. Despite a long-standing endorsement of removing the homeownership bias, lack of updated comparative evidence on its size, also in relation to existing property taxes on housing, and on their joint distributional effect, is currently hampering the tax policy debate. This paper has addressed such research need, offering novel evidence on aggregate and distributional measures of the homeownership bias in eight European countries, observed after the onset of the recent crisis, accounting for the extent to which the bias might be mitigated by recurrent property taxation.
Our results confirm that a sizeable bias in favour of homeowners is indeed embedded in current income tax systems, with non-trivial country specific distributional profiles (both in terms of tax incentives to specific forms of investment, and in terms of average tax advantage granted) and implying a general slight contribution to enhancing the tax system progressivity, due to the definition and population distribution of the underlying (exempted) tax base. Importantly, against an argument brought to bear in defence of maintaining the IR exemption, results reveal that, in all countries except France, property taxation represents only a partial correction to this bias. Clearly, the adoption of income-based or property-based housing taxation would bear different implications (in terms of tax evasion, distributional profile, gross or net tax base definition, liquidity constraints and need for safeguard mechanisms etc.) and a discussion of these, and whether the two forms of housing taxation should be regarded as substitutes or rather integrated as complements, is left for future research.
We acknowledge that our analysis presents some limitations: to begin with, the reflected policy rules date back to 2012, although in most countries the structure of housing taxation has not been revised since. Also, further tax components, possibly contributing to the bias, such as capital gains, or indirect taxes on housing transactions, although minor in quantitative significance, could not be accounted for in our analysis, mostly due to data limitations. Finally, the analysis and discussion are focussed on housing investment on the main residence, rather than investment in further housing properties, which, although less prevalent among the population, are subject to less generous tax treatment, and might bear the burden of both property and income taxation.
Hopefully, despite these limitations, this cross-country comparative evidence will be valuable for informing the policy debate on the search for new sources of tax revenues, and in particular for those less detrimental to growth and equity.
Footnotes
1.
From a theoretical perspective, debate might be open on whether the rationale for property taxation should be substituting income taxation of IR, or that behind any form of wealth taxation, with housing property tax complementing income taxation of IR. Still, under both views, assessing (lack of) tax neutrality across alternative forms of investment, i.e. whether a so-called homeownership bias exists, requires taking a systemic view of the tax system (Johnson and Myles, 2011) accounting for both recurrent direct taxes.
2.
We do not consider investment in further immovable properties – other than owner occupied housing – due to lack of adequate data to pursue the empirical analysis on this other form of alternative investment. Given that inequality of immovable property other than the main residence is distributed more unequally than the value of the household main residence (see Causa et al., 2019), we would expect that outcomes based on other immovable property would move into the direction of those calculated with financial investment (see further).
3.
We do not discuss here related transfer taxes and taxes on capital gains. As these are not recurrent but event-based taxes, they fall outside the scope of this paper.
4.
In most countries, no major structural housing tax reform has taken place since 2012, with the exception of Italy where property tax on main residence has been abolished in 2106. For more details on country specific tax changes, see Boone et al. (2019).
5.
In some countries, e.g. the United States, property taxes may also be deducted from income for income tax purposes. This might impact on the outcomes, though the direction of this impact would depend on the respective distribution of income taxes, property taxes and the possible interaction between both.
6.
For loans contracted before 2005, in addition to mortgage interest tax reliefs, a tax advantage existed for capital redemption payments. This measure is considered here as part of the homeownership bias and abolished in the counterfactual scenario (see further).
7.
In the UK instead, a recurrent housing tax is levied from occupiers (either homeowners or renters) in the form of a residential service tax, the Council Tax. In what follows, our focus will be on considering, as potential compensation to the homeownership bias, property taxation on the main residence, rather than residence-based taxation, which applies to owner and tenant occupiers.
8.
Recurrent property taxes generally play a role in local taxation, although tax bases are defined at the central level, and local governments retain only some discretion in setting tax rates (often within centrally established lower and upper boundaries) and obtaining (at least some portion of) tax revenues.
9.
Transfer taxes and Taxes on capital gains are out of the scope of EUROMOD simulations, as the underlying data include neither data on transfers of property nor on realised capital gains. One might argue that the lack of for instance a capital gains tax on a principal residence could be counteracted be a land transfer tax. The distributive outcomes of such taxation (or non-taxation) would very much depend on tax policy rules on the one hand and the underlying distribution of capital gains on the other.
10.
We do not cover business investment as typically entailing a higher risk than investment in immovable properties.
11.
Given that our tax base is net IR, i.e. after deduction of costs such as mortgage interests, maintaining mortgage interest tax reliefs would imply a double counting of these interest in the tax calculation. By using net IR, mortgage interests are treated in the same way across countries in the counterfactual.
12.
The increase in homeownership investment is simulated for both current homeowners and for other households, which would thus hypothetically become homeowners. One limitation to our analysis is that we are unable to account for transaction taxes paid upon housing purchase.
13.
Due to lack of appropriate data needed for simulating it. For those paying property tax in the baseline, it is a calibration of the baseline property tax. For those not paying property tax in the baseline, the new property tax is equal to the average baseline property tax paid by those with IR equal to 10% of median IR.
14.
The opportunity cost approach, the capital market approach, and the self-assessment approach; for a discussion of these, see Frick et al. (2010).
Appendix 1
Imputed rent estimation
Among the approaches previously proposed14 to compute IR from micro data, we opt for the opportunity cost approach, also known as the rental equivalence method. We apply a hedonic regression estimation of the logarithm of rent actually paid by tenants in the private housing market (i.e. excluding social housing and any reduced rent payments). In the case of UK, the estimation sample has been restricted to private tenants holding assured short-hold letting agreements (about 55% of private tenants), deemed most representative of the private rental market prices we want to capture. Covariates cover those traditionally used in the IR estimation literature: type and size of the dwelling, quality of the dwelling and the neighbourhood, occupancy in years, geographical location, household income. As selection bias may arise from substantial differences in terms of housing quality and other dwelling characteristics between private market tenants and homeowners, a Heckman selection correction is used. To model selection in homeownership, we exploit indicators of spatial segregation, or other factors that may cause a difference in e.g. quality of the house. Our estimation indeed points towards selection bias arising in all countries except Belgium and Spain. Obtained coefficients are applied to the owner-occupiers sample in order to estimate their IR. In order to maintain the proper variance in the resulting estimates of IR, we add an error term to the predicted value of IR (Frick et al., 2010). This is achieved by adding an error component, randomly chosen from a distribution characterised by zero mean, and variance set based on the difference, measured on the estimation sample of private market tenants, between the standard deviation of the actual rent variable and the standard deviation of the predicted IR variable.
A net version of IR estimates is obtained deducting interest payments for those owners who are repaying a mortgage. For some households this results in negative imputed rents, which were recoded to zero. The overall IR estimation procedure has been validated exploiting observability of tenants’ actual rent, whose distribution was compared with that of the in-sample predicted IR, with reassuring results (see Figari et al., 2015b for related evidence).
References
- 1
-
2
Eliminating Housing Tax Preferences: A Distributional AnalysisJournal of Housing Economics 10:41–58.https://doi.org/10.1006/jhec.2001.0275
-
3
Housing Markets and Structural Policies in OECD Countries, OECD Economics Department Working Paper No.836836, Housing Markets and Structural Policies in OECD Countries, OECD Economics Department Working Paper No.836, OECD Publishing, p.
-
4
Tax Policy for Economic Recovery and GrowthThe Economic Journal 121:F59–F80.https://doi.org/10.1111/j.1468-0297.2010.02415.x
-
5
Housing Taxation: A New Database for Europe, JRC Working Papers on Taxation and Structural Reforms (No 08/2019)Seville: European Commission, Joint Research Centre.
-
6
The Capitalization of Interest Subsidies: Evidence from SwedenJournal of Money, Credit and Banking 32:199.https://doi.org/10.2307/2601239
-
7
Labor Tax Reductions in Europe: the Role of Property TaxationMacroeconomic Dynamics 26:419–451.https://doi.org/10.1017/S136510052000022X
-
8
Institutional Determinants of Labor Reallocation in TransitionJournal of Economic Perspectives 16:51–76.https://doi.org/10.1257/0895330027111
-
9
EWIGE 2 – Update and Extension of the EUROMOD Wealth Taxation Project, European CommissionSeville: Joint Research Centre.
-
10
Housing, Wages and Uk Labour MarketsOxford Bulletin of Economics and Statistics 51:97–136.https://doi.org/10.1111/j.1468-0084.1989.mp51002001.x
-
11
Homeownership, Poverty and Educational Achievement: School Effects as Neighbourhood EffectsHousing Studies 22:693–721.https://doi.org/10.1080/02673030701474644
-
12
The Housing Market and Regional Commuting and Migration ChoicesScottish Journal of Political Economy 45:420–446.https://doi.org/10.1111/1467-9485.00106
-
13
Housing Markets, Wealth and the Business CycleParis: OECD Economics Department Working Papers 394, OECD.
-
14
Housing, Wealth Accumulation and Wealth Distribution: Evidence and Stylized Facts », Documents de Travail Du Département Des Affaires Économiques de l’OCDE, N° 1588Paris: OCDE.
-
15
The effect of mortgage interest deduction and mortgage characteristics on house pricesJournal of Housing Economics 34:15–29.https://doi.org/10.1016/j.jhe.2016.06.002
-
16
Do homeowners achieve more household wealth in the long run?Journal of Housing Economics 16:274–290.https://doi.org/10.1016/j.jhe.2007.08.001
-
17
The social and private micro-level consequences of homeownershipJournal of Urban Economics 54:401–450.https://doi.org/10.1016/S0094-1190(03)00080-9
-
18
Incentives and Social Capital: Are Homeowners Better Citizens?Journal of Urban Economics 45:354–384.https://doi.org/10.1006/juec.1998.2098
-
19
Measuring Neighborhood Investments: An Examination of Community ChoiceReal Estate Economics 27:389–424.https://doi.org/10.1111/1540-6229.00778
-
20
Possible Reforms of Real Estate Taxation: Criteria for Successful PoliciesEuropean Economy Occasional Papers 119.
-
21
Housing and the Tax System: How Large Are the Distortions in the Euro Area? *Fiscal Studies 39:299–342.https://doi.org/10.1111/1475-5890.12159
-
22
Fiscal Consolidation Policies in the Context of Italy’s Two RecessionsFiscal Studies 36:499–526.https://doi.org/10.1111/j.1475-5890.2015.12074
-
23
Handbook of Income Distribution Volume 2B, Edited by A. B. Atkinson and FMicrosimulation and Policy Analysis, Handbook of Income Distribution Volume 2B, Edited by A. B. Atkinson and F, Bourguignon, Elsevier.
-
24
Removing Homeownership Bias in Taxation: The Distributional Effects of Including Net Imputed Rent in Taxable IncomeFiscal Studies 38:525–557.https://doi.org/10.1111/1475-5890.12105
-
25
HESTIA - Housing taxation in EUROMOD: a Statistical Tool for imputed rent and policy AnalysisTechnical Reports, Institute for Prospective Technological Studies, Joint Research Centre, European Commission.
-
26
Tax Reform and the Demand for DebtInternational Tax and Public Finance 11:435–467.https://doi.org/10.1023/B:ITAX.0000033987.33559.ea
-
27
Distributional effects of imputed rents in five European countriesJournal of Housing Economics 19:167–179.https://doi.org/10.1016/j.jhe.2010.06.002
-
28
Empirical Evidence on Cross-Tenure Differences in Home Maintenance and ConditionsLand Economics 59:107.https://doi.org/10.2307/3145880
-
29
Crime and Social InteractionsThe Quarterly Journal of Economics 111:507–548.https://doi.org/10.2307/2946686
-
30
Imputed Rent of Owner-Occupied Dwellings Under the Income TaxThe Journal of Finance 15:504–530.https://doi.org/10.1111/j.1540-6261.1960.tb02766.x
-
31
The Federal Income TaxThe Concept of Income – Economic and Legal Aspects, The Federal Income Tax, Columbia University Press, New York.
-
32
Size of home, homeownership, and the mortgage interest deductionJournal of Housing Economics 21:195–210.https://doi.org/10.1016/j.jhe.2012.06.001
-
33
Does Homeownership Affect Child Outcomes?Real Estate Economics 30:635–666.https://doi.org/10.1111/1540-6229.t01-2-00053
-
34
Debt Bias and Other Distortions: Crisis-Related Issues in Tax PolicyPrepared by the IMF Fiscal Affairs Department.
-
35
The Mirrlees Review. Fiscal Studies319–329, The Mirrlees Review. Fiscal Studies, 32, 10.1111/j.1475-5890.2011.00139.x.
-
36
The comparability of IR in EU-SILC 2007 – differences in variable definitions and methods concerning institutional housing, EUROSTAT Methodologies and Working PapersLuxembourg: Publications Office of the European Union.
-
37
On the Measurement of Tax Progressivity and Redistributive Effect with Applications to Horizontal and Vertical EquityAdvances in Econometrics 3:149–168.
-
38
Fiscal policy and growth: evidence from OECD countriesJournal of Public Economics 74:171–190.https://doi.org/10.1016/S0047-2727(99)00022-5
-
39
Macroeconomics and housing: a review of the literatureJournal of Housing Economics 13:249–267.https://doi.org/10.1016/j.jhe.2004.09.002
-
40
Differences in Taxation between Owner-Occupation, Private Renting and Other Housing Tenures in the European Countries – An OverviewDifferences in Taxation between Owner-Occupation, Private Renting and Other Housing Tenures in the European Countries – An Overview.
- 41
-
42
Metropolitan area home prices and the mortgage interest deduction: Estimates and simulations from policy changeRegional Science and Urban Economics 59:12–23.https://doi.org/10.1016/j.regsciurbeco.2016.03.006
-
43
A Basic Income for Housing? Simulating a Universal Housing Transfer in the Netherlands and SwedenBasic Income Studies 2:1–25.
-
44
Taxing Immovable Property. Revenue Potential and Implementation Challenges, IMF Working Paper 13/129Taxing Immovable Property. Revenue Potential and Implementation Challenges, IMF Working Paper 13/129.
-
45
Taxation and Housing: old questions, new answersAmerican Economic Review 82:237–242.
-
46
Tax Expenditures for Owner-Occupied Housing: Deductions for Property Taxes and Mortgage Interest and the Exclusion of Imputed Rental IncomeAmerican Economic Review 98:84–89.https://doi.org/10.1257/aer.98.2.84
-
47
Owner occupied housing and the federal income tax: Estimates and simulationsJournal of Urban Economics 6:247–266.https://doi.org/10.1016/0094-1190(79)90008-1
-
48
Tax Incentives and Demand for Mortgage Debt: Evidence from the Finnish 1993 Tax ReformInternational Journal of Housing Policy 10:19–40.https://doi.org/10.1080/14616710903565688
-
49
Imputed Rental Income, Taxation and Income Distribution in FinlandUrban Studies 48:1695–1714.https://doi.org/10.1177/0042098010377474
-
50
Property Taxes and Elderly MobilityJournal of Urban Economics 67:194–205.https://doi.org/10.1016/j.jue.2009.08.004
-
51
Personal Income Taxation: the Definition of Income as a Problem of Fiscal PolicyChicago: University of Chicago Press.
-
52
The dynamic efficiency cost of not taxing housingJournal of Public Economics 59:397–417.https://doi.org/10.1016/0047-2727(95)01509-4
-
53
The Political Economy of Property Tax Reform, OECD Working Papers on Fiscal Federalism, No. 18OECD Publishing.
-
54
Implications of US Tax Policy for House Prices, Rents, and HomeownershipAmerican Economic Review 108:241–274.https://doi.org/10.1257/aer.20141751
-
55
The Mortgage Interest Deduction: Causes of Fluctuations in a Procyclical Tax ExpenditurePublic Finance Review 47:807–827.https://doi.org/10.1177/1091142119854689
-
56
EUROMOD: the European Union tax-benefit microsimulation modelInternational Journal of Microsimulation 6:4–26.https://doi.org/10.34196/ijm.00075
-
57
The distributional impact of IR in EU-SILC 2007–2010. Eurostat Methodologies and Working Papers 2013 Edition, LuxembourgThe distributional impact of IR in EU-SILC 2007–2010. Eurostat Methodologies and Working Papers 2013 Edition, Luxembourg.
-
58
Taxes, housing, and capital accumulation in a two-sector growing economyJournal of Public Economics 53:245–267.https://doi.org/10.1016/0047-2727(94)90023-X
Article and author information
Author details
Francesca Zantomio

Funding
No specific funding for this article is reported.
Acknowledgements
We are indebted to Holly Sutherland and the many people who have contributed to the development of EUROMOD. The results and their interpretation are the authors’ responsibility.
Publication history
- Version of Record published: August 31, 2022 (version 1)
Copyright
© 2022, Figari et al.
This article is distributed under the terms of the Creative Commons Attribution License, which permits unrestricted use and redistribution provided that the original author and source are credited.